 Jiandong Qiu1,2
 Shenghui Jiang3*
 Jianqiang Wang4
 Jing Feng1*Junbing Chen4
 Chao Dong4Yunshui Jiang1
 Daolai Zhang1
- 1Qingdao Institute of Marine Geology, China Geological Survey, Qingdao, China
- 2Laboratory for Marine Geology, Laoshan Laboratory for Marine Science and Technology, Qingdao, China
- 3Key Lab of Submarine Geosciences and Prospecting Techniques, MOE and College of Marine Geoscience, Ocean University of China, Qingdao, China
- 4Zhejiang Institute of Hydrogeology and Engineering Geology, Ningbo, China
Introduction: The Holocene mud deposits that extend from the Yangtze River mouth to the Taiwan Strait along the Zhejiang–Fujian coast, East China Sea (ECS), have attracted considerable research attention. However, there is a lack of consensus regarding the redistribution flux of Yangtze River sediment after it enters the sea. There are many bays along the Zhejiang and Fujian coasts, but their role in the source–sink process of Yangtze River sediment is not well-documented owing to limited data.
Methods: In this study, data from shallow seismic profiles, core samples, and surface sediment samples were analysed to assess the role of Sanmen Bay, the second largest bay in Zhejiang Province, in the source–sink process of Yangtze River sediments.
Results: The results showed that Sanmen Bay is an important sink for Yangtze River sediments. The characteristics of the clay minerals indicate that the fine-grained sediments in Sanmen Bay are mainly derived from Yangtze River sediments. The thickness of Holocene deposits in Sanmen Bay ranges from 8.2 to 32.0 m, with an average of 23.4 m and a total sediment volume of 5.06 × 10⁴ Mt, accounting for 1% of Yangtze River sediment in this time period. The Bayesian age-depth model based on borehole accelerator mass spectrometry (AMS) 14C dating shows that a high sedimentation rate occurred in the early and late Holocene but decreased significantly in the mid-Holocene, which is similar to that of the inner shelf of the East China Sea (ECS).
Conclusion: The variation in the Holocene sedimentation rate in Sanmen Bay is related to the southward transport process and mechanism of Yangtze River sediments. The results of this study provide a basis for understanding the source–sink process of sediment in large rivers.
1 Introduction
Since the Holocene, mud has accumulated on continental shelves under various environmental conditions, resulting in the formation of diverse mud depocenters (Hanebuth et al., 2015; Porz et al., 2021). Owing to their high deposition rate and the stable sedimentary environment, high-resolution environmental evolution information of the Holocene has been recorded and widely used to study climate change, source–sink processes, and sea–land interactions (Liu et al., 2020; Liu et al., 2023). Mud depocenters represent sinks of major offshore sediments on modern continental shelves. Mud deposits are not as stable and uniform as expected and require more detailed study (Gao and Collins, 2014; Porz et al., 2021).
Holocene mud deposited along the Zhejiang–Fujian coast has attracted considerable research attention. In the past decade, numerous studies have focused on its spatial distribution, sediment transport and provenance, paleoclimate reconstruction, and paleomonsoon evolution and formation mechanisms (Liu et al., 2006; 2007; Qiao et al., 2017; Dong et al., 2021). These studies made considerable contributions to understanding the mud belt.
The sediment flux of the Yangtze River into the sea is controlled by multiple factors, including precipitation in the Yangtze River Basin, the development of the Yangtze River Delta, and human activities (Feng et al., 2016; Dong et al., 2021). Sediment from the Yangtze River on the ECS shelf is characterised by a pattern of “summer storage and winter transport.” The summer monsoon contributes more than 80% of the annual precipitation (Wang et al., 2011), and sediment carried by river runoff is mainly deposited in estuaries during this period (Feng et al., 2016). The impact of the diluted water from the Yangtze River on the coasts of Zhejiang and Fujian is weak (Wu et al., 2013). From late September to April, following the summer monsoon, the winter monsoon drives coastal flow along Zhejiang and Fujian, carrying suspended material from the Yangtze River from north to south (Qin et al., 1987; Lee and Chao, 2003). Therefore, the sediment flux of the Yangtze River into the sea is unlikely to be the main factor controlling sedimentary evolution in the mud deposit area south of the Yangtze River Delta (Shi et al., 2022). Instead, coastal flow controlled by the East Asian winter monsoon is more likely to be the primary driving force for transporting nearshore sediments, and it plays a fundamental role in the formation of mud depocenters on the eastern China continental shelf (Shi et al., 2022). The strength of the winter monsoon directly determines the transport capacity of resuspended fine particles from the mouth of the Yangtze River southward (Zheng et al., 2014). The formation of the Zhejiang and Fujian coastal flows preceded the formation of the mud deposits during the mid-Holocene (Li and Zhang, 2020), indicating the existence of other decisive driving factors. In addition to coastal flow, the Taiwan Warm Current/Kuroshio branch plays a crucial role in the exchange of materials and energy in the ECS shelf (Hu et al., 2015). The intensity of the Kuroshio has changed significantly during the Holocene (Jian et al., 2020), and the combined effect of the Kuroshio branch and the Zhejiang and Fujian coastal flows is also likely to change, making it unclear what role they played in the migration of the mud depocenter. Furthermore, the redistribution flux of Yangtze River sediment after it enters the sea remains uncertain (Liu et al., 2007). The bay is an important sink for Yangtze River sediment in the nearshore area. There are many bays along the Zhejiang and Fujian coasts, including the Hangzhou, Xiangshan, Sanmen, Taizhou, and Wenzhou Bays. However, there is a lack of research on the sediment flux and capture mechanisms of nearshore bays during the transport process of Yangtze River sediment along the Zhejiang and Fujian coasts.
As the second largest bay in Zhejiang Province, Sanmen Bay has seen achievements in water quality, biology, ecology, hydrodynamics, and land reclamation (Dong and Cao, 1996; Peng, 2013); however, there are few reports on the evolution of sedimentary environments in this area. In this study, based on recent data from shallow seismic profiles, geological drilling, and surface sediment sampling in Sanmen Bay, we aimed to analyse the sedimentary stratigraphy, provenance, sediment flux, and sedimentary genesis mechanism since the beginning of the Holocene and explore the role of Sanmen Bay in the source–sink process of the Yangtze River sediment. The findings of this study reveal the sediment flux patterns of the source–sink process in Sanmen Bay and provide a basis for understanding sediment mechanisms in other large rivers.
2 Materials and methods
2.1 Geological setting
Sanmen Bay is the second largest bay in Zhejiang Province, located in the middle part of China’s ‘golden coastline’ and in the centre of the national coastline, with a sea area of 775 km2 (Editorial Board of Annals of Bays in China, 1992). It is a structural bay mainly influenced by its location in the Cathaysian fold belt of the South China fold system in the southeast of the Jiangshan-Shaoxing deep fault. Tectonic changes since the Mesozoic are mainly composed of fault deformation, and a fold structure has not developed. Mesozoic volcanic and pyroclastic rocks are widely distributed, and Middle and Upper Neozoic basalts are locally developed. Quaternary continental and coastal facies were the main deposits in the estuary and bay plains. Since the Quaternary, at least three large-scale transgressions have occurred in the study area. The transgression was the largest since the sea level reached its current level approximately 7000 years ago (Peng, 2013).
The landform around Sanmen Bay is mainly hilly, with a catchment area of 3160 km2. The Jiao River Mountain in the southwest of Sanmen Bay is the highest in elevation, with its main peak Huangxi Liang reaching 882 m above sea level. More than 30 rivers entering the bay are short mountain streams with an annual average runoff of 26.8 × 10⁸ m3. Most sediment entering the sea is coarse-grained material that accumulates in the riverbed above the mouth of the river and gradually develops into small flood- and alluvial plains. Sanmen Bay has a wide sea area; the water depth is generally 5–10 m, and the underwater geomorphology mainly includes plains, scour troughs, and tidal channels. The sediment is composed mainly of clayey silt and silty sand. Clayey silt covers most of the bay and is mainly distributed on a broad tidal flat at the top of the bay. The sediment is coarser at the top of the inlet and gradually becomes finer in the bay owing to stream injection (Editorial Board of Annals of Bays in China, 1992).
Sanmen Bay is a typical semi-closed bay with strong tides and many backstreams, an average tidal range of 4.25 m, and a maximum tidal range of 7.75 m. The tide is a regular semidiurnal tide, and the tidal current reciprocates. Generally, ebb velocity is higher than flood velocity. The maximum flood and ebb velocities are 153 and 200 cm/s, respectively (Yang and Chen, 2007).
2.2 Shallow seismic profiles
In April 2019, 310 km of high-resolution shallow seismic profiles were acquired in Sanmen Bay using a seismic profiling system (CSP-D2400; Subsea Technologies, Aberdeen, United Kingdom) (Figure 1). Seismic reflection data were collected at a pulse energy of 750 J and a frequency band of 100–5000 Hz. High-resolution seismic profiles of 1100 km in the ECS were obtained using a seismic profiling system (SBP/AAE; Great Yarmouth, United Kingdom) in 2012 and 2013. Seismic data were collected at a pulse energy of 500 J and a frequency band of 500–5000 Hz. During the cruises, navigation was accomplished using several differential GPS devices, which were accurate to within 5 m, and the ship speed was generally less than 9 km/h (five knots).
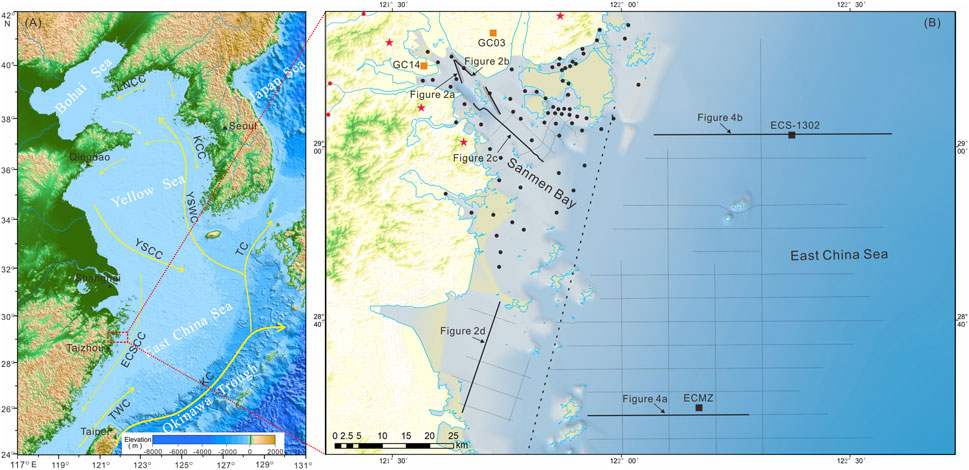
FIGURE 1. (A) Bathymetry, regional circulation pattern (in winter) and (B) locations of seismic profile (black lines), surface sediments of sea area (black circles), floodplain (red circles), mountain area (red stars), and boreholes (yellow squares) in Sanmen Bay, and boreholes on the inner shelf of East China Sea (black squares). The black dotted line separates Sanmen Bay and the inner shelf of the East China Sea. KC, Kuroshio Current; TC: Tsushima current; YSWC, Yellow Sea Warm Current; TWC, Taiwan Warm Current; YSCC, Yellow Sea Coastal Current; KCC, Korean Coastal Current; ECSCC, East China Sea Coastal Current). The base map was drawn using GMT software (Wessel and Smith, 1995), and elevation data was from http://www.ngdc.noaa.gov/mgg/global/global.html.
Interpretation of the shallow seismic profile followed the principles of sequence and seismic stratigraphy. Depositional sequences and bounding surfaces (onlap, downlap, truncation, and toplap) were identified based on the reflector characteristics of the seismic data. For all time-depth conversions, an acoustic velocity of 1600 m/s was used for sedimentary successions.
2.3 Core data
Cores GC03 and GC14 were recovered from the tidal flat of Sanmen Bay using rotary drilling from May to June 2019 (Table 1). The study area was covered by ZJCORS. ZJCORS is the Zhejiang Continuous Operation Satellite Positioning Integrated Service System. Its goal is to establish a global navigation satellite system with high accuracy, high temporal and spatial resolution, high efficiency, and high coverage. This system provides convenient, fast, and accurate positioning of drilling locations and elevations. Core positioning and elevation measurements were carried out using a Zhonghaida C30 GPS with a positioning accuracy greater than 10 cm and an elevation measurement accuracy greater than 5 cm. Two cores were drilled consecutively into medium-weathered bedrock. Core GC03 was collected from Shepan Island at an elevation of 3 m, with a length of 80 m and an average recovery of 89%. Core GC14 was collected from Changjie Town at an elevation of 1.88 m, with a length of 105.5 m and an average recovery of 93.1%.
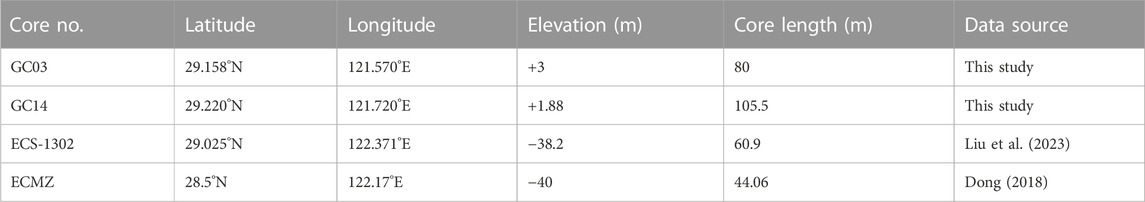
TABLE 1. Details of the sediment cores described in this study.
In the laboratory, the cores were split lengthwise, visually described, photographed, and subsampled. Gastropods and unbroken shells, including oyster shells, were selected and sent to Beta Analytic (Miami, FL, United States of America) and the Testing Centre of the Laoshan Laboratory (Qingdao, China) for accelerator mass spectrometry (AMS) 14C dating (Table 2). Radiocarbon ages were corrected for fractionation by δ13C values measured simultaneously and for the regional marine reservoir effect (△R = −66 ± 30 a), which was calculated according to the reservoir ages of mollusc shells from six samples from the northern coast of Taiwan Island (Yoneda et al., 2007). Calendar ages were calculated with the Calib rev. 8.1.2 program using the Marine20 curve (Stuiver et al., 2020) and are reported as calendar 14C ages before 1950 CE with one standard deviation (1σ) uncertainty.
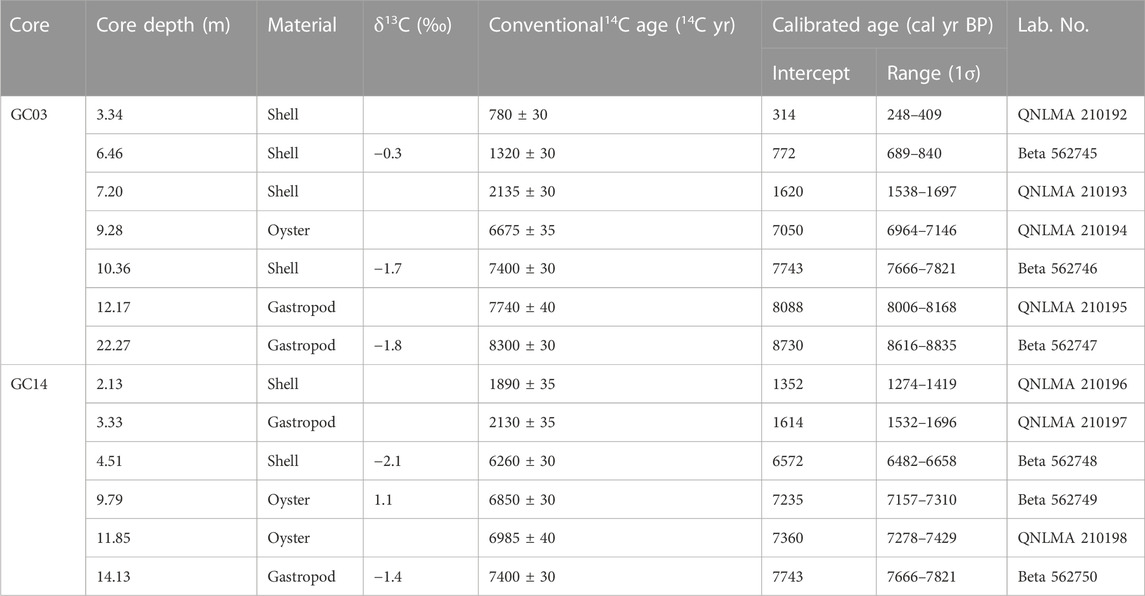
TABLE 2. Accelerator mass spectrometry (AMS)14C ages for cores GC03 and GC14.
A total of nine samples from cores GC03 and GC14 were collected for optically stimulated luminescence (OSL) dating of quartz using a Daybreak 2200 thermoluminescence (TL)/OSL reader (Daybreak Nuclear and Medical Systems, Guilford, CT, United States of America) at the Testing Centre of the Qingdao Institute of Marine Geology (Table 3). To determine the equivalent dose (De), the medium-grainde (38–63 μm size) qutartz fraction was separated from all the samples (Lai and Brückner, 2008). The De was determind using the single aliquot regenerative (SAR) standardized growth curve (SGC) method (Roberts and Duller, 2004) with an automated Risø TL/OSL-DA-20 reader. All samples showed high OSL sensitivity and stable OSL signals. The concentrations of K, U, and Th were measured using inductively coupled plasma mass spectrometry (ICP-MS) and converted into dose rates based on data from Aitken (1998) and Marsh et al. (2002).
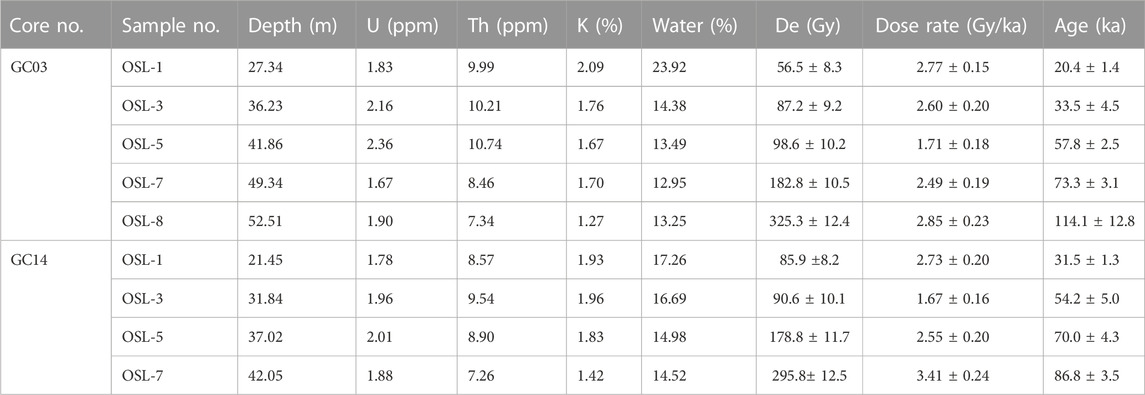
TABLE 3. Optically stimulated luminescence (OSL) dating results for cores GC03 and GC14.
Subsamples in core GC03 were taken at 20-cm intervals for grain-size analysis and measured using a Malvern Mastersizer 2000 laser particle size analyser (Malvern Panalytical, Malvern, United Kingdom) at the Center of Testing, Qingdao Institute of Marine Geology, China. The upper 23-m sediments of core GC03 were taken at 180- to 200-cm intervals for clay minerals (Table 4) at the Center of Testing, Qingdao Institute of Marine Geology, using a D/Max-2500 X-ray diffractometer, see detail in Guang et al. (2022).
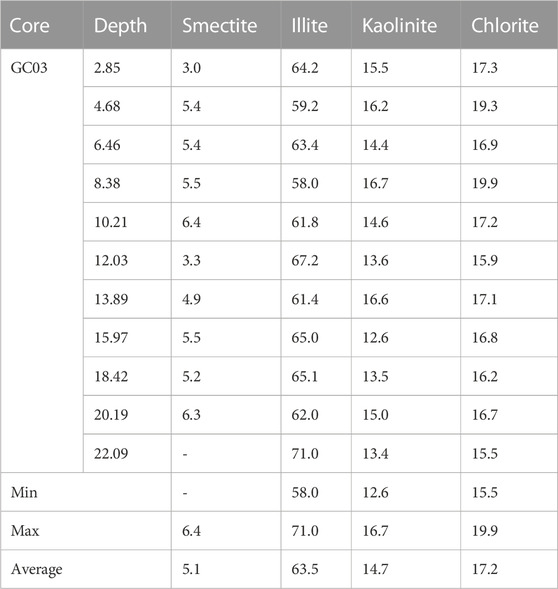
TABLE 4. Assemblages and percentage of clay minerals in Holocene sediments of core GC03 (unit:%).
We referenced two well-studied cores from the ECS, ECS-1302 and ECMZ, for comparison (Dong, 2018; Liu et al., 2023).
2.4 Surface sediments
A total of 78 surface sediment samples were acquired from Sanmen Bay in September 2019, including 71 from sea areas, 3 from floodplains, and 4 from mountainous areas (Figure 1). Surface sediments (0–5 cm) were used for analyses of grain size and clay mineral content, which were conducted at the Testing Centre of the Qingdao Institute of Marine Geology using a Mastersizer-2000 laser particle analyser (Malvern Panalytical) and a D/Max-2500 X-ray diffractometer (Rigaku), respectively (Guang et al., 2022).
3 Results
3.1 Seismic stratigraphy (transgressive surface and holocene deposits) shallow seismic structure
Based on the identification of the shallow seismic profile interface, characteristics of the seismic reflection wave groups, and internal reflection structure, three reflection interfaces were recognised, denoted T0, R, and T1, in descending order (Figures 2, 4). Compared with previous geological and geophysical records from the Yangtze River deposits (Liu et al., 2006; Liu et al., 2007) and other similar deltaic deposits of the Yellow (Liu et al., 2004; Liu et al., 2007) and Po rivers (Cattaneo et al., 2003), the prominent acoustic reflector, T1, appears to be the base of the post-glacial transgressive surface, which apparently formed due to rapid landward transgression during rapid sea-level rise (Liu et al., 2004). Meanwhile, R is the internal interface, and T0 is the seafloor.
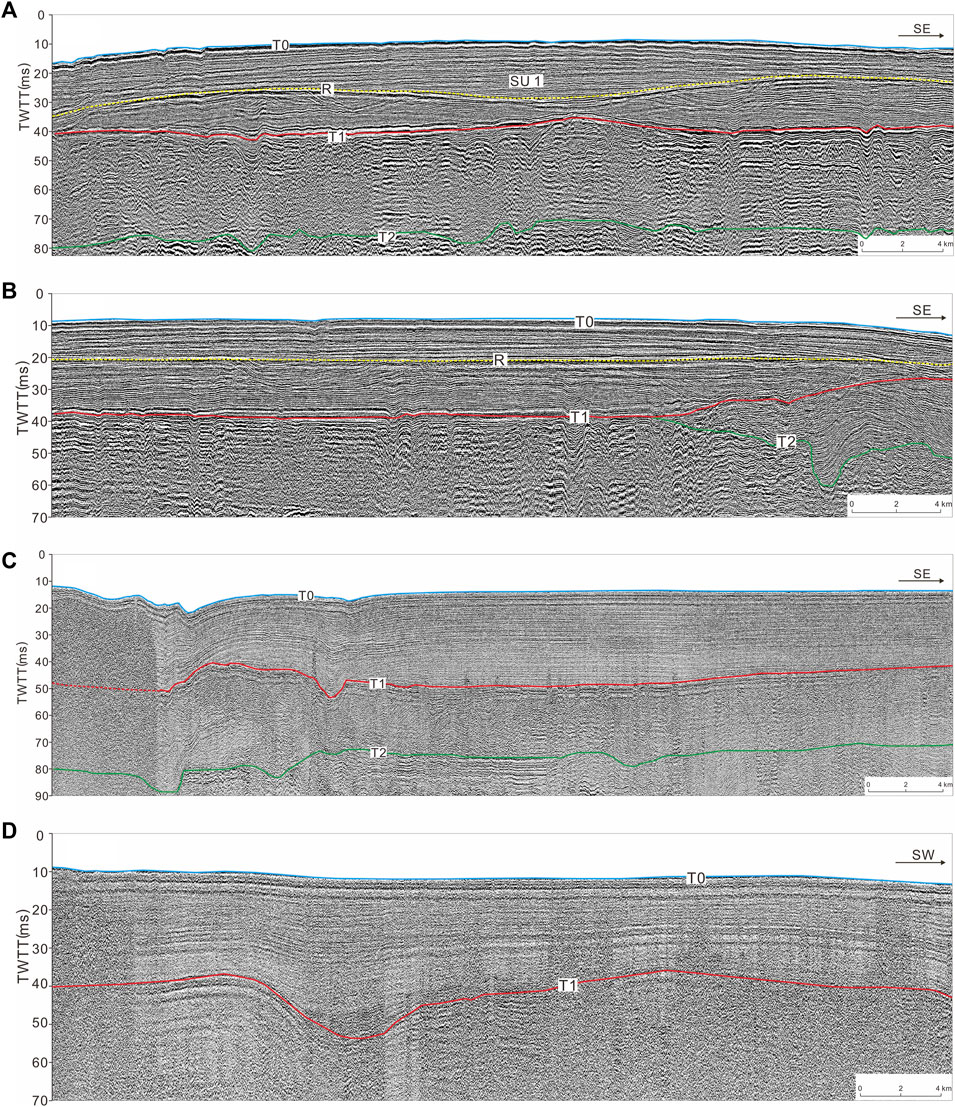
FIGURE 2. Part of the typical seismic profiles at the top (A,B) and mouth (C,D) of Sanmen Bay. R is an internal unconformity surface, which can be clearly recognised. Note: Figure 1 shows the location of the profile. TWTT, two-way travel time.
Based on the internal reflection patterns, the deposits in the study area were divided into two parts: Sanmen Bay and the inner shelf of the ECS. In Sanmen Bay, the seismic unit above T1 is a set of reflection layers with a high frequency and amplitude. At the top of Sanmen Bay, an internal unconformity surface, R, can be identified with strong amplitude, medium and strong reflections, and good continuity; however, it cannot be traced continuously throughout the area and is difficult to correlate with the various seismic profiles. Locally, the strata exhibit a concave or divergent filling reflection structure below the R surface (Figures 2A, B). Reflector R was not easily identified at the entrance to Sanmen Bay (Figures 2C, D). The lack of a well-studied core penetrating these seismic profiles makes it difficult to determine the formation time of interface R or whether R is the Holocene maximum flooding surface (MFS). The thickness of the seismic unit between T1 and T0 ranges from 8.2 to 32.0 m, with an average of 23.4 m (Figure 3). In Sanmen Bay, there are two deposition areas with thicknesses of more than 28 m in the north and south. The unit below T1 mainly shows chaotic reflection (Figure 2) and parallel-to-subparallel or undulating reflection, which was not the focus of the present study.
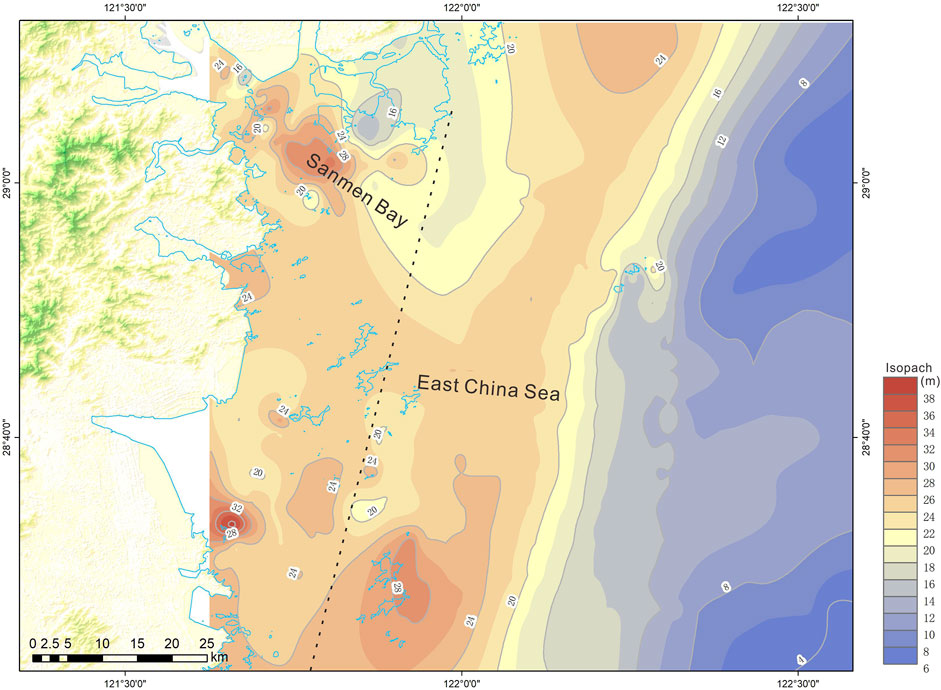
FIGURE 3. Isopach of the seismic unit between T0 and T1 (unit: m), divided into two parts (Sanmen Bay and the inner shelf of East China Sea).
On the inner shelf of the ECS, the seismic unit above T1 mainly shows predominant sigmoidal clinoform deposits (Figure 4), which have been well-studied in previous research (Liu et al., 2006; Liu et al., 2007; Xu et al., 2012). In this area, the clinoform thins offshore to the east, reaching a depocentre of more than 28 m to the south (Figure 4A). Close inspection of many clinoform profiles reveals a rather complex inner structure. In the south, an angular unconformity surface, R, separates the upper flatter and opaque layers from the lower relatively dipping and transparent layers (Liu et al., 2007; Xu et al., 2012). The AMS 14C dates in the ECMZ core indicated that R was formed at 2 ka (Dong, 2018). In the north, the 2 ka angular unconformity surface is not easily recognised (Figure 4B), but another internal reflector, R, which represents the Holocene MFS, can be identified according to the AMS 14C dates of ECS-1302 (Liu et al., 2023), with the upper strata downlapping onto the MFS.
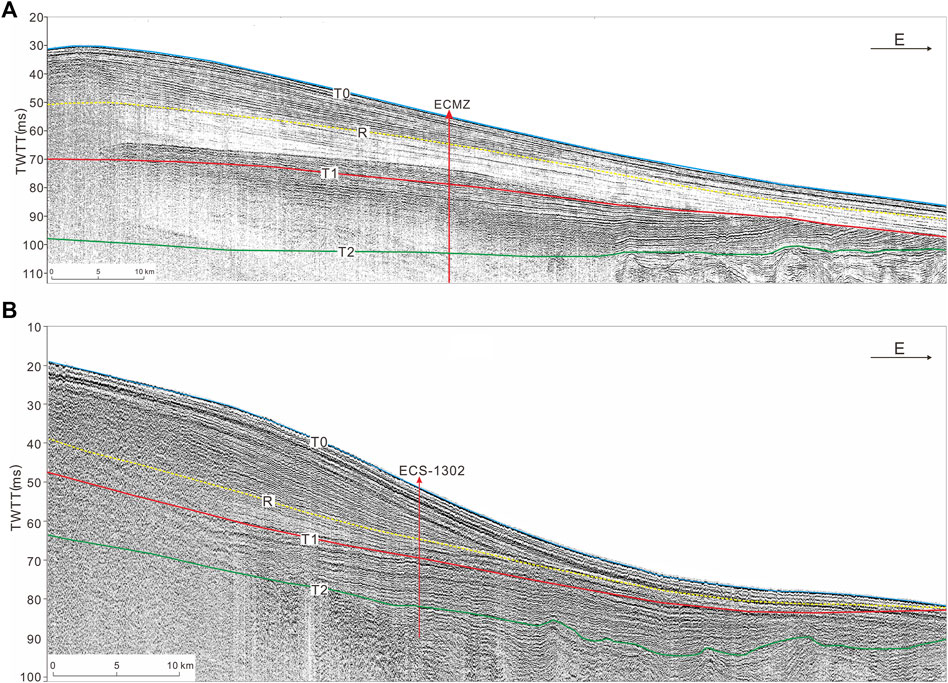
FIGURE 4. Part of the W–E seismic profiles passing through cores ECMZ (A) and ECS-1302 (B). The internal angular unconformity surface R in core ECMZ (A) was formed at 2 ka (Dong, 2018). The internal unconformity surface R in core ECS-1302 (B) represents the maximum flooding surface (Liu et al., 2023). Note: Figure 1 shows the location of the profile. TWTT, two-way travel time.
3.2 Lithofacies associations and dating of cores
Based on the lithological facies, sediment colour, AMS 14C, and OSL dating data, and the focus of the current study (Figure 5), cores GC03 and GC14 are mainly divided into Holocene deposits and pre-Holocene deposits (Figure 6), of which Holocene deposits are the focus of this study.
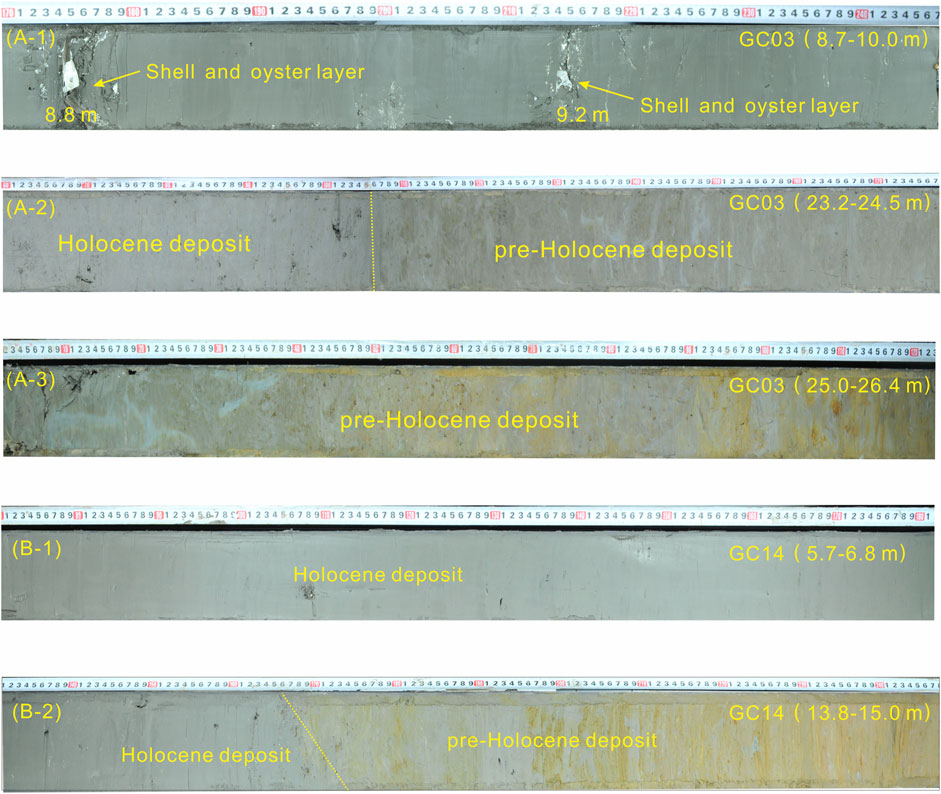
FIGURE 5. Core sediment in GC03 (A) and GC14 (B); 8.8 and 9.2 m in core GC03 are shell and oyster layers, respectively. The yellow dotted line separates the Holocene and pre-Holocene deposits.
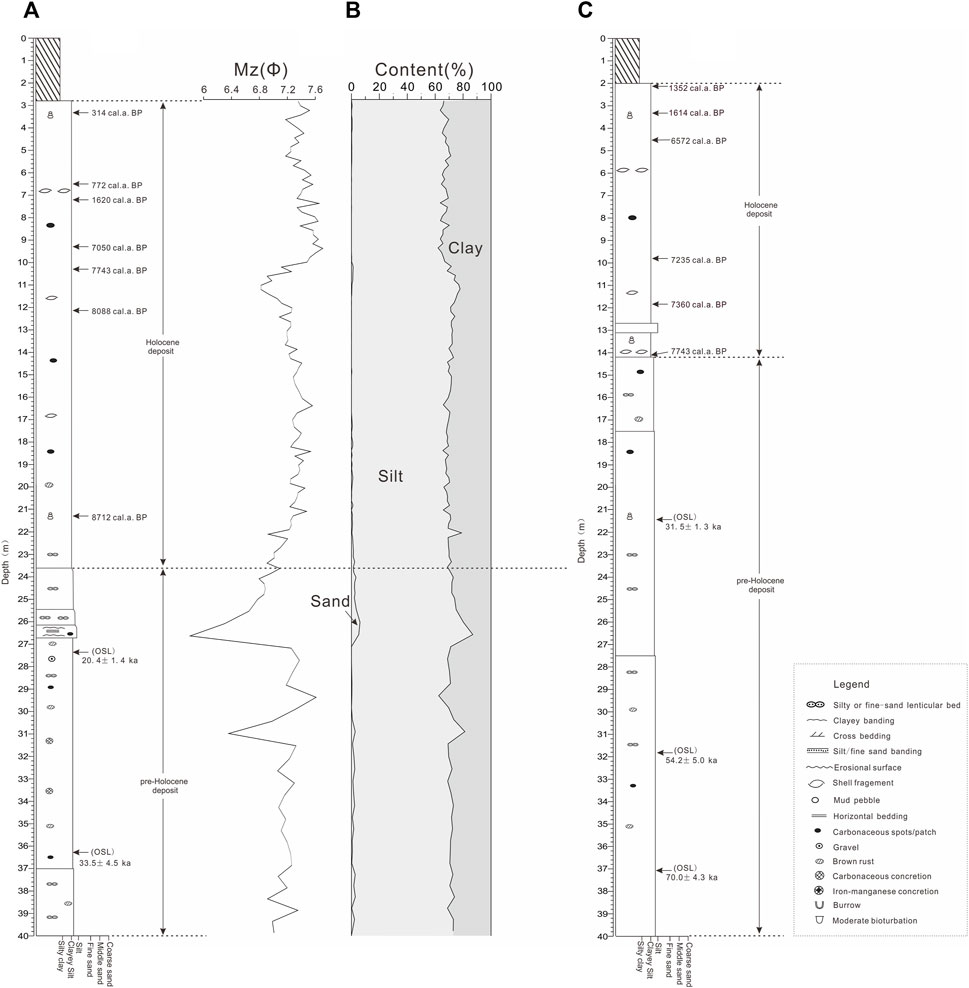
FIGURE 6. Geological column of cores GC03 (A) and GC14 (C) with accelerator mass spectrometry (AMS) 14C and optically stimulated luminescence (OSL) dates and distribution of mean grain size (Mz) and sediment contents of core GC 03 (B).
In core GC03, 0–2.8-m deposits were backfill soil. The 2.8–23.6-m deposits were mainly composed of deep grey clayey silt with uniform lithology and occasionally black carbonaceous spots, and they contained a large number of shell fragments and complete snail and oyster shells, especially in the 8.7–10.0-m depositional section of the core. The deposits between 8.8 and 9.2 m in core GC03 were shell and oyster layers (Figure 5A). There were seven AMS 14C dating datasets with good sedimentary sequences, which were between 314 and 8712 cal a BP. Combined with the sedimentary facies and in comparison with the well-studied cores in the ECS, this section is recognised as a Holocene deposit. This section is separated from the underlying section by an erosional surface (Figure 5B). The underlying section (23.6–80 m) is mainly characterised by clayey silt, with the upper section being a deep yellow-grey and cyan-green hard clay layer, and the area 3–6 m below 49 m being composed of four coarse sand and gravel layers (Figure 6A). The OSL dating data in this section ranged from 20.4 ± 1.4 ka to 114.1 ± 12.8 ka, indicating that this section represents a pre-Holocene deposit.
In core GC14, the 0–2.0-m deposits were backfill soil. The 2.0–14.2-m deposits were deep grey clayey silt with uniform lithology, occasional black carbonaceous spots, many shell fragments, and relatively complete snails. There were six AMS 14C dating datasets with good sedimentary sequences, which were between 1352 and 7743 cal a BP. Combined with the sedimentary facies and in comparison with the well-studied cores in the ECS, this section is recognised as a Holocene deposit. This section is separated from the underlying section by an erosional surface (Figure 5B). The underlying section (14.2–105.5 m) is mainly characterised by clayey silt, with the upper section being a deep yellow-grey and cyan-green hard clay layer, and the area 2–5 m below 60 m being composed of three coarse sand and gravel layers (Figure 6B). The OSL dating data in this section ranged from 31.5 ± 1.3 ka to 86.8 ± 3.5 ka, indicating that this section is a pre-Holocene deposit.
3.3 Holocene sedimentation rate in sanmen Bay
Accurate dating of sediments forms the fundamental basis of sedimentology in coastal settings. Dating sediments in coastal areas remain challenging due to the extremely complex sediment transport and deposition processes in fluvial-marine transition zones. A general stratigraphic framework of cores GC03 and GC14 was identified based on sedimentary structures and facies, grain size, and comparison with other well-studied cores from adjacent areas (Figure 6). Thirteen AMS 14C datings are shown in Table 2, ranging from 314 to 8712 cal a BP in core GC03 and 1352–7743 cal a BP in core GC14, which were in good stratigraphic order and did not appear age-reversed. Nine OSL datings are shown in Table 3, ranging from 20.4 ± 1.4 ka to 114.1 ± 12.8 ka in core GC03 and 31.5 ± 1.3 ka to 86.8 ± 3.5 ka in core GC14, which were also in good sedimentary succession. The AMS 14C dating and OSL dating in Sanmen Bay exhibited good stratigraphic order and did not occur age-reversed, which may be due to the relatively stable sedimentary environment in the bay.
The P sequence age-depth modelling (Bronk Ramsey, 2008; Bronk Ramsey, 2009) for Holocene sediments of cores GC03 and GC14 was performed using OxCal 4.4 (https://c14.arch.ox.ac.uk/), which uses a Bayesian approach in which sediment deposition is modelled as a Poisson process. Parameter (k) determines the extent to which the sedimentation rates (SR) are allowed to vary. For all the P-sequence models in this study, a uniformly distributed prior was used for k, such that k0 = 1 and log10 (k = K0) ∼ U (−2, 2). This age-depth method using Bayesian modelling has been widely applied to continental shelf marine sediment chronology. We chose this method because it can provide a more reliable chronology with wider applicability and offers the advantage of sensing small variations in the accumulation rate (Zhang et al., 2022; Yuan et al., 2023).
According to the age-depth relationship results (Figure 7), the SR of the Holocene can be divided into three phases: high SR in the early Holocene, up to 0.60–1.41 cm/yr in core GC03 and 0.62–1.20 cm/yr in core GC14, and high SR in the late Holocene, up to 0.66 and 0.45 cm/yr in the two cores, respectively. Low SR occurred during the mid-Holocene, approximately 0.04 and 0.03 cm/yr in cores GC03 and GC14, respectively. Although both cores showed the same trend of sedimentary rate, the SRs of core GC03 were higher than those of core GC14.
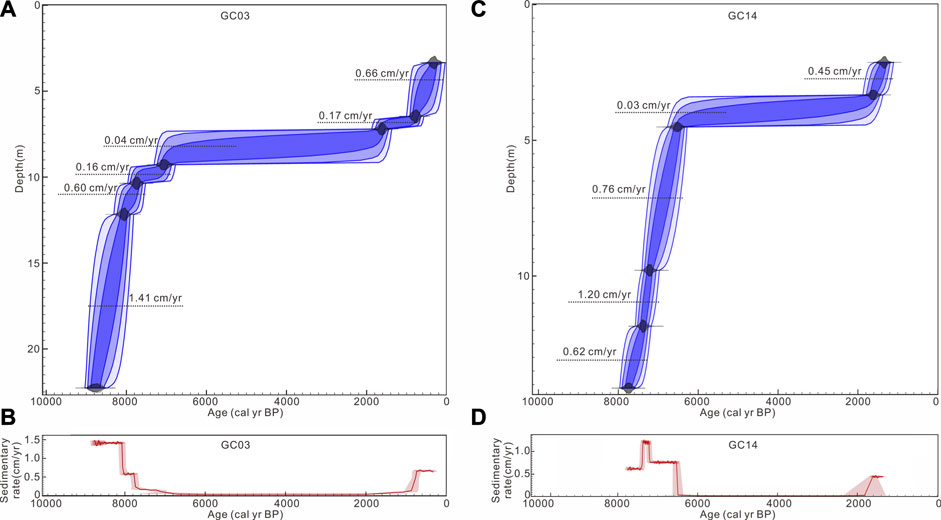
FIGURE 7. Bayesian age-depth model of cores GC03 (A) and GC14 (C) and the sedimentation rate for the two cores (B,D) of the Holocene sediment.
4 Discussion
4.1 Sediment source analysis
The grain size of surface sediments in Sanmen Bay ranges from 5.6 to 7.6 Φ, with an average of 6.87 Φ (Guang et al., 2022), becoming gradually finer moving from the bay mouth to the bay top. The mean grain size of Holocene sediments in core GC03 ranges from 6.82 to 7.71 Φ, with an average of 7.30 Φ, indicating that the Holocene sediments in core GC03 were mainly composed of clayey silt and the lithology is relatively uniform.
The clay minerals in the Holocene sediments of core GC03 were mainly illite, ranging from 58% to 71%, with an average concentration of 63.5%, followed by chlorite, kaolinite, and smectite, with average concentrations of 17.2, 14.7, and 5.1%, respectively (Table 4). The clay mineral assemblage was illite-chlorite-kaolinite-smectite, which is consistent with that of Yangtze River sediments.
The clay minerals in the surface sediments of the Sanmen Bay sea area were mainly illite, with an average concentration of 61.66%, followed by chlorite, kaolinite, and smectite, with average concentrations of 19.15, 15.34, and 3.85%, respectively (Table 5). The clay mineral assemblage was illite-chlorite-kaolinite-smectite, which is consistent with that of the Yangtze River sediments. For comparison, the average concentration of illite in the surface sediments of the floodplain was 41.26%, which is much lower than that in the Sanmen Bay sea area. The average kaolinite, chlorite, and smectite concentrations in the floodplain were 32.16, 25.36, and 1.22%, respectively (Table 5). Therefore, the clay mineral assemblage in the floodplain is illite-kaolinite-chlorite-smectite. In contrast, the clay minerals in the soil samples from the mountainous areas were mainly kaolinite and chlorite, with average concentrations of 38.46% and 30.82%, respectively. The average concentrations of illite and smectite were 29.57% and 1.15%, respectively (Table 5). Thus, the clay mineral assemblage in the mountainous area was kaolinite-chlorite-illite-smectite.
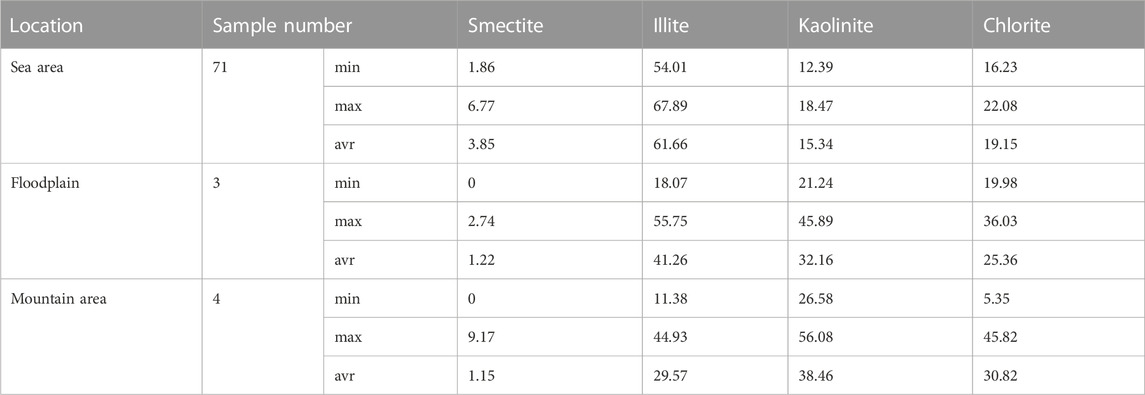
TABLE 5. Assemblages and percentage of clay minerals in Sanmen Bay surface sediments (unit: %) (Guang et al., 2022).
A ternary diagram of smectite, chlorite + kaolinite, and illite concentrations shows that the concentrations of the samples collected from the Holocene sediments of core GC03 and the sea area of Sanmen Bay are quite similar to the clay concentrations derived from the Yangtze River estuary deposits but are very different from the floodplain and mountain area sediments (Figure 8). Clay minerals in the Holocene sediments of core GC03 overlap with the Yangtze River estuary deposits (Liang et al., 2015), therefore, it can be inferred that the Yangtze River sediments have significant contributions to the Sanmen Bay. The poor overlap between the sediments of core GC03 and the Yangtze River drainage sediments (Yang, 1988; He et al., 2011) may be due to the complex rock types and climate conditions of a large area of Yangtze River drainage system. The clay mineral in the upper stream of Yangtze river contains higher contents of illite and chlorite, while the mid- and lower streams constitute more smectite and kaolinite (Chen, 2008; He et al., 2011). In addition, grain size may also had a influence. For clay mineral analyses, less than 2 μm clay components were selected for Yangtze River sediments, while the bulk samples were measured for core GC03 sediments.The clay minerals in the surface sediments of Sanmen Bay varied by region. At the top of the bay, the concentrations of kaolinite and chlorite were high, similar to the characteristics of the clay mineral assemblage in the floodplain sediments of the inlet river, indicating that the coarse sediments of the estuary were affected by the input of the local river (Guang et al., 2022). In the Sanmen Bay sea area, the concentration of illite was higher than those of kaolinite and chlorite. The clay mineral assemblage characteristics were similar to those of the Yangtze River, indicating that the fine sediments from the Sanmen Bay sea area were mainly derived from the Yangtze River. Therefore, Sanmen Bay is a sink for Yangtze River sediment.
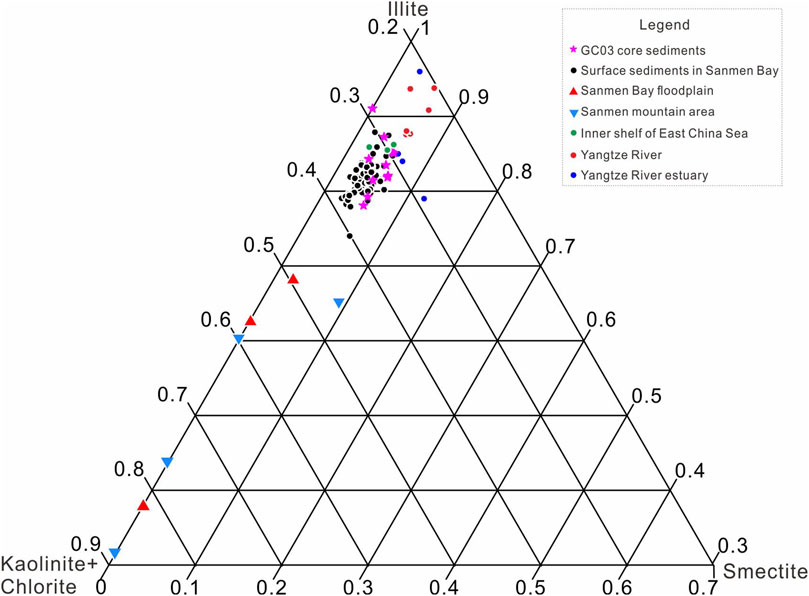
FIGURE 8. Ternary diagram of clay mineralogy of Sanmen Bay core sediments (pink stars), surface sediments (black circles), Sanmen Bay floodplain (red triangles), soil samples from the Sanmen mountain area (blue triangles) (Guang et al., 2022), inner shelf of East China Sea (blue circles) (Chen, 2008), Yangtze River estuary (green circles) (Liang et al., 2015), and Yangtze River (red circles) (Yang, 1988; He et al., 2011).
4.2 Sediment budget and origin of holocene sediment in Sanmen Bay
Based on the thickness of the Holocene sediment (Figure 3), the sediment volume in Sanmen Bay was calculated using the volume function of ArcMap 10.6, and it was found to be approximately 42.2 km3 or 5.06 × 10⁴ Mt, given an average sediment density of 1.2 t/m3 (Xu et al., 2012). The rivers that empty into Sanmen Bay are short mountain streams with coarse sediments, which are mainly deposited in the riverbed above the estuary and gradually develop into flood- and alluvial plains. The annual average runoff of these rivers into Sanmen Bay is approximately 2.68 × 10⁸ m3 (85 m3/s), which is equivalent to only one-fourteenth of the total runoff of the Qiangtang River into the sea; therefore, it has little impact on the water exchange in Sanmen Bay (Yang and Chen, 2007). Sediments derived from local streams were considered negligible (Editorial Board of Annals of Bays in China, 1992). The clay mineral assemblage also indicates that the fine sediment in Sanmen Bay was mainly derived from the Yangtze River. Over the past million years, the Yangtze River has transferred 480 Mt/yr of sediment to the ECS (Xu et al., 2012), and during the Holocene, it discharged 480 × 104 Mt. Therefore, Sanmen Bay captured approximately 1% of Yangtze River sediments during the Holocene.
The tidal current plays an important role in transporting Yangtze River sediment into Sanmen Bay. Influenced by topography, the tidal current from the outer sea reciprocates after entering the bay. The duration of the flood and ebb tides are not equal, with the duration of the flood tide being greater than that of the ebb tide and the velocity of the ebb tide being greater than that of the flood tide (Yang and Chen, 2007). Northeast of Sanmen Bay, Yangtze River sediments are transported from north to south under the influence of the ECS Coastal Current. Near the mouth of the bay, sediments are transported from the outer sea to the bay under the influence of flood tides. The bay exhibits a wide tidal range and a high flood velocity, with maximums of up to 7.75 m and 153 cm/s (Editorial Board of Annals of Bays in China, 1992), respectively. The sediment carried in the seawater can enter the flood tide everywhere in the bay. When the tide reaches its highest or lowest point, the tide velocity reaches a minimum, resulting in a decrease in the capacity to carry sediment, and the sediment in the seawater can be deposited. Under the influence of ebb tidal currents, the sediment at the top of the bay is transported to the mouth of the bay, resulting in thicker Holocene sediments in the middle of Sanmen Bay (Figure 3). The formation of two depositional areas with a thickness of more than 28 m in the north and south of Sanmen Bay may also be related to the original topography (Figure 9), where the depth of T1 was more than 40 m below the present sea level, which is clearly deeper than the surrounding area.
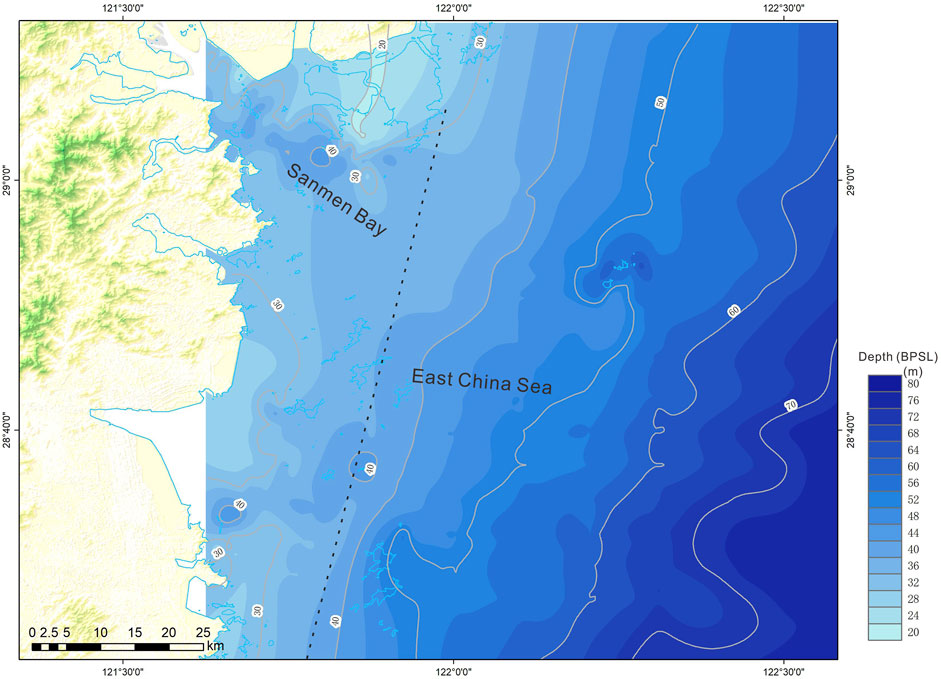
FIGURE 9. Depth distribution of seismic reflector, T1, below present sea level (BPSL) (unit: m).
The origin of Holocene sediment in Sanmen Bay and variation in the SR of cores GC03 and GC14 mainly depended on the southward transport of Yangtze River sediments Figure 10. Sea level changes and ocean currents strongly influence deposition (Yang et al., 2014; Gao et al., 2015). At approximately 8–7 ka, the sea level reached the present height (Xu et al., 2009; Zheng et al., 2015), and the modern current system in ECS was formed (Zheng et al., 2015). In addition, the ECS Coastal Current began to flow southward, transporting Yangtze River-derived sediment to the Zhejiang-Fujian coast. Since then, the inner shelf of the ECS and Sanmen Bay have been formed in a relatively stable environment (Li et al., 2014). Coastal flow controlled by the East Asian winter monsoon is undoubtedly the primary driving force for the transport of nearshore sediments and plays a fundamental role in the formation of mud depocenters on the continental shelf of eastern China (Shi et al., 2022). The strength of the winter monsoon directly determines the transport capacity of fine particles resuspended from the mouth of the Yangtze River southward (Zheng et al., 2014). In the early Holocene, the East Asian winter monsoon and the transport capacity of the Zhejiang and Fujian coastal currents were strong, resulting in a large amount of Yangtze River sediment being transported to the nearshore area of Sanmen Bay and deposited in the bay by reciprocating flow at a high sedimentation rate. In the middle Holocene, the winter monsoon weakened, and the water column in the nearshore area of Sanmen Bay became stratified owing to the influence of the Taiwan Warm Current and the Kuroshio branch. Large amounts of sediment were trapped in the paleo-incised valley to fill the accommodation space (Song et al., 2013), resulting in a low sedimentation rate. After approximately 2 ka, the sediment from the Yangtze River mouth began to overflow (Song et al., 2013), and with the influence of human activities and the strengthening of the East Asian winter monsoon, the transport capacity of the Zhejiang and Fujian coastal currents increased, increasing the amount of sediment transported southward. A large amount of Yangtze River sediment was transported outside Sanmen Bay and deposited in the bay by reciprocating flow, resulting in an increase in the sedimentation rate.
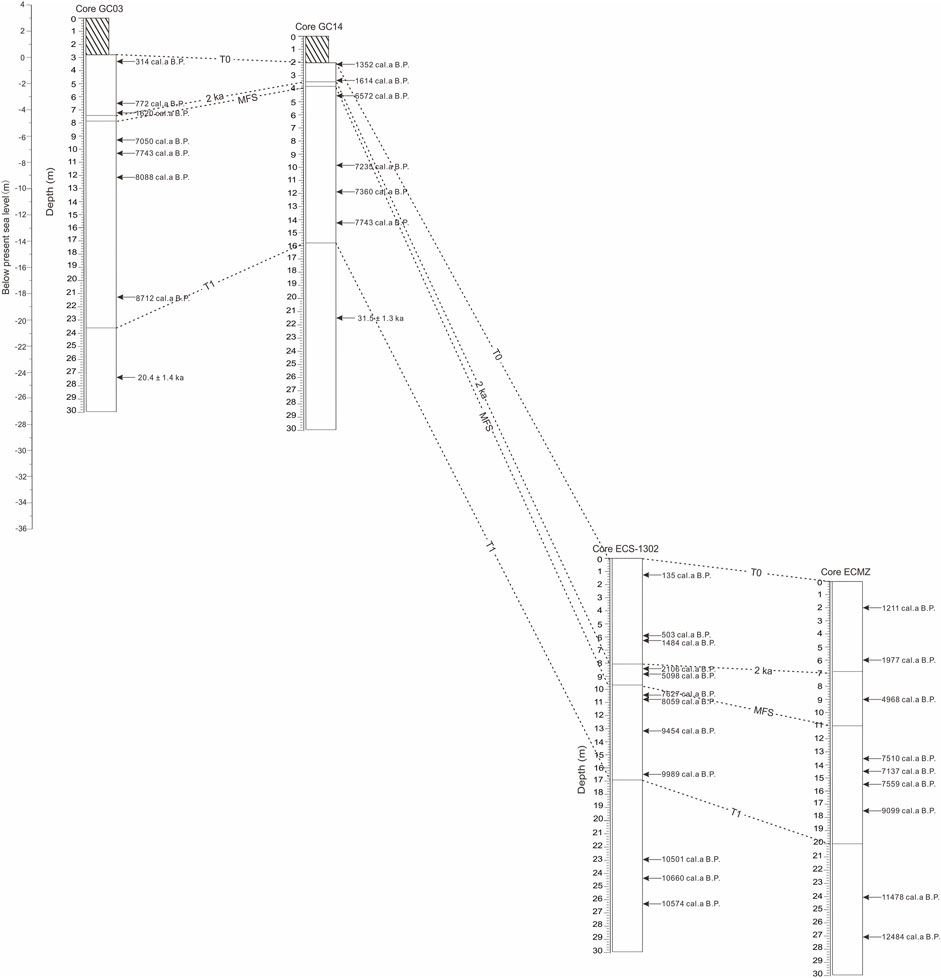
FIGURE 10. Stratigraphic correlations among boreholes in the study area. MFS: maximum flooding surface; ECS-1302 data from Liu et al., 2023; ECMZ data from (Dong, 2018).
5 Conclusion
Based on recent data from shallow seismic profiles, geological drilling, and surface sediment sampling in Sanmen Bay, we analysed the sedimentary stratigraphy, provenance, sediment flux, and sedimentary genesis mechanism during the Holocene and explored the role of Sanmen Bay in the source–sink process of Yangtze River sediment. The characteristics of the clay minerals indicate that the fine-grained sediments in Sanmen Bay are mainly derived from Yangtze River sediments. Sanmen Bay is an important sink for Yangtze River sediments, with the thickness of Holocene deposits ranging from 8.2 to 32.0 m, with an average of 23.4 m. The total sediment volume was 5.06 × 10⁴ Mt, accounting for 1% of Yangtze River sediment during the Holocene. The Bayesian age-depth model based on borehole AMS 14C dating shows that a high sedimentary rate occurred in the early and late Holocene but decreased significantly in the mid-Holocene, which is similar to the pattern on the inner shelf of the ECS. The variation in the Holocene sedimentation rate in Sanmen Bay is related to the southward transport process and mechanism of the Yangtze River sediments.
Data availability statement
The original contributions presented in the study are included in the article/Supplementary material, further inquiries can be directed to the corresponding authors.
Author contributions
JQ: Conceptualization, Investigation, Writing–original draft, Writing–review and editing, Methodology. SJ: Writing–original draft, Supervision, Writing–review and editing, Conceptualization, Methodology. JW: Investigation, Methodology, Writing–original draft. JF: Supervision, Writing–review and editing, Writing–original draft, Conceptualization, Methodology. JC: Investigation, Resources, Writing–original draft. CD: Writing–review and editing, Data curation, Formal Analysis. YJ: Writing–review and editing, Data curation, Formal Analysis. DZ: Data curation, Formal Analysis, Writing–review and editing.
Funding
The author(s) declare financial support was received for the research, authorship, and/or publication of this article. This study was funded by the China Geological Survey (Grant No. DD20230071, DD20230409 and DD20190276), Shandong Provincial Natural Science Foundation (No. ZR2020MD069 and ZR2021MD049), National Key Research and Development Program of China (No. 2021YFF0704000), and Science and Technology Innovation Project of Laoshan Laboratory (No. LSKJ202204400).
Acknowledgments
We are grateful to Drs. Su Guohui and Wang Zhao for their financial supports for sample testing and paper publication.
Conflict of interest
The authors declare that the research was conducted in the absence of any commercial or financial relationships that could be construed as a potential conflict of interest.
Publisher’s note
All claims expressed in this article are solely those of the authors and do not necessarily represent those of their affiliated organizations, or those of the publisher, the editors and the reviewers. Any product that may be evaluated in this article, or claim that may be made by its manufacturer, is not guaranteed or endorsed by the publisher.
References
Aitken, M. J. (1998). An introduction to optical dating: the dating of quaternary sediments by the use of photon-stimulated luminescence. Oxford: Oxford University Press.
Bronk Ramsey, C. (2008). Deposition models for chronological records. Quat. Sci. Rev. 27 (1–2), 42–60. doi:10.1016/j.quascirev.2007.01.019
Bronk Ramsey, C. (2009). Bayesian analysis of radiocarbon dates. Radiocarbon 51 (1), 337–360. doi:10.1017/s0033822200033865
Cattaneo, A., Correggiari, A., Langone, L., and Trincardi, F. (2003). The late-Holocene Gargano subaqueous delta, Adriatic shelf: sediment pathways and supply fluctuations. Mar. Geol. 193 (1–2), 61–91. doi:10.1016/s0025-3227(02)00614-x
Dong, J. (2018). “Sediment provenance and environment records on the inner shelf of the East China Sea since the last glaciation maximum,”. Doctor Dissertation (Qingdao: Qingdao University).
Dong, J., Li, A., Lu, Z., Liu, X., Wan, S., Yan, H., et al. (2021). Millennial-scale interaction between the East asian winter monsoon and el nino-related tropical pacific precipitation in the Holocene. Palaeogeogr. Palaeoclimatol. Palaeoecol. 573, 110442. doi:10.1016/j.palaeo.2021.110442
Dong, Y., and Cao, P. (1996). Sedimentary characteristics of the muddy bays in the Zhejiang and Fujian provinces. J. East China Norm. Univ. 2, 77–83.
Editorial Board of Annals of Bays in China (1992). Annals of bays in China (series 5). Beijing: China Ocean Press, 234–279.
Feng, Z., Liu, B., Zhao, Y., Li, X., Jiang, L., and Si, S. (2016). Spatial and temporal variations and controlling factors of sediment accumulation in the Yangtze River estuary and its adjacent sea area in the Holocene, especially in the Early Holocene. Cont. Shelf Res. 125, 1–17. doi:10.1016/j.csr.2016.06.007
Gao, S., and Collins, M. (2014). Holocene sedimentary systems on continental shelves. Mar. Geol. 352, 268–294. doi:10.1016/j.margeo.2014.03.021
Gao, S., Wang, D., Yang, Y., Zhou, L., Zhao, Y., Gao, W., et al. (2015). Holocene sedimentary systems on a broad continental shelf with abundant river input: process–product relationships. Geol. Soc. Spec. Publ. 429, 223–259. doi:10.1144/sp429.4
Guang, X., Tian, Y., Yin, P., Yang, S., Chu, Z., Cao, K., et al. (2022). Clay mineral assemblages and provenance in the surface sediment of the Sanmen Bay. Mar. Geol. Front. 38 (12), 40–46. doi:10.16028/j.1009-2722.2022.175
Hanebuth, T., Lantzsch, H., and Nizou, J. (2015). Mud depocenters on continental shelves-appearance, initiation times, and growth dynamics. Geo-Mar. Lett. 35, 487–503. doi:10.1007/s00367-015-0422-6
He, M., Zheng, H., Huang, X., Jia, J., and Li, L. (2011). Clay mineral assemblages in the Yangtze drainage and provenance implications. Acta Sediment. Sin. 29 (3), 544–551. doi:10.14027/j.cnki.cjxb.2011.03.006
Hu, D., Wu, L., Cai, W., Gupta, A., Ganachaud, A., Qiu, B., et al. (2015). Pacific western boundary currents and their roles in climate. Nature 522, 299–308. doi:10.1038/nature14504
Jian, Z., Wang, P., Saito, Y., Wang, J., Pflaumann, U., Oba, T., et al. (2020). Holocene variability of the Kuroshio current in the okinawa trough, northwestern pacific ocean. Earth Planet. Sc. Lett. 184, 305–319. doi:10.1016/s0012-821x(00)00321-6
Lai, Z. P., and Brückner, H. (2008). Effects of feldspar contamination on equivalent dose and the shape of growth curve for OSL of silt-sized quartz extracted from Chinese loess. Geochronometria 30 (1), 49–53. doi:10.2478/v10003-008-0010-0
Lee, H., and Chao, S. (2003). A climatological description of circulation in and around the East China Sea. Top. Stud. Oceanogr. 50, 1065–1084. doi:10.1016/s0967-0645(03)00010-9
Li, A., and Zhang, K. (2020). Research progress of mud wedge in the inner continental shelf of the East China Sea. Oceanol. Limnol. Sin. 51 (4), 705–727. doi:10.11693/hyhz20200500145
Li, G., Li, P., Liu, Y., Qiao, L., Ma, Y., Xu, J., et al. (2014). Sedimentary system response to the global sea level change in the East China Seas since the last glacial maximum. Earth-Sci. Rev. 139, 390–405. doi:10.1016/j.earscirev.2014.09.007
Liang, X., Yang, S., Yin, P., et al. (2015). Distribution of clay mineral assemblages in the rivers entering Yellow Sea and East China Sea and the muddy shelves deposits and control factors. Mar. Geol. Quat. Geol. 35 (6), 1–15. doi:10.16562/j.cnki.0256-1492.2015.06.001
Liu, J., Li, A., Xu, K., Veiozzi, D., Yang, Z., Milliman, J., et al. (2006). Sedimentary features of the Yangtze River-derived along-shelf clinoform deposit in the East China sea. Cont. Shelf Res. 26, 2141–2156. doi:10.1016/j.csr.2006.07.013
Liu, J., Milliman, J., Gao, S., and Cheng, P. (2004). Holocene development of the yellow river’s subaqueous delta, north Yellow Sea. Mar. Geol. 209, 45–67. doi:10.1016/j.margeo.2004.06.009
Liu, J., Qiu, J., Saito, Y., Zhang, X., Niang, X., Wang, F., et al. (2020). Formation of the Yangtze Shoal in response to the post-glacial transgression of the paleo-Yangtze (Changjiang) estuary, China. Mar. Geol. 423, 106080. doi:10.1016/j.margeo.2019.106080
Liu, J., Qiu, J., Saito, Y., Zhang, X., Wang, H., Wang, F., et al. (2023). Late pleistocene to Holocene facies architecture and sedimentary evolution of the Zhejiang coast, east China sea. Mar. Geol. 423, 107027. doi:10.1016/j.margeo.2023.107027
Liu, J., Xu, K., Li, A., Milliman, J., Velozzi, D., Xiao, S., et al. (2007). Flux and fate of Yangtze River sediment delivered to the East China sea. Geomorphology 85, 208–224. doi:10.1016/j.geomorph.2006.03.023
Marsh, R., Prestwich, W., Rink, W., and Brennan, B. (2002). Monte Carlo determinations of the beta dose rate to tooth enamel. Radiat. Meas. 35, 609–616. doi:10.1016/S1350-4487(02)00065-3
Peng, W. (2013). “Response of hydrodynamic environment to reclamation in Sanmen Bay,”. Master Dissertation (Zhejiang: Zhejiang University).
Porz, L., Zhang, W., Hanebuth, T., and Schrum, C. (2021). Physical processes controlling mud depocenter development on continental shelves-Geological, oceanographic, and modeling concepts. Mar. Geol. 432, 106402. doi:10.1016/j.margeo.2020.106402
Qiao, S., Shi, X., Wang, G., Zhou, L., Hu, B., Hu, Li., et al. (2017). Sediment accumulation and budget in the bohai sea, Yellow Sea and east China sea. Mar. Geol. 390, 270–281. doi:10.1016/j.margeo.2017.06.004
Roberts, H. M., and Duller, G. A. (2004). Standardised growth curves for optical dating of sediment using multiple-grain aliquots. Radiat. Meas. 38 (2), 241–252. doi:10.1016/j.radmeas.2003.10.001
Shi, Y., Xu, X., Sheng, H., Lv, J., Zhang, S., and Gao, J. (2022). Neglected role of continental circulation in cross-shelf sediment transport: implications for paleoclimate reconstructions. Mar. Geol. 443, 106703. doi:10.1016/j.margeo.2021.106703
Song, B., Li, Z., Saito, Y., Okuno, J., Li, Z., Lu, A., et al. (2013). Initiation of the Changjiang (Yangtze) delta and its response to the mid-Holocene sea level change. Palaeogeogr. Palaeoclimatol. Palaeoecol. 388, 81–97. doi:10.1016/j.palaeo.2013.07.026
Stuiver, M., Reimer, P. J., and Reimer, R. W. (2020). CALIB 8.2. [WWW program] Available at: http://calib.org (Accessed August 14, 2020).
Wang, H., Saito, Y., Zhang, Y., Bi, N., and Yang, Z. (2011). Recent changes of sediment flux to the western Pacific Ocean from major rivers in East and Southeast Asia. Earth-Sci. Rev. 108 (1–2), 80–100. doi:10.1016/j.earscirev.2011.06.003
Wessel, P., and Smith, W. H. F. (1995). New version of the generic mapping tools. Eos Trans. AGU. 76, 329. doi:10.1029/95eo00198
Wu, H., Deng, B., Yuan, R., Hu, J., Gu, J., Shen, F., et al. (2013). Detiding measurement on transport of the Changjiang-derived buoyant coastal current. J. Phys. Oceanogr. 43 (11), 2388–2399. doi:10.1175/jpo-d-12-0158.1
Xu, F., Li, A., Xiao, S., Wan, S., Liu, J., and Zhang, Y. (2009). Paleoenvironmental evolution in the inner shelf of the East China Sea since the last deglaciation. Acta Sediment. Sin. 27, 118–127. doi:10.14027/j.cnki.cjxb.2009.01.009
Xu, K., Li, A., Liu, J., Million, J., Yang, Z., Liu, C., et al. (2012). Provenance, structure, and formation of the mud wedge along inner continental shelf of the East China Sea: a synthesis of the Yangtze dispersal system. Mar. Geol. 291-294, 176–191. doi:10.1016/j.margeo.2011.06.003
Yang, S., and Chen, B. (2007). The transportation characteristics of suspended load in Sanmen Bay. Trans. Oceanol. Limnolo. 4, 21–29. doi:10.13984/j.cnki.cn37-1141.2007.04.008
Yang, S. Y., Wang, Z. B., Dou, Y. G., and Shi, X. F. (2014). Chapter 21 A review of sedimentation since the Last Glacial Maximum on the continental shelf of eastern China. Geol. Soc. Lond. Mem. 41, 293–303. doi:10.1144/m41.21
Yang, Z. (1988). Mineralogical assemblages and chemical characteristics of clays from sediments of the Huanghe, Changjiang, Zhujiang Rivers and their relationship to the climate environment in their sediment source areas. Oceanol. Limnologia Sinica 19 (4), 336–346.
Yoneda, M., Uno, H., Shibata, Y., Suzuki, R., Kumamoto, Y., Yoshida, K., et al. (2007). Radiocarbon marine reservoir ages in the western Pacific estimated by pre-bomb molluscan shells. Nucl. Instrum. Methods Phys. Res. Sect. B 259, 432–437. doi:10.1016/j.nimb.2007.01.184
Yuan, X., Hu, R., Feng, X., Qiu, J., Wang, N., Yao, Z., et al. (2023). Sedimentary records and implications for the evolution of sedimentary environments inferred from BH1302 during the late Quaternary in the Bohai Sea, China. Mar. Geol. 456, 106986. doi:10.1016/j.margeo.2022.106986
Zhang, S., Liu, S., Shu, Z., Xu, X., Lv, J., Shi, Y., et al. (2022). Climate-driven provenance variation and sedimentary system evolution at the Changjiang distal mud since the mid-Holocene. Mar. Geol. 452, 106902. doi:10.1016/j.margeo.2022.106902
Zheng, X., Li, A., Wan, S., Jiang, F., and Johnson, C. (2014). ITCZ and ENSO pacing on East Asian winter monsoon variation during the Holocene: sedimentological evidence from the Okinawa trough. J. Geophys. Res. Oceans 119, 4410–4429. doi:10.1002/2013jc009603
Keywords: Sanmen Bay, Holocene, Yangtze River, seismic profiles, sediment budget
Citation: Qiu J, Jiang S, Wang J, Feng J, Chen J, Dong C, Jiang Y and Zhang D (2024) Mechanism and genesis of Sanmen Bay as a sink of Holocene Yangtze River sediment, Zhejiang Province, China. Front. Earth Sci. 11:1329921. doi: 10.3389/feart.2023.1329921
Received: 30 October 2023; Accepted: 15 December 2023;
Published: 04 January 2024.
Edited by:
Nadia Solovieva, University College London, United KingdomCopyright © 2024 Qiu, Jiang, Wang, Feng, Chen, Dong, Jiang and Zhang. This is an open-access article distributed under the terms of the Creative Commons Attribution License (CC BY). The use, distribution or reproduction in other forums is permitted, provided the original author(s) and the copyright owner(s) are credited and that the original publication in this journal is cited, in accordance with accepted academic practice. No use, distribution or reproduction is permitted which does not comply with these terms.
*Correspondence: Shenghui Jiang, anNoMjU0Njc3QG91Yy5lZHUuY24=; Jing Feng, ZmVuZ2ppbmcyMDAyNzJAMTYzLmNvbQ==