 Chunlei Liu1,2*
 Rong Zheng1,2,3
 Liang Jin1,2,3
 Ruijuan Bao4*
 Ning Cao1,2,3*
 Xiaoqing Liao1,2,3Yufeng Xue1,2,3Hailiang Chen5
 Ke Yang1,2,3Qianye Su1,2,3
- 1South China Sea Institute of Marine Meteorology, Guangdong Ocean University, Zhanjiang, China
- 2CMA-GDOU Joint Laboratory for Marine Meteorology, Guangdong Ocean University, Zhanjiang, China
- 3College of Ocean and Meteorology, Guangdong Ocean University, Zhanjiang, China
- 4Fujian Key Laboratory of Severe Weather, Fuzhou, China
- 5Zhanjiang Meteorological Office, Zhanjiang, China
The landfalls of the tropical cyclone (TC) along the coast of China have caused huge economic damages. There are approximately nine TC landfalls in China every year. It will be beneficial if the landfall frequency can be predicted in advance. Inspired by the study of Sparks and Toumi (Commun Earth Environ, 30-1-2020), six datasets, including four ocean reanalyses and two object analyses from 1993 to 2019, are employed to study the consistency in the relationship between the thermocline temperature anomalies at different longitudes and the frequency of TC landfalls along the coastal areas of China (South China, East China, and the whole of China). The thermocline temperature anomalies at different longitudes are tested in order to confirm our hypothesis that the eastward and westward transports of ocean heat from the warm pool are the causes of the significant correlations. The results show some significant correlations at various longitudes, and the temperature anomalies can predict the TC landfall frequency for several months or longer. Further study also shows the close relationship between the ocean heat transport and the sea surface temperature anomalies at the genesis locations of TC landfalls. The locations of the western Pacific subtropical high (WPSH) during high-frequency TC landfall years also show favorable spatial patterns to the TC landfall in South China and East China, respectively. In years with a high TC frequency in South China, the westward displacement of the WPSH ridge steers TC toward South China, while during high-frequency TC landfall years in East China, WPSH is located further north, and the westward extension of the ridge is in close proximity to the East China Sea.
1 Introduction
Tropical cyclones (TCs) can bring destructive and catastrophic weather events. The powerful winds associated with TCs can damage or even destroy coastal structures, bridges, and vehicles. Storm surges reaching several meters high can lead to tidal inundation, resulting in coastal erosions and the submergence of towns and farmlands, along with the salinization of soils. The torrential rainfall not only directly causes flooding over the land but also triggers secondary disasters, such as landslide and debris flow (Zandbergen, 2009; Peduzzi et al., 2012). TC landfall also results in urban waterlogging, leading to transportation paralysis, ecological destruction, and the spread of diseases, which disrupts the normal functioning of cities. The northwestern Pacific Ocean (WNP), including the South China Sea (SCS), is the region with the highest frequency of TC activity worldwide (Chan, 2006). The southeastern coastal areas of China are severely affected by the highest average number of landfalling TCs. According to statistics obtained from 1951 to the present, an average of 7–9 TCs make landfall along the southeastern coast of China each year, often with significant intensity, resulting in substantial economic losses and casualties in coastal regions (Zhang et al., 2009; Xiao and Xiao, 2010; Tian and Fan, 2019; Shan and Yu, 2021). Therefore, with rapid urbanization and economic development in coastal areas, China remains vulnerable to TCs and associated risks (Zhang et al., 2009; Fischer et al., 2015). If it is possible to forecast the TC landfall frequency in China several months or even longer time ahead, it will be of significant importance in providing early warning services for the coastal areas prone to TC impacts. It will help enhance coastal disaster prevention systems and, consequently, reduce casualties and economic losses.
Due to the limited understanding of the physical mechanisms underlying TC formation and development, the seasonal forecasting of TCs has been challenging. Currently, forecast centers employ various methods, including dynamical methods, statistical methods, and dynamical–statistical hybrid methods, to forecast the activities of TCs. Most studies focus on forecasting TC landfall in East Asia, considering factors such as the cyclone intensity, landfall frequency, and destructive potential (Camp et al., 2019). The activity of TCs in WNP and SCS has been a major area of interest in recent years, and seasonal forecasting in this region has been a prominent research topic (Fan, 2007; Fan and Wang, 2009; Zung-Ching Goh and Chan, 2010; Zhan et al., 2011; Wang et al., 2012; Kim et al., 2017; Wang and Wang, 2019), but the statistical forecasting method is still the primary method employed in these regions (Kim et al., 2017; Zhang et al., 2018). These statistical methods consistently utilize lagged relationships between the observed TC activity and slowly evolving climate modes to provide the seasonal forecasts of TC activity (Wu et al., 2005). Climate modes that influence the TC activity, include the El Niño–Southern Oscillation (ENSO) (Chan et al., 1998; Camargo et al., 2010), western Pacific subtropical high (WPSH, Wang and Wang, 2019), quasi-biennial oscillation (Camargo and Sobel, 2010), North Pacific Oscillation (Wang et al., 2007; Chen et al., 2015; Zhang et al., 2018), Antarctic Oscillation (Ho et al., 2005; Wang et al., 2007), Hadley circulation (Zhou and Cui, 2008; Camargo and Sobel, 2010), and the intertropical convergence zone (ITCZ) (Liao et al., 2023).
The aforementioned forecasting methods primarily focus on predicting the TC frequency over a large region. The relationship between the TC activity over the open oceans and large-scale circulation patterns is highly intertwined, making it challenging to forecast the TC frequency at specific small-scale regions. Each sub-region exhibits different TC activities and requires different forecasting factors (Kim et al., 2010; Wang et al., 2019). In recent years, with the rapid advancement of computational power and the technical development of high-resolution atmosphere–ocean coupled models, the high-resolution coupled atmosphere and ocean general circulation models (AOGCM) have been employed for the seasonal forecasts of TC activity in WNP and East Asia (Huang and Chan, 2014; Camp et al., 2015, 2019b; Manganello et al., 2016; Kim et al., 2017). These statistical and hybrid methods are based on atmospheric forecast factors, such as the wind shear (Camargo et al., 2007; Zhang et al., 2016b), absolute vorticity (Lin and Chan, 2015), relative humidity (Camargo et al., 2007), and sea surface temperature (SST) (Camp et al., 2015; Zhang et al., 2018). These factors often impact the TC activity due to changes in large-scale circulation patterns, such as the northward or southward shift of the monsoon trough (Chen et al., 1998), ENSO (Camargo et al., 2007; Camp et al., 2015; Zhang et al., 2016b), Atlantic Multidecadal Oscillation (AMO) (Zhang et al., 2018), Madden–Julian Oscillation (MJO) (Madden and Julian, 1972; Klotzbach, 2010), WPSH (Camp et al., 2019; Feng et al., 2019; Tian and Fan, 2019), Walker circulation (Feng et al., 2019), Hadley circulation (Guo and Tan, 2018; Feng et al., 2019; Feng et al., 2021), Pacific Meridional Mode (PMM) (Gao et al., 2018), and the crucial steering flow (Yang et al., 2015; Feng et al., 2019). These interannual variations in the large-scale circulation can be represented by changes in various forecast factors. Although statistical and hybrid methods have been trained using observational data and include correlations between environmental and forecast factors in both observational and model datasets, they also incorporate forecast factors related to TC formation, development, and tracks. Therefore, hybrid methods exhibit better forecast performance sometimes (Zhan et al., 2013; Zhang et al., 2016a; Zhang et al., 2016b; Murakami et al., 2016).
Sparks and Toumi (2020) (hereafter, referred to as ST2020) utilized the subsurface (100–300 m depth) heat content variations in the WNP warm pool (WP) to forecast the frequency of TC landfalling in South China between June and November next year. This subsurface region is referred to as the SubNiño4 region and is located at 160°E–150°W and 5°S–5°N, underneath the location of Niño4. Forecast tests using the temperature changes in the SubNiño4 region on historical data returned a correlation coefficient of 0.61 with observations. Inspired by the study of ST2020, the following questions are raised: 1) Can this method be applied to other datasets to achieve similar results? 2) Considering the ocean heat transport along the thermocline during the El Niño cycle, can the ocean temperature anomalies along the thermocline at other longitudes be used to forecast the frequency of TC landfalling in South China? 3) Can this method be extended to forecast the frequency of TC landfalling in East China or the whole of China? To answer these questions, four ocean reanalysis datasets and two objective analyses of ocean temperature have been employed to conduct further study. The data and methods are introduced in Section 2, and the results are presented in Section 3. Section 4 gives the discussion and Section 5 provides conclusions.
2 Data and methods
TC data used in this study are obtained from the International Best Track Archive for Climate Stewardship (IBTrACS, version 4) (Knapp et al., 2010; Knapp et al., 2018). When calculating the landfalling TC frequency in China, the southern coastal region (South China) includes Guangdong, Guangxi Zhuang Autonomous Region, Hong Kong, Fujian, and Hainan. East China includes Taiwan, Zhejiang, Shanghai, Jiangsu, and Shandong. For the calculation of equatorial thermocline temperature anomalies, four ocean reanalysis datasets provided by CMEMS are utilized: the ECMWF ORAS5 (Ocean Reanalysis System 5, Zuo et al., 2019), CMCC global ocean reanalysis system (CMCC CGLORS, Storto and Masina, 2016), Mercator Ocean’s GLORYS2V4 ocean analysis system (Lellouche et al., 2018), and Forecast Ocean Assimilation Model (FOAM, Blockley et al., 2014). These four datasets are, hereafter, referred to as ORAS5, CGLORS, GLORYS, and FOAM, respectively. They have the spatial resolution of 0.25° × 0.25° and 75 vertical levels. Additionally, the two objective analysis datasets, namely, EN4 (version 4.2.2) from the Hadley Centre of the UK Met Office and IAP from the Institute of Atmospheric Physics of Chinese Academy of Sciences, are also employed. The EN4 dataset is constructed based on the following four data sources: the Argo (since 2000), Arctic Synoptic Basin-wide Oceanography (ASBO), Global Temperature and Salinity Profile Program (GTSPP), and World Ocean Database (WOD13) (Good et al., 2013). The IAP dataset has used all available raw observations, including the eXpendable BathyThermograph (XBT), conductivity–temperature–depth (CTD) profiler, and Argo, and has undergone calibrations (including depth, temperature errors, and instrument types), in order to eliminate errors caused by various sources. The spatial resolution of EN4 data is 1° × 1°, with 42 vertical levels, while the spatial resolution of IAP data is 0.5° × 0.5°, with 41 vertical levels. All datasets used in this study are monthly data. The atmospheric reanalysis data from ERA5 (the fifth-generation ECMWF reanalysis, Hersbach et al., 2020), including the daily sea surface temperature and 500 hPa geopotential height, are employed to investigate the influences of environmental factors on TC formation and landfall in China. All datasets and brief descriptions are listed in Table 1.
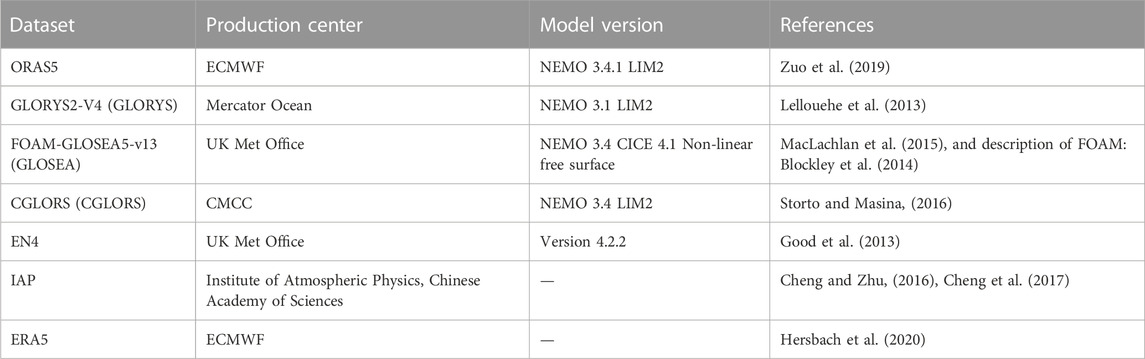
TABLE 1. Dataset and brief descriptions (based on the product user manual for the Global Ocean Reanalysis Product GLOBAL-REANALYSIS-PHY-001-031).
The study period is over 1993–2019 since the four ocean reanalysis datasets from CMEMS can only be publically available over this period. The correlation analysis, composite analysis, and the Student’s t-test have been employed in this study. The thermocline temperature anomaly is calculated based on the mean depth location of the 20°C isotherm at each longitude from 5°S to 5°N over 1993–2019. For the statistical analysis of the relationship between the landfall TC frequency and the thermocline temperature anomaly, a lead–lag correlation calculation is conducted. The ST2020 method has been extended to use the thermocline temperature anomaly at different longitudes and applied to East China and the whole of China. Similar to ST2020, the landfall TC frequency is the accumulation over the TC season from May to November each year. January in the preceding year is noted as JAN(-1), and it is noted as JAN(-2) when it is 2 years earlier.
The ocean heat content tendency (OHCT) is calculated using the ocean heat content (OHC) by the central difference:
where i denotes a particular month and ti−1 and ti+1 denote the time 1 month before and after the month i, respectively. The ocean heat content can be computed by
where A is the horizontal area of the grid box, ρ is the density of sea water, and
3 Results
3.1 Correlation with the TC landfall frequency in South China
The Hovmöller diagram in Figure 1 shows the correlation coefficients between the TC landfall frequency in South China and the thermocline temperature anomaly at different longitudes and leading months. There are several consistent places between datasets showing significant correlation coefficients, such as the region between 173°E–173°W and the time is approximately August in the preceding year [AUG(-1)], and the region between 45°E and 60°E and the time is approximately OCT(-2). There is another one at approximately 160°W in NOV(-1) and the one at approximately 42°E in APR(0). More cases can be found in Table 2, where the leading time by the thermocline temperature anomaly and the longitude for consistent significant correlation coefficients are listed. The stippling area shown in Figure 1 means the correlation coefficients are significant at the 95% confidence level.
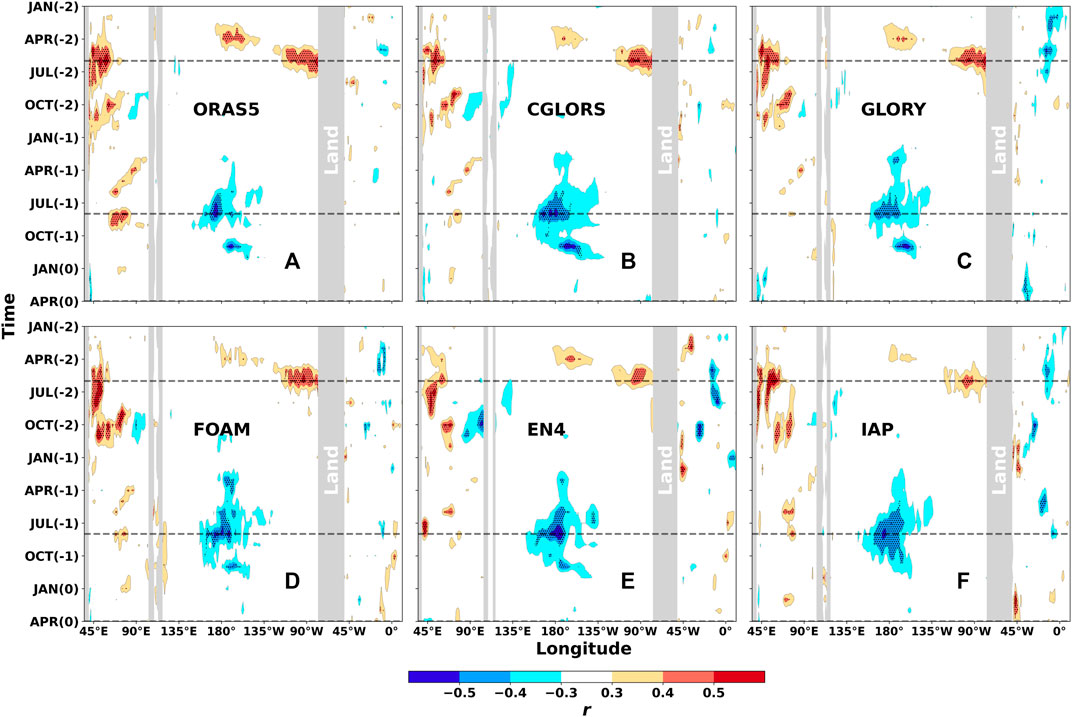
FIGURE 1. Hovmöller diagram showing the correlation coefficients between the TC landfall frequency in South China and the thermocline temperature anomaly at different longitudes and leading months. Stippling represents the significant correlation coefficients at 95% CI. The dataset name is displayed for (A) ORAS5, (B) CGLORS, (C) GLORY, (D) FOAM, (E) EN4 and (F) IAP.

TABLE 2. Selected correlation coefficients. Different colors represent the significance level of 90% (black), 95% (blue), and 99% (orange).
The significant r-value occurs at different longitudes and leading times (Figure 1; Table 2), particularly in AUG(-1) between 173°E–173°W, where r is consistently high across datasets, and the maximum r = −0.62 from the EN4 dataset. The variations of r with longitude in APR(0), AUG(-1), and JUN(-2) are shown in Figure 2 where the significant correlations are shown across the datasets at specified longitudes. APR(0) is close to the TC season. Although there are a couple of locations having significant correlations, the absolute correlation coefficients are generally less than 0.5. However, in AUG(-1), the correlation coefficient r is approximately −0.6 over a large area.
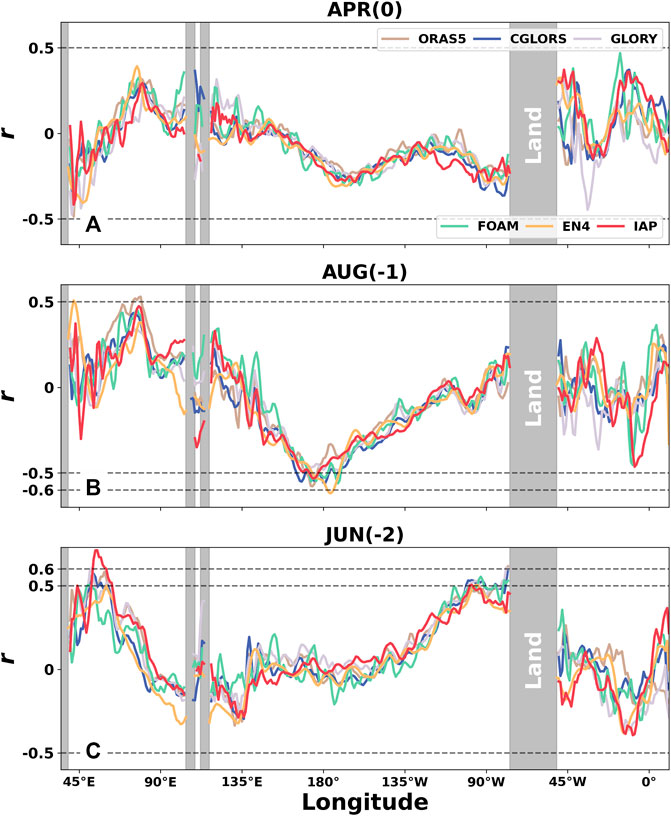
FIGURE 2. Correlation coefficient (r) variation with longitude in (A) APR(0), (B) NOV(-1), and (C) JUN(-2). r is between the thermocline temperature anomaly and TC landfall frequency in South China.
Table 2 shows that in NOV(-1) at approximately 169°W, all correlation coefficients are greater than or equal to 0.5 except r = −0.38 for the IAP dataset. The minimum r = −0.60 from the CGLORS dataset. In AUG(-1), there are more than half of the selected locations having correlation coefficients less than −0.5, with the minimum of r = −0.62 from EN4 at 176°W. All correlation coefficients at approximately 174°E are significant at 95% CI. These regions are around the SubNiño4 region, and the results are consistent with ST2020. It is also noted in Table 2 that the groups of JUN(-1) at 68°E, OCT(-2) at 61°E, and JUL(-2) at 53°E all show significant correlations, and the EN4 dataset has more locations with high correlations. In OCT(-2) and JUN(-2) with a lead time of approximately 2 years, the significantly positive correlations are observed between thermocline temperature anomalies and the number of TC landfalls in South China within the range of 51–65°E. At two specific longitudes of 61°E and 65°E in OCT(-2), at least three datasets have correlation coefficients above 0.5.
The time series of the thermocline temperature anomalies in APR(0) at 42°E, AUG(-1) at 178°W, and JUN(-2) at 78°W, as well as the TC landfall frequency in South China, are plotted in Figure 3 to show their co-variability. There is a good agreement in the variations in general, but the peaks in 2008 and 2012 are not captured well in both AUG(-1) and JUN(-2), respectively. The scatter plot between the dataset mean thermocline temperature anomalies and the frequency of landfall TCs in South China is shown in the right column, and the correlation coefficients are also displayed.
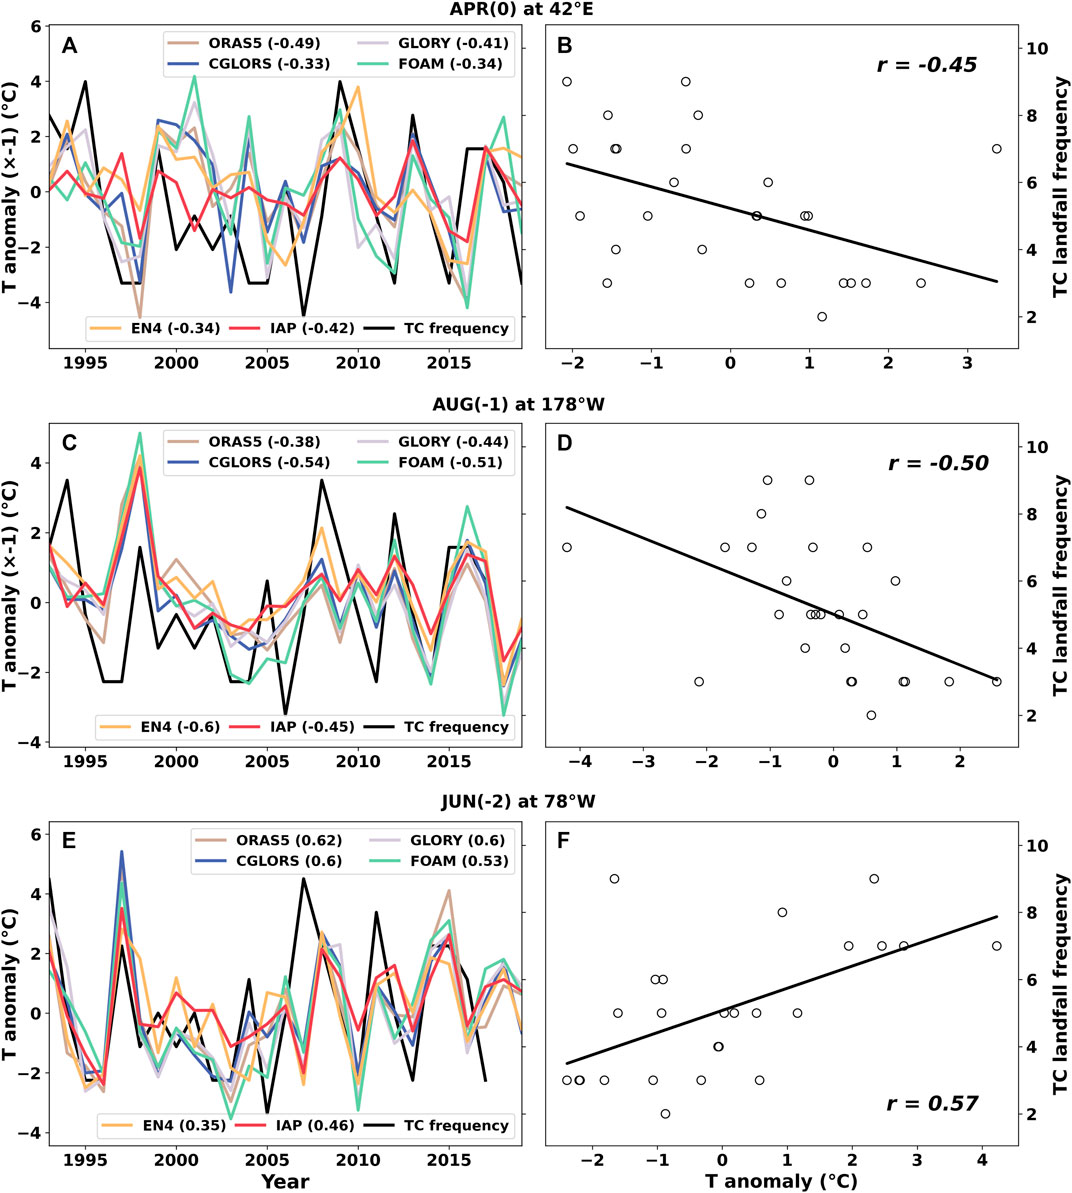
FIGURE 3. Time series of thermocline temperature anomalies and landfall TC frequency in South China for all datasets. (A) In APR(0) at 42°E, (C) in AUG(-1) at 178°W, and (E) in JUN(-2) at 78°W. The corresponding scatter plots between the multi-dataset mean thermocline temperature anomalies and the landfall TC frequency are in the right column (B,D,F), and the correlation coefficients are also displayed.
3.2 Correlation with the TC landfall frequency in East China
The above method has been extended to East China, and the Hovmöller diagram is plotted in Figure 4. There are more consistent locations and times with significant correlations compared with Figure 1, but most of them have a leading time of more than 1 year (Table 2). The obvious eastward propagation of the significantly negative correlation coefficient from JAN(-2) to OCT(-2) in Pacific implies the eastward propagation of the ocean heat along the thermocline.
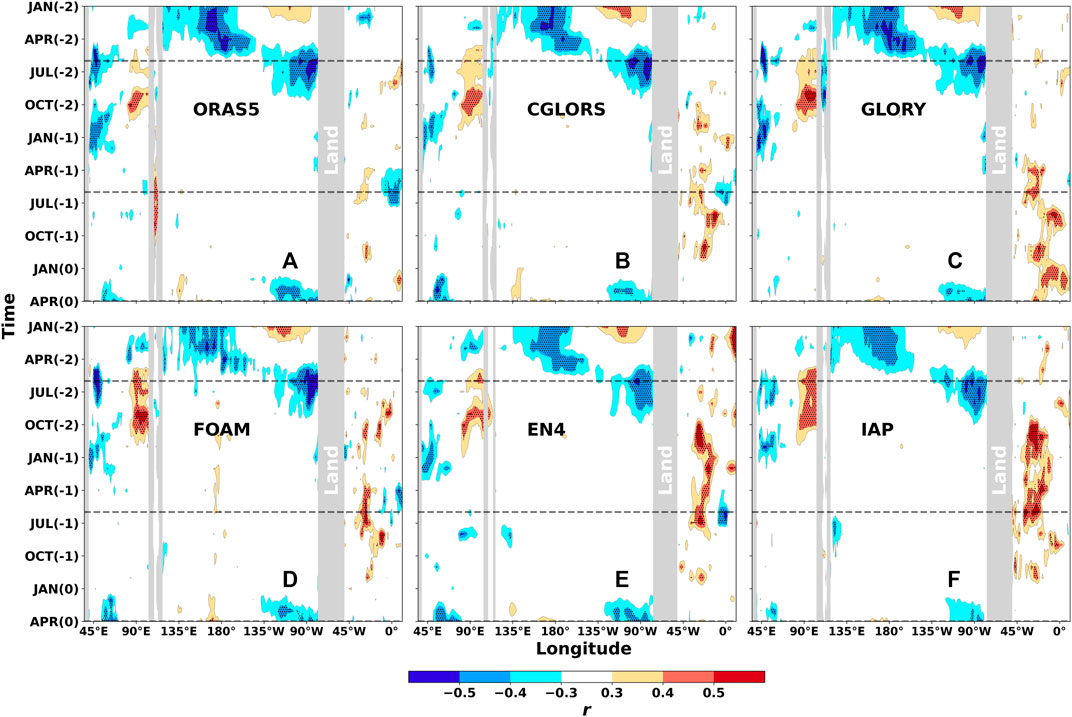
FIGURE 4. Similar to Figure 1 but for East China.
Table 2 shows that there are significant correlations from the FOAM dataset in different leading times and longitudinal locations, such as the positive correlation coefficient r reaches 0.55 in JUN(-1) at 27°W and 0.58 in SEP(-2) at 100°E, as well as the negative correlation coefficient r = −0.73 in JUN(-2) at 80°W. In APR(0), just before the TC season, the correlation coefficients from all datasets at 94°W and 95°W are significantly negative at 95% CI. In JUN(-1) at 27°W and 28°W, the correlation coefficients are significantly positive, and the maximum r reaches 0.55 from FOAM and IAP datasets.
The variations of the correlation coefficient with longitude in APR(0), JUN(-1), and JUN(-2) are plotted in Figure 5. The correlation coefficients in APR(0) are approximately −0.5 over 59–66°E (−0.46 at 66°E for ORAS5, −0.28 at 60°E for GLORY, −0.49 at 62°E for CGLORS, −0.52 at 64°E for FOAM, −0.50 at 62°E for EN4, and −0.36 at 59°E for IAP) and 80–95°W (−0.46 at 80°W for ORAS5, −0.44 at 94°W for GLORY, −0.41 at 95°W for CGLORS, −0.44 at 85°W for FOAM, −0.47 at 85°W for EN4, and −0.46 at 86°W for IAP), and the significantly positive correlation is at approximately 23°W. In JUN(-1), the correlation coefficients are approximately 0.5 at 28°W and −0.5 at 0°. The correlation coefficients in JUN(-2) are relatively higher than those in APR(0) and JUN(-1), and they can be over −0.6 at approximately 47°E (−0.60 at 48°E for ORAS5, −0.57 at 47°E for GLORY, −0.46 at 48°E for CGLORS, −0.67 at 49°E for FOAM, −0.39 at 48°E for EN4, and −0.46 at 45°E for IAP) and even reach −0.73 at approximately 80°W (−0.56 at 78°W for ORAS5, −0.63 at 79°W for GLORY, −0.63 at 78°W for CGLORS, −0.73 at 80°W for FOAM, −0.53 at 72°W for EN4, and −0.53 at 92°W for IAP).
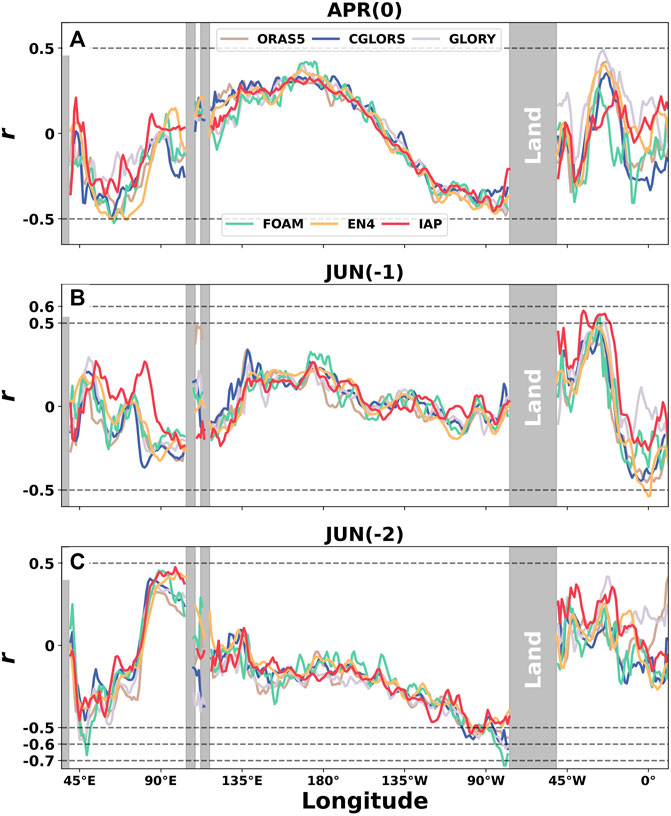
FIGURE 5. Similar to Figure 2 but for East China. In (A) APR(0), (B) JUN(-1), and (C) JUN(-2).
The time series of the thermocline temperature anomalies at specific longitudes and lead time, as well as the frequency of landfall TCs in East China, are plotted in the left column of Figure 6, and the corresponding scatter plots between the multi-dataset mean thermocline temperature anomalies and TC landfall frequency are in the right column. The correlation coefficients are r = −0.43 in APR(0) at 94°W, r = 0.51 in JUN(-1) at 27°W, and r = −0.61 in JUN(-2) at 79°W.
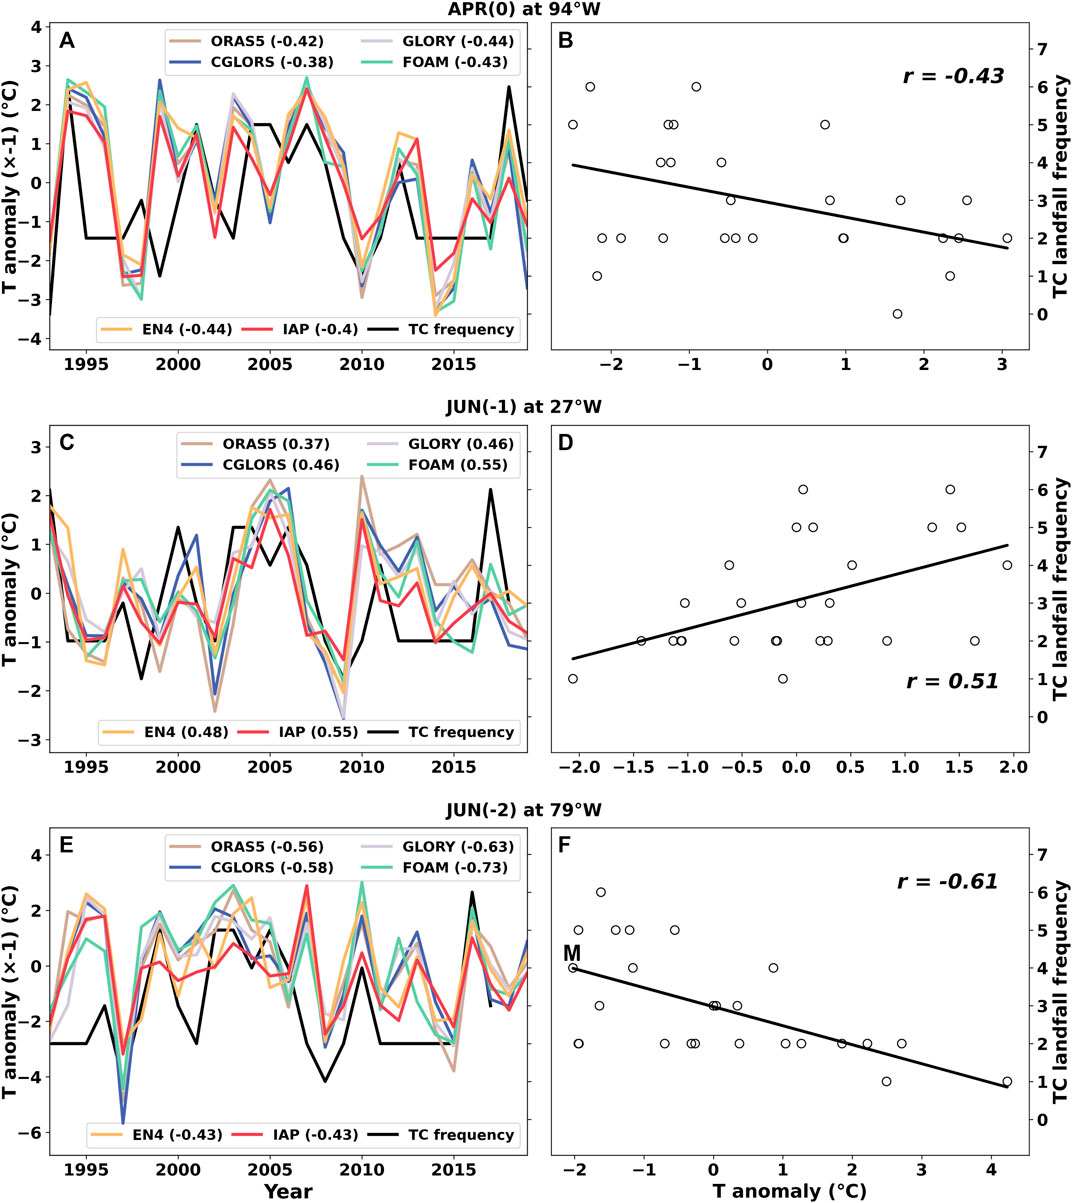
FIGURE 6. Similar to Figure 3 but for East China. Time series of the thermocline temperature anomalies and landfall TC frequency, as well as the corresponding correlation coefficients in (A) APR(0) at 94°W, (C) JUN(-1) at 27°W, and (E) JUN(-2) at 79°W. The corresponding scatter plot between the multi-dataset mean thermocline temperature anomalies and the landfall TC frequency is shown in the right column (B,D,F). The correlation coefficients are also displayed.
3.3 Correlation with the TC landfall frequency in the coastal areas of China
From the above analysis of the correlation coefficients between the thermocline temperature anomalies and landfall TC frequency in South China and East China, respectively, it is found that they vary in locations and leading months with study areas. Therefore, it is expected that the correlation coefficients will become weak if this method is applied to the whole coastal areas of China, and this is confirmed in Figure 7, which shows less patches of high correlation coefficients than Figures 1, 4.
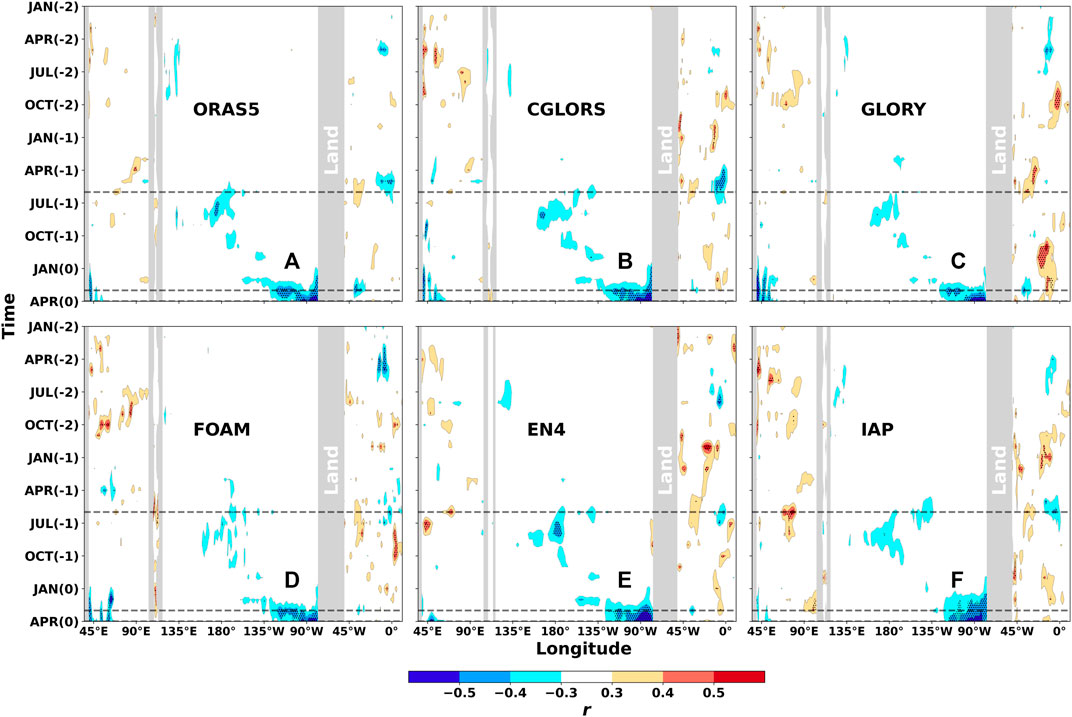
FIGURE 7. Similar to Figure 1 but for the entire coastal areas of China.
High correlation coefficients are mainly concentrated between FEB(0) and APR(0) over 80–135°W. Table 2 shows that most correlation coefficients in APR(0) over 80–90°W are less than −0.50 and significant at 99% CI across datasets, and the minimum reaches −0.63. In MAR(0), there are also some high correlation coefficients at several locations, and the minimum can reach −0.49 at 107–108°W from ORAS5. These high correlations in MAR(0) and APR(0) are very useful in the mid-range forecast of the landfall TC frequency, but they are not seen in the correlations when South China and East China are considered separately, meriting a further investigation.
The variations of the correlation coefficients with longitude in APR(0), MAR(0), and JUN(-1) are plotted in Figure 8. Table 2 shows that there is a notable negative correlation location at approximately 90°W, with all r < −0.5 across datasets and r < −0.6 for GLORY and EN4 datasets. The correlation coefficients are also approximately −0.5 at the location at approximately 48°E. In MAR(0), the correlation coefficients can reach −0.5 at the location around 42°E, 90°W, and 43°W. Unlike for East China, where there are quite a few locations and leading times showing high correlation coefficients for a long-range prediction (between 1 and 2 years), only the correlation coefficients in JUN(-1) are approximately 0.5 at 80°E.
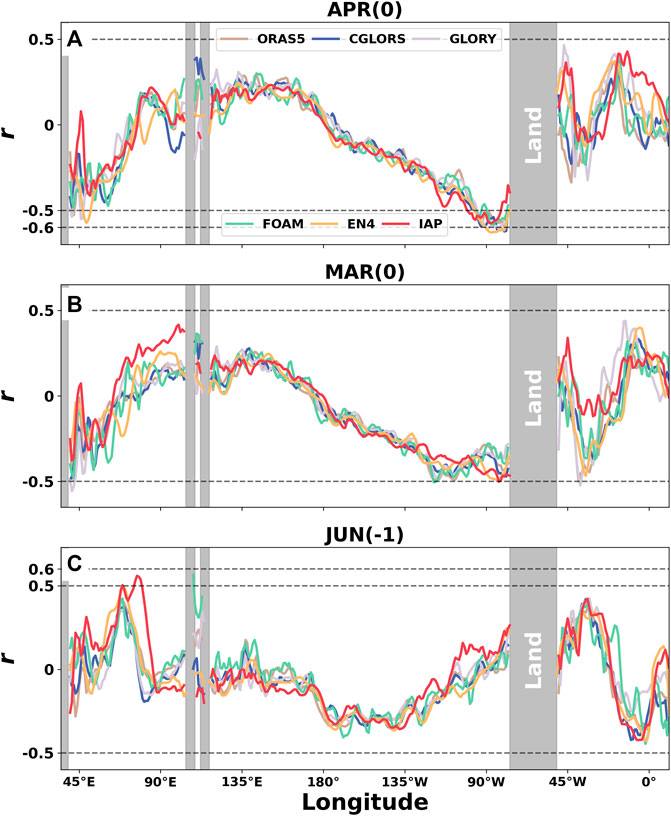
FIGURE 8. Simialr to Figure 2 but for the entire coastal areas of China. In (A) APR(0), (B) MAR(0), and (C) JUN(-1).
The corresponding time series of the thermocline temperature anomalies and landfall TC frequency in the coastal areas of China are plotted in Figure 9. It can be seen that in APR(0) at 83°W, the correlation coefficient r = −0.57 for ORAS5, −0.61 for GLORY and CGLORS, −0.56 for FOAM, and −0.62 for EN4 and −0.54 for IAP. The correlation from the multi-dataset mean is r = −0.61. Compared with MAR(0) and JUN(-1), APR(0) has the best correlation.
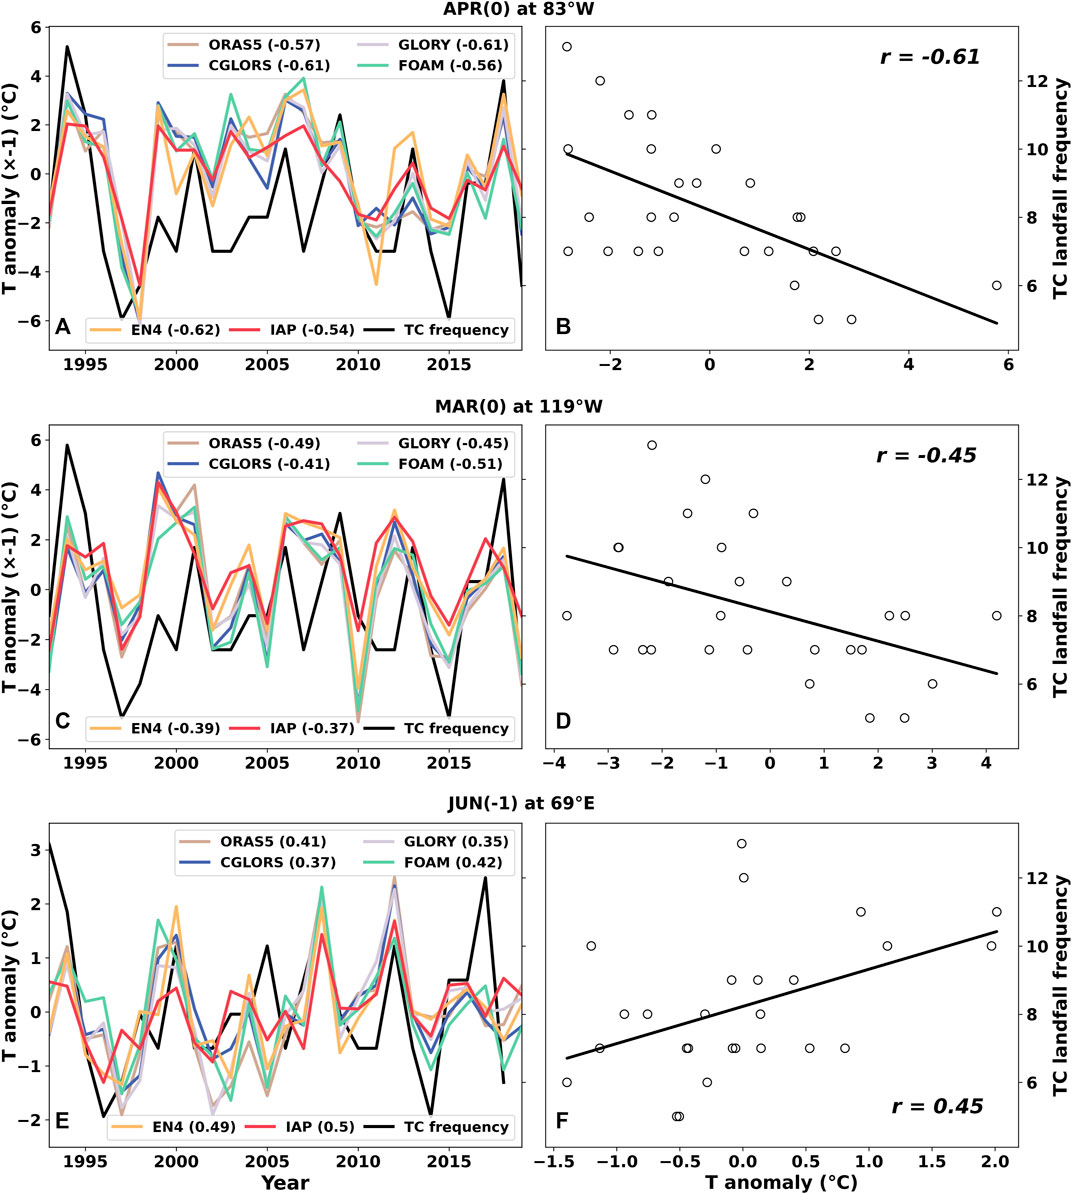
FIGURE 9. Similar to Figure 3 but for the entire coastal areas of China. Time series of the thermocline temperature anomalies and landfall TC frequency, as well as the corresponding correlation coefficients in (A) APR(0) at 83°W, (C) MAR(0) at 119°W, and (E) JUN(-1) at 69°E. The corresponding scatter plot between the multi-dataset mean thermocline temperature anomalies and the landfall TC frequency are shown in the right column (B,D,F). The correlation coefficients are also displayed.
4 Discussion
The method developed by ST2020 has been tested using different datasets, and consistent high correlation coefficients between thermocline temperature anomalies and landfall TC frequencies in South China, East China, and the entire coastal areas of China are found, with different leading months and at different longitudinal locations. This confirms our hypothesis that the eastward and westward ocean heat transport may play a role since it will affect SST, and hence the environmental conditions at TC genesis locations and the WPSH location, which will influence the TC landfall frequency and location.
4.1 Influence of the OHCT transport on SST at TC genesis locations
To further check our hypothesis, the relationship between OHCT and SST at TC genesis locations has been investigated. The genesis locations of TC landfalling in South China and East China over 1993–2019 are plotted in Figure 10A. Similar to Cheng et al. (2019), OHCT is calculated using the ORAS5 dataset by averaging OHC over 10°S–10°N and integrating from 0 to 2,000 m, and the Hovmöller diagram is plotted in Figure 10B, which shows the westward and eastward propagation of OHCT from the warm pool region. The ocean heat transported to WNP and SCS areas can provide favorable SST conditions for TC genesis. The time series of OHCT from six datasets at specified locations, together with SST averaged from the TC genesis locations, are plotted in Figures 10C–E for South China, East China, and the entire coastal areas of China. The correlation coefficients between OHCT from different datasets at 144°E and SST are generally greater than 0.50 except that for IAP where r = 0.39 in South China and the maximum r = 0.64 from EN4. The selected longitude for OHCT time series is 65°E for East China and 127°E for the whole coastal areas of China, and the results are similar to that in South China.
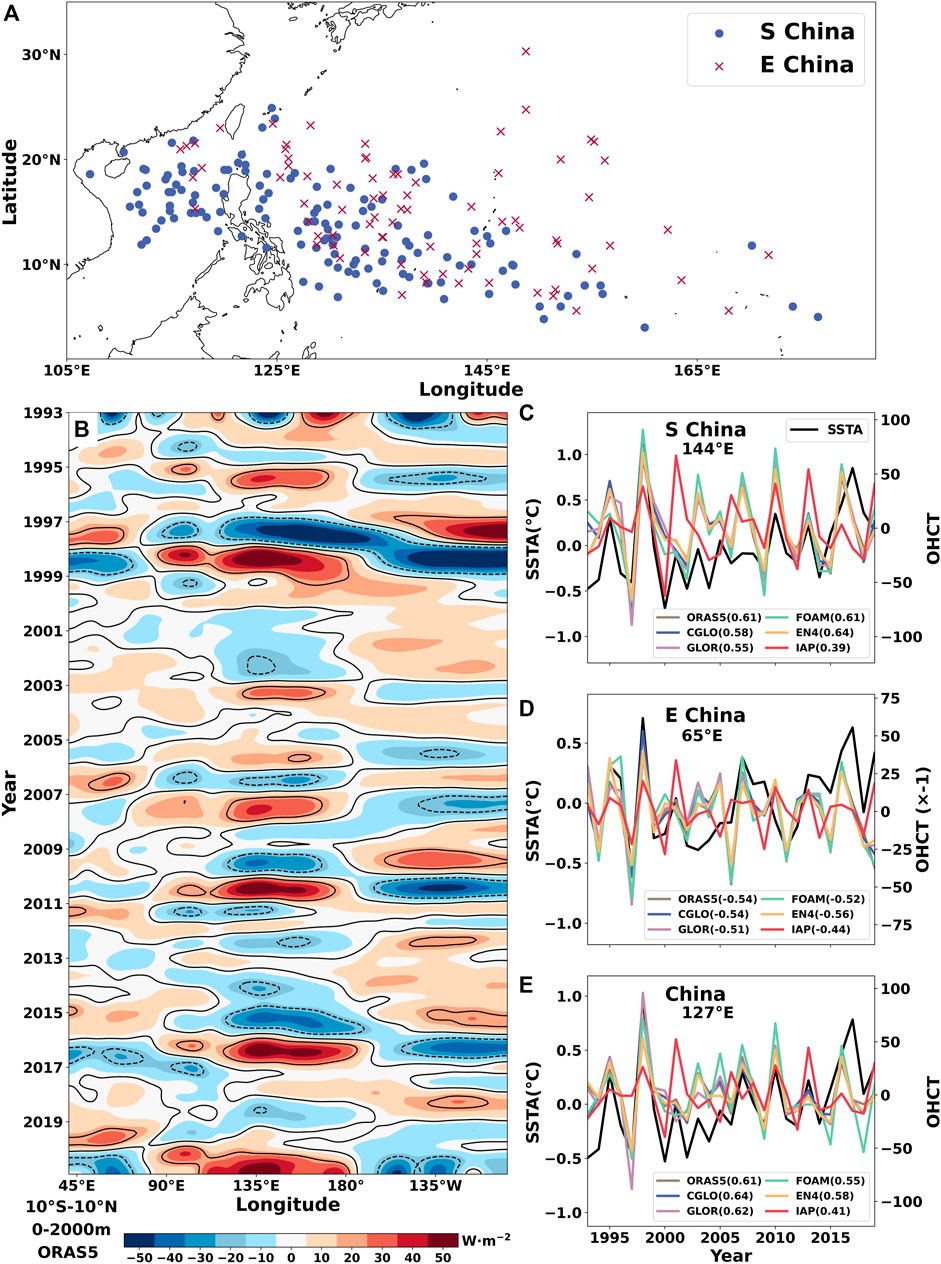
FIGURE 10. (A) Genesis locations of TC landfalling in South China (blue dots) and East China (red crosses). (B) Hovmöller diagram of the OHCT integrated over 10°S–10°N and 0–2,000 m from the ORAS5 dataset. Time series of the OHCT at specified locations, together with the SST averaged from the TC genesis locations in (C) South China, (D) East China, and (E) the entire coastal areas of China. The correlation coefficients between OHCT and SST are also displayed.
4.2 Influence of the WPSH location on the TC landfall
Previous studies have shown the significant influences of the WPSH location on the TC landfall in East Asia on interannual and decadal timescales (Wang et al., 2012; Camp et al., 2019). In order to check the relations between the WPSH location and TC landfall, the high-frequency TC seasons are defined as those months with landfall TC frequencies exceeding 6 in South China and 4 in East China. Based on this classification, the high-frequency years in South China are 1993, 1994, 1995, 1999, 2009, 2010, 2013, 2016, and 2017, while the high-frequency years in East China are 1994, 2001, 2004, 2005, 2007, and 2018, as shown in Figure 11A. The locations of WPSH are determined using the 587-dagpm and 588-dagpm geopotential height contours.
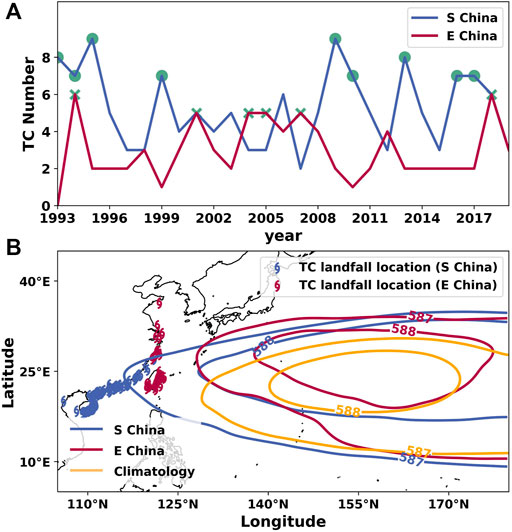
FIGURE 11. (A) Time series of frequencies of landfall TCs in South China and East China. The frequency marked by the green dot is equal to or greater than 7, and that marked by the green cross is equal to or greater than 5. (B) 587- and 588-dagpm geopotential height contours averaged over high-frequency years of landfall TC for South China (blue) and East China (purple), together with climatology (brown).
The mean geopotential height contours from the high frequency years are plotted in Figure 11B. As expected, during the high-frequency years in South China, the 587- and 588-dagpm geopotential height contours are more westward than the climatology over TC seasons from 1993–2019, and the 587-dagpm contour can reach the coast line of China; however, those contours in East China are more northward than the climatology and that in South China. These contour spatial distribution patterns determine the steering flow directions of TCs, leading them to move toward the coastal areas of China.
5 Conclusion
Several datasets, including four ocean reanalyses and two object ocean analyses, have been employed to check the robustness of the ST2020 results, and the ST2020 method has also been extended for application to East China and the entire coastal areas of China. The main conclusions are given as follows:
(1) There are significant correlations between the thermocline temperature anomalies at different longitudes and the frequency of landfall TCs in South China, East China, and the entire coastal areas of China across datasets, such as in APR(0) at 42°E, AUG(-1) at 178°W, and JUN(-2) at 78°W in South China; in APR(0) at 94°W, JUN(-1) at 27°W, and JUN(-2) at 79°W in East China; and in APR(0) at 83°W, MAR(0) at 119°W, and JUN(-1) at 69°E for the entire coastal areas of China.
(2) The results confirmed our hypothesis, to some extent, that the temperature anomaly at different longitudes along the thermocline can have good correlations with the frequency of landfall TCs in South China and other coastal regions, due to the eastward and westward oceanic heat transport along the thermocline. Therefore, this method has the predictive power since it precedes surface ENSO conditions during the TC season, which, in turn, influences the TC steering toward landfall along the coastal areas of China.
(3) There are significantly positive and negative correlations due to the time delay of the ocean heat transport along the thermocline.
(4) The significant correlation between OHCT at specific longitudes and the mean SST averaged over the genesis location of landfall TCs may be due to the ocean heat transport influences on the environmental conditions of TC genesis, meriting further investigation.
These findings can not only be used to predict the TC landfall frequency in South China, East China, and the entire coastal areas of China but also these predictions using thermocline temperature anomalies at different longitudes can be checked with each other to ensure the quality of the prediction. This work is inspired by the study of ST2020 and only provides a framework for the underlying mechanisms, and it will stimulate the investigations on the physical processes linking the thermocline temperature anomaly and TC landfall frequency in China or other regions. The progress in this study will improve the disaster prevention against TCs. There is still much work to be done to fully understand the underlying physical processes, such as the eastward and westward ocean heat transport (Cheng et al., 2019; Xu et al., 2020), the alternative positive and negative correlations, and the ocean heat transport influences on the WPSH position and SST at the TC genesis location. This method can also be combined with the study provided by Feng et al. (2022) to check the robustness of each other.
Data availability statement
Publicly available datasets were analyzed in this study. These data can be found here: The IBTrACS data for this study can be found at https://www.ncei.noaa.gov/products/international-best-track-archive?name=ib-v4-access. The ONI data are obtained from https://origin.cpc.ncep.noaa.gov/products/analysis_monitoring/ensostuff/ONI_v5.php. The four ocean reanalyses can be available at https://data.marine.copernicus.eu/product/GLOBAL_REANALYSIS_PHY_001_031/description. The ERA5 reanalysis data are downloaded from https://cds.climate.copernicus.eu/cdsapp#!/search?type=dataset, the EN4 data are downloaded from https://www.metoffice.gov.uk/hadobs/en4/, and the IAP data are downloaded from http://www.ocean.iap.ac.cn/pages/dataService/dataService.html?navAnchor=dataService.
Author contributions
CL: conceptualization, funding acquisition, investigation, supervision, writing–original draft, and writing–review and editing. RZ: data curation, formal analysis, investigation, software, validation, visualization, writing–original draft, and writing–review and editing. LJ: formal analysis, software, visualization, and writing–review and editing. RB: resources, supervision, and writing–review and editing. NC: software, supervision, and writing–review and editing. XL: validation and writing–review and editing. YX: supervision and writing–review and editing. HC: data curation and writing–review and editing. KY: data curation and writing–review and editing. QS: data curation, software, and writing–review and editing.
Funding
The author(s) declare that financial support was received for the research, authorship, and/or publication of this article. This work is jointly supported by the National Natural Science Foundation of China (42075036, 42275017, 72293604, and 42130605), the Fujian Key Laboratory of Severe Weather (2021KFKT02), the LASG Key Open Project (20230273) from the Institute of Atmospheric Physics, Chinese Academy of Sciences, the scientific research start-up grant of Guangdong Ocean University (R20001), and the Postgraduate Education Innovation Project of Guangdong Ocean University (202144 and 202253). CL is also supported by the University of Reading as a visiting fellow.
Acknowledgments
The authors would like to thank two reviewers for reviewing this paper and providing constructive comments and suggestions.
Conflict of interest
The authors declare that the research was conducted in the absence of any commercial or financial relationships that could be construed as a potential conflict of interest.
Publisher’s note
All claims expressed in this article are solely those of the authors and do not necessarily represent those of their affiliated organizations, or those of the publisher, the editors, and the reviewers. Any product that may be evaluated in this article, or claim that may be made by its manufacturer, is not guaranteed or endorsed by the publisher.
References
Blockley, E. W., Martin, M. J., McLaren, A. J., Ryan, A. G., Waters, J., Lea, D. J., et al. (2014). Recent development of the Met Office operational ocean forecasting system: an overview and assessment of the new Global FOAM forecasts. Geosci. Model Dev. 7, 2613–2638. doi:10.5194/gmd-7-2613-2014
Camargo, S. J., Emanuel, K. A., and Sobel, A. H. (2007). Use of a genesis potential index to diagnose ENSO effects on tropical cyclone genesis. J. Clim. 20, 4819–4834. doi:10.1175/jcli4282.1
Camargo, S. J., and Sobel, A. H. (2010). Revisiting the influence of the quasi-biennial oscillation on tropical cyclone activity. J. Clim. 23, 5810–5825. doi:10.1175/2010jcli3575.1
Camargo, S. J., Sobel, A. H., Barnston, A. G., and Klotzbach, P. J. (2010). “The influence of natural climate variability on tropical cyclones, and seasonal forecasts of tropical cyclone activity,” in World scientific series on asia-pacific weather and climate (WORLD SCIENTIFIC), 325–360.
Camp, J., Roberts, M., MacLachlan, C., Wallace, E., Hermanson, L., Brookshaw, A., et al. (2015). Seasonal forecasting of tropical storms using the Met Office GloSea5 seasonal forecast system. Q.J.R. Meteorol. Soc. 141, 2206–2219. doi:10.1002/qj.2516
Camp, J., Roberts, M. J., Wu, P., MacLachlan, C., Bett, P. E., Comer, R. E., et al. (2019). The western Pacific subtropical high and tropical cyclone landfall: seasonal forecasts using the Met Office GloSea5 system. Q.J.R. Meteorol. Soc. 145, 105–116. doi:10.1002/qj.3407
Chan, J. C. L. (2006). Comment on “changes in tropical cyclone number, duration, and intensity in a warming environment.”. Science 311, 1713. doi:10.1126/science.1121522
Chan, J. C. L., Shi, J., and Lam, C. (1998). Seasonal forecasting of tropical cyclone activity over theWestern North Pacific and the SouthSouth China sea. Weather Forecast. 13, 997–1004. doi:10.1175/1520-0434(1998)013<0997:sfotca>2.0.co;2
Chen, D., Wang, H., Liu, J., and Li, G. (2015). Why the spring North Pacific oscillation is a predictor of typhoon activity over the western North Pacific. Int. J. Climatol. 35, 3353–3361. doi:10.1002/joc.4213
Chen, T.-C., Weng, S.-P., Yamazaki, N., and Kiehne, S. (1998). Interannual variation in the tropical cyclone formation over the western North Pacific. Mon. Wea. Rev. 126, 1080–1090. doi:10.1175/1520-0493(1998)126<1080:ivittc>2.0.co;2
Cheng, L., Trenberth, K. E., Fasullo, J., Boyer, T., Abraham, J., Zhu, J., et al. (2017). Improved estimates of ocean heat content from 1960 to 2015. Sci. Adv. 3, e1601545. doi:10.1126/sciadv.1601545
Cheng, L., Trenberth, K. E., Fasullo, J. T., Mayer, M., Balmaseda, M., and Zhu, J. (2019). Evolution of ocean heat content related to ENSO. J. Clim. 32, 3529–3556. doi:10.1175/jcli-d-18-0607.1
Cheng, L., and Zhu, J. (2016). Benefits of CMIP5 multimodel ensemble in reconstructing historical ocean subsurface temperature variations. J. Clim. 29, 5393–5416. doi:10.1175/jcli-d-15-0730.1
Fan, K. (2007). North Pacific sea ice cover, a predictor for the Western North Pacific typhoon frequency? Sci. CHINA Ser. D. 50, 1251–1257. doi:10.1007/s11430-007-0076-y
Fan, K., and Wang, H. (2009). A new approach to forecasting typhoon frequency over the western North Pacific. Weather Forecast. 24, 974–986. doi:10.1175/2009waf2222194.1
Feng, X., Hodges, K. I., Hoang, L., Pura, A. G., Yang, G., Luu, H., et al. (2022). A new approach to skillful seasonal prediction of Southeast Asia tropical cyclone occurrence. J. Geophys. Res. Atmos. 127 (12), e2022JD036439. ISSN 2169-8996. doi:10.1029/2022JD036439
Feng, X., Klingaman, N. P., and Hodges, K. I. (2019). The effect of atmosphere–ocean coupling on the prediction of 2016 western North Pacific tropical cyclones. Q.J.R. Meteorol. Soc. 145, 2425–2444. doi:10.1002/qj.3571
Feng, X., Klingaman, N. P., and Hodges, K. I. (2021). Poleward migration of western North Pacific tropical cyclones related to changes in cyclone seasonality. Nat. Commun., 12s6210–1723. doi:10.1038/s41467-021-26369-7
Fischer, T., Su, B., and Wen, S. (2015). Spatio-temporal analysis of economic losses from tropical cyclones in affected provinces of China for the last 30 Years (1984–2013). Nat. Hazards Rev. 16, 04015010. doi:10.1061/(ASCE)NH.1527-6996.0000186
Gao, S., Zhu, L., Zhang, W., and Chen, Z. (2018). Strong modulation of the pacific meridional mode on the occurrence of intense tropical cyclones over the western North Pacific. J. Clim. 31, 7739–7749. doi:10.1175/jcli-d-17-0833.1
Good, S. A., Martin, M. J., and Rayner, N. A. (2013). EN4: quality controlled ocean temperature and salinity profiles and monthly objective analyses with uncertainty estimates. J. Geophys. Res. Oceans 118, 6704–6716. doi:10.1002/2013jc009067
Guo, Y.-P., and Tan, Z.-M. (2018). Impacts of the boreal spring indo-pacific warm pool Hadley circulation on tropical cyclone activity over the western North Pacific. J. Clim. 31, 1361–1375. doi:10.1175/jcli-d-17-0422.1
Hersbach, H., Bell, B., Berrisford, P., Hirahara, S., Horányi, A., Muñoz-Sabater, J., et al. (2020). The ERA5 global reanalysis. Q. J. R. Meteorol. Soc. 146, 1999–2049. doi:10.1002/qj.3803
Ho, C.-H., Kim, J.-H., Kim, H.-S., Sui, C.-H., and Gong, D.-Y. (2005). Possible influence of the Antarctic Oscillation on tropical cyclone activity in the western North Pacific. J. Geophys. Res. Atmos. 110. doi:10.1029/2005JD005766
Huang, W.-R., and Chan, J. C. L. (2014). Dynamical downscaling forecasts of Western North Pacific tropical cyclone genesis and landfall. Clim. Dyn. 42, 2227–2237. doi:10.1007/s00382-013-1747-3
Kim, J.-H., Ho, C.-H., and Chu, P.-S. (2010). Dipolar redistribution of summertime tropical cyclone genesis between the Philippine Sea and the northern South China Sea and its possible mechanisms. J. Geophys. Res. 115, D06104. doi:10.1029/2009JD012196
Kim, O.-Y., Kim, H.-M., Lee, M.-I., and Min, Y.-M. (2017). Dynamical–statistical seasonal prediction for western North Pacific typhoons based on APCC multi-models. Clim. Dyn. 48, 71–88. doi:10.1007/s00382-016-3063-1
Klotzbach, P. J. (2010). On the madden–julian oscillation–atlantic hurricane relationship. J. Clim. 23, 282–293. doi:10.1175/2009jcli2978.1
Knapp, K. R., Diamond, H. J., Kossin, J. P., Kruk, M. C., and Schreck, C. J. (2018). International best track archive for climate stewardship (IBTrACS) project, version 4. NOAA National Centers for Environmental Information. doi:10.25921/82ty-9e16
Knapp, K. R., Kruk, M. C., Levinson, D. H., Diamond, H. J., and Neumann, C. J. (2010). The international best track archive for climate stewardship (IBTrACS): unifying tropical cyclone data. Bull. Amer. Meteor. Soc. 91, 363–376. doi:10.1175/2009BAMS2755.1
Lellouche, J.-M., Greiner, E., Le Galloudec, O., Garric, G., Regnier, C., Drevillon, M., et al. (2018). Recent updates to the Copernicus Marine Service global ocean monitoring and forecasting real-time 1∕12° high-resolution system. Ocean. Sci. 14, 1093–1126. doi:10.5194/os-14-1093-2018
Liao, X., Holloway, C. E., Feng, X., Liu, C., Lyu, X., Xue, Y., et al. (2023). Observed interannual relationship between ITCZ position and tropical cyclone frequency. J. Clim. 36 (16), 5587–5603. doi:10.1175/JCLI-D-22-0865.1
Lin, I.-I., and Chan, J. C. L. (2015). Recent decrease in typhoon destructive potential and global warming implications. Nat. Commun. 6, 7182. doi:10.1038/ncomms8182
MacLachlan, C., Arribas, A., Peterson, K. A., Maidens, A., Fereday, D., Scaife, A. A., et al. (2015). Global Seasonal forecast system version 5 (GloSea5): a high-resolution seasonal forecast system. Q.J.R. Meteorol. Soc. 141, 1072–1084. doi:10.1002/qj.2396
Madden, R. A., and Julian, P. R. (1972). Description of global-scale circulation cells in the tropics with a 40–50 Day period. J. Atmos. Sci. 29, 1109–1123. doi:10.1175/1520-0469(1972)029<1109:dogscc>2.0.co;2
Manganello, J. V., Hodges, K. I., Cash, B. A., Kinter, J. L., Altshuler, E. L., Fennessy, M. J., et al. (2016). Seasonal forecasts of tropical cyclone activity in a high-atmospheric- resolution coupled prediction system. J. Clim. 29, 1179–1200. doi:10.1175/JCLI-D-15-0531.1
Murakami, H., Villarini, G., Vecchi, G. A., Zhang, W., and Gudgel, R. (2016). Statistical–dynamical seasonal forecast of north atlantic and U.S. Landfalling tropical cyclones using the high-resolution GFDL FLOR coupled model. Mon. Wea. Rev. 144, 2101–2123. doi:10.1175/MWR-D-15-0308.1
Peduzzi, P., Chatenoux, B., Dao, H., De Bono, A., Herold, C., Kossin, J., et al. (2012). Global trends in tropical cyclone risk. Nat. Clim. Change 2, 289–294. doi:10.1038/nclimate1410
Shan, K., and Yu, X. (2021). Variability of tropical cyclone landfalls in China. J. Clim. 34, 9235–9247. doi:10.1175/jcli-d-21-0031.1
Sparks, N., and Toumi, R. (2020). Pacific subsurface ocean temperature as a long-range predictor of South China tropical cyclone landfall. Commun. Earth Environ. 1, 30. doi:10.1038/s43247-020-00033-2
Storto, A., and Masina, S. (2016). C-GLORSv5: an improved multi-purpose global ocean eddy-permitting physical reanalysis. Oceanogr. – Phys. doi:10.5194/essd-2016-38
Tian, B., and Fan, K. (2019). Seasonal climate prediction models for the number of landfalling tropical cyclones in China. J. Meteorol. Res. 33, 837–850. doi:10.1007/s13351-019-8187-x
Wang, B., Xiang, B., and Lee, J.-Y. (2012). Subtropical High predictability establishes a promising way for monsoon and tropical storm predictions. PNAS 110, 2718–2722. doi:10.1073/pnas.1214626110
Wang, C., and Wang, B. (2019). Tropical cyclone predictability shaped by western Pacific subtropical high: integration of trans-basin sea surface temperature effects. Clim. Dyn. 53, 2697–2714. doi:10.1007/s00382-019-04651-1
Wang, G., Su, J., Ding, Y., and Chen, D. (2007). Tropical cyclone genesis over the south China sea. J. Mar. Syst. 68, 318–326. doi:10.1016/j.jmarsys.2006.12.002
Wang, H., Xu, M., Onyejuruwa, A., Wang, Y., Wen, S., Gao, A. E., et al. (2019). Tropical cyclone damages in Mainland China over 2005–2016: losses analysis and implications. Environ. Dev. Sustain 21, 3077–3092. doi:10.1007/s10668-019-00481-7
Wu, L., Wang, B., and Geng, S. (2005). Growing typhoon influence on east Asia. Geophys. Res. Lett. 32. doi:10.1029/2005GL022937
Xiao, F. J., and Xiao, Z. (2010). Characteristics of tropical cyclones in China and their impacts analysis. Nat. Hazards 54, 827–837. doi:10.1007/s11069-010-9508-7
Xu, H., Xu, J., Liu, C., and Ou, N. (2020). Distinguishing characteristics of spring and summer onset El Niño events. J. Clim. 33, 4579–4597.
Yang, L., Du, Y., Wang, D., Wang, C., and Wang, X. (2015). Impact of intraseasonal oscillation on the tropical cyclone track in the South China Sea. Clim. Dyn. 44, 1505–1519. doi:10.1007/s00382-014-2180-y
Zandbergen, P. A. (2009). Exposure of US counties to Atlantic tropical storms and hurricanes, 1851–2003. Nat. Hazards 48, 83–99. doi:10.1007/s11069-008-9250-6
Zhan, R., Wang, Y., and Lei, X. (2011). Contributions of ENSO and EastEast Indian ocean SSTA to the interannual variability of northwest pacific tropical cyclone frequency. J. Clim. 24 (2), 509–521. doi:10.1175/2010jcli3808.1
Zhan, R., Wang, Y., and Wen, M. (2013). The SST gradient between the southwestern pacific and the western pacific warm pool: a new factor controlling the northwestern pacific tropical cyclone genesis frequency. J. Clim. 26, 2408–2415. doi:10.1175/jcli-d-12-00798.1
Zhang, Q., Wu, L., and Liu, Q. (2009). Tropical cyclone damages in China 1983–2006. Bull. Am. Meteorological Soc. 90, 489–496. doi:10.1175/2008bams2631.1
Zhang, W., Vecchi, G. A., Murakami, H., Delworth, T., Wittenberg, A. T., Rosati, A., et al. (2016a). Improved simulation of tropical cyclone responses to ENSO in the western North Pacific in the high-resolution GFDL HiFLOR coupled climate model. J. Clim. 29, 1391–1415. doi:10.1175/jcli-d-15-0475.1
Zhang, W., Vecchi, G. A., Murakami, H., Villarini, G., Delworth, T. L., Yang, X., et al. (2018). Dominant role of atlantic multidecadal oscillation in the recent decadal changes in western North Pacific tropical cyclone activity. Geophys. Res. Lett. 45, 354–362. doi:10.1002/2017gl076397
Zhang, W., Vecchi, G. A., Murakami, H., Villarini, G., and Jia, L. (2016b). The pacific meridional mode and the occurrence of tropical cyclones in the western North Pacific. J. Clim. 29, 381–398. doi:10.1175/jcli-d-15-0282.1
Zhou, B., and Cui, X. (2008). Hadley circulation signal in the tropical cyclone frequency over the western North Pacific. J. Geophys. Res. Atmos. 113. doi:10.1029/2007JD009156
Zung-Ching Goh, A., and Chan, J. C. L. (2010). An improved statistical scheme for the prediction of tropical cyclones making landfall in SouthSouth China. Weather Forecast. 25, 587–593. doi:10.1175/2009waf2222305.1
Keywords: tropical cyclone landfall frequency, thermocline temperature anomaly, long-range prediction, ocean heat transport, sea surface temperature, western Pacific subtropical high
Citation: Liu C, Zheng R, Jin L, Bao R, Cao N, Liao X, Xue Y, Chen H, Yang K and Su Q (2023) Long-range prediction of the tropical cyclone frequency landfalling in China using thermocline temperature anomalies at different longitudes. Front. Earth Sci. 11:1329702. doi: 10.3389/feart.2023.1329702
Received: 29 October 2023; Accepted: 28 November 2023;
Published: 29 December 2023.
Edited by:
Kevin Cheung, Nanjing University of Information Science and Technology, ChinaCopyright © 2023 Liu, Zheng, Jin, Bao, Cao, Liao, Xue, Chen, Yang and Su. This is an open-access article distributed under the terms of the Creative Commons Attribution License (CC BY). The use, distribution or reproduction in other forums is permitted, provided the original author(s) and the copyright owner(s) are credited and that the original publication in this journal is cited, in accordance with accepted academic practice. No use, distribution or reproduction is permitted which does not comply with these terms.
*Correspondence: Chunlei Liu, bGl1Y2xlaUBnZG91LmVkdS5jbg==; Ruijuan Bao, Zmp6aHRxc3lzQDE2My5jb20=; Ning Cao, bmNhb0BnZG91LmVkdS5jbg==