 Zhong Gao1
 Mingqing Huang
94% of researchers rate our articles as excellent or good
Learn more about the work of our research integrity team to safeguard the quality of each article we publish.
Find out more
ORIGINAL RESEARCH article
Front. Earth Sci., 22 January 2024
Sec. Geoscience and Society
Volume 11 - 2023 | https://doi.org/10.3389/feart.2023.1328421
Backfill of cemented waste rock into underground mined-out areas is an effective way to eliminate solid wastes and potential hazards in mines. To understand the backfill strength distribution law throughout the stope, similarity simulation experiments were conducted for direct-irrigating cemented waste rock backfill, and OpenCV and neural network were employed to analyze particle segregation and the spatial distribution of backfill strength. Results show that distinct gravitational segregation leads to an uneven and heterogeneous distribution of natural graded waste rocks in a similar model. Backfill strength near sidewalls and bottom of the model surpasses that of other areas. In the vertical direction, the average backfill strength increases with depth, ranging from 1.15 MPa at the topmost layer to 1.91 MPa at the bottommost layer. Horizontally, the average backfill strength near model boundaries is consistently higher than that at the model center, irrespective of the layer depth and orientation. Neural network prediction on spatial backfill strength proves reliable, exhibiting an average relative error of 4.12%, compared to the traditional surface fitting with a 10.20% error. Verification tests affirm the capability of the neural network model to accurately predict the anisotropic and nonlinear distribution of backfill strength in a large stope.
Mineral resources supply over 80% of industrial and 70% of agricultural raw materials worldwide. Waste rocks, generated as a by-product of mining, are typically stored in surface heaps, constituting a significant solid waste stream that consumes extensive land and poses risks of metal ion leakage. Mined-out areas are another potential hazard in underground mining. Therefore, the cut-and-fill method is widely employed in underground mining to optimize mineral resource recovery, enhance mining engineering stability, and control surface subsidence. It is a safe and environment-friendly mining method in metal mines (Li and Fall 2016; Li and Fall 2018). Among various backfill methods, cemented waste rock backfill stands out by combining the advantages of both waste rock and cemented mortar filling. In this way, waste rocks are transformed to cemented materials in backfilling of underground mined-out areas. Waste rocks are aggregated with cement slurry or cement mortar, creating a robust and cohesive filling structure. Cemented waste rock backfill is distinguished by its substantial filling capacity, high automation levels, straightforward filling techniques, and system simplicity. Consequently, it is well-suited for large-scale mined-out areas caused by efficient mining practices such as stage open stoping and subsequent filling. The main technical feature of stage open stoping and subsequent filling is that the ore body is mined in two steps: the preliminary stope is safely excavated under the self-stable state of the ore body and the backfill in this preliminary stope serves as the sidewalls of the secondary stope (Fu and Qiu, 2020). Thus, the filling body of the preliminary stope must meet the strength requirements for safe mining of the secondary stope. The backfill strength is usually used as a key indicator to assess the quality and stability of the filling body (Roshani and Fall 2020; Xu et al., 2020). However, due to factors such as the viscosity of the filling slurry, the complexity of the filling boundary, and the segregation of waste rocks, the backfill strength is not uniformly distributed throughout the stope. This non-uniform distribution poses challenges in ensuring the stability of filling body in larger stopes (Cong et al., 2007; Ruan et al., 2022). Therefore, understanding the strength distribution pattern of the filling body in the stope provides a crucial theoretical basis for backfill strength design. It also enhances the robust support for secondary stopes, contributing to the overall stability of the mining structure.
The research on backfill strength worldwide mainly focuses on the influence of the ratio of filling materials on backfill strength (Cuthbert et al., 2013; Liu et al., 2018; Liu et al., 2019; Huang et al., 2022) and the design of backfill strength (Li, 2013; Cao et al., 2015; Wu et al., 2016; Zhao et al., 2019; Wu et al., 2021). Comparatively less emphasis has been placed on understanding the spatial distribution law of backfill strength. Investigations in this aspect typically involve theoretical analyses, similarity simulation experiments, and in-situ coring. Notably, among these methods, similarity simulation experiments are considered to be the best way to reflect the spatial distribution law of backfill strength. Chen et al. (2017) studied the uniaxial compressive strength of cemented tailing filling body in different positions of a stope from macro and micro perspectives based on a similarity simulation experiment and found the uniaxial compressive strength of cemented tailing backfill gradually decreased from the bottom to the top. Li et al. (2018) considered that the strength of cemented filling body was significantly uneven in the longitudinal, transverse, and vertical directions through the similarity simulation experiment. Likewise, Jia et al. (2022) studied the strength spatial distribution of different graded tailings backfill from horizontal and vertical directions with a similarity simulation experiment and proposed that the pore number within the backfill is important for backfill strength.
Scholars have frequently investigated the segregation mechanism of waste rocks and the spatial distribution of backfill strength as two independent research topics, without integrating them organically. However, by taking the waste rock segregation rule as a basis to verify the internal law and order of the waste rock distribution in a similar model, it not only ensures the cement slurry be arranged according to the waste rock segregation situation, but also enhances the research conclusions of the similar simulation experiment of cemented waste rock backfill.
As mentioned, research with regards to backfill strength based on similarity simulation experiments effectively infers the mechanical phenomena within the stope. However, most preliminary studies have focused on the strength distribution law of similar models from a one-dimensional or two-dimensional direction. Due to the complex mechanism between factors affecting the backfill strength, it is difficult to establish an accurate functional relationship through regression equations to predict backfill strength (Feng et al., 2020). The neural network is advantageous in predicting nonlinear systems by establishing a nonlinear mapping relationship between spatial position and backfill strength and improves the prediction accuracy of backfill strength. Qi et al. (2018) used a BP neural network to predict the backfill strength under the influence of tailings type, cement-sand ratio, and curing time. Ji et al. (2021) successfully achieved high-precision prediction of indoor backfill strength using a BP neural network. Recently, Qi et al. (2023) established a global dataset of unconfined compressive strength of cemented paste backfill comparing 986 samples and confirmed that a deep neural network can accurately predict the backfill strength in tailing disposal. Therefore, the neural network model training based on the strength test values of similarity simulation experimental samples can not only predict the missing data in similarity simulation experiments but also effectively improve the prediction accuracy of the model for backfill strength.
This work aims to explore the segregation mechanism of waste rock movement using image processing technology and understand the spatial distribution of cemented waste rock backfill strength in a similar large stope. Firstly, waste rock segregation experiments were carried out, and particle size distribution of the waste rock was quantitatively characterized by image processing technology. The internal law and order of the waste rock movement were studied by analyzing the segregation law. Secondly, based on the segregation law of waste rock, the similar simulation experiments of cemented waste rock backfill were carried out. It involved analyzing the seepage law of cement slurry and examining the spatial distribution law of backfill strength in different areas of the model. Thirdly, the strength fitting curved surface of each layered backfill body was drawn to study the spatial distribution law of backfill strength throughout the similar model. Finally, the strength test values from similarity simulation experiments were used as training samples, and BP neural network was introduced to train the model of test values. The average relative error of neural network and surface fitting was compared and analyzed, and the spatial distribution law of backfill strength was revealed from vertical and horizontal directions. The spatial distribution laws of backfill strength of cemented waste rock backfill were measured and predicted through similarity simulation experiments and BP neural network predictions.
(1) Waste rock and cement
The waste rocks were sampled from the surface waste rock dump of Changtian gold mine in southwest China. Waste rocks had a whole grain size of −100 mm (Figure 1), and the rock types were mainly marl and mudstone. After cutting, crushing, and sieving, the physical and mechanical properties of the waste rocks were tested, as shown in Table 1. The cementing material is M32.5 ordinary Portland cement (Zhenfeng Rendu Cement Co., Ltd.), as shown in Table 2.
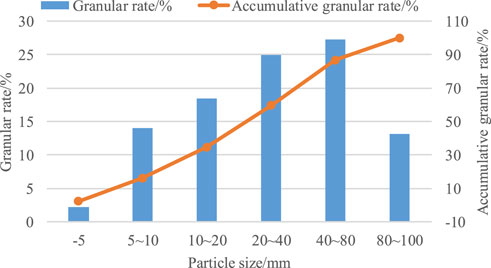
FIGURE 1. Particle size distribution of waste rocks.
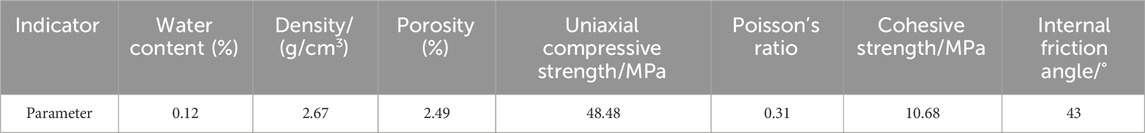
TABLE 1. Physical and mechanical properties of waste rock.
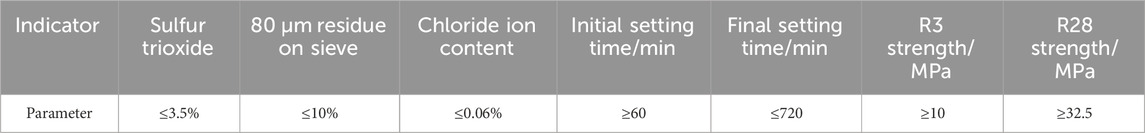
TABLE 2. Technical parameters of M32.5 ordinary Portland cement.
(2) Similar model
The segregation test of waste rock and the similarity simulation experiments of cemented waste rock backfill were conducted using a self-made Polyvinyl Chloride (PVC) model. This model was designed to simulate the spatial distribution characteristics of the strength of cemented waste rock backfill in a large stope. Changtian gold mine has stage open stoping and subsequent backfill, with a stope height of 40 m. Preliminary stope structure parameter is length×wide×height = 20 m ×12 m×40 m, the footwall of the ore body is inclined at 40°, and the slope of the mining area is 62.5 m. If the scale ratio between the model size and the actual size of the mining site is 1:100, itleads that the model has an inclination angle of 40° and each side length of 200 mm × 120 mm × 625 mm oblique cube model. However, in order to study whether a targeted cement grout arrangement can effectively alleviate the adverse effects brought by waste rock segregation, a larger cube similar simulation model with length×width×height=500 mm×450 mm×625 mm was designed to carry out the experiments (Figure 2A). The model was made of PVC with a thickness of 5 mm. The upper surface of the model was left empty, and the rest of the plates were fixed by slots and glue. Before the test, they were fastened by thin steel plates and screws. Filter mesh and a drain hole were set at the bottom of the model to improve the strength of the filling body by promoting the condensation and solidification.
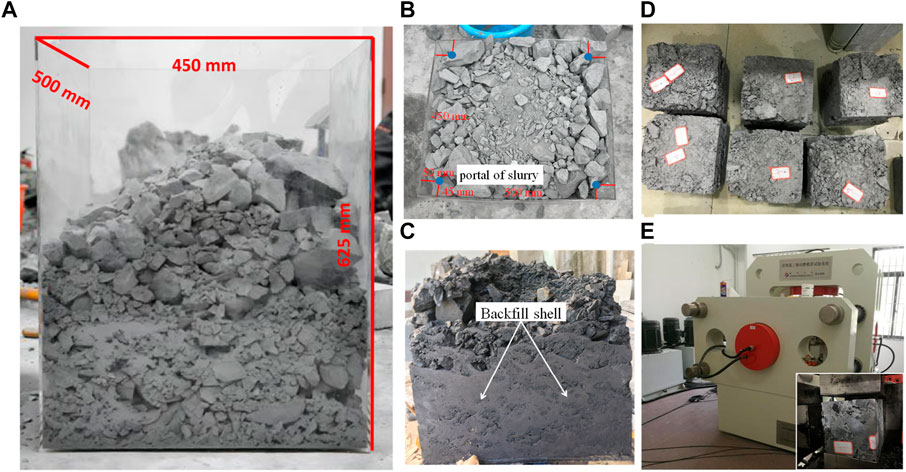
FIGURE 2. Similarity simulation model and experimental flow chart. (A) Similarity simulation model preparation. (B) Top view of similarity model. (C) Model disassembly after 28 days. (D) Backfill sample cutting. (E) Backfill strength test.
The mine employs a direct-irrigating cemented waste rock backfill, and the filling borehole above the stope is designed near the stope sidewalls. According to the geometric similarity principle, the slurry distribution ports of the similarity simulation experiment model are strategically placed at the four corners of the model, with distances from the boundary set at 45 mm and 50 mm, respectively.
(1) Process of waste rock segregation experiments.
1) Lower −100 mm waste rock into the model through a simulated filling well above the model and record the quantity of each drop of waste rock. Take photos of the waste rock heap using Canon EOS 700D at the top of the model after every two drops of waste rock and record the changes in the appearance of the waste rock heap. The photos have approximately eight million pixels and a solution of 3,456×2,304.
2) After filling the similar model with waste rocks in step 1, remove the waste rocks and set the model to its initial state, then repeat step 1 for another set of waste rock segregation tests. The first group of experiments accumulated 213.7 kg of waste rock, and the second group of experiments accumulated 207.3 kg of waste rock.
3) Two sets of 12 images taken by Canon EOS 700D were cropped and extracted using image processing technology. The images of the two sets of waste rock segregation experiments were then processed using OpenCV (Dai et al., 2022).
(2) Image processing by OpenCV
1) Image partitioning
During the similarity simulation experiment, waste rock particles with different shapes, particle sizes, and weights move downward due to gravity and are squeezed and collide, so that the naturally graded waste rocks with coarse particle sizes and fine particle sizes are gathered in different areas. OpenCV is capable of quantitatively identifying waste rock fragments and then analyzing the rock segregation. Firstly, the OpenCV is used to binarize the top view of the waste rock heap (Figure 3A), and the outline of the waste rock is extracted to obtain the OpenCV processing map of the surface of the waste rocks (Figure 3B).
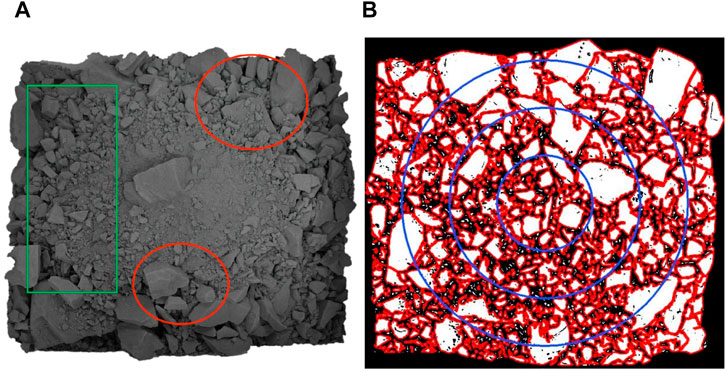
FIGURE 3. Solid diagram and OpenCV processing diagram on the top of the waste rock heap [red line in (B) refers to the outline line of waste rocks, white area refers to the surface area of each waste rock]. (A) Size distribution map at the surfacetop of waste rock heap (B) OpenCV processing map of 200 the surfacetop of the waste rock heap.
To analyze the particle size distribution of waste rocks in the middle and surrounding areas of the waste rock heap, the image was partitioned and three concentric circles with a radius ratio of 1:2:3 were drawn at the center of the image (Figure 3B). Four regions with the waste rock heap and three concentric circles as boundaries were obtained (Figure 4), and the changes in particle size distribution of waste rocks were compared as the boundary gradually approached the surrounding area of the waste rock heap.
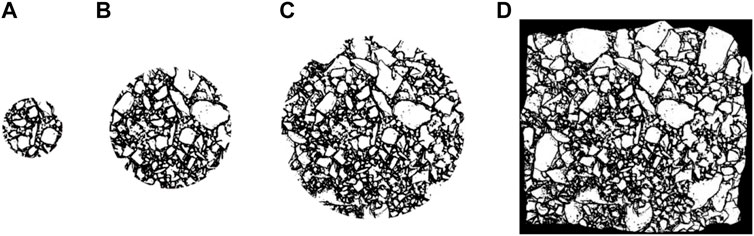
FIGURE 4. Diagram of each area on the surface of the waste rock heap. (A) Region Ⅰ (B) Region Ⅱ (C) Region Ⅲ (D) Region Ⅳ.
There is an inclusion relationship between the partitions (Figure 4). The partitions enclosed by the large concentric circle contain the partitions of the small concentric circle. The distribution law of waste rock is measured in the center and surrounding areas by studying the particle size distribution law of each partition. However, waste rocks located near the partition boundary are cut by concentric circles in the partition. Therefore, if the images of each partition are directly output on the basis of the original image for contour recognition and calculation, it will cause significant errors. It is necessary to further define the problem of waste rock partition attribution.
2) Maximum particle size algorithm
The diameter of the convex polygon is the maximum distance between any two points on the convex polygon, so for the size of waste rock, its diameter is the maximum distance between two points in the contour. On the one hand, in the OpenCV library, only the contourArea and arcLength functions can be used to calculate the area and perimeter of the extracted contour, respectively, and there is no function to directly calculate the diameter of the polygon. On the other hand, although the particle size is usually proportional to the contour area of the waste rock, the approximate contour area can be used as a classification indicator for particle size. The contourArea function within OpenCV relies on the underlying principle of utilizing Green’s formula for area calculation. The fundamental requirement for applying Green’s formula is that the contour is closed and oriented in a forward manner. Additionally, the integrand function must exhibit continuity within the plane region where it is situated. Hence, the contourArea function presents an issue in not accurately calculating the contour area for certain contours.
Therefore, it is necessary to write algorithms suitable for measuring the particle size of waste rocks based on the image processing library. The input of this function is the contour coordinate points returned by the findContours function, and the output is the contour diameter (the maximum distance between two points). The specific algorithm is as follows:
1) Initialize the distanceMax variable to store a maximum particle size value of 0.
2) Start with the starting point of the contour list.
3) Traverse the other coordinate points and calculate the Euclidean distance between the starting point and the traversing point in sequence. If it is greater than distanceMax, update distanceMax using this Euclidean distance.
4) Replace the next point as the starting point and repeat step 4).
5) Output distanceMax.
The schematic diagram of this algorithm is shown in Figure 5. This figure takes the square “diameter” with a side length of 1 as an example. Firstly, starting from point O, the Euclidean distances of OA, OB, and OC are calculated in sequence. After calculation, distanceMax is updated to √2 when OB is used. Take point A next to point O as the start and calculate the Euclidean distances of AB and AC in sequence. Since these two-line segments are not greater than √2, the distanceMax value remains unchanged. Finally, use point B as the starting point to calculate the Euclidean distance of BC. After completing three rounds of calculations, the output distanceMax value is √2, which means the “diameter” of the square is √2.
3) Partition membership problem
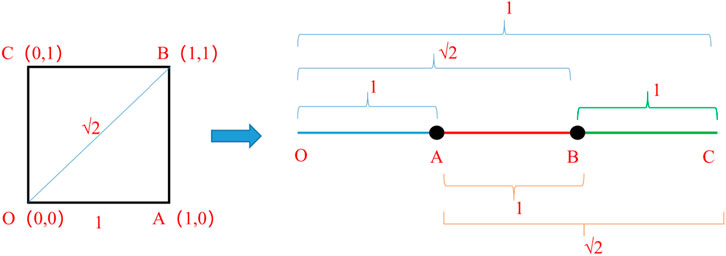
FIGURE 5. Schematic diagram of the algorithm for traversing the particle size of waste rocks. Normalize the particle size of waste rocks using 20%, 40%, 60%, and 80% of the maximum contour particle size of all waste rocks as boundary points, and divide the particle size distribution into five particle size distribution ranges: 0–0.2, 0.2–0.4, 0.4–0.6, 0.6–0.8, and 0.8–1.
Waste rocks located at the partition boundaries are divided into two parts (Figure 6A). Hence, during image processing, it is advisable to process the entire image as a whole rather than handling individual images for each partition separately. For the waste rock on the boundary point, the midpoint coordinate between the two points corresponding to the maximum particle size is employed as the basis for judging the membership of the waste rock partition. The schematic diagram of waste rock region is shown in (Figure 6B). Taking a circle as an example, the midpoint between the two points corresponding to the maximum particle size is the circle center, such as circles B, C, and D. Even if located on the boundary of the region, B can be divided into the left area based on its center position, and circles C and D can be divided into the right area.
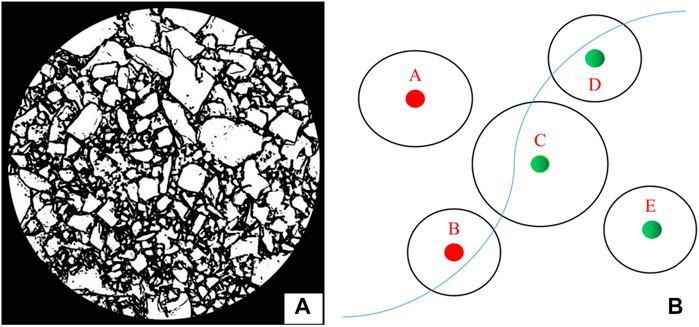
FIGURE 6. Waste rock partition: (A) Waste rocks at partition boundaries, (B) Partitioned affiliation of waste rocks.
Direct-irrigating cemented waste rock backfill refers to directly irrigating prepared cement slurry onto the waste rock heaps within the stope through filling boreholes. To improve the cemented quality, extra cement slurry is supplemented every 5 m of waste rock layer. The cement slurry penetrates into the depth due to gravity and aggregates the waste rock layer. To investigate whether a targeted cement slurry arrangement can effectively alleviate the adverse effects of waste rock segregation, the cement slurry is lowered from around the model. The process of the direct-irrigating cemented waste rock backfill is as follows:
(1) -100 mm full-size waste rock is laid down to the stope center through a simulated small filling shaft above the mode.
(2) The gaps around the waste rock heap are filled with waste rock in full particle size of −100 mm, and the whole model is filled with a total of 236.8 kg waste rock.
(3) The water-to-cement ratio of 1.22 and cement-to-waste rock ratio of 0.11 is recommended in the previous filling ratio test. According to this ratio, 31.78 kg of water and 26.08 kg of cement are weighed, and the uniform cement slurry is prepared by JW350 flat mixer at a speed of 13 R/min.
(4) Around the model (1/10 of the boundary), the cement slurry is irrigated through a simulated filling borehole by means of a discharge funnel (250 mm and 10 mm in diameter for the upper and lower openings, respectively). The designed filling flow in Changtian gold mine is 41.8 m3/h, and the feeding rate of cement slurry is calculated as 2.79 L/min according to the Froude similarity criterion.
(5) Filling body is cultured under standard curing conditions at (20 ± 2)°C and >95% humidity. After curing for 28 days, the PVC plate is carefully disassembled, and the filling body is cut into a number of 100 mm×100 mm×100 mm cube standard test blocks according to different depths and horizontal distances. All blocks are marked with sequential numbers.
(6) According to the Standard for Test Methods of Engineering Rock Masses (GBT 50266-2013) and the method recommended by the International Commission on Rock Mechanics (International Society for Rock Mechanics, ISRM), the uniaxial compressive strength of backfill is tested by QKX-ZSZ-4000 true triaxial dynamic and static loading test system (Qingdao Qiankunxing intelligent technology Co., Ltd.).
Engineering cases reveal that segregation occurs during the loading of waste rocks into the stope, leading to uneven infiltration and cementation during the penetration of cement slurry. This results in the heterogeneity of the spatial distribution of backfill strength. Due to the use of a low cement-to-sand ratio, achieving complete cementation among rocks becomes difficult. Hence, based on the results of the similarity simulation experiment, a BP neural network is introduced to predict the spatial distribution law of backfill strength in the large stope.
The multi-layer BP neural network structure comprises an input unit, an output unit, and one or a plurality of hidden layers; the main principle is based on an error back propagation algorithm. The multilayer BP neural network learns the mapping relationship implied by the input and the output in a training sample without describing the mapping relationship through a mathematical equation in advance and has good nonlinear learning ability. In addition, it efficiently and accurately solves the problem of nonlinear regression prediction and has high reliability in predicting the backfill strength.
Considering the size of the similar model is 500 mm×450 mm×625 mm, and the sampling size of the filling is 100 mm×100 mm×100 mm, the model is vertically divided into six layers (Z1∼Z6) from the bottom up. A total of 16 filling blocks are obtained (Figure 7).
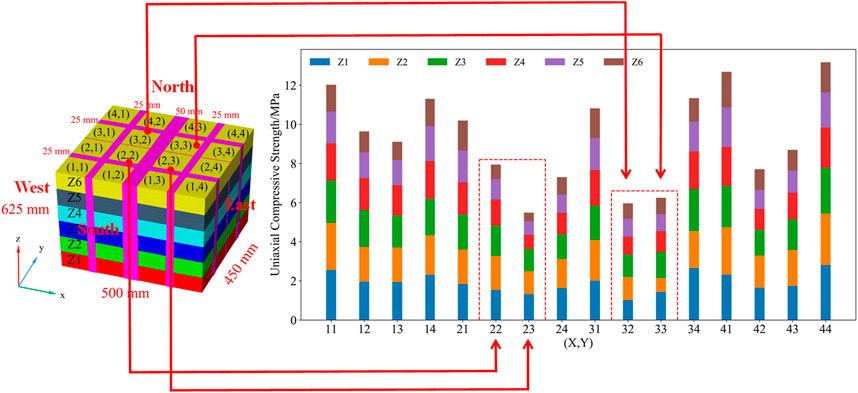
FIGURE 7. Backfill sampling and sequencing in the similar model.
In the BP neural network, a four-layer feedforward network structure with feedback is constructed using Keras. The architecture consists of an input layer, two hidden layers, and an output layer, all fully connected. The input layer, represented by X, Y, and Z, denotes the position of the sample in the model space, resulting in three units in the input layer, while the output layer represents the uniaxial compressive strength of backfill.
After multiple iterations and adjustments, the number of units in the two hidden layers was finalized as 24 and 12. To prevent gradient dispersion and accelerate training, Rectified Linear Unit (ReLU) is employed as the activation function, defined as Relu(x)=max (x, 0). The loss function adopts mean squared error, and the model’s predictive ability is assessed using Mean Absolute Error (MAE).
Based on the above particle size distribution range, contour extraction, area calculation, and classification statistics are performed on the four regions respectively, and the particle size distribution table of each region could be obtained (Table 3; Table 4).

TABLE 3. Particle size distribution at each region (first group).
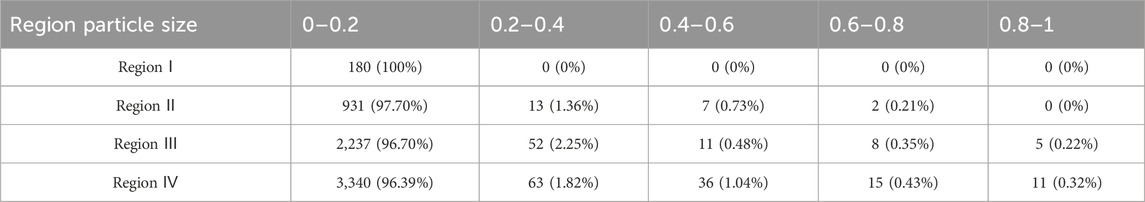
TABLE 4. Particle size distribution at each region (second group).
Table 3 and Table 4 show that, firstly, the particle size of the waste rock at each region is mainly distributed in the range of 0–0.2, indicating that most of the waste rock surface area is less than 20% of the maximum area. Secondly, the particle size range of the waste rock in region I is all within 0–0.2, the particle size range of the waste rock in region II is mainly in the range of 0–0.2, and the particle size of the waste rock in region IV is distributed in all five particle size ranges. With a gradual increase of the region range, the upper limit of particle size gradually increases to a certain extent. It indicates that the particle size of the waste rock around the top waste rock heap is large. Finally, with the gradual increase of the region range, although the number of waste rocks in 0–0.2 particle size range gradually increased, the proportion of the two groups of experiments decreases from 100% to 96.87 in Region I and 96.39% in Region IV. It indicates that with the increase of regional range, the newly added coarse waste rock dilutes the proportion of fine waste rock. Additionally, waste rock particle size at the top center of the heap is relatively small, and the surrounding waste rock particle size is larger than that in the center. Similar spatial distribution law of waste rocks is consistent with a field observation at Kidd Creek mine. Fine particles are detained near the filling shaft where cemented rock backfill is applied, while coarse particles tend to gather near stope sidewalls.
When waste rocks roll along the slope surface of a waste rock heap, grooves are formed between large particles and the slope. Small particles, with lower mass and kinetic energy, experience resistance when encountering these grooves, leading to restricted movement distance. As shown in Figure 3, the green area has fewer large particles, allowing small particles to flow over a greater distance. In contrast, the red area shows large particles forming uneven grooves on the heap surface, hindering the continuous flow of small particles.
The similar model height is far lower than that of onsite stope, and the internal porosity of −100 mm full-size waste rock heap is higher than 50%. Therefore, there is no noticeable occurrence of interlayer extrusion and deposition phenomenon under the natural graded waste rock in the similar model. The cement slurry penetration channel is smooth; it quickly penetrates to the model bottom even with a slight flow rate. At the top of the model, since the cement slurry outlets are distributed around the surface of the model, the transverse penetration distance of the cement slurry at the top of the waste rock heap is limited, and the interactive period between cement slurry and waste rocks at the top is short. This results in incomplete contact of certain waste rocks and cement slurry and a suboptimal cementation effect. The model’s bottom serves as an impermeable layer, similar to the on-site stope floor, causing cement slurry to gradually accumulate at the model bottom due to gravity. Hence, the contact time and contact area between cement slurry and waste rocks therein are maximized, resulting in higher cementation strength at the bottom. In addition, the sidewalls of the filling body after formwork disassembly reveal a distinctive honeycombed pattern above the cemented saturation line. In this zone, the cement content and cementation effect are inferior compared to those below the cemented saturation line.
Additionally, since the seepage of cement slurry is suspended at model sidewalls, waste rock particles near sidewalls have a longer contact and cementation time with cement slurry, and finally form a “backfill shell” with high integrity and strength. In the stage open stoping and subsequent backfill, sidewalls of secondary stopes are equivalent to PVC glass in the similarity simulation experiment. The stope sidewall, characterized by small pores and good integrity, facilitates thorough contact between the cement slurry and nearby waste rocks nearby. This tendency promotes the formation of a “backfill shell” with intact shapes and higher backfill strength (Figure 2C).
Due to the gravity segregation of natural graded waste rocks, coarse rocks tend to roll near the stope sidewalls and fine particles are gathered at the stope center. There is little cohesion among waste rock particles before cementation, making the waste rock heap a loose medium with large porosity. Especially if stope sidewall areas are not filled with enough intact coarse particles, sufficient supporting provided by cemented waste rock backfill at the preliminary stope may fail in mining the secondary stope. As shown in Figure 8, the sidewall areas and “backfill shell” at the preliminary stope play a role of contact and lateral support for the secondary stope, regardless of the relatively low backfill strength at the central preliminary stope. The cemented waste rock backfill forms a complete support structure and turns the stress state of the secondary stope from uniaxial or biaxial to biaxial or triaxial. In this case, the self-stabilization ability of the unmined ore body is enhanced, and the sudden instability and chain failure of surrounding rocks are avoided. Therefore, the “backfill shell” with high strength formed between preliminary and secondary stopes provides a reliable support for successive mining. Additionally, the stable backfill shell allows lower backfill strength in the central area of the stope, which is conducive to reducing cement consumption and filling costs.
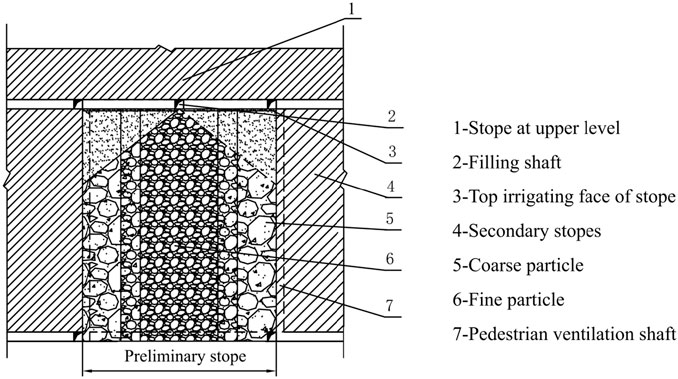
FIGURE 8. Coarse particles gather near sidewalls and fine particles remain in center areas due to gravity segregation of waste rock in stope.
The filling body in the similar model is cultured for 28 days under standard culturing environment conditions before sampling and testing for uniaxial compressive strength. The similar model is segmented into six layers, each 100 mm height from the bottom upwards. The top layer Z5∼Z6 has relatively less cement content and poor cementation effect and is partially unstable due to the cutting vibration of the bottom layer Z1∼Z4. The uniaxial compressive strength results of 100 mm×100 mm×100 mm backfill blocks of Z1∼Z6 layers are shown in Table 5.
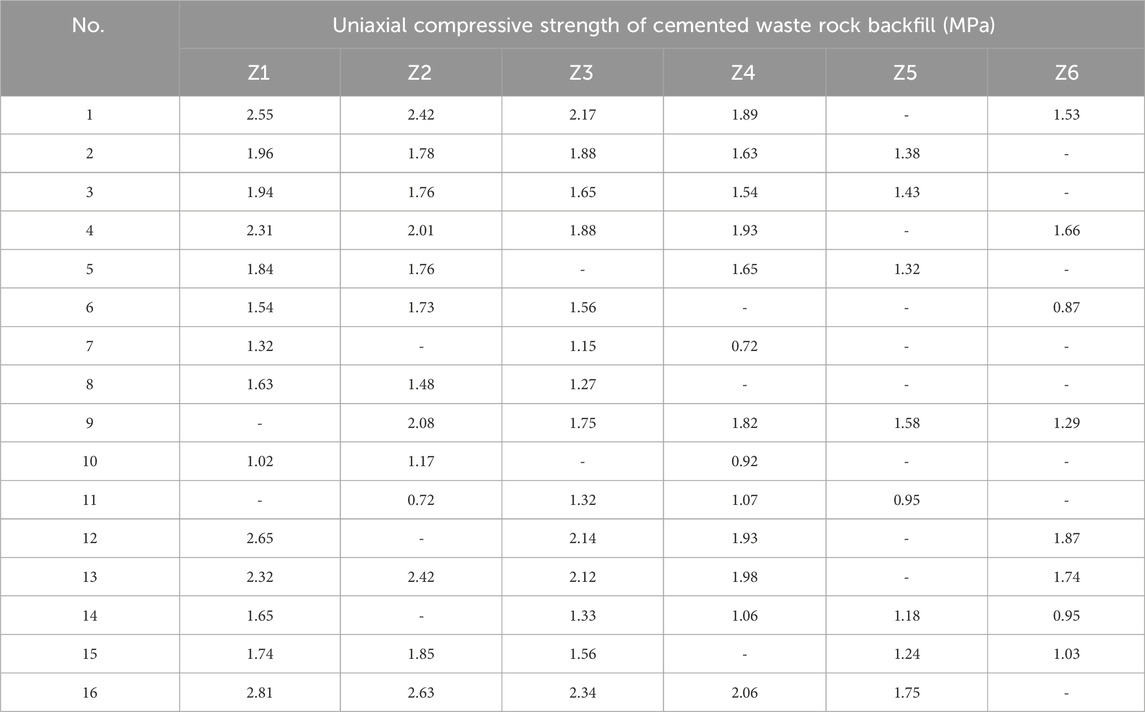
TABLE 5. Tested backfill strength in different positions in the similarity simulation experiment of direct-irrigating cemented waste rock backfill.
According to Table 5, the least square method is used to fit the surfaces of Z1∼Z4 layers with many samples, and the uniaxial compressive strength regression equations of Z1∼Z4 layers of waste rock cemented backfill specimens are obtained as Eqs 1–4):
where σZ1, σZ2, σZ3, and σZ4 are, respectively, the uniaxial compressive strength of waste rock cemented backfill at Z1, Z2, Z3, and Z4 layers, MPa; x is the distance along the direction of AB (EF) from origin point A (E) at front of the model, dm; y is the distance along the direction of AD (EH) from origin point A (E) at the side of the model, dm.
The fitting surface (Figure 9) of the backfill strength at Z1∼Z4 layers shows that the backfill strength at the sidewalls and model bottom is higher than that of other areas, and the backfill strength below four slurry irrigation outlets is higher than that of other areas in the same layer, while the backfill strength in the central is lowest regardless of any layer. The backfill strength at the bottom of the preliminary stope and its contact area with the secondary stope is higher, while the backfill strength in the middle section is lower. This phenomenon of the high strength of “backfill shell” due to the segregation of waste rock particles meets the design requirements of backfill strength in different positions of on-site stopes.
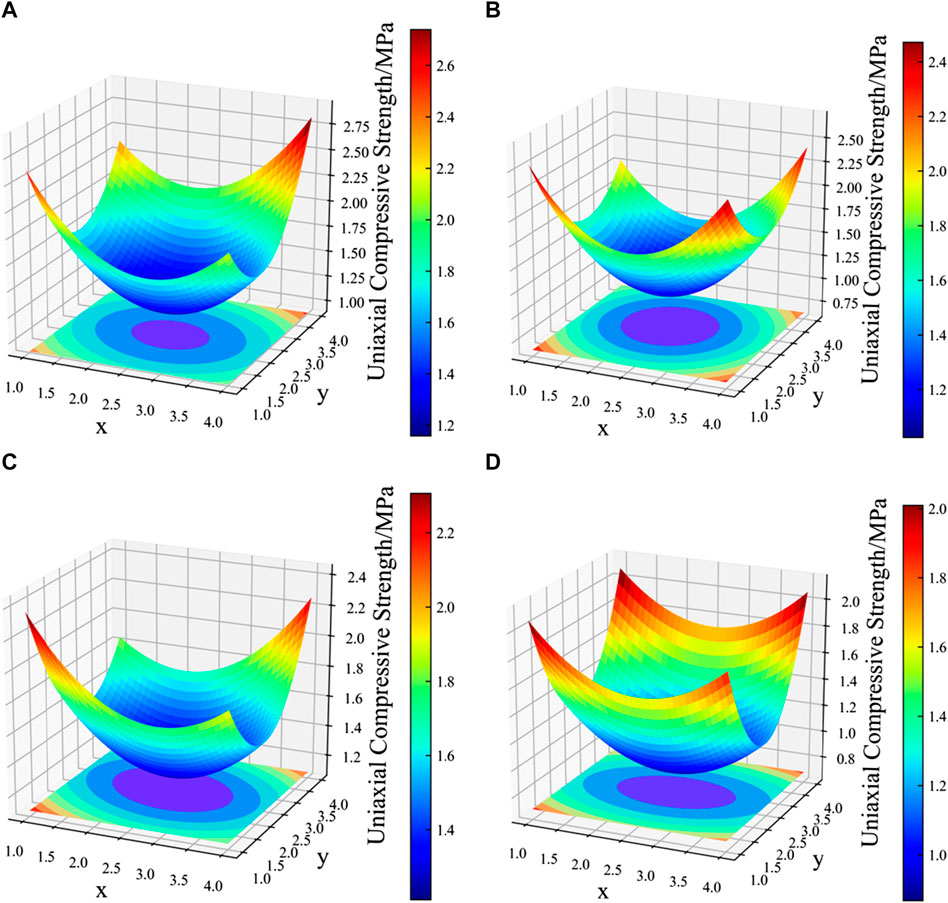
FIGURE 9. Strength fitting curves of cemented waste rock backfill at (A) Z1 layer, (B) Z2 layer, (C) Z3 layer and (D) Z4 layer in similarity simulation model.
Constrained by the scale of the similarity simulation and the limited number of backfill samples, the average relative error between the surface fitting results and the measured strength of Z1∼Z4 layers of cemented waste rock backfill is about 10.20%. The traditional mathematical method proves ineffective in accurately predicting the backfill strength at Z5 and Z6 layers, indicating a weak generalization ability. Fortunately, BP neural network is introduced to train data at Z1∼Z4 layers to reduce the relative error of backfill strength prediction at Z1∼Z4 layers and improve the generalization ability of backfill strength prediction at Z5∼Z6 layers, thus reliably predicting the strength distribution characteristics of backfill throughout the large stopes with high section height.
(1) Model training
To avoid overfitting of the neural network to training data and reduce the generalization performance, the backfill strength at Z1, Z2, Z3, and Z4 layers with more samples is chosen as test value (Table 6), and the strength at Z5∼Z6 layers with less samples is taken as test set to obtain 54 groups of neural network training samples (Table 7). The input of the sample is the spatial coordinate of the sample according to the coordinate axis in Figure 7, and the output is the uniaxial compressive strength of the sample.
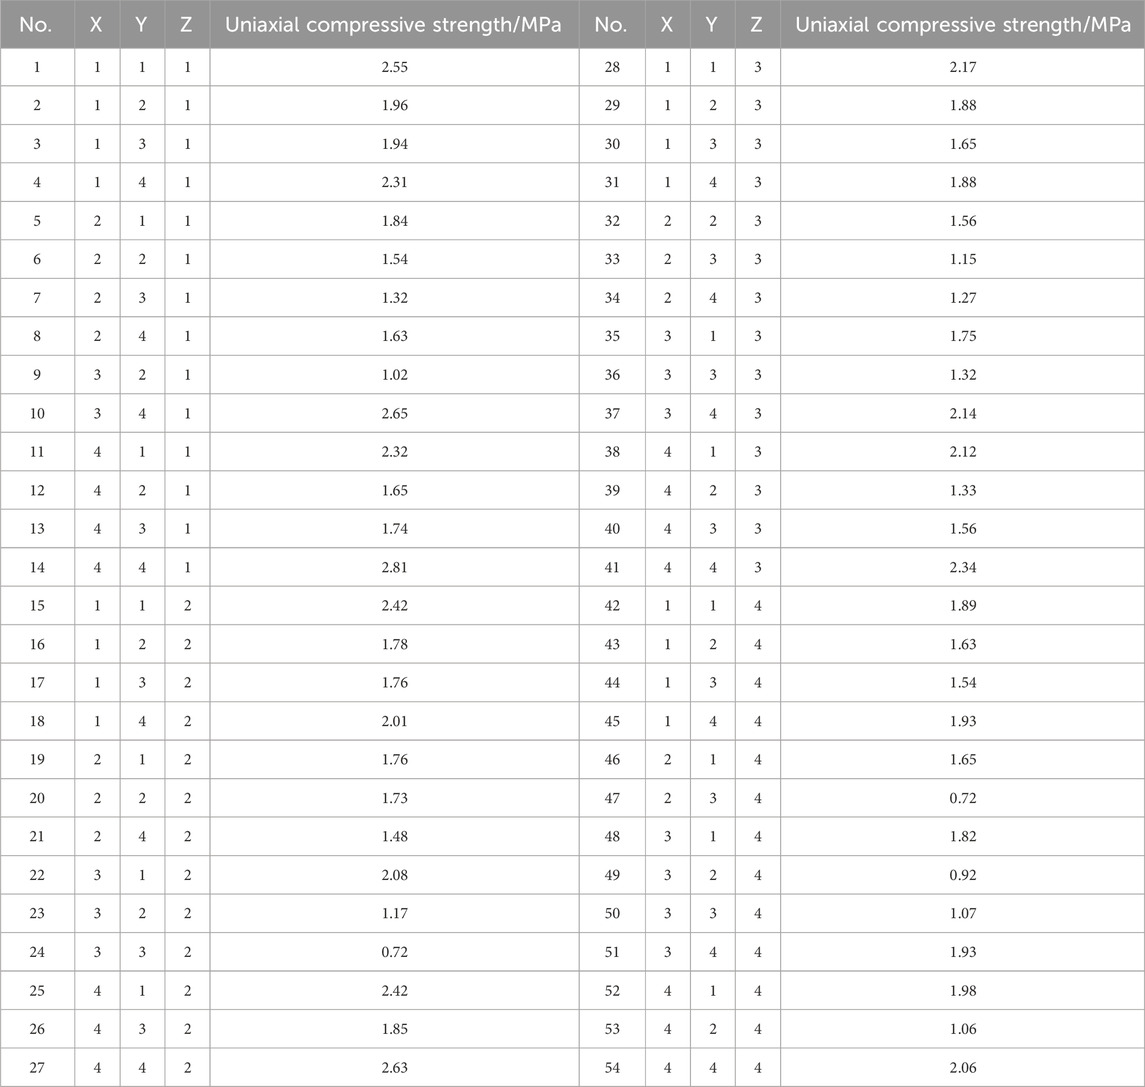
TABLE 6. Neural network training samples of cemented waste rock backfill strength.
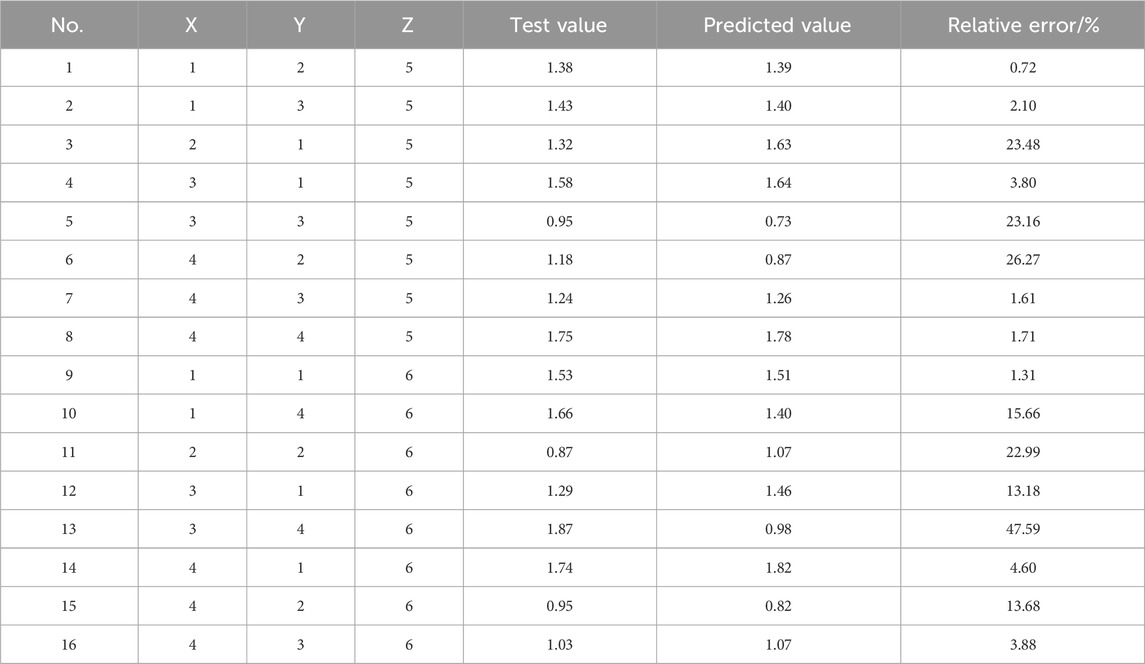
TABLE 7. Relative error of cemented waste rock backfill strength in neural network validation.
The neural network model is constructed based on the training samples to predict the backfill strength. In the model training process, the MAE index is used to optimize the neural network parameters, and the MAE curve is smoothed by the exponential smoothing method to obtain a smooth error function curve. The relative error between the error function after neural network training and the predicted value of each sample is shown in Figure 10. Figures 10A,B suggests that MAE converges below 0.1 when the training iteration is 1,000 times, while Figure 10B suggests that the relative error of the predicted value of each sample is basically lower than 8%, and the average relative error is as low as 4.12%, indicating a good learning effect on the training samples. Therefore, compared with the curved surface fitting method for the backfill strength at each layer in the similarity simulation experiment, the neural network model improves the accuracy of backfill strength prediction in the stope, and the average relative error of the training sample prediction is reduced from 10.20% to 4.12%.
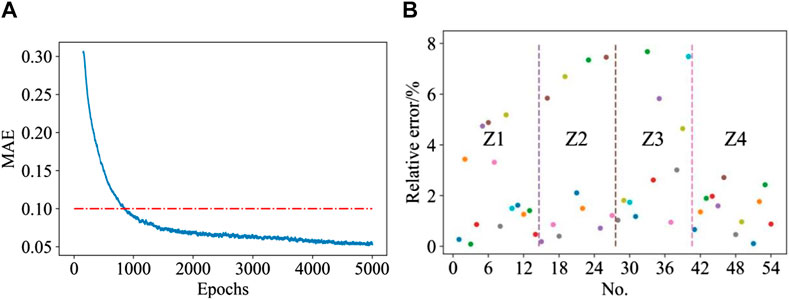
FIGURE 10. Absolute error (A) and relative error (B) in predicting backfill strength of the similarity simulation experiment with neural network model.
To verify the accuracy of BP neural network model, 16 groups of strength test values at Z5∼Z6 layers in Table 5 are selected as the test set, and the trained neural network model is used to predict the test set. According to the test value, predicted value, and relative error of each sample in the test set (Table 7), the average relative error of the training set is calculated to be 12.86%, indicating that the established neural network model for backfill strength prediction has good generalization ability.
(2) Model prediction
The trained neural network model is used to predict 32 groups of samples at Z5 and Z6 layers, and prediction results are shown in Table 8. Based on the prediction results, the Gaussian elimination method is chosen to fit the multivariate quadric surface of the prediction results at Z5 and Z6 layers (Figure 11). Fitting surface implies that the cemented backfill strength at each layer is featured by high strength near sidewalls and low strength in central areas.
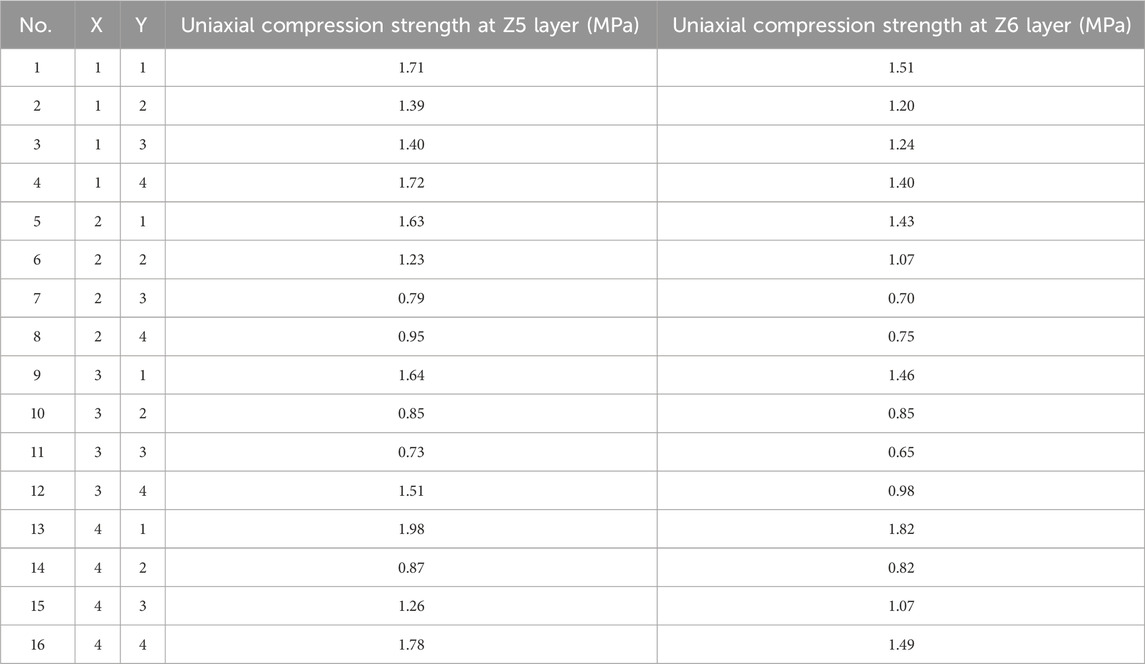
TABLE 8. Prediction results of cemented waste rock backfill strength at Z5 and Z6 layers based on neural network.
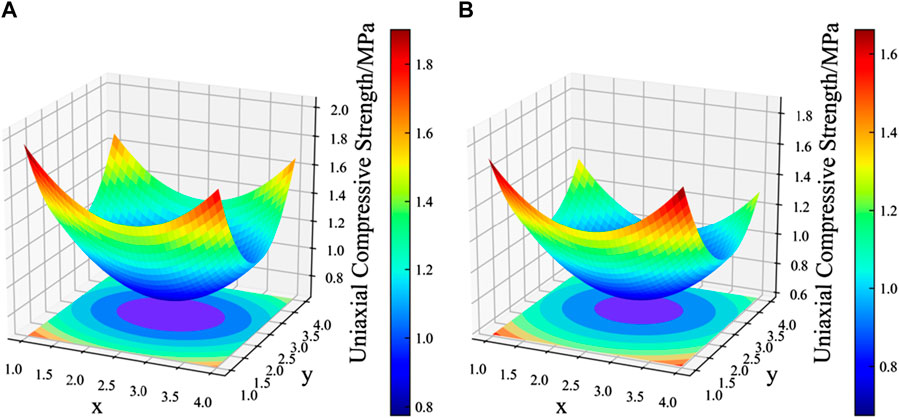
FIGURE 11. Fitting surface of cemented waste rock backfill strength at (A) Z5 layer and (B) Z6 layer based on neural network model prediction.
Combining the tested backfill strength in similarity simulation experiments and prediction values by neural network model, the strength distribution of the “backfill shell” and the distribution law of filling body in vertical and horizontal directions are further studied.
(1) Backfill strength throughout the similar model
The backfill strength accumulation histogram of the similar model with a size of 500 mm×450 mm×625 mm is obtained (Figure 7). It shows that the average backfill strength near model sidewalls is 1.73 MPa, which is higher than that of the central area (1.08 MPa). With respect to the “backfill shell” (11, 12, 13, 14 or 11, 21, 31, 41, etc.) formed at model boundaries, the average strength of the east, west, south, and north parts is 1.80 MPa, 1.91 MPa, 1.79 MPa, and 1.75 MPa, respectively, which is higher than that of the central area. In addition, backfill strength increases as depth from model upper surface increases, and backfill strength at deeper layers is higher than that at shallower layers in the same coordinate.
Furthermore, backfill strength distribution of the “backfill shell” at four sidewalls (Figure 12) indicates a distribution law of “double hook function” (f(x) =ax+B/x (x>0)). Again, it confirms that backfill strength at the stope bottom and sidewalls is greater than in other areas.
(2) Backfill strength distribution in vertical and horizontal directions
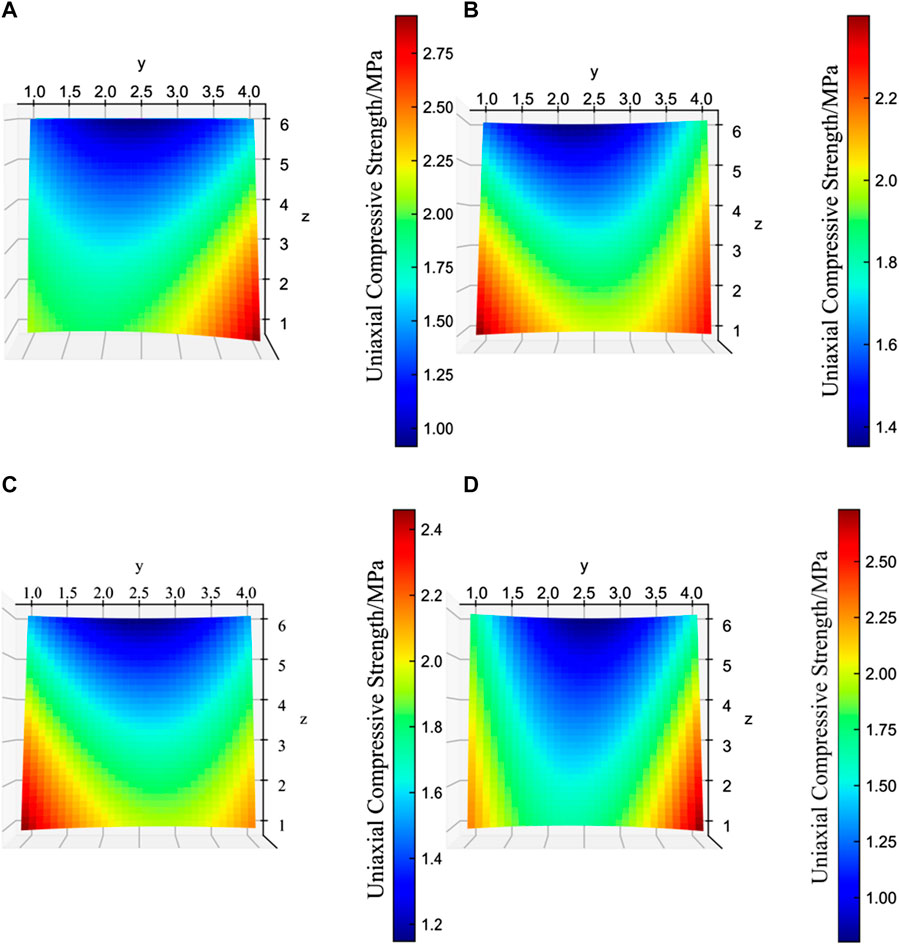
FIGURE 12. “Backfill shell” strength distribution in similar model in the perspective of four directions. (A) East sidewall (450 mm × 625 mm), (B) West sidewall (450 mm × 625 mm), (C) South sidewall (500 mm × 625 mm) and (D) North sidewall (500 mm × 625 mm).
The similar model is divided into Z1∼Z6 layers from bottom up, and the distribution law of cemented waste rock backfill strength in the vertical direction can be obtained by taking the average value of tested strength or predicted strength at each layer, as shown in Figure 13A. Backfill strength generally increases with the increase of the depth in the similar model, and the average strength gradually increases from 1.15 MPa at the topmost Z6 layer to 1.91 MPa in the bottommost Z1 layer. The vertical backfill strength distribution is primarily characterized by the gradual flow and deposition of cement slurry towards the lower part of the model due to gravity. This phenomenon leads to the highest cement-to-sand ratio of waste rock cementation at the bottom.
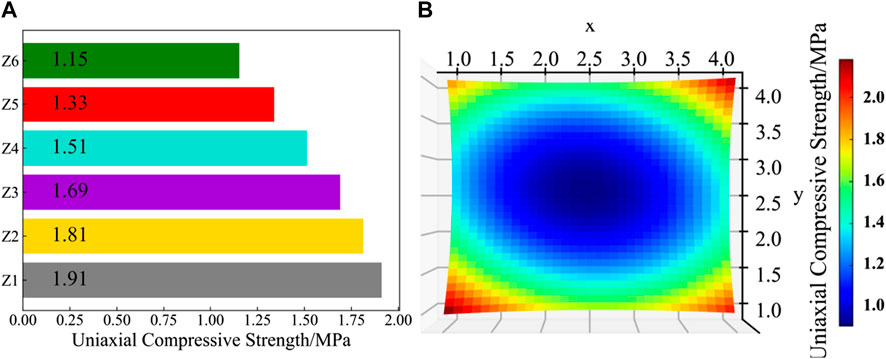
FIGURE 13. Strength distribution law of cemented waste rock backfill in (A) vertical and (B) horizontal directions.
Similarly, the average backfill strength at the same position (X, Y) on each layer in the similar model is taken, and the response surface fitting of each average value is carried out to establish the strength distribution pattern in a horizontal direction, as shown in Figure 13B. The results reveal lower backfill strength in central areas and higher strength near the sidewalls. This phenomenon is attributed to the distribution of cement slurry through outlets around the model. However, due to seepage obstruction, the slurry suspends and deposits near the sidewalls. Thus, cementation time and areas of waste rocks and cement slurry below the outlet increase, resulting in an overall higher backfill strength below the outlet compared to other areas at the same level.
The in-situ waste rock pass is generally arranged above the stope center. During distributing, moving, and settling, coarse particles move to stope sidewalls by gravity segregation, while fine particles usually stay near the falling point. This difference leads to a segregate and uneven settlement of waste rock heap within the stope. The backfill strength distribution law in horizontal direction indicates that when cement slurry outlet is arranged at stope corners, cement slurry flows more evenly in the stope. It is also beneficial to form a “backfill shell” with higher strength at the junction of preliminary and secondary stopes, thus improving the overall cemented filling effect of waste rocks.
The vertical backfill strength distribution law shows that the layered periodic slurry distribution should be adopted in filling practice. For example, cement slurry should be supplemented to the waste rock heap every 5 m in the stope. Through the layered slurry distribution, cement slurry is hydrated and cemented in the same layer of waste rock heap, and a filling body with certain strength and small porosity is formed after initial setting. The slurry at the next distribution round is then alleviated to gather at the stope bottom, improving the homogeneous distribution of the cement slurry in a vertical direction. On the other side, the chemical reaction time and contacting area of cementing material and waste rocks are enhanced through layered slurry distribution. In this way, cemented waste rock backfill quality at large stopes can be improved.
(1) The binarization processing of waste rock contours using OpenCV reveals that the distinct segregation occurs in the full-size waste rock during the filling process. Fine particles are detained near the filling shaft, while coarse particles tend to flow around. The gravity compaction and natural settlement of waste rocks between layers are minimal, and cement slurry smoothly penetrates to the model bottom, despite the low flow rate. A “backfill shell” with high strength tends to form at the boundary of the similar model. Cementing time and contacting area between rock particles and cement slurry have a direct impact on backfill strength.
(2) As the statistical partition range of waste rock images gradually increases, the upper limit of waste rock particle size gradually increases. For instance, region I only contains waste rocks with particle sizes ranging from 0 to 0.2, while region IV contains waste rocks with various particle sizes. The proportion of small particle size waste rocks in Region I and Region IV is 100% and 96.87%, respectively, in the first group. As the range of statistical regions increases, the presence of coarse particles dilutes the proportion of fine particles. This quantitative observation indicates a scenario where the middle waste rock has a fine particle size while the surrounding waste rock has a coarse particle within the waste rock heap.
(3) Tested backfill strength in similarity simulation experiments are set as training samples; the neural network is employed to train the model and predict backfill strength distribution throughout the similar model. The average absolute error of the model in the training set converges to lower than 0.1, the average relative error in the test set is 12.86%, and the average relative error reduces from 10.20% in traditional surface fitting to 4.12% in the neural network model. The neural network model is capable of predicting nonlinear problems with high accuracy, with which the predicted backfill strength is consistent with actual results.
(4) The backfill strength near the sidewalls and at the bottom of the similar model is higher than in other areas. In the vertical direction, the average backfill strength increases with increasing depth, ranging from 1.15 MPa at the topmost layer to 1.91 MPa at the bottommost layer. In the horizontal direction, the average backfill strength near model boundaries is consistently higher than that in the model center regardless of sampled layer depth. Backfill strength at the bottom and boundaries of the “backfill shell” is higher than in the central areas.
The original contributions presented in the study are included in the article, further inquiries can be directed to the corresponding author.
ZG: Data curation, Investigation, Writing–original draft. MH: Conceptualization, Project administration, Resources, Writing–review and editing. SZ: Methodology, Software, Writing–original draft. WT: Formal Analysis, Validation, Writing–original draft.
The author(s) declare financial support was received for the research, authorship, and/or publication of this article. This work was supported by the National Natural Science Foundation of China (No. 51804079).
The authors thank Changtian Gold Mine for providing experimental materials and on-site testing.
Authors ZG, SZ, and WT were employed by Zijin Mining Group Co., Ltd.
The remaining author declares that the research was conducted in the absence of any commercial or financial relationships that could be construed as a potential conflict of interest.
All claims expressed in this article are solely those of the authors and do not necessarily represent those of their affiliated organizations, or those of the publisher, the editors and the reviewers. Any product that may be evaluated in this article, or claim that may be made by its manufacturer, is not guaranteed or endorsed by the publisher.
The Supplementary Material for this article can be found online at: https://www.frontiersin.org/articles/10.3389/feart.2023.1328421/full#supplementary-material
Cao, S. A., Du, C. F., Tan, Y. Y., and Fu, J. X. (2015). Mechanical model analysis of consolidated filling pillar using stage-delayed backfill in metal mines. Rock. Soil. Mech. 36, 2370–2376. doi:10.16285/j.rsm.2015.08.033
Chen, Q. S., Zhang, Q. L., Fourie, A., Chen, X., and Qi, C. C. (2017). Experimental investigation on the strength characteristics of cement paste backfill in a similar stope model and its mechanism. Constr. Build. Mater. 154, 34–43. doi:10.1016/j.conbuildmat.2017.07.142
Cong, L., Zheng, X. G., and Guo, Z. Y. (2007). Lnfluence of segregation in construction on asphalt mixture performance. J.Tongji.Univ(Natural Sci. 35, 477–480+500. doi:10.3321/j.issn:0253-374X.2007.04.009
Cuthbert, M. O., Mcmillan, L. A., Stephanie, H. S., Riley, M. S., Tobler, D. J., and Phoenix, V. R. (2013). A field and modelingstudy of fractured rock permeability reduction using microbially induced calcite precipitation. Environ. Sci. Technol. 47, 13637–13643. doi:10.1021/es402601g
Dai, Y. T., Takashi, H., and Satoshi, T. (2022). 3D modeling of PVDF membrane aging using scanning electron microscope and OpenCV image analysis. J. Membr. Sci. 666, 121141. doi:10.1016/j.memsci.2022.121141
Feng, D. C., Liu, Z. T., Wang, X. D., Chen, Y., Chang, J. Q., Wei, D. F., et al. (2020). Machine learning-based compressive strength prediction for concrete: an adaptive boosting approach. Constr. Build. Mater. 230, 117000–117011. doi:10.1016/j.conbuildmat.2019.117000
Fu, Y., and Qiu, S. G. (2020). Technical characteristics and development direction of large-diameter long-holes open stope and backfill method under bad rock mass. Min. Res. Dev. 40, 1–5. doi:10.13827/j.cnki.kyyk.2020.11.001
Huang, M. Q., Chen, L., Zhang, M., and Zhan, S. L. (2022). Multi-objective function optimization of cemented neutralization slag backfill strength based on RSM-BBD. Materials 15, 1585. doi:10.3390/ma15041585
Ji, K., Han, B., Hu, Y. F., Wu, F., and Qiu, J. H. (2021). Prediction of backfill strength in underground stope based on strength reduction and intelligent algorithm. T. Nonferr. Metal. Soc. 31, 796–805. doi:10.11817/j.ysxb.1004.0609.2020-35929
Jia, H. B., Qi, Z. J., Wu, Z. H., Li, G. B., Wang, Z. J., Jing, X. D., et al. (2022). Experimental analysis on strength spatial distribution characteristics of tailings backfill. Min. Res. Dev. 42, 40–45. doi:10.13827/j.cnki.kyyk.2022.03.027
Li, L. (2013). A new concept of backfill design-Application of wick drains in backfilled stopes. Int. J. Min. Sci. Techno. 23, 763–770. doi:10.1016/j.ijmst.2013.08.022
Li, W. C., and Fall, M. (2016). Sulphate effect on the early age strength and self-desiccation of cemented paste backfill. Constr. Build. Mater. 106, 296–304. doi:10.1016/j.conbuildmat.2015.12.124
Li, W. C., and Fall, M. (2018). Strength and self-desiccation of slag-cemented paste backfill at early ages: link to initial sulphate concentration. Cem. Concr. Comp. 89, 160–168. doi:10.1016/j.cemconcomp.2017.09.019
Li, W. C., Guo, L. J., Chen, X. Z., Li, Z. N., and Li, X. (2018). Similarity simulation experiment on strength distribution in three-dimensional spatial of cemented tailing backfill. Gold. Sci. Tech. 26, 528–534. doi:10.11872/j.issn.1005-2518.2018.04.528
Liu, D., Shao, A. L., Jin, C. Y., and Yang, L. (2018). Healing technique for rock cracks based on microbiologically induced calcium carbonate mineralization. J. Mater. Civ. Eng. 30, 82–86. doi:10.1061/(ASCE)MT.1943-5533.0002497
Liu, L., Zhu, C., Qi, C. C., Zhang, B., and Song, K. I. (2019). A microstructural hydration model for cemented paste backfill considering internal sulfate attacks. Constr. Build. Mater. 211, 99–108. doi:10.1016/j.conbuildmat.2019.03.222
Qi, C. C., Andy, F., and Chen, Q. S. (2018). Neural network and particle swarm optimization for predicting the unconfined compressive strength of cemented paste backfill. Constr. Build. Mater. 159, 473–478. doi:10.1016/j.conbuildmat.2017.11.006
Qi, C. C., Zheng, J. S., Yang, X. Y., Chen, Q. S., and Wu, M. T. (2023). Application of deep neural network in the strength prediction of cemented paste backfill based on a global dataset. Constr. Build. Mater. 391, 131827. doi:10.1016/j.conbuildmat.2023.131827
Roshani, A., and Fall, M. (2020). Flow ability of cemented pastefill material that contains nano-silica particles. Powder Technol. 373, 289–300. doi:10.1016/j.powtec.2020.06.050
Ruan, Z. E., Wu, A. X., Wang, Y. M., Wang, S. Y., and Wang, J. D. (2022). Multiple response optimization of key performance indicators of cemented paste backfill of total solid waste. Chin. J. Eng. 44, 496–503. doi:10.13374/j.issn2095-9389.2021.08.15.001
Wu, A. X., Shen, H. M., Jiang, L. C., Jiao, H. Z., and Wang, Y. M. (2016). Arching efflect of long-narrow cemented paste backfill body and its effect on target strength. T. Nonferr. Metal. Soc. 26, 648–654. doi:10.19476/j.ysxb.1004.0609.2016.03.021
Wu, J. Y., Yin, Y., Gao, Y., Meng, B., and Jing, H. W. (2021). Particle size distribution of aggregates effects on mesoscopic structural evolution of cemented waste rock backfill. Environ. Sci. Pollut. R. 28, 16589–16601. doi:10.1007/s11356-020-11779-9
Xu, W. B., Zhang, Y. L., and Liu, B. (2020). Influence of silica fume and low curing temperature on mechanical property of cemented paste backfill. Constr. Build. Mater. 254, 119305. doi:10.1016/j.conbuildmat.2020.119305
Keywords: backfill strength, similarity simulation experiment, neural network, OpenCV, spatial distribution law
Citation: Gao Z, Huang M, Zhan S and Tan W (2024) Strength distribution of cemented waste rock backfill: a similarity simulation experiment. Front. Earth Sci. 11:1328421. doi: 10.3389/feart.2023.1328421
Received: 26 October 2023; Accepted: 21 December 2023;
Published: 22 January 2024.
Edited by:
Karoly Nemeth, Institute of Earth Physics and Space Science (EPSS), HungaryReviewed by:
Lijie Guo, Beijing General Research Institute of Mining and Metallurgy, ChinaCopyright © 2024 Gao, Huang, Zhan and Tan. This is an open-access article distributed under the terms of the Creative Commons Attribution License (CC BY). The use, distribution or reproduction in other forums is permitted, provided the original author(s) and the copyright owner(s) are credited and that the original publication in this journal is cited, in accordance with accepted academic practice. No use, distribution or reproduction is permitted which does not comply with these terms.
*Correspondence: Mingqing Huang, c2VhbmdvQGZ6dS5lZHUuY24=
Disclaimer: All claims expressed in this article are solely those of the authors and do not necessarily represent those of their affiliated organizations, or those of the publisher, the editors and the reviewers. Any product that may be evaluated in this article or claim that may be made by its manufacturer is not guaranteed or endorsed by the publisher.
Research integrity at Frontiers
Learn more about the work of our research integrity team to safeguard the quality of each article we publish.