 Xiaozheng Liu
 Peng Zhang1*
 Guotao Ma
- 1School of Civil Engineering, Qingdao University of Technology, Qingdao, China
- 2School of Engineering, University of Warwick, Coventry, United Kingdom
A high-precision, complex, three-dimensional (3D) geological model can directly express the attributes of stratum thickness, geological structure, lithology and spatial form, which can provide a reliable basis for the development and utilization of underground space and planning decisions. However, it is difficult to perform accurate modelling due to the lack of basic data. As such, this paper proposes coupling a machine learning algorithm (K-nearest neighbour (KNN)) with the kriging algorithm to construct the topological relationship between the Delaunay triangle and the Thiessen polygon in order to perform the simulation and prediction of virtual drilling. Based on KNN, support vector machine (SVM) and neural network algorithms as well as the virtual borehole encryption data, data standardization processing and analysis are carried out. Through model verification, algorithm optimization is realized, and the optimal modelling method is explored. The results show that the fine KNN algorithm improved by Bayesian optimization can effectively improve the modelling accuracy through 0.1-m encryption, standardization processing and 5-fold cross-validation. Stratum modelling combined with the fine KNN and kriging algorithms can obtain a more accurate modelling without adding virtual boreholes. The improved levels of upper and lower hybrid modelling with an appropriate number of profile boreholes can also effectively optimize model accuracy. Both modelling accuracy and efficiency can be significantly improved by using Delaunay triangles and Thiessen polygons with virtual boreholes. Stratum modelling can effectively express the geological pinch-out in areas with adequate degrees of stratification, and hybrid modelling performs well in irregular geological bodies such as karsts and lenses.
1 Introduction
Three-dimensional (3D) geological modelling uses computer technology to integrate survey data in 3D space to restore the spatial form and combination relationship between geological interfaces and geological bodies (Xiao et al., 2012; Wang et al., 2016). Accurate and detailed 3D geological models can provide technical support for professionals when analysing geological structures and fault distributions, which will provide a reliable basis for the development and utilization of underground space (Li et al., 2016).
Traditional explicit modelling uses mainly drilling, acoustic wave testing, gravity exploration, electromagnetic wave testing and other methods to obtain data. Meanwhile, modelling based on manual interaction is inefficient and not accurate. In contrast, the implicit modelling of 3D models through spatial interpolation algorithms has developed rapidly and been widely used (Jessell, 2001; Calcagno et al., 2008; Li et al., 2015). Spatial interpolation algorithms include mainly kriging interpolation, inverse distance weighted interpolation (Liu et al., 2020; Nistor et al., 2020; Liu et al., 2021; Liu et al., 2023), and discrete smooth interpolation (Jeong et al., 2018; Wang et al., 2019; Sun and Durlofsky, 2019; Jin et al., 2020; Liu et al., 2021; Zhang et al., 2022; Fu et al., 2023). Among them, kriging interpolation (Krige, 1951; Hu et al., 2018; Zhang and Zhu, 2018; Li et al., 2020; Wang et al., 2021; Li et al., 2022), as the main method used for spatial statistics, can well express the structural characteristics of complex geological bodies (Adhikary et al., 2017) and is widely used in the field of geological modelling. Kriging interpolation method has been effectively applied for complex geological rapid modelling (Cheng et al., 2023), transparent working face modelling (An et al., 2022), coal seam 3D modelling (Che and Jia, 2019), fault 3D modelling (Jia et al., 2020) and other complex geological conditions.
However, implicit 3D modelling technology is limited by grid scale, data density and the algorithm used and cannot be finely controlled for local complex geological structures (He et al., 2015). In the case of fewer borehole data, it is difficult to achieve a good complex geological modelling effect only by kriging interpolation. Therefore, professionals are required to supplement the data and adjust their geological models. Machine learning has made great progress in recent years as it has powerful data analysis capabilities and does not require prior theoretical formulas and expert knowledge. Machine learning even surpasses humans in some respects (He et al., 2023). Therefore, the introduction of machine learning into the field of geosciences has become a recent research hotspot. In complex geological conditions, lithology and strata can be used as important indicators to distinguish the accuracy of the model. By using machine learning algorithms, lithology can be well predicted (Wang et al., 2018; Guo et al., 2019; Pratama, 2019; Jia et al., 2021; Zhu et al., 2021; Li et al., 2022; Erdogan Erten et al., 2022; Chen et al., 2023) and strata (Zhou et al., 2019; Shi and Wang, 2021; Bullejos et al., 2022; Xiong and Liu, 2022; Wang et al., 2023; Wang et al., 2023). Supervised learning for solving classification problems in machine learning is more suitable for the above work. The application of supervised learning algorithms in geological modeling mainly includes the following categories; 1) k-nearest neighbor algorithm (Pratama, 2019; Potratz et al., 2021; Bullejos et al., 2022); 2) bayesian algorithm (Olierook et al., 2021; Zhang et al., 2021); 3) decision tree algorithm (Bacal et al., 2019; Zhou et al., 2020); 4) support vector machine algorithm (Wang et al., 2019; Ghezelbash et al., 2021; Hu et al., 2022); 5) neural network algorithm (Bai and Tahmasebi, 2020; Hillier et al., 2021). The above algorithms have their own advantages, as shown in Table 1 below. Therefore, each algorithm has a certain application in geological modeling. As a reliable algorithm in machine learning, KNN algorithm has a good performance in geological model construction. This paper mainly studies the KNN algorithm, which is applied to the virtual borehole prediction in the complex geological area of this study. The advantages of the algorithm, such as mature theory, easy implementation and no need to estimate parameters, are fully utilized. Finally, the training data is tested, and the results are satisfactory. The modeling accuracy is better than other machine learning algorithms.
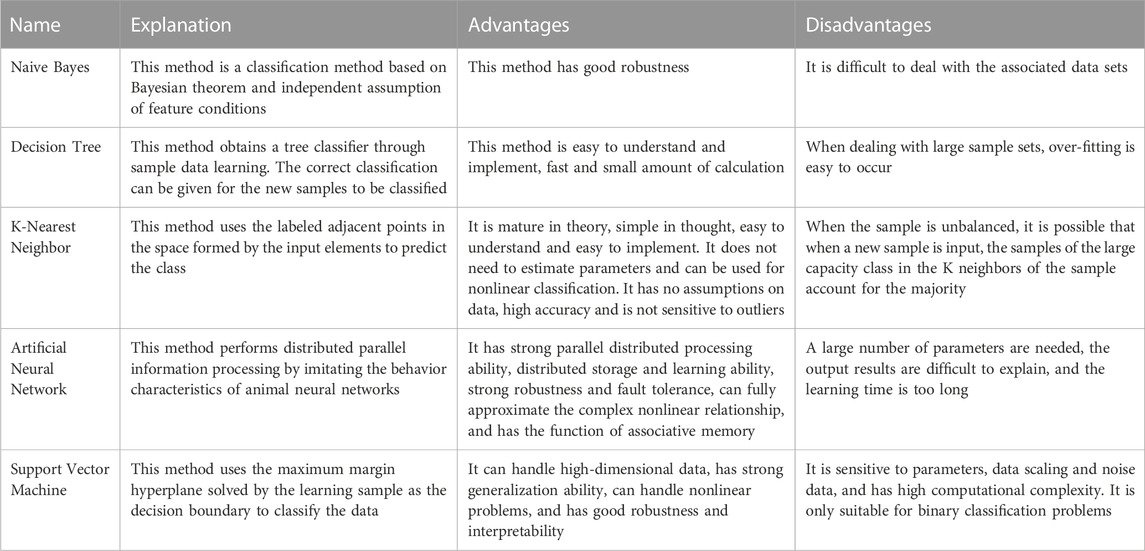
TABLE 1. Summary of complex geological machine learning algorithms.
The kriging algorithm is an optimal interpolation method in implicit modelling, has a wide application range and small deviation, and can effectively construct geological models. However, the algorithm assumes that the data are linear and requires a large amount of uniformity data. Moreover, drilling data acquisition costs are high, and the complex geology makes it difficult to meet the algorithm conditions. Machine learning has powerful data analysis capabilities and can handle local complex geological structures well. Furthermore, machine learning can effectively analyse complex data with nonlinear, nonstationary, non-Gaussian and multivariate characteristics. Therefore, the combination of the KNN and kriging algorithms can give full play to the advantages of the KNN algorithm in effectively predicting complex data and provide the best linear unbiased estimation of the kriging algorithm and improve the accuracy of complex geological modelling. Because there are many complex geological structures such as karst and geological pinchout in geology (Nanehkaran et al., 2023). Complex geological visualization is very important in the study of geological disasters (Mehrabi et al., 2023). Therefore, it is an important task to study the construction of complex geological models. At present, the research mainly focuses on the accuracy of the algorithm to prove the effect of the algorithm (Bacal et al., 2019; Ren et al., 2022). There are few studies on model construction using the data processed by the algorithm. Moreover, it is difficult to use data alone to study the prediction effect, and the visualization effect of the obtained research results is poor. It is impossible to draw a specific modeling effect conclusion from a quantitative perspective (Olierook et al., 2021; Bullejos et al., 2022).There is still a lack of methods for modelling complex geology using machine learning algorithms combined with kriging algorithms, which motivates this study. Based on previous studies, this paper explores a complex geological implicit modelling method that couples the KNN and kriging algorithms with fewer data, as shown in Figure 1. Because modelling accuracy is difficult to determine, this paper intends to determine the specific performance of this modelling method in complex geological models through the profile data verification method. An accurate and complex 3D geological model is then constructed. It is expected that this study would provide technical support for professionals in carrying out geological analysis.
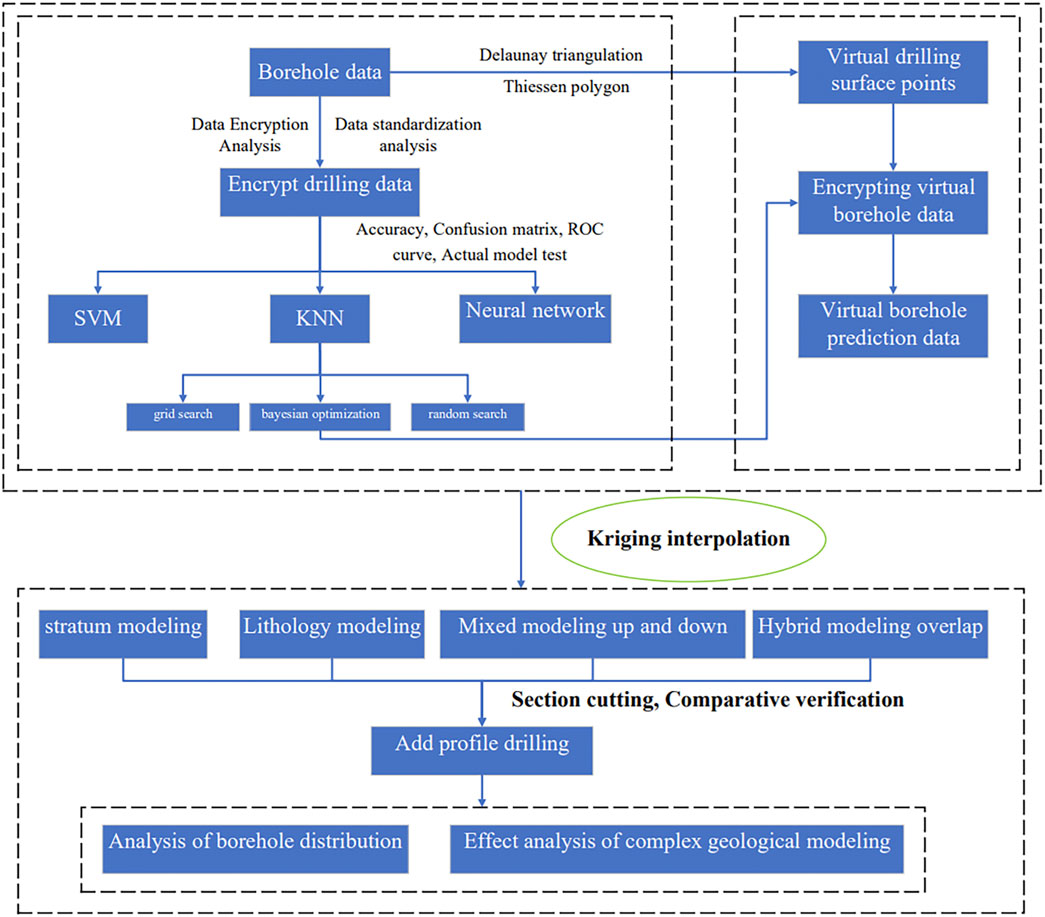
FIGURE 1. Flow chart of the kriging and KNN coupling algorithm modelling method.
2 Kriging and K-nearest neighbour coupling algorithm
2.1 Key modelling techniques based on the kriging method
The kriging interpolation algorithm is an optimal interpolation method proposed by South African engineer Danie G. Krige, also known as the spatial autocovariance optimal interpolation method (Krige, 1951). This method is based on variogram theory and structural analysis and is suitable for regionalized variables with spatial correlation. This method is also a geostatistical gridding method. The approach first considers the variation distribution in the spatial position to determine the distance range that has an impact on a point to be inserted. The sampling points are then used in this range to estimate the attribute value of the point to be inserted to achieve linear, unbiased and minimum variance estimation. Eventually, a certain coefficient can be assigned to each sample. Finally, the weighted average calculation is performed. The principle of which is shown as follows:
where,
The kriging interpolation used in this paper can be applied to sequence prediction in stratigraphic modelling. Drilling points are used as sampling points, which are divided into sequences according to geological laws. Based on the characteristics of nonlinearity and the statistical principle of kriging interpolation, the advantages of the kriging method, such as small deviation and strong applicability, are fully utilized. According to the divided sequence, the strata without borehole positions are predicted. Meanwhile, this method can also be used for boreholes without sequence division in lithology modelling and direct modelling through exponential kriging interpolation to complete complex, true 3D geological modelling.
2.2 Key modelling techniques based on the K-nearest neighbour method
The KNN algorithm is a supervised machine learning algorithm, the core idea of which is that if a sample belongs to a certain category in the K-most-adjacent samples in the feature space, then the sample also belongs to that category and has the sample characteristics of that category. In this study, the KNN algorithm is applied to the prediction of virtual boreholes. According to the known borehole lithology as the attribute value, when the new data with only coordinates without lithology are input, the algorithm compares the coordinates of the new data with those of the known borehole data and then extracts the most similar K data (nearest-neighbour object) attribute values. The algorithm takes the average attribute value as the virtual borehole attribute value according to the first K-most-similar data. The first step in the application of the KNN algorithm is similarity measurement, which often uses the Euclidean distance, cosine value, correlation and Manhattan distance. In this paper, the Euclidean distance is taken as an example to measure the distance between the sample point and the new data point and is defined in Euclidean space. The distance between the new data point
where,
2.3 Basic principle of the coupling algorithm
The kriging interpolation algorithm is suitable for regionalized variables with spatial correlation and requires enough data as it is difficult to take advantage of the algorithm when the amount of data is small. The algorithm assumes that the relationship between samples is linear, and the covariance and variogram required in the process are based on two-points statistical analysis. However, in some cases, the data have complex multivariate characteristics, non-Gaussianity, and non-stationarity and may be nonlinear. Therefore, it is difficult to effectively interpolate nonlinear and complex feature data in space.
Machine learning algorithms can learn from the data and check their predictive ability through the expert-driven mechanism of supervised learning. A machine earning algorithm does not have higher requirements for the stability and linearity of the data than does the kriging algorithm. Instead, the machine learning algorithm selects the model based on the data feature and does not make strict statistical assumptions on the data. Therefore, the machine learning algorithm can effectively analyse some complex feature data and accurately predict complex strata and rock sample information.
Figure 2 shows the principle the kriging and KNN coupling algorithm in machine learning to give full play to their respective advantages and improve modelling accuracy. On the one hand, the coupling algorithm takes advantage of the KNN algorithm to effectively solve complex data and predict complex geological models. On the other hand, the coupling algorithm takes advantage of the best linear unbiased estimation of the kriging algorithm to reduce the minimum variance at unsampled positions and construct high accurate geological models.
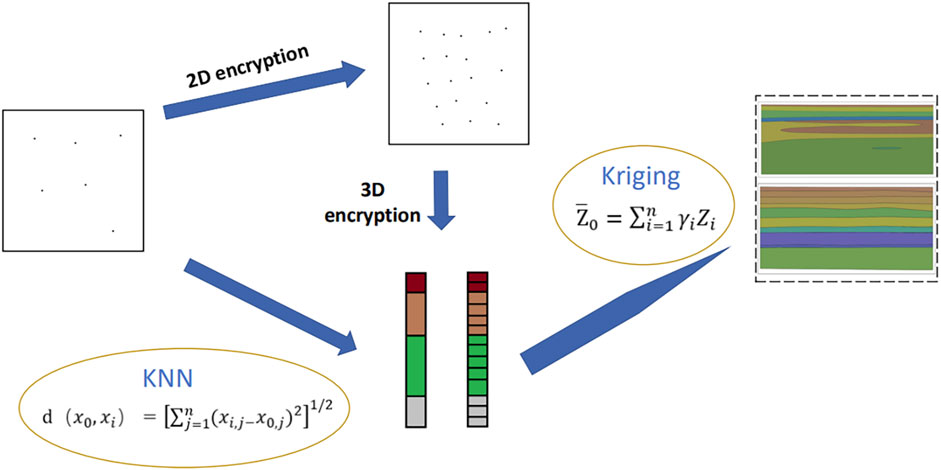
FIGURE 2. Principle diagram of the kriging and KNN coupling algorithm.
3 Machine learning prediction process
3.1 Data pre-processing
This paper relies on a project plot in Jiangsu Province. According to the geotechnical engineering investigation report and field situation, the research and analysis are carried out. The terrain is generally flat. The local height of the site can reach 3–5 m, and the undulation is large. The geomorphic unit is the piedmont alluvial plain geomorphic unit. The upper part of the site is filled with soil. Layers 2 and 3 are general sedimentary soil layers of Quaternary Holocene (Q4). Layers 3-1 and 3-2 are old cohesive soils formed by alluvial deposits of the Quaternary late Pleistocene (Q3). The underlying bedrock is the Lower Paleozoic Ordovician Xiaoxian Formation, and the lithology is mainly limestone and marl. The bedrock is a monoclinic stratum with a strike of NNE8°. Its dip angle is 2°–17° (from the core of the anticline to the right wing) from west to east, and there are intrusive dikes in the lower part. There is no new active fault distribution in the proposed site and its vicinity. During the exploration period, there were no adverse geological effects such as ground fissures, ground subsidence, landslides, collapses, mudslides, liquefiable soil layers and so on. However, there are bad geological conditions such as karst and fold under the proposed site.
The data in this study are derived from the CAD borehole histogram. The lithology, x, y, borehole elevation and other data are extracted and integrated. Stratum modelling is used to standardize the data by converting them into a standard format, and then importing them into the software for analysis. The analysis effect is shown in Figure 3. Through such analysis, the incorrect data in the sorting process can be corrected. At the same time, the data distribution can be studied. In upper and lower hybrid modelling, profile drilling can be added in time to achieve better modelling results.
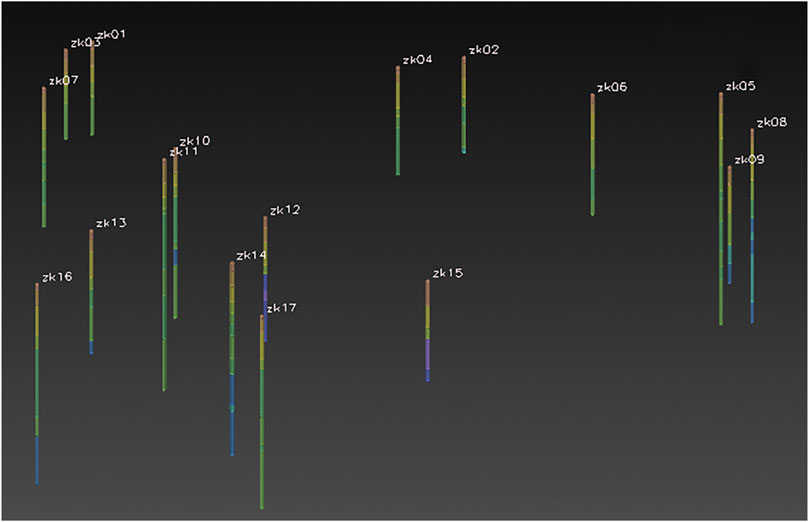
FIGURE 3. Initial borehole distribution.
3.2 Virtual borehole selection
Because the drilling data obtained in this study are limited and the geological conditions are complex, it is difficult to carry out effective geological modelling. Therefore, this paper studies the method of adding virtual drilling to improve modelling accuracy. In this study, the spatial location of virtual boreholes is derived mainly from the following two points: 1) the midpoint of the line connecting the sampling points of adjacent boreholes (Cao et al., 2013), where the virtual borehole obtains the midpoint of the three edges of the triangle through Delaunay triangulation, and 2) the boundary of the influence range of the borehole sampling point (Song et al., 2018), where the virtual borehole is extracted by creating a Tyson polygon.
Figure 4 shows the procedure of adding virtual drilling: 1) importing x, y, and z data into ArcGIS (see Figure 4A); 2) creating a TIN based on x and y coordinates (see Figure 4B); 3) transforming the TIN into a triangle (see Figure 4C); 4) providing an ID number for the drilling point; 5) establishing a Thiessen polygon (see Figure 4D); 6) intersecting the triangle and the Thiessen polygon, and outputting the intersection point (see Figure 4E); 7) adding x and y coordinates to the virtual drilling point; 8) interpolating virtual drilling points, and adding z to the virtual drilling point; and 9) mixing the virtual borehole with the initial borehole (see Figure 4F).
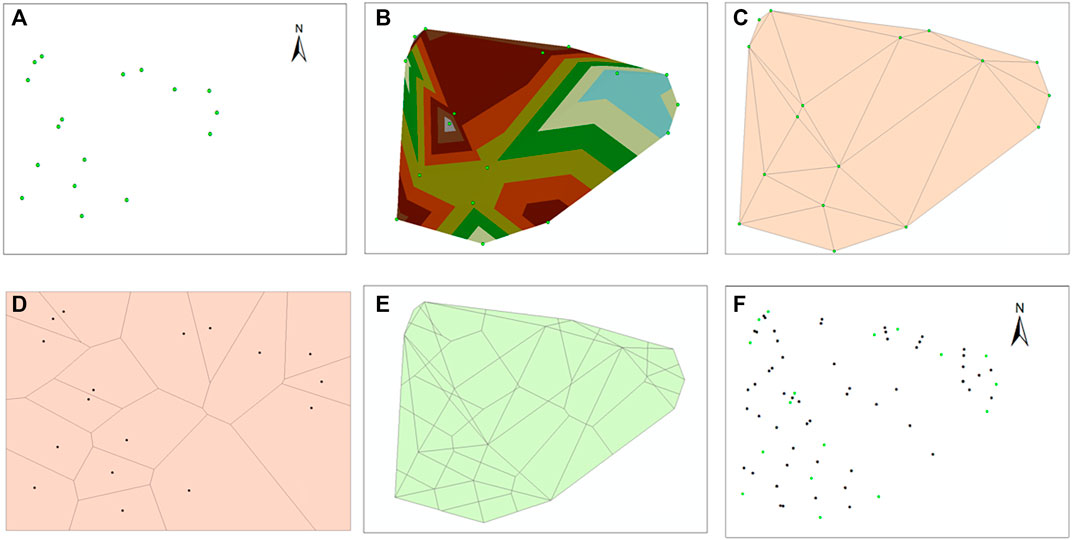
FIGURE 4. Virtual borehole selection step. (A) Initial drilling point. (B) Creation of a TIN. (C) Transformation of a TIN into a triangle. (D) Creation of a Tyson polygon. (E) Intersection. (F) Total strongholds.
3.3 Standardized data encryption and verification method
Due to the small amount of drilling data, the corresponding features and eigenvalues are small in number. However, because machine learning needs to train the model with a large amount of data, this study intends to increase the number of data features and eigenvalues through data encryption, as shown in Figure 5.
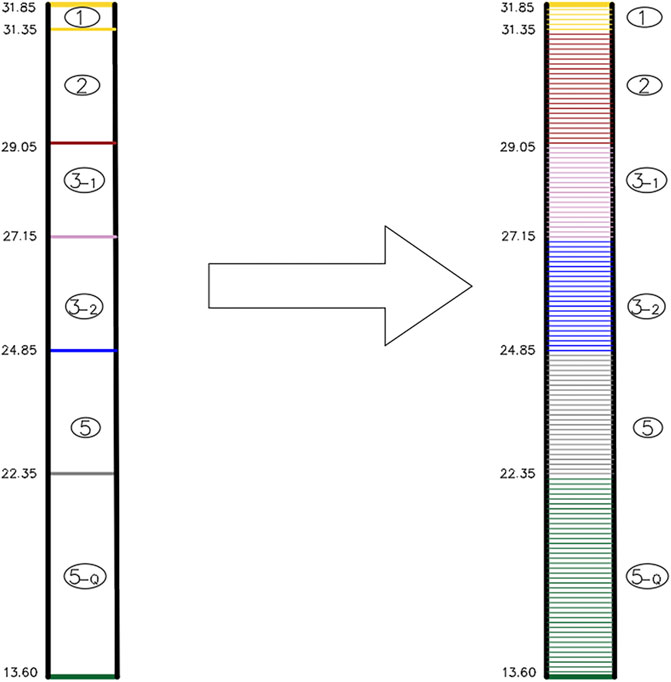
FIGURE 5. Borehole encryption diagram.
The actual data verification proves that the magnitude of the encryption is different, and the magnitude of the error is different. When the encryption degree is 1m, the error is usually in meters. When the encryption is 0.1 m, the error is in decimeters. According to previous studies, most of the indicators that prove the effectiveness of the algorithm are accuracy, confusion matrix and ROC curve (Bacal et al., 2019; Ren et al., 2022). Therefore, this paper studies the above indicators. The results are shown in Figure 6. According to the confusion matrix comparison diagram, it can be seen that the confusion matrix effect is poor when the encryption degree is 1 m. The minimum false negative rate is about 30%, and the false negative rate for the second lithology is 59.5%. At the same time, the ROC curve is poor, and the average AUC for each lithology is about 0.78. For the algorithm model with a degree of encryption of 0.1 m, the confusion matrix and ROC curve perform better.
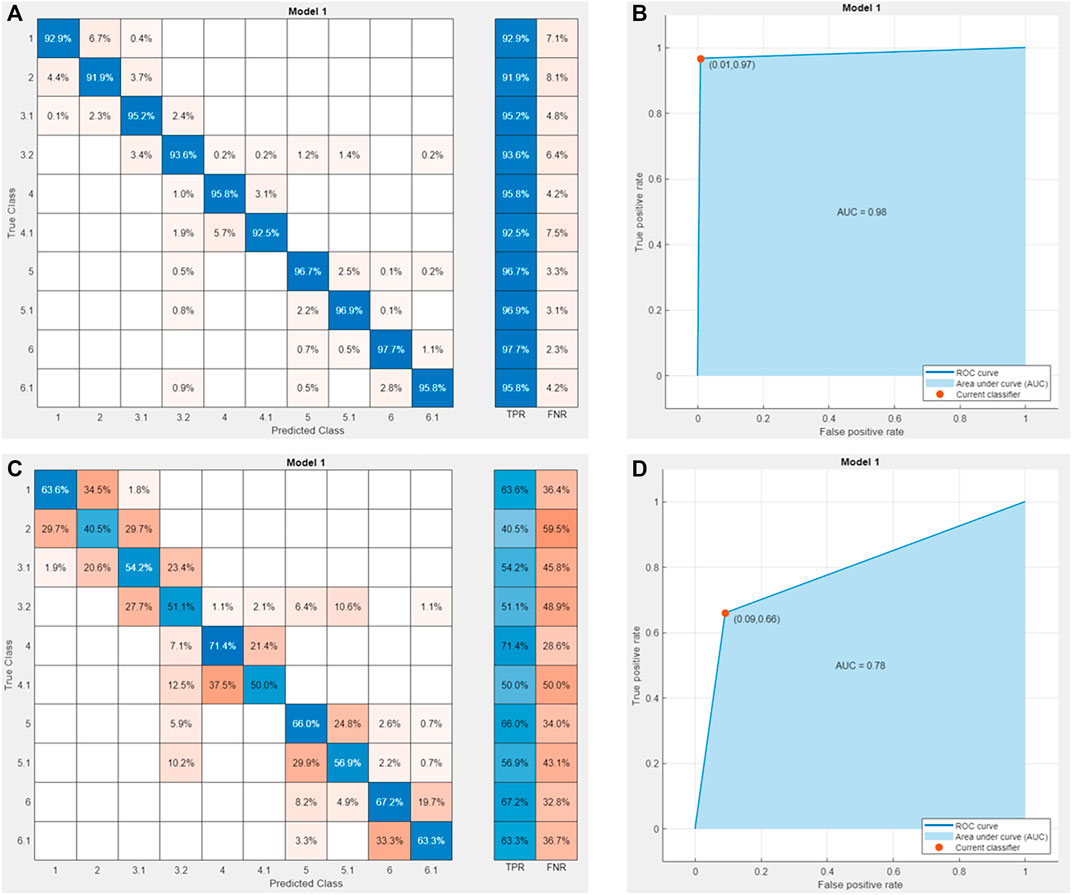
FIGURE 6. Accurate index comparison. (A) 0.1 m confusion matrix. (B) 0.1 m ROC curve. (C) 1 m confusion matrix. (D) 1 m ROC curve.
This paper will focus on investigating the change in model accuracy when the encryption degree is 0.1–1 m. Table 2 shows that the accuracy of the prediction model increases with increasing degree of encryption. When the initial encryption is 1 m, the accuracy of the prediction algorithm model is only 58.5%, while when the encryption distance is 0.1 m, the accuracy is 95.5%.
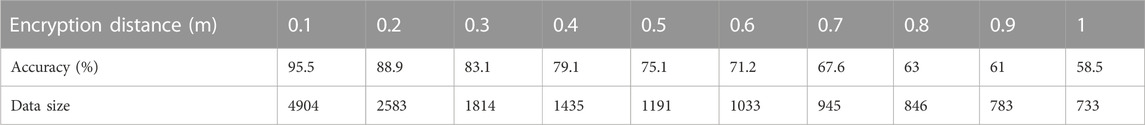
TABLE 2. Encrypted distance comparison.
After encryption, the data are standardized to avoid affecting the results of data analysis and to eliminate the dimensional influence between indicators. Commonly used standardization methods include min–max, Z score and decimal calibration standardization. In this study, min–max standardization, also known as deviation standardization, is used to map the x, y and z coordinates to the [0,1] interval through the linear transformation of the original data. The conversion function is shown as follows:
where max is the maximum value of a certain attribute data point of the sample, and min is the minimum value of a certain attribute data point of the sample.
Previous studies showed that the supervised learning effect was better than the unsupervised learning effect, and the learning mode included classification and regression problems. The research shows that the strategy of solving the regression problem is not suitable for the complex geological modelling approach in this paper. The prediction process faces the problem of stratum intersection, and it is difficult to predict many high-complexity stratum problems. Compared with the above methods, the classification problem algorithm is more suitable for the problems studied in this paper. The lithology is used as the predicted value, and the coordinates are used as the eigenvalues for learning and prediction, which can effectively solve the complex geological modelling problem with fewer data. Therefore, the classification algorithm is used as the main research method in this paper.
Encrypted data are imported into the software, the classification algorithm is used for prediction, and the accuracy rate is used as the primary judgement index. The accuracy verification methods include mainly cross-validation, leave-out method verification, and resubstituting verification. According to the actual data prediction, resubstituting verification has a strong effect on model accuracy, but the actual modelling effect is poor, and the data utilization rate of the leave-out method is low. Therefore, cross-validation is selected as the final verification method. As cross-validation generally uses 5- or 10- fold cross-validation, this paper compares and analyses both methods. The analysis shows that the average value of 5-fold cross-validation is 57.52%, the average value of 10-fold cross-validation is 55.08%, and the average value of 5-fold cross-validation data after standardization is 60.75%. The effect of 5-fold cross-validation is higher than that of 10-fold cross-validation. The use of min–max standardization for data can also improve the final modelling effect. Therefore, this study uses min–max standardized 5-fold cross-validation for data prediction.
3.4 Algorithm selection and optimization
3.4.1 Machine learning algorithm selection
This study uses a variety of machine learning algorithms to predict the data and examine the accuracy of models, ROC curves, confusion matrices and final model effects. According to the training, the data shown in Table 3 can be obtained. According to the accuracy of the algorithm, different types of KNN algorithms have higher accuracies. At the same time, wide neural networks, support vector machines and some integrated algorithms also achieve better performance. According to the ROC curve, the AUC values of the wide neural network and the fine Gaussian SVM are higher than those of other methods, as shown in Table 4. In summary, this paper selects the fine KNN algorithm, fine Gaussian SVM and a wide neural network for modelling analysis and selecting the appropriate algorithm according to the model. The results show that the fine KNN algorithm improved by Bayesian optimization can effectively improve the modelling accuracy through 0.1-m encryption, standardization processing and 5-fold cross-validation.
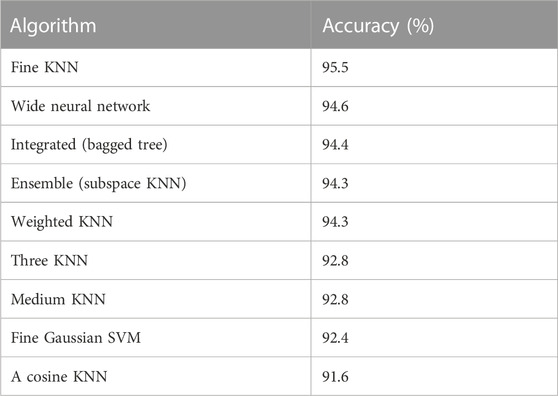
TABLE 3. Comparison of machine learning algorithm accuracies.
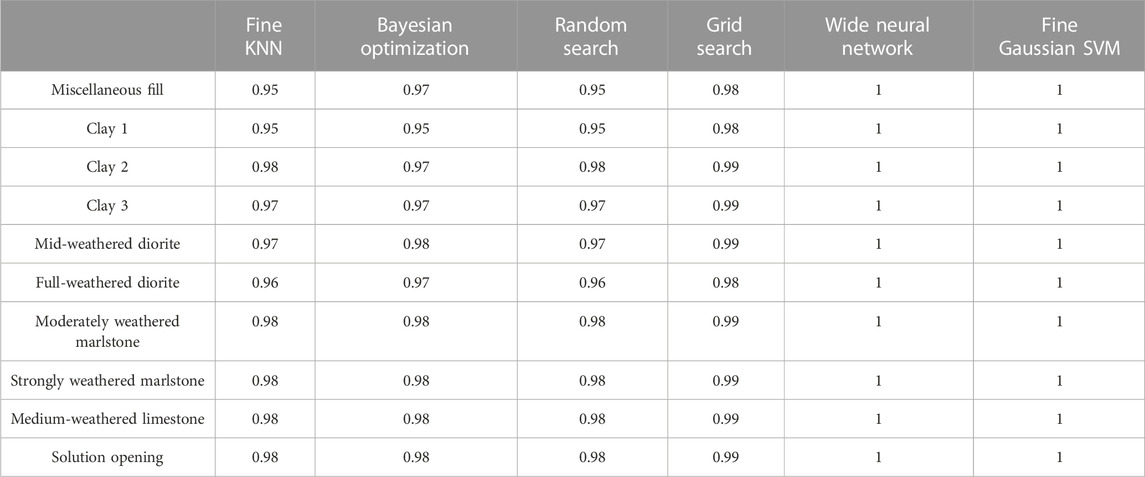
TABLE 4. AUC data of each algorithm lithology classification.
Figure 7 is the confusion matrix, which shows the true rate (TPR) of the fine KNN algorithm is above 90%, and no large fluctuation exists. The wide neural network is more floating than is the fine KNN algorithm, and the prediction effects of the second and fourth types of lithology are poor. For the fine Gaussian SVM, the degree of floating is larger than those of the previous two algorithms, and the true rate of the last lithology is only 82.2%, which is less effective than are those of other algorithms.
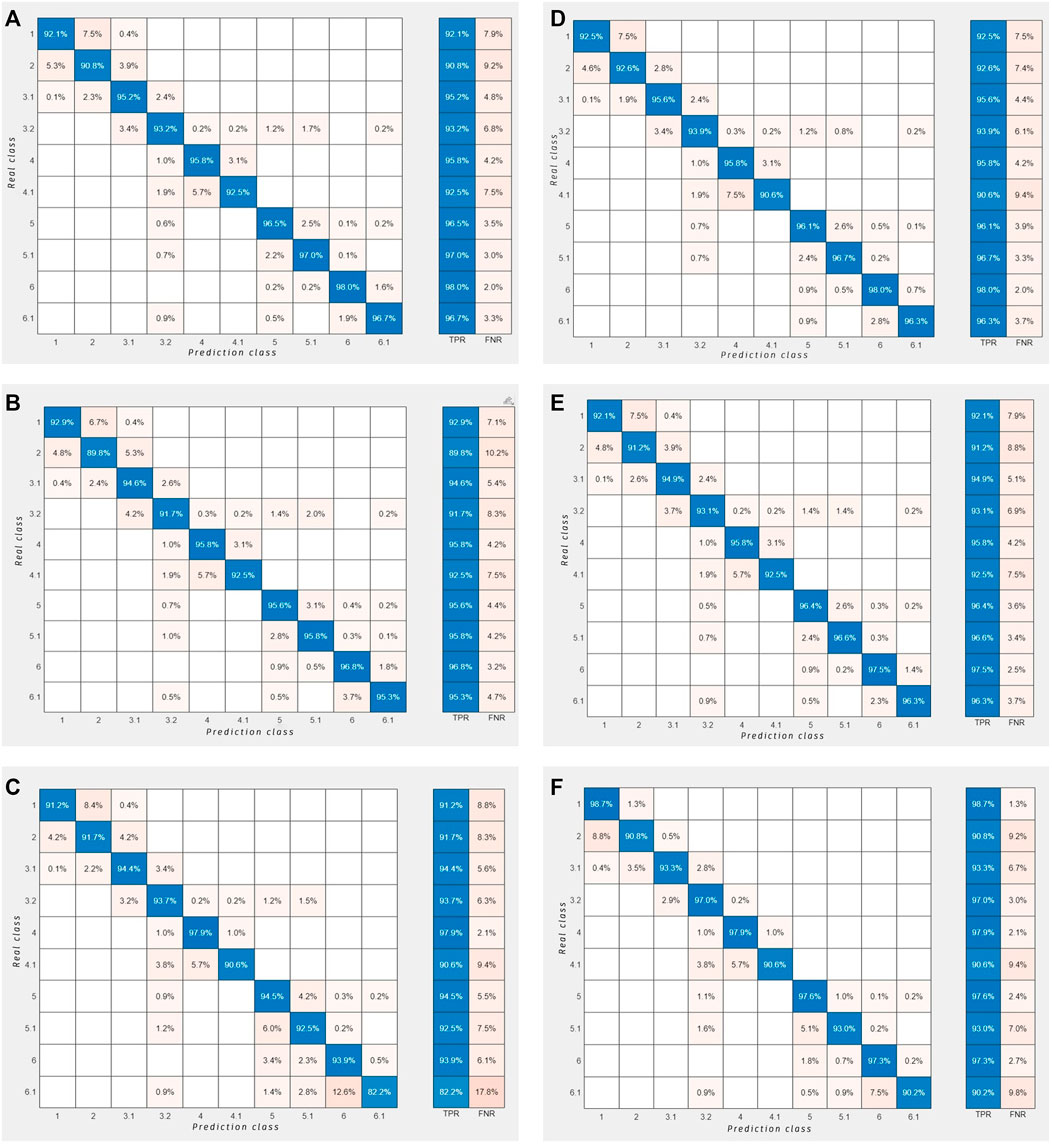
FIGURE 7. Confusion matrix. (A) Fine KNN. (B) Wide neural network. (C) Fine Gaussian SVM. (D) Bayesian optimization. (E) Grid search. (F) Random search.
According to the analysis of the accuracy effect, the fine KNN algorithm performs better than the wide neural network and fine Gaussian SVM. However, according to the ROC curve analysis, the wide neural network and the fine Gaussian SVM perform better than the fine KNN algorithm. While the confusion matrix shows that the fine KNN algorithm performs better. It is impossible to make an accurate judgment based on the above evaluation values. Therefore, this paper uses the fine KNN algorithm to model the profile. By cutting the profile shown in Figure 8 and Figure 9 and verifying it, the accuracy data shown in Table 5 are obtained.
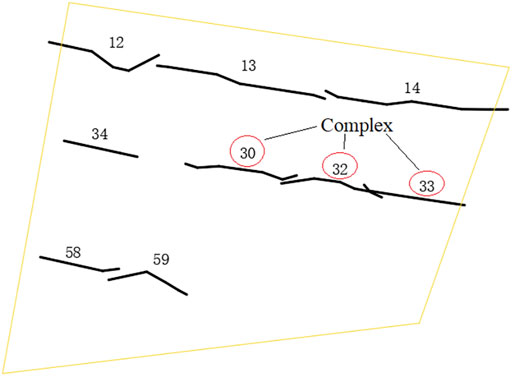
FIGURE 8. Survey area and profile distribution.
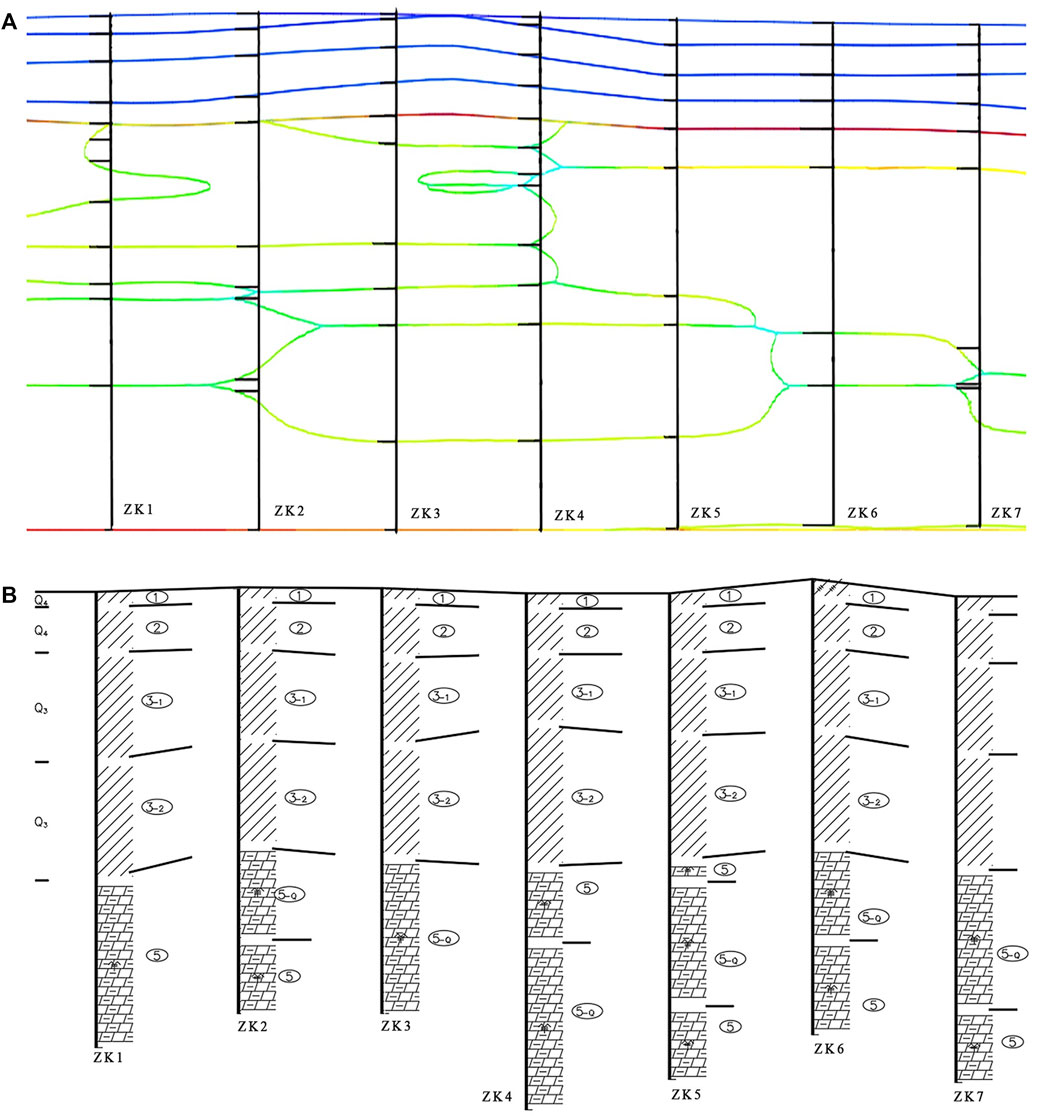
FIGURE 9. Stratigraphic correlation. (A) Model profile. (B) Survey profile.
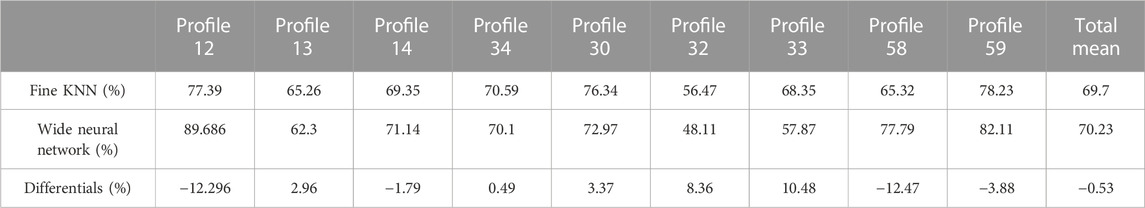
TABLE 5. Classification algorithm model validation table.
According to the prediction results (Table 6), the fine KNN algorithm and the wide neural network can effectively predict the data, while the fine Gaussian SVM faces difficulty in effectively predicting the data. The algorithm has strong instability and different degrees of prediction for different types of lithology. The study of various SVM algorithms shows that this type of algorithm focuses the prediction data on a certain lithology, the prediction accuracy for other types of lithology is extremely poor. And it is impossible to distinguish the borehole boundary, so it is difficult to obtain effective data.
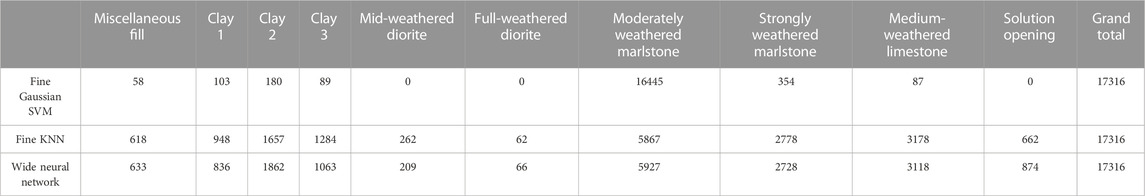
TABLE 6. Statistics of the number of predictions of the classification algorithm.
For the cut profiles, profiles 30, 32, and 33 are more complex than are other profiles. The survey profile has more lithology and cannot be modelled according to a simple geological sequence. According to the above accuracy data, the fine KNN algorithm performs better under complex geological conditions compared to the other methods. The overall average is good, and there is not a low accuracy rate, which can allow for the effective construction of the geological model. Therefore, in the below research, the fine KNN algorithm is used.
3.4.2 K-nearest neighbour algorithm optimization method
According to the above analysis, the accuracy of the KNN algorithm is high, and the AUC of each stratum (Table 4) of this method is higher than 0.95. Compared to other methods, in the fine KNN algorithm, the effect of the confusion matrix is better, and it has better performance for complex geological areas. The optimization methods include mainly Bayesian optimization, grid search and random search. This study uses the above three methods to optimize the model, and the optimization process and parameters are shown in Table 7. The analysis shows that random search is faster, followed by Bayesian optimization, with the grid search time being much longer than those of the above two methods. The distance metrics of grid and random search are consistent. By analysing the confusion matrix (Figure 7), it can be seen that the true rates of the three optimization models are greater than 90% and that they have different performance levels in different lithologies. It is difficult to select effective optimization methods according to the confusion matrix and ROC curve. In this paper, the data are predicted and analysed. The data prediction shows that grid and random search obtain the same prediction results. Therefore, this paper intends to verify the actual modelling of Bayesian optimization and grid search. The verification results are shown in Table 8.
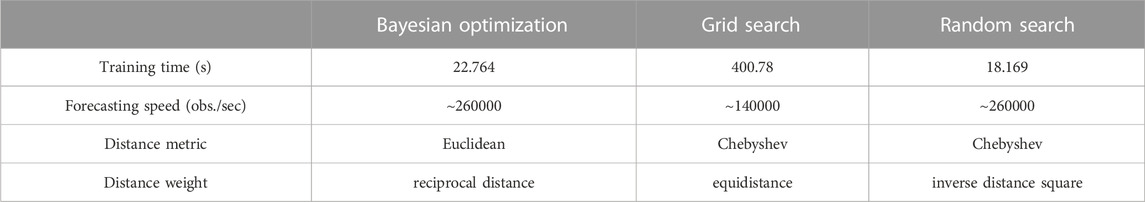
TABLE 7. KNN optimization algorithm index.
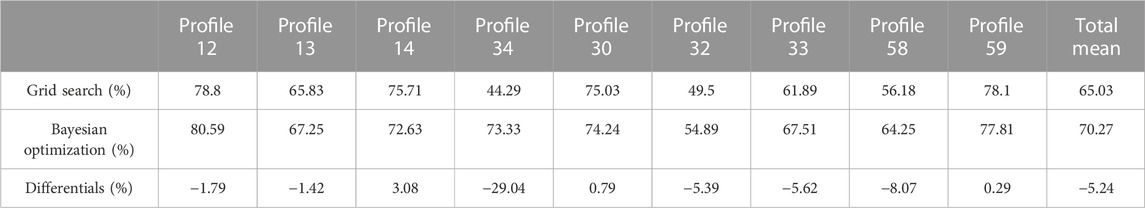
TABLE 8. KNN optimization algorithm model validation.
The analysis of the modelling results shows that the overall accuracies of the grid search and Bayesian optimization are 65.03% and 70.27%, respectively. Bayesian optimization performs significantly better than do the other optimization algorithms. The analysis of the profiles shows that in profiles 32 and 33 with high complexity, Bayesian optimization exhibits certain improvement compared with grid search. The analysis shows that the type of algorithm determines the actual modelling effect. Bayesian optimization modelling is better than grid search and random search, and thus, this study intends to use Bayesian optimization for follow-up research.
4 Model accuracy analysis
4.1 Machine learning prediction effect analysis
This paper compares mainly the modelling accuracy of the KNN and kriging coupling algorithm and of the kriging algorithm as well as evaluate the improved machine learning algorithm.
According to previous studies, there are many studies on the accuracy of the algorithm to prove the effect of the algorithm (Bacal et al., 2019; Potratz et al., 2021; Ren et al., 2022). There are few studies on modeling the data obtained by machine learning. Through modeling, only the structure is analyzed, and the accuracy of the model is not analysed (Bai and Tahmasebi, 2020; Olierook et al., 2021; Bullejos et al., 2022). It is impossible to draw a specific modeling effect conclusion from a quantitative perspective. In this paper, the KNN algorithm and the kriging algorithm are combined to construct the geological model. Relying on the accuracy of the algorithm, the confusion matrix and the ROC curve can only verify the effect of the KNN algorithm. It is difficult to verify and analyze the model effect after the combination of the two. Therefore, this paper makes a comparative analysis of the overlap rate between the final model and the survey results, in order to find the influence of the combination of the two on the accuracy of the final model. In this paper, the effect of the algorithm is analyzed from the practical application by using overlapping comparison. It can better illustrate the effect of this method from the perspective of engineering practicability. At the same time, this method is simple and effective, which can reasonably verify the implementation effect of the algorithm.
The specific steps are as follows: three profiles are uniformly selected to cut the whole model, and the profiles (Figure 8), from top to bottom, are 12, 13, 14, 34, 30, 32, 33, 58, and 59.
According to the comparison between the model profile (Figure 9A) and the survey profile (Figure 9B), the proportions of the same lithology areas are obtained as the accuracy evaluation index.
Figure 10A shows the accuracy of lithology modelling, stratigraphic modelling, overlapping hybrid modelling and upper and lower hybrid modelling.
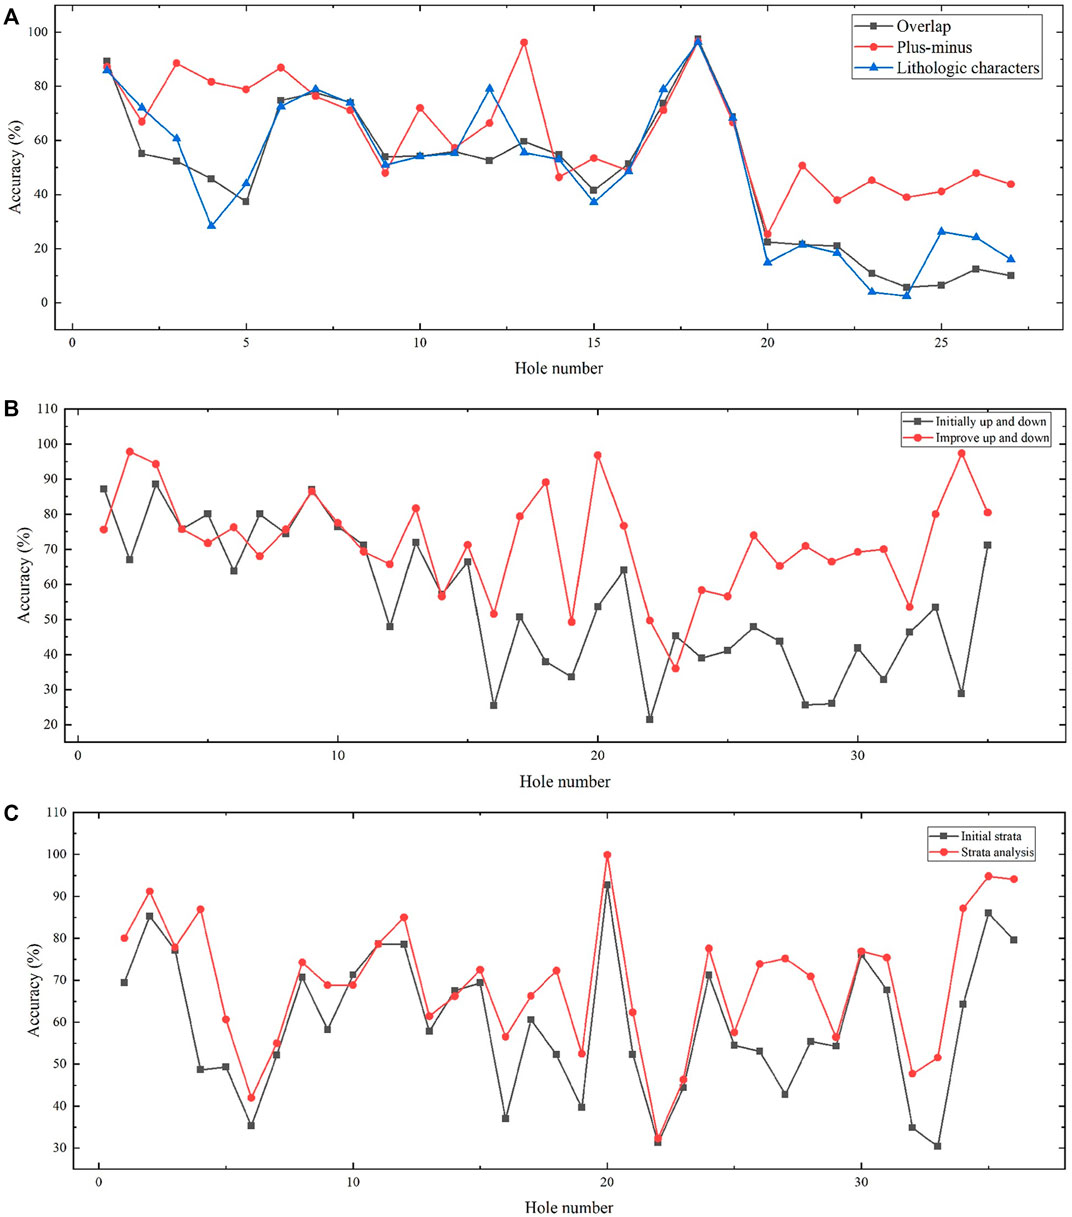
FIGURE 10. Accuracy comparison. (A) Accuracy comparison of modelling methods. (B) Comparison of up-down hybrid modeling before and after machine learning. (C) Comparison of hierarchical modeling before and after machine learning.
According to the above diagram (Figure 10A), the overall performance of upper and lower modelling is better than those of the other methods. Comparing the upper and lower modelling approach with the stratum modelling approach, it can be seen that the two have similar accuracies. Compared with lithology modelling and overlapping hybrid modelling, stratum modelling and upper and lower hybrid modelling can improve accuracy by 13.18%, 14.68%, 13% and 14.5%, respectively, which can effectively improve the modelling effect. Therefore, this paper studies mainly upper and lower modelling and stratum modelling based on kriging interpolation.
4.1.1 Prediction effect analysis of upper and lower hybrid modelling
Figure 10B and Table 9 reveal that machine learning based on the KNN algorithm can effectively predict formation information. According to the analysis of modelling accuracy, the KNN algorithm has a poor effect in upper and lower modelling prediction. When adding an appropriate amount of profile drilling, combined with the initial amount of drilling, the prediction can obtain results that are more accurate, and for some low-accuracy points, the addition of virtual drilling can effectively improve modelling accuracy. The amount of data should not be too large, and the accuracy can be improved by adding corresponding profile points in the missing parts of the data. When the amount of data is too large, not only is it difficult to model the operation but it also takes a long time, and the accuracy rate is worse than that of adding an appropriate number of points. Therefore, in the case of the KNN and kriging coupling algorithm, it is necessary to select the appropriate number of vacant area profile points.
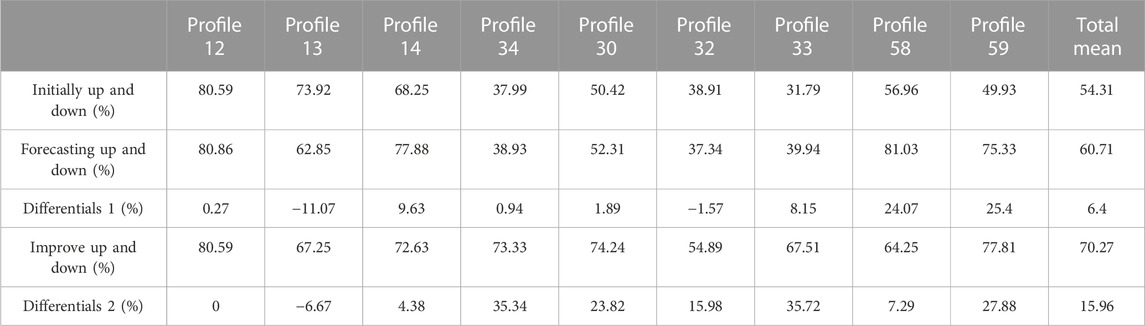
TABLE 9. Machine learning of upper and lower hybrid modelling.
4.1.2 Formation modelling prediction effect analysis
Figure 10C and Table 10 show that the KNN algorithm has a good effect in stratigraphic modelling and prediction, and most of the profiles have been significantly improved. According to the distribution of boreholes (Figure 11), only the upper parts of profiles 13 and 14 are distributed, there is no borehole distribution in the lower part, and other effective boreholes are far away. Therefore, it is impossible to improve the corresponding accuracy according to the machine learning algorithm, and thus, it is necessary to add some effective boreholes around the profile to improve the corresponding accuracy. According to the average accuracy, the two profiles have good results, and thus, no virtual drilling can be added.
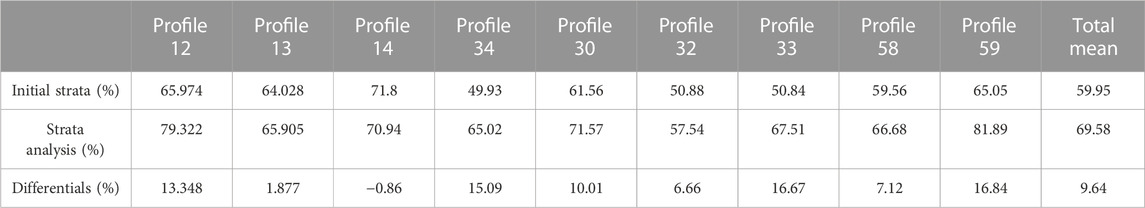
TABLE 10. Machine learning analysis of stratum modelling.
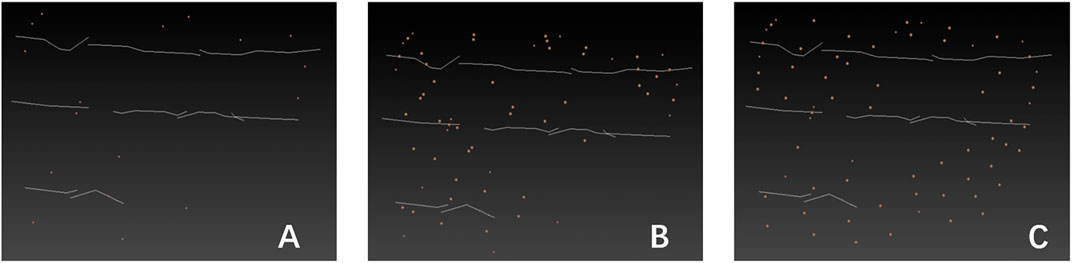
FIGURE 11. Borehole distribution comparison. (A) Initial drilling. (B) Virtual drilling. (C) Improved drilling.
By analysing the above two prediction methods and prediction results (Table 11), it can be seen that the formation prediction based on the KNN algorithm requires data preprocessing, which can be divided into preprediction and postprediction processing. These two types of processing are similar, and simpler preprediction processing can be selected. This prediction method can be used for geological modelling when the degree of stratification is good and the amount of data is small. For the case of poor stratification and high geological complexity, the upper and lower modelling method based on the KNN algorithm can be selected, but the uniformity of the initial data distribution should be considered, and the appropriate method should be selected according to the final data processing time. Figure 12.
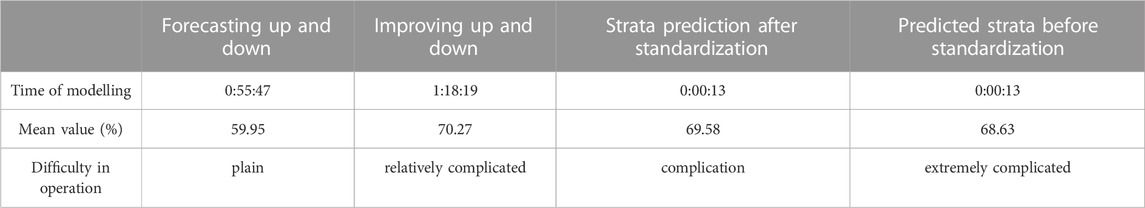
TABLE 11. Comparison of machine learning prediction methods.
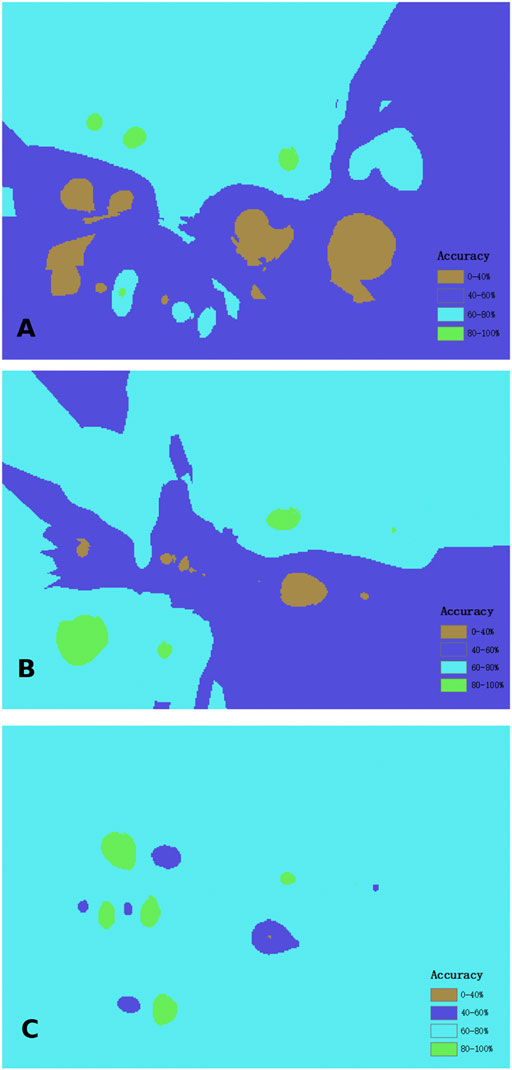
FIGURE 12. Comparison chart of borehole distribution accuracies. (A) Initial drilling. (B) Virtual drilling. (C) Improved drilling.
4.2 Analysis of virtual borehole distribution
According to the principle analysis of the kriging and KNN algorithms, the borehole distance has a strong influence on model accuracy. This paper intends to analyse distances and borehole distributions (Figure 11). The analysis results are presented below.
(1) The above figure shows that the distribution of the improved borehole is more uniform than is that before improvement. The analysis results show that adding an appropriate number of data points can effectively improve modelling accuracy. The analysis of the kriging interpolation algorithm needs to consider the principle of data distribution. Under the condition of an uneven data distribution, the geological conditions cannot be accurately analysed and counted.
(2) Considering the uniformity and influence of distance, for profiles 14 and 58, the overall degree of accuracy after improvement is lower than that before improvement because the distance is too close. According to research, the drilling distance needs to be moderate, and the number of virtual drillings should not be too large. When the number of virtual drillings is too large, the degree of model accuracy decreases.
(3) According to, the use of Delaunay triangle and Thiessen polygon intersections can effectively model complex geological regions. It can be seen from the initial to the final diagram that modelling accuracy can be gradually improved under the method described in this study and can be greatly improved under the condition of a suitable virtual drilling distance.
4.3 Complex geological visualization effects
This study analyses the effect of machine learning in complex stratigraphic modelling, taking profile 59 (Figure 13) as an example. According to Table 9, the accuracy rates before and after the prediction of mixed modelling are 49.93% and 77.81%, respectively, and those before and after the prediction of formation modelling are 65.05% and 81.89%. According to the initial and prediction model profiles of mixed modelling and stratum modelling in Figure 13, it can be seen that machine learning reduces mainly the stratum interruption caused by insufficient data volume in the initial model, making the overall model construction and connections between strata smoother, which is more in line with geological structure and geological genesis. According to the mixed borehole data table, the reason for the lenses in the upper and lower layered modelling area is that the number of virtual boreholes is insufficient, and only some areas can be constructed. Therefore, when using upper and lower mixed modelling, it is necessary to increase the amount of data and reduce the size of the unreasonable formation structure caused by the lack of data.
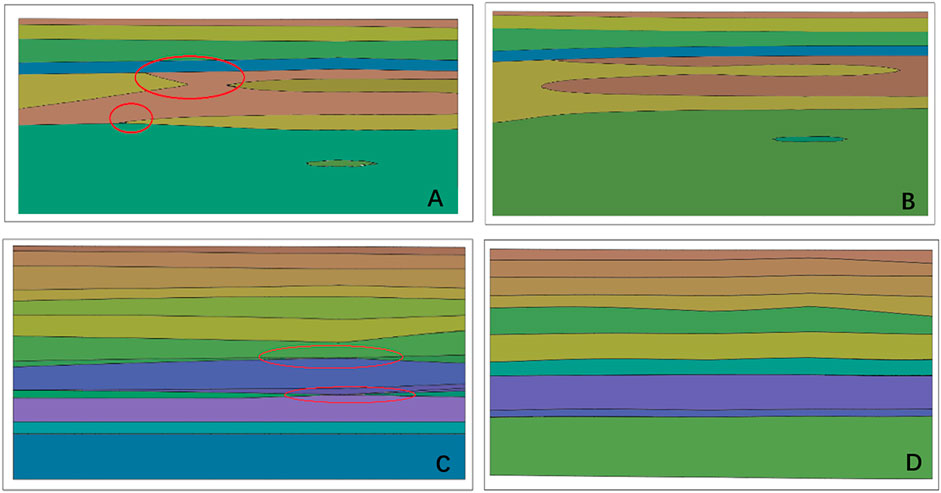
FIGURE 13. Comparison of complex stratigraphic profiles. (A) Initial hybrid modelling profile. (B) Predicted hybrid modelling profile. (C) Initial formation modelling profile. (D) Prediction formation modelling profile.
In this paper, profiles 30, 32, and 33 are selected for complex geological structure analysis. Figure 14 shows that stratum modelling has a larger number of overlapping strata in complex geological areas, which cannot be accurately visualized for lenticles, karsts and other areas but can be better visualized for stratum pinch-out, compared to the other types of modelling. The mixed modelling approach has a large mutation phenomenon in the stratum pinch-out area, and the effect of pinch-out geological construction is poor, while in abrupt areas such as karsts and lenses, this approach has a better treatment effect. The mixed modelling and stratigraphic modelling accuracies of profile 30 are 74.24% and 71.57%, respectively; those of profile 32 are 54.89% and 57.54%, respectively; and those of profile 33 are the same. According to the accuracy, it can be seen that the two models have similar modelling effects in this area. Therefore, both models can be visualized for the geological area, and the corresponding modelling methods can be selected according to different geological conditions and visualization requirements.
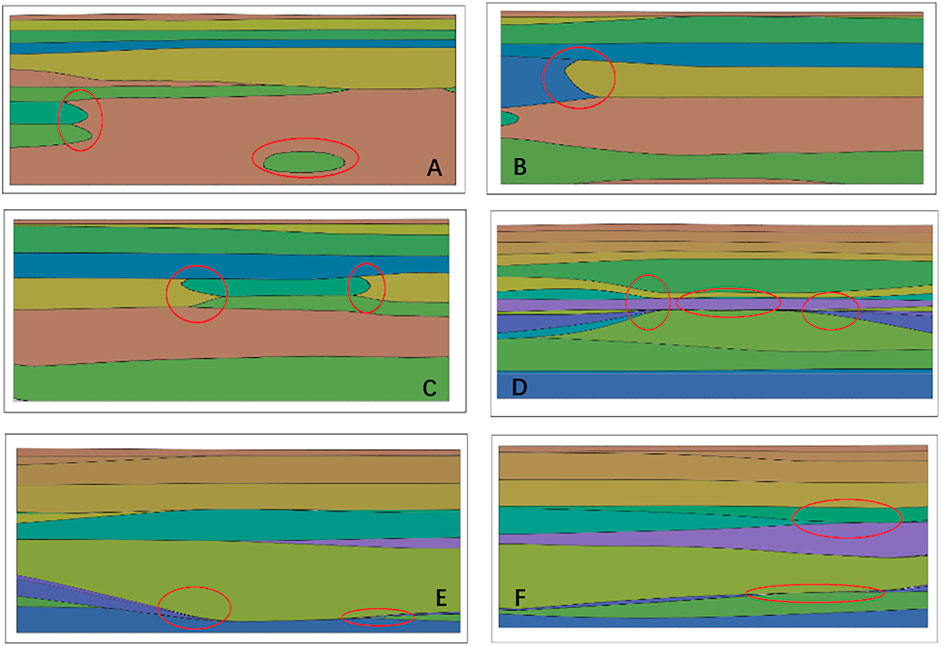
FIGURE 14. Comparison of the complex structural profile. (A) Mixed modelling profile 30. (B) Mixed modelling profile 32. (C) Mixed modelling profile 30. (D) Mixed modelling profile 32. (E) Stratigraphic modelling profile 32. (F) Stratigraphic modelling profile 33.
5 Conclusion
(1) In the method described in this paper, the KNN algorithm has better performance for complex geological areas with less data. In the machine learning algorithm, the accuracies of the fine KNN model, the wide neural network model and the fine Gaussian SVM model are higher, at 95.5%, 94.6%, and 92.4%, respectively. Moreover, the ROC curve performs better in the machine learning algorithm, while the confusion matrix shows that the fine Gaussian SVM has only an 82.2% true rate for a certain lithology, and its performance is poor.
(2) Virtual boreholes can be effectively added by using Delaunay triangle and Thiessen polygon intersection. This method can effectively apply KNN algorithm to geological modeling. According to the addition of profile and virtual boreholes, increasing the appropriate number of uniformity points can effectively improve modelling accuracy. At the same time, the influence of distance should be considered simultaneously with uniformity. In the case of a distance that is too close, model accuracy will be negatively improved.
(3) Data encryption, data standardization, model verification, and optimization algorithms for virtual drilling processing can effectively improve the accuracy of the model. Borehole encryption has a great influence on the prediction accuracy of the model. When the encryption degrees are 0.1 and 1, the accuracies are 95.5% and 58.5%, respectively. Compared with grid and random search, Bayesian optimization can improve model accuracy by 5.24% and has better average performance in complex geological areas. Standardization and 5-fold cross-validation can also greatly improve the accuracy of the model.
(4) The combination of KNN algorithm and Kriging algorithm has better modeling effect. Through the verification method described in this paper, the accuracy of the model can be effectively verified. For the stratum modeling using this combined algorithm, it has a 10% improvement. The up-and-down hybrid modeling can increase by 20%. The distribution of virtual boreholes has a great influence on the upper and lower hybrid modeling, so it is necessary to pay attention to the distribution of boreholes when modeling. The two improved methods can eventually show better modeling results.
(5) The machine learning algorithm mainly reduces the degree of mutation of the initial model, makes the overall model and stratum connection smooth, and is more in line with geological structure and geological genesis. In complex geological areas, there are many stratigraphic overlaps in stratigraphic modelling, which cannot be effectively visualized for lenses, karsts and other areas but have a better visualization effect on the stratigraphic pinch-out phenomenon. The mixed modelling approach has a large mutation in the stratum pinch-out area, and the effect of pinch-out geological construction is poor, while in abrupt areas such as karsts and lenses, it has a good processing effect.
(6) The method described in this paper has high requirements for data uniformity, and a reasonable virtual borehole layout is needed. In the case of poor borehole distribution, borehole addition is also needed. However, this method is simple, easy to use and interpretable. In the complex geological area with less known data, the combination of KNN algorithm and Kriging algorithm can effectively improve the accuracy of the model. It has good visualization effect for complex geology such as stratum pinchout and karst. At the same time, this method can greatly improve the efficiency of geological modeling and provide a reliable basis for the development, utilization and planning of underground space.
Data availability statement
The raw data supporting the conclusion of this article will be made available by the authors, without undue reservation.
Author contributions
XL: Writing–original draft, Writing–review and editing. PZ: Writing–review and editing. YG: Writing–review and editing. GM: Writing–review and editing. ML: Writing–review and editing.
Funding
The author(s) declare financial support was received for the research, authorship, and/or publication of this article. This research was funded by the National Natural Science Foundation of China (42177167) and the Natural Science Foundation of Shandong Province (ZR2019QEE008).
Acknowledgments
The authors thank PZ, YG, and GM who provided valuable comments that greatly improved the manuscript.
Conflict of interest
The authors declare that the research was conducted in the absence of any commercial or financial relationships that could be construed as a potential conflict of interest.
Publisher’s note
All claims expressed in this article are solely those of the authors and do not necessarily represent those of their affiliated organizations, or those of the publisher, the editors and the reviewers. Any product that may be evaluated in this article, or claim that may be made by its manufacturer, is not guaranteed or endorsed by the publisher.
References
Adhikary, S. K., Muttil, N., and Yilmaz, A. G. (2017). Cokriging for enhanced spatial interpolation of rainfall in two Australian catchments. Hydrol. process 31 (12), 2143–2161. doi:10.1002/hyp.11163
An, L., Han, B., Li, P., Dai, Z., and Wang, X. (2022). Research on interpolation error analysis of geological modeling of intelligent working face. Coal Geol. Explor. 50 (06), 184–189. doi:10.12363/issn.1001-1986.21.07.0368
Bacal, M., Hwang, S., and Guevarra-Segura, I. (2019). Predictive lithologic mapping of South Korea from geochemical data using decision trees. J. Geochem Explor 205, 106326. doi:10.1016/j.gexplo.2019.06.008
Bai, T., and Tahmasebi, P. (2020). Hybrid geological modeling: combining machine learning and multiple-point statistics. Comput. Geosci. 142, 104519. doi:10.1016/j.cageo.2020.104519
Bullejos, M., Cabezas, D., Martín-Martín, M., and Alcalá, F. J. (2022). A K-nearest neighbors algorithm in Python for visualizing the 3D stratigraphic architecture of the Llobregat River Delta in NE Spain. J. Mar. Sci. Eng. 10 (7), 986. doi:10.3390/jmse10070986
Calcagno, P., Chilès, J. P., Courrioux, G., and Guillen, A. (2008). Geological modelling from field data and geological knowledge: Part I. Modelling method coupling 3D potential-field interpolation and geological rules. Phys Earth Planet. 171 (1-4), 147–157. doi:10.1016/j.pepi.2008.06.013
Cao, Q., Xiang, W., Jia, H., Wang, F., and Li, Q. (2013). Application of cross-hole ultra-density resistivity method to detection of spherically weathered granite. J. Eng. Geol. 21 (05), 730–735. doi:10.3969/j.issn.1004-9665.2013.05.009
Che, D., and Jia, Q. (2019). Three-dimensional geological modeling of coal seams using weighted Kriging method and multi-source data. IEEE Access 7, 118037–118045. doi:10.1109/access.2019.2936811
Chen, J., Shang, D., Zhao, Z., and Chen, C. (2023a). Prediction method of fracture behaviors of rock samples with an infilled fracture based on machine learning. Chin. J. Rock Mech. Eng. 42 (S1), 3458–3472. doi:10.13722/j.cnki.jrme.2022.0284
Cheng, X., Li, T., Ma, C., Han, Y., Zeng, P., Huang, J., et al. (2023). Fast modeling method of multi-attribute 3d geological model and application in high geostress tunnel. J. Eng. Geol. 31 (03), 959–967. doi:10.13544/j.cnki.jeg.2021-0038
Erdogan Erten, G., Yavuz, M., and Deutsch, C. V. (2022). Combination of machine learning and kriging for spatial estimation of geological attributes. Nat. Resour. Res. 31 (1), 191–213. doi:10.1007/s11053-021-10003-w
Fu, W., Zhang, K., Ma, X., Liu, P., Zhang, L., Yan, X., et al. (2023). Deep conditional generative adversarial network combined with data-space inversion for estimation of high-dimensional uncertain geological parameters. Water Resour. Res. 59 (3), e2022WR032553. doi:10.1029/2022WR032553
Ghezelbash, R., Maghsoudi, A., Bigdeli, A., and Carranza, E. (2021). Regional-scale mineral prospectivity mapping: support vector machines and an improved data-driven multi-criteria decision-making technique. Nat. Resour. Res. 30, 1977–2005. doi:10.1007/s11053-021-09842-4
Guo, J., Liu, Y., Han, Y., and Wang, X. (2019). Implicit 3D geological modeling method for borehole data based on machine learning. J. Northeast. Univ. Sci. 40 (09), 1337–1342.
He, K., Zhang, X., Ren, S., and Sun, J. (2015). “Delving deep into rectifiers: surpassing human-level performance on imagenet classification,” in Proceedings of the IEEE international conference on computer vision, Santiago, Chile, 07-13 December 2015 (IEEE), 1026–1034. doi:10.1109/ICCV.2015.123
He, Z., Zhao, X., Zhang, W., Lv, X., Zhu, D., Zhao, L., et al. (2023). Progress and direction of geological modeling for deep and ultra-deep carbonate reservoirs. Oil Gas Geol. 44 (01), 16–33. doi:10.11743/ogg20230102
Hillier, M., Wellmann, F., Brodaric, B., Kemp, E., and Schetselaar, E. (2021). Three-dimensional structural geological modeling using graph neural networks. Math. Geosci. 53 (8), 1725–1749. doi:10.1007/s11004-021-09945-x
Hu, J., Zhou, T., Ma, S., Yang, D., Guo, M., and Huang, P. (2022). Rock mass classification prediction model using heuristic algorithms and support vector machines: a case study of Chambishi copper mine. Sci. Rep. 12 (1), 928. doi:10.1038/s41598-022-05027-y
Hu, R., Hu, Y., and Li, S. (2018). Modeling algorithm of complex interface of bedrock and cover layer. Yangtze River 49 (15), 66–73. doi:10.16232/j.cnki.1001-4179.2018.15.013
Jeong, H., Sun, A. Y., Lee, J., and Min, B. (2018). A learning-based data-driven forecast approach for predicting future reservoir performance. Adv. Water Resour. 118, 95–109. doi:10.1016/j.advwatres.2018.05.015
Jessell, M. (2001). Three-dimensional geological modelling of potential-field data. Comput. Geosci-UK 27 (4), 455–465. doi:10.1016/S0098-3004(00)00142-4
Jia, Q., Li, W., and Che, D. (2020). A triangulated irregular network constrained ordinary kriging method for three-dimensional modeling of faulted geological surfaces. IEEE Access 8, 85179–85189. doi:10.1109/access.2020.2993050
Jia, R., Lv, Y., Wang, G., Carranza, E., Chen, Y., Wei, C., et al. (2021). A stacking methodology of machine learning for 3D geological modeling with geological-geophysical datasets, Laochang Sn camp, Gejiu (China). Comput. Geosci. 151, 104754. doi:10.1016/j.cageo.2021.104754
Jin, X., Wang, G., Tang, P., Hu, C., Liu, Y., and Zhang, S. (2020). 3D geological modelling and uncertainty analysis for 3D targeting in Shanggong gold deposit (China). J. Geochem Explor 210, 106442. doi:10.1016/j.gexplo.2019.106442
Krige, D. G. (1951). A statistical approach to some basic mine valuation problems on the Witwatersrand. J. S Afr. I Min. Metall. 52 (6), 119–139. doi:10.10520/AJA0038223X_4792
Li, P., Jin, D., Cheng, J., and Zhao, C. (2020). Development of transparent mine hydro-geological modeling software based on open CASCADE and ordinary kriging algorithm. Saf. Coal Mines 51 (05), 138–141. doi:10.13347/j.cnki.mkaq.2020.05.029
Li, Q., Zhang, L., Cao, D., Dong, Q., Cui, Y., and Chen, C. (2016). Usage, status, problems, trends and suggestions of 3D geological modeling. Geol. Explor. 04, 759–767. doi:10.13712/j.cnki.dzykt.2016.04.018
Li, X., Cui, J., Hu, W., and Li, C. (2022b). Application of machine learning method based on multi-source geophysical data to geological body classification-A case study of Duobaoshan ore concentration area (Heilongjiang,China). Chin. J. Geophys. 65 (09), 3634–3649. doi:10.6038/cjg2022P0433
Li, X., Yuan, F., Zhang, M., Jia, C., Jowitt, S. M., Ord, A., et al. (2015). Three-dimensional mineral prospectivity modeling for targeting of concealed mineralization within the Zhonggu iron orefield, Ningwu Basin, China. Ore Geo Rev. 71, 633–654. doi:10.1016/j.oregeorev.2015.06.001
Li, Y., Zhong, B., Xu, X., and Liang, Z. (2022a). A spatial interpolation method based on multidimemsional scaling and adaptive boosting regressor: a geological attribute body case study. Sci. Technol. Eng. 22 (26), 11334–11341. doi:10.3969/j.issn.1671-1815.2022.26.009
Liu, D., Rao, X., Zhao, H., Xu, F., and Gong, X. (2021b). An improved data space inversion method to predict reservoir state fields via observed production data. Pet. Sci. 18 (4), 1127–1142. doi:10.1016/j.petsci.2021.07.008
Liu, H., Chen, S., Hou, M., and He, L. (2020). Improved inverse distance weighting method application considering spatial autocorrelation in 3D geological modeling. Earth Sci. Inf. 13, 619–632. doi:10.1007/s12145-019-00436-6
Liu, H., Li, W., Zeng, W., Bao, L., Mei, Y., Guo, J., et al. (2023). Influence of adaptive inverse distance weighting method under membership function mapping on the interpolation accuracy of geological boreholes. Earth Sci. Inf. 16 (3), 2767–2779. doi:10.1007/s12145-023-01074-9
Liu, Z., Zhang, Z., Zhou, C., Ming, W., and Du, Z. (2021a). An adaptive inverse-distance weighting interpolation method considering spatial differentiation in 3D geological modeling. Geosci. J. 11 (2), 51. doi:10.3390/geosciences11020051
Mehrabi, A., Derakhshani, R., Nilfouroushan, F., Rahnamarad, J., and Azarafza, M. (2023). Spatiotemporal subsidence over Pabdana coal mine Kerman Province, central Iran using time-series of Sentinel-1 remote sensing imagery. Episodes J. Int. Geoscience 46 (1), 19–33. doi:10.18814/epiiugs/2022/022009
Nanehkaran, Y., Licai, Z., Chengyong, J., Chen, J., Anwar, S., Azarafza, M., et al. (2023). Comparative analysis for slope stability by using machine learning methods. Appl. Sci. 13 (3), 1555. doi:10.3390/app13031555
Nistor, M. M., Rahardjo, H., Satyanaga, A., Hao, K. Z., Xiaosheng, Q., and Sham, A. W. L. (2020). Investigation of groundwater table distribution using borehole piezometer data interpolation: case study of Singapore. Eng. Geol. 271, 105590. doi:10.1016/j.enggeo.2020.105590
Olierook, H., Scalzo, R., Kohn, D., Chandra, R., Farahbakhsh, E., Clark, C., et al. (2021). Bayesian geological and geophysical data fusion for the construction and uncertainty quantification of 3D geological models. Geosci. Front. 12 (1), 479–493. doi:10.1016/j.gsf.2020.04.015
Potratz, G., Canchumuni, S., Castro, J., Potratz, J., and Pacheco, M. (2021). Automatic lithofacies classification with t-SNE and K-nearest neighbors algorithm. Anuário Do Inst. De. Geociências 44, 35024. doi:10.11137/1982-3908_2021_44_35024
Pratama, H. (2019). “Machine learning: using optimized KNN (K-Nearest Neighbors) to predict the facies classifications,” in Proceedings of the 13th SEGJ international symposium (Tokyo, Japan: Society of Exploration Geophysicists and Society of Exploration Geophysicists of Japan), 538–541. doi:10.1190/SEGJ2018-139.1
Ren, Q., Zhang, D., Zhao, X., Yan, L., and Rui, J. (2022). A novel hybrid method of lithology identification based on k-means++ algorithm and fuzzy decision tree. J. Pet. Sci. Eng. 208, 109681. doi:10.1016/j.petrol.2021.109681
Shi, C., and Wang, Y. (2021). Development of subsurface geological cross-section from limited site-specific boreholes and prior geological knowledge using iterative convolution XGBoost. J. Geotech. Geoenviron 147 (9), 04021082. doi:10.1061/(ASCE)GT.1943-5606.0002583
Song, R., Cui, L., Tao, Y., He, Q., Yin, B., Zhang, P., et al. (2018). A method for determining and implementing the virtual borehole based on GIS spatial analysis. Coal Geol. Explor. 46 (06), 67–73. doi:10.3969/j.issn.1001-1986.2018.06.009
Sun, W., and Durlofsky, L. J. (2019). Data-space approaches for uncertainty quantification of CO2 plume location in geological carbon storage. C 123, 234–255. doi:10.1016/j.advwatres.2018.10.028
Wang, C., Wang, G., Liu, J., and Zhang, D. (2019a). 3D geochemical modeling for subsurface targets of Dashui Au deposit in Western Qinling (China). J. Geochem Explor 203, 59–77. doi:10.1016/j.gexplo.2019.04.003
Wang, D., Peng, J., Yu, Q., Chen, Y., and Yu, H. (2019b). Support vector machine algorithm for automatically identifying depositional microfacies using well logs. Sustainability 11 (7), 1919. doi:10.3390/su11071919
Wang, H., Yan, J., Qi, G., and Fu, G. (2023a). Metallogenic prediction method based on gravity and magnetic three-dimensional modeling and machine learning: a case study of Zhuxi. Prog. Geophys. 38 (02), 734–747. doi:10.6038/pg2023GG0091
Wang, J., Qin, Z., Cao, Z., Chen, Y., and Shi, Y. (2021). Modified kriging spatial interpolation algorithm based on octree mechanism. J. Zhengzhou Univ. Eng. Sci. 42 (06), 21–27. doi:10.13705/j.issn.1671-6833.2021.06.004
Wang, X., Yang, S., Zhao, Y., and Wang, Y. (2018). Lithology identification using an optimized KNN clustering method based on entropy-weighed cosine distance in Mesozoic strata of Gaoqing field, Jiyang depression. J. Pet. Sci. Eng. 166, 157–174. doi:10.1016/j.petrol.2018.03.034
Wang, Z., Hu, Y., Guo, X., He, X., Kek, H. Y., Ku, T., et al. (2023b). Predicting geological interfaces using stacking ensemble learning with multi-scale features. Can. Geotech. J. 60, 1036–1054. doi:10.1139/cgj-2022-0365
Wang, Z., Qu, H., Wu, Z., Yang, H., and Du, Q. (2016). Formal representation of 3D structural geological models. Comput. Geosci-UK 90, 10–23. doi:10.1016/j.cageo.2016.02.007
Xiao, F., Wei, S., Bao, Y., Wei, H., and Jin, L. (2012). Overview of three-dimensional geological modeling technology. Ieri Procedia 2, 921–927. doi:10.1016/j.ieri.2012.06.192
Xiong, J., and Liu, X. (2022). A 3D geological model of the north one mining area of gubei coal mine based on the support vector machine. Sci. Technol. Eng. 22 (19), 8194–8199. doi:10.3969/j.issn.1671-1815.2022.19.006
Zhang, P., Zhang, D., Yang, Y., Zhang, W., Wang, Y., Pan, Y., et al. (2022). A case study on integrated modeling of spatial information of a complex geological body. Lithosphere. Spec. 10, 2918401. doi:10.2113/2022/2918401
Zhang, Q., and Zhu, H. (2018). Collaborative 3D geological modeling analysis based on multi-source data standard. Eng. Geol. 246, 233–244. doi:10.1016/j.enggeo.2018.10.001
Zhang, Z., Wang, G., Liu, C., Cheng, L., and Sha, D. (2021). Bagging-based positive-unlabeled learning algorithm with Bayesian hyperparameter optimization for three-dimensional mineral potential mapping. Comput. Geosci-UK 154, 104817. doi:10.1016/j.cageo.2021.104817
Zhou, C., Ouyang, J., Ming, W., Zhang, G., Du, Z., and Liu, Z. (2019). A stratigraphic prediction method based on machine learning. Appl. Sci. 9 (17), 3553. doi:10.3390/app9173553
Zhou, K., Zhang, J., Ren, Y., Huang, Z., and Zhao, L. (2020). A gradient boosting decision tree algorithm combining synthetic minority oversampling technique for lithology identification. Geophysics 85 (4), WA147–WA158. doi:10.1190/geo2019-0429.1
Keywords: fine KNN, kriging, complex geology, modelling, virtual drilling
Citation: Liu X, Zhang P, Guo Y, Ma G and Liu M (2023) Study of a high-precision complex 3D geological modelling method based on a fine KNN and kriging coupling algorithm: a case study for Jiangsu, China. Front. Earth Sci. 11:1325907. doi: 10.3389/feart.2023.1325907
Received: 22 October 2023; Accepted: 28 November 2023;
Published: 29 December 2023.
Edited by:
Chong Xu, Ministry of Emergency Management, ChinaReviewed by:
Shui-Hua Jiang, Nanchang University, ChinaMohammad Azarafza, University of Tabriz, Iran
Zhiwen Xue, University of Chinese Academy of Sciences, China
Jun Zheng, Zhejiang University, China
Copyright © 2023 Liu, Zhang, Guo, Ma and Liu. This is an open-access article distributed under the terms of the Creative Commons Attribution License (CC BY). The use, distribution or reproduction in other forums is permitted, provided the original author(s) and the copyright owner(s) are credited and that the original publication in this journal is cited, in accordance with accepted academic practice. No use, distribution or reproduction is permitted which does not comply with these terms.
*Correspondence: Peng Zhang, emhhbmdwY2huQHF1dC5lZHUuY24=