 Shute Su
 Liang Wang
 Jun Li1
 Jun Jia
95% of researchers rate our articles as excellent or good
Learn more about the work of our research integrity team to safeguard the quality of each article we publish.
Find out more
ORIGINAL RESEARCH article
Front. Earth Sci. , 16 January 2024
Sec. Solid Earth Geophysics
Volume 11 - 2023 | https://doi.org/10.3389/feart.2023.1325094
This article is part of the Research Topic Rock Physics of Unconventional Reservoirs, volume II View all 15 articles
Shale oil, an important component of unconventional oil and gas resources, mainly exists in the storage spaces such as shale pores, microfractures, etc. Porosity is commonly used to quantitatively describe the storage space of shale oil and is a key parameter in reservoir evaluation. However, there are significant differences in the results by existing experimental methods for porosity measurement, and moreover, it is difficult to compare the porosity obtained by the experimental measurement method with the logging calculation method. It is urgent to explore reasons for the differences in porosity measurement between various porosity experiments and logging calculations of the shale oil reservoir, and propose an effective method for shale oil reservoir to characterize porosity. In this research, core samples of shale oil reservoirs from the Lianggaoshan Formation of the Sichuan Basin were selected to measure the porosity by means of experimental methods including helium gas charging, saturation liquid method, nuclear magnetic resonance (NMR), etc. Meanwhile, porosity was calculated using the combination method of lithology scanning (LS) logging and conventional logging as well as the NMR logging method. Subsequently, porosity experimental results and logging calculation results were compared to clarify the applicability of various porosity characterization methods. The research results indicate that: 1) The porosity measurement results by the saturation liquid method and the NMR experimental method are close, both greater than that using the helium gas charging method; 2) The hydrogen signal of the dry-state sample is significant in the NMR experiment, mainly originating from organic matter and clay minerals; 3) The NMR short relaxation component in the water-saturated state primarily reflects the signal of organic matter and clay mineral matrix, while the long relaxation component reflects the pore fluid component; 4) After deducting the NMR signal of the dry-state core, the core NMR porosity measurement results under the water-saturated state agree well with that using the saturation liquid method, which is an indicative of effective reservoir porosity; 5) The NMR logging is limited by its echo spacing and cannot reflect the signal from organic matter and the crystal water in clay minerals at T2 < 0.3 ms. Taken together, the porosity measurement method of subtracting the dry-state NMR signal from the water-saturated state NMR signal is considered effective and can be used to reflect the porosity of shale oil reservoirs in the Lianggaoshan Formation of the Sichuan Basin.
With the continuous growth in global oil and gas demand and advancements in horizontal well drilling and fracturing technology, the exploration and development of shale oil reservoirs have become the focus of academic and industrial interest in recent years (Liu and Liu, 2006; Zhang et al., 2014; Jin et al., 2019; Li et al., 2019). Shale oil, as a type of unconventional oil and gas with enormous potential, has been recognized by geologists worldwide as an important supplement to the growth of oil and gas reserves in major basins (Schmoker, 2002; Zhang et al., 2015; Hu et al., 2020). Currently, the United States has been the most successful in the exploration and development of shale oil and gas, with a production accounting for over 60% of its total crude oil production (Zou et al., 2014; Zou et al., 2020). Shale oil explorations such as Barnett (Zeng et al., 2011; Modica and Lapierre, 2012), Eagle Ford (Domovan et al., 2016), and Bakken (Pollastro et al., 2012)in the United States have become the subject of study for various countries. Additionally, shale oil regions such as Montney and Horn River in Canada (Chalmers and Bustin, 2012) and the Bazhenov shale formation in Russia (Kontorovich et al., 2018) have also seen relatively successful exploration and development of shale oil. In recent years, the shale oil exploration in China has primarily focused on continental shale oil (Zou et al., 2010). As of 2023, significant discoveries of shale oil and gas formations have been made in various regions in China, including the Gulong shale oil area in Daqing (Sun et al., 2021), the Lucaogou Formation shale oil in the Junggar Basin (Yang et al., 2018; Zhi et al., 2019), and the Yanchang formation shale oil in the Ordos Basin (Cui et al., 2019; Fu et al., 2020).
The samples analyzed in this study were collected from the Lianggaoshan Formation located in the northeastern part of the Sichuan Basin. The Lianggaoshan Formation, which is part of the lacustrine sedimentary system, can be divided into three distinct members from bottom to top. The lithology of the formation exhibits strong heterogeneity, comprising pure shale assemblages, shell shale assemblages, and silt-type shale assemblages. Additionally, six thick sets of shale have been identified and documented (Rui et al., 2023). In 2020, significant breakthroughs were made in the exploration of shale oil in the Jurassic Lianggaoshan Formation of the Sichuan Basin (He et al., 2022a; 2022b). On-site tests conducted at the Ping’an 1 Well in the northeastern part of the basin revealed a daily oil production rate of 112.8 m3 and a daily gas production rate of 11.45 × 10⁴ m3, highlighting the significant potential for shale oil and gas exploration in the Lianggaoshan Formation.
Porosity is the most critical parameter for evaluating shale oil reservoirs. The accurate characterization of porosity directly impacts the calculation of shale oil and gas reserves as well as the selection of development plans (Jian-fei et al., 2012). The porosity of shale oil reservoirs can be divided into two main aspects based on different characterization methods: geophysical (seismic and logging) calculations (Yang et al., 2015; Xiu-wen et al., 2011; Zhang et al., 2012; Li et al., 2017; Li et al., 2017) and core experiments (Tian et al., 2012; Jiao et al., 2014; Wang et al., 2014). Due to the influence of seismic data accuracy and resolution, the accuracy of porosity characterization by seismic methods is relatively low and is commonly used to predict the trend of macroscopic porosity changes (Ma et al., 2020). According to the rock physics volume model, conventional logging measurements such as acoustic, density, and neutron loggings can be used to calculate reservoir porosity (Shihe and Zhang, 1996). However, the key to accurately calculating reservoir porosity based on the rock volume physics model is the accurate determination on parameters such as reservoir rock matrix density, neutron, acoustic, etc. The direct acquisition of these reservoir rock matrix parameters relies on lithology scanning (LS) logging (Litho Scanner). The LS logging is based on the inelastic scattering of fast speed neutrons with the atomic nuclei of formation elements to accurately capture the continuous elements and mineral composition of the formation and obtain the matrix density and matrix neutron values with continuous depths (Yan et al., 2018). The obtained signal by nuclear magnetic resonance (NMR) logging is proportional to the quantity of hydrogen nuclei in the detecting formation. Through calibration, the NMR logging signal can accurately reflect the formation porosity. Furthermore, based on the accurately obtained NMR T2 cutoff value, porosity can be divided into clay bound water porosity, capillary bound water porosity, and movable fluid porosity (Zhi-qiang et al., 2010).
The methods for determining porosity in shale oil and gas reservoirs mainly include gas charging, saturation liquid, and NMR methods. Shale oil and gas reservoirs are rich in organic matter, with pores primarily in the nano to micrometer range. To prevent gas medium adsorption, the gas charging method often uses inert helium gas as the medium when measuring porosity (Fu, 2018). The results of this method are mainly influenced by factors such as the degree of sample crushing, gas equilibrium pressure, and equilibrium time. The saturation liquid method is mainly based on the Archimedes’ buoyancy principle. It calculates the porosity through measuring the dry weight of the core and its weight in both air and a known density fluid after saturated with the known fluid, and then calculating the total volume and matrix volume of the core (Zhou et al., 2021). This method may be influenced by clay expansion, wetting properties, the type of saturation fluid, and the degree of saturation. The NMR method has the advantages of fast, accurate, and high resolution, and can effectively reflect the “in situ” and “integrity” of reservoir pores. The intensity of NMR signals in conventional reservoirs depends on the total amount of pore fluid. However, in shale oil and gas reservoirs, hydrogen atoms in clay mineral crystal water and organic matter contain NMR signals, which in turn affect porosity measurement (Wang et al., 2018). Ramirez et al. (2011) applied the NMR method to measure the porosity value of Haynesville shale in Texas, United States. The measured value was obviously different from the porosity measured by the GRI method on crushed core samples. The interpretation of the data involves uncommon specific reservoir evaluation parameters, leading to greater uncertainty. Han et al. (2020) conducted porosity measurements on the Longmaxi Formation shale in the Sichuan Basin and found that different magnetic fields and echo spacings had an impact on the porosity measurement results. Yang et al. (2015) demonstrated through experimental research that, comparing the use of real density and apparent density method, low-temperature nitrogen adsorption method, and helium gas expansion method on both crushed samples and plunger samples, plunger sample porosity determination yielded the most accurate results (Yang et al., 2015). Renyan (2016) used the GRI method, low-pressure nitrogen adsorption method, and NMR method, respectively to measure the shale porosity of the Longmaxi Formation (Renyan, 2016). They concluded that the nitrogen adsorption method yielded the smallest porosity, which was not suitable for shale porosity measurement, and that the NMR measured porosity was greater than the GRI measured porosity. Tian Chong et al. studied the porosity measurement results using the helium gas method under different drying temperatures, vacuum extraction times, and helium gas saturation equilibrium pressures, and found that the helium gas method for porosity measurement based on shale plunger samples under the vacuum extraction and strict equilibrium conditions was relatively accurate and could reflect the effective porosity of shales (Tian et al., 2023).
Literature research shows that the study of porosity in shale oil and gas reservoirs primarily focuses on the shale gas reservoir, with relatively fewer studies on the porosity characterization in shale oil reservoirs. In addition, there are also rare comparative studies between the experimentally measured porosity and the logging-calculated porosity. Under such a condition, this paper conducts research on the core samples of shale oil reservoirs in the Lianggaoshan Formation of the Sichuan Basin. Specifically, experimental methods including helium gas charging, saturation liquid method, and NMR method are used for porosity measurement. Meanwhile, porosity is calculated using the combination method of LS logging and conventional logging as well as the NMR logging method. Next, comparative analysis of differences between experimentally measured porosity and logging-calculated porosity is performed to clarify the applicability of each method. Finally, an effective porosity characterization method for shale oil and gas reservoirs in the Lianggaoshan Formation of the Sichuan Basin is proposed.
The experimental samples for core porosity measurement were taken from the shale oil reservoir section of Well A in the Lianggaoshan Formation of the central Sichuan Basin (Table 1). To avoid water-induced clay expansion commonly occurred in conventional core drilling and the damage to samples caused by hydration (Fu et al., 2012), water-free and wire-cutting methods were taken to prepare the standard plunger samples before experiment. The sample depth, length, diameter, and other information are detailed in Table 1. The TOC of samples ranges from 0.712% to 1.646%, with an average of 1.156%; the clay mineral content ranges from 35.282% to 58.061%, with an average of 44.227%.
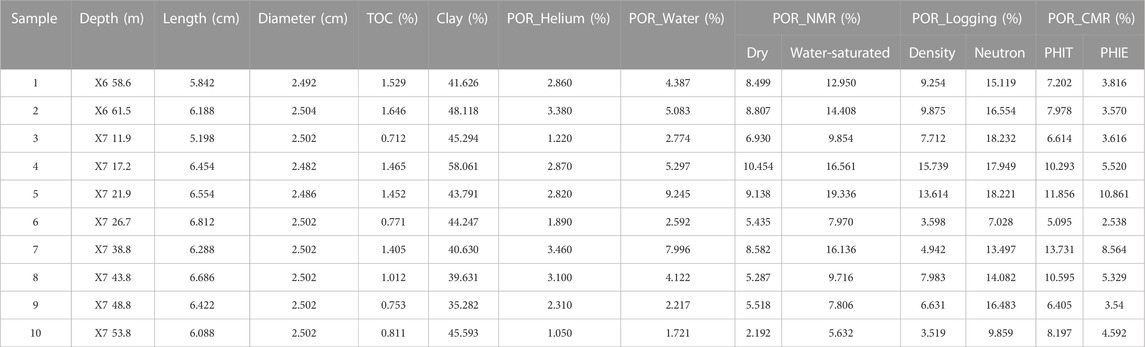
TABLE 1. Basic sample information.
The rock matrix volume was measured according to Boyle’s law, and the formula for calculating the sample rock matrix volume is as follows:
where P1 is the pressure of the reference chamber before expansion, and P2 is the equilibrium pressure of the system after expansion, in MPa; Vr, Vs, and Vg represent the volumes of the reference chamber, sample chamber, and sample matrix, respectively, in cm³; Z1 represents the compressibility factor of the gas under the pressure condition P1; Z2 represents the compressibility factor of the gas under the pressure condition P2. After measuring the rock matrix volume, the rock’s total volume was obtained using the water immersion method, and then the porosity of the cylindrical shale can be calculated as follows:
where
The saturated deionized water method was used to measure the porosity of core samples. Firstly, the mass of the dried sample was measured and recorded as m1, and then the rock sample was weighed after being vacuumed and saturated with distilled water, recording the weight as m2. The porosity measured by the saturated liquid method was calculated as:
where
In the NMR experiment, a sample was placed in a uniform magnetic field, and the hydrogen nuclei in the fluid were polarized by the field. At this moment, a RF field of a certain frequency was applied to the sample. Then the RF field was turned off, and energy was released as the hydrogen nuclei changing from a polarized state to a stable state. In this experiment, the longitudinal relaxation time T1 and the transverse relaxation time T2 were measured by instrument. The relationship between the transverse relaxation time T2 and the semaphore reflected the content and distribution of hydrogen-containing fluids in the formation, and it, after calibration, could also reflect the porosity and pore structure of the formation. The experimental procedure followed the Chinese petroleum industry standard, Specification for measurement of rock NMR parameter in laboratory (SY/T 6490-2014).
The experimental process is as follows. First, the plunger samples were dried to a constant weight in an oven set at 105°C. Subsequently, the experimenter measured the helium porosity of the dried core samples in a laboratory with a room temperature of 25°C and atmospheric pressure of 1 standard atmosphere. Next, measurements were conducted on some of the dried core samples to obtain the one-dimensional NMR T2 and two-dimensional NMR T1-T2 spectra. Next, the dried core samples were pressurized at 20 MPa and saturated with 6,000 ppm water for 24 h. Eventually, the one-dimensional NMR T2 spectra and the two-dimensional NMR T1-T2 spectra of the core samples at the saturated water state were measured, and at the same time, the porosity of the saturated liquid method is measured. In this experiment, a low-field (2 MHz) NMR core analyzer was used as the experimental instrument, the echo spacing was 0.06 ms, the relaxation delay was 3 s, with a total of 2,000 echoes and 256 times of scanning.
Well A has a complete logging suite, including both conventional and unconventional logging data. The conventional loggings include natural gamma ray (GR), spontaneous potential (SP), caliper (CAL), compensated acoustic wave (AC), compensated density (DEN), compensated neutron (CNL), deep lateral resistivity (RD), shallow lateral resistivity (RS), etc. The unconventional loggings include the LS logging and the NMR logging (CMR-NG).
The LS logging result showed that the mineral composition of the shale oil and gas reservoir in the Lianggaoshan Formation was complex, including chlorite, illite, quartz, feldspar, dolomite, calcite, and others. Different elemental contents in each mineral component have a significant impact on the rock matrix density and matrix neutron. With regard to the LS logging, the elemental contents were measured to calculate the rock matrix density RHGE and the matrix neutron TNGE (Liu et al., 2004). Based on the rock matrix neutron and matrix density loggings, the porosity of the shale oil and gas reservoir could be calculated according to the conventional density and neutron loggings by using the rock physics volume model. The formula for calculating porosity based on the neutron and density loggings can be expressed as:
where PORD and PORN are the logging-calculated density porosity and neutron porosity, respectively, in decimal form; DEN and DENf are the density logging values and fluid density values, respectively, in g/cm³; CNL and CNLf are the neutron logging values and neutron fluid values, respectively, in %; RHGE is the formation matrix density obtained by LS logging, in g/cm³; TNGE is the formation matrix neutron obtained by LS logging, in %.
The principle of porosity calculation with NMR logging is similar to that of the NMR experimental porosity measurement. However, due to factors such as measurement environment, measurement efficiency, and measurement instrument precision, there are certain differences between the obtained parameters by NMR loggings and NMR experiments. The NMR logging for Well A adopted the CMR-NG instrument with a minimum echo spacing of 0.2 ms, which is greater than the 0.06 ms echo spacing in NMR experiments. As the echo spacing increased, the NMR logging became less effective in detecting signals from small pore fluids in the short relaxation section, making its resolution for small pores weaker than that of in the NMR experiment. The NMR logging signal was directly proportional to the number of hydrogen nuclei detected in the formation. With proper calibration, the NMR logging signal could accurately reflect the formation porosity (Xiao et al., 2001). The NMR porosity model for conventional formation includes matrix, dry clay, clay-bound water, irreducible fluid, and movable fluid. Using different T2 cutoff values, the total porosity PHIT, effective porosity PHIE, and movable fluid volume FFI of the rock can be calculated according to Eqs 6–8, respectively and the NMR logging data.
where T2min is the minimum T2 value observed by the NMR logging instrument, in ms, and this value for the CMR-NG instrument was 0.3 ms; T2max is the maximum T2 value observed by the NMR logging instrument, and this value for the CMR-NG instrument was 3000 ms; T2c is the cutoff value of T2 for clay-bound water, in ms; T2cutoff is the cutoff value of T2 for capillary-bound water, in ms.
From Table 1, the porosity measured by the helium gas method ranges from 1.05% to 3.46%, with an average of 2.5%, in which sample 10 shows the minimum porosity value of 1.05% and sample 7 shows the maximum porosity value of 3.46%. The porosity measurement results by the saturation liquid method show that the porosity ranges from 1.721% to 9.245%, with an average of 4.543%, in which sample 10 exhibits the minimum value of 1.721% and sample 5 exhibits the maximum value of 9.245%.
The NMR experimental results of the core samples, both under dry and water-saturated states, are depicted in Figure 1. The arrangement of the samples in the figure is based on the TOC (Total Organic Carbon) content of each sample. Under the dry state, the sample NMR T2 spectrum shows a single peak, with the peak ranging between 0.01 and 0.2 ms. Sample 10 shows the minimum porosity of 2.192% and sample 4 shows the maximum of 10.454%, with an average of 7.084%. Under the water-saturated state, the sample NMR T2 spectrum shows a doublet peaks distribution, with the spectrum peak (P1) during the short relaxation time almost overlapping the spectrum peak under the dry state, ranging between 0.01 and 0.2 ms. The spectrum peak (P2) during the long relaxation time ranges between 0.2 and 3 ms. Some samples exhibit a peak (P3) of 10∼100 ms due to the impact by cracks.
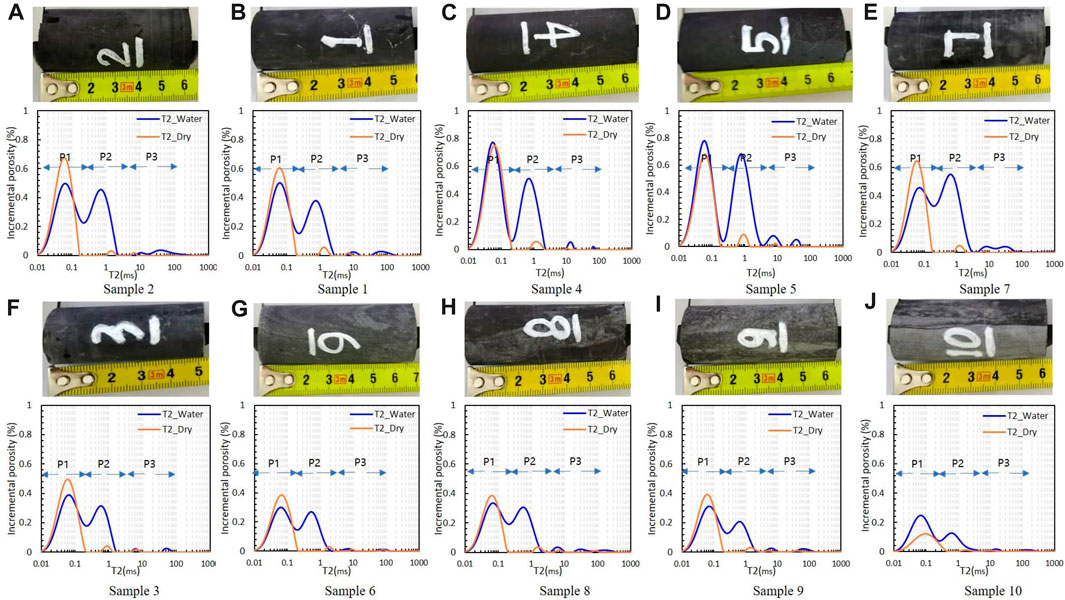
FIGURE 1. The 1D NMR experimental results of core samples under dry and water-saturated states.
Figure 2 shows the calculated porosity using the combination method of conventional logging and LS logging as well as the NMR logging method. In Figure 2, the first track is the depth track, the second track includes the CAL, natural GR, and uranium-free natural GR (KTH). The third track comprises acoustic logging (AC), density logging (DEN), and neutron logging (CNL). The fourth tracks are the matrix density curve (RHGE) and the matrix neutron curve (TNGE) by LS logging, respectively. The fifth track includes the deep resistivity (RD) and the shallow resistivity (RS). The sixth track displays the NMR logging T2 spectrum. The seventh track includes the total porosity (PHIT) and effective porosity (PHIE) by NMR loggings, and the comparison with the effective porosity (PORE_NMR) by NMR experiments. The eighth track compares the helium porosity (POR_QC) with the NMR movable fluid porosity (FFV). The ninth and tenth tracks display the comparison between NMR logging neutron porosity (PORN) and density porosity (PORD) with the NMR experimental effective porosity (PORE_NMR) and the NMR porosity under the water-saturated state (POR_NMR_WATER). The eleventh track presents the clay content (CLAY), total organic carbon content (DWTOC), and the comparison with the NMR experimental effective porosity (PORE_NMR). The twelfth track shows the lithology profile obtained by LS logging.
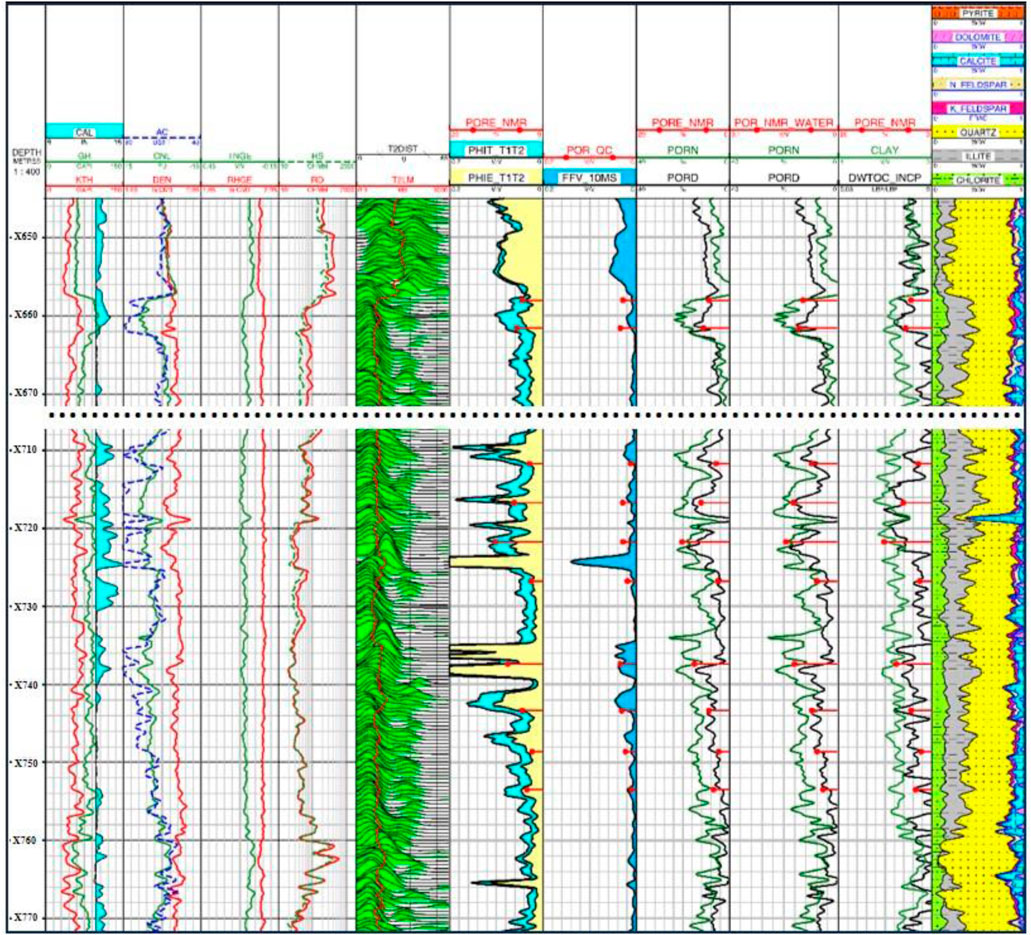
FIGURE 2. The calculated porosity using the combination method of conventional logging and LS logging as well as the NMR logging method.
The porosity logging calculation results at the corresponding depth of the 10 core samples are shown in Table 1. From the table, sample 10 shows the minimum density porosity of 3.519%, and sample 4 shows the maximum value of 15.739%, with an average of 8.287%; sample 6 displays the minimum neutron porosity of 7.028%, and sample 3 displays the maximum value of 18.232%, with an average of 14.702%; sample 6 exhibits the minimum NMR logging total porosity PHIT of 5.095%, and sample 5 exhibits the maximum value of 13.731%, with an average of 8.797%; sample 6 indicates the minimum NMR logging effective porosity PHIE of 2.538%, and sample 7 indicates the maximum value of 10.861%, with an average of 5.196%. Due to the borehole expansion of at the corresponding depth, sample 7 shows larger measurement values of both NMR logging total porosity and NMR logging effective porosity.
The dry-state NMR experimental results revealed significant NMR signals of the cores. The dry-state NMR T2 spectrum exhibited a distinct single-peak feature, and signals at T2 < 0.2 ms showed a significant amplitude. Additionally, there existed minor amplitude of spectrum peaks during the 1–3 ms T2 relaxation time. Figure 1 shows the comparison between the amplitudes of the dry-state NMR T2 spectrum peaks and the color of cores. From the figure, cores with darker colors (samples 1, 2, 4, 5, and 7) exhibit larger T2 spectrum peak amplitudes, while cores with lighter colors (samples 3, 6, 8, 9, and 10) exhibit smaller T2 spectrum peak amplitudes. The T1-T2 two-dimensional NMR experiments under the dry state showed that signals were concentrated in the regions of 0.01 ms < T1 < 10 ms, 0.01 ms < T2 < 0.1 ms, and T1/T2 > 5, as shown in Figure 3. Studies by Fleuery M and GE Xinmin et al. suggested that these signals could be caused by organic matter and the crystal water in clay minerals (Ge et al., 2015; Fleuery and Romero-Sarmiento, 2016).
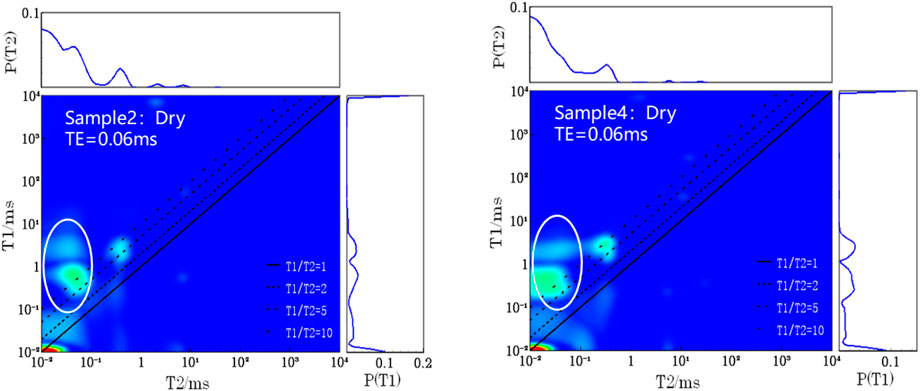
FIGURE 3. 2D NMR experimental results of sample 2 and sample 4 under the dry state.
Comparing the dry-state NMR porosity (Porosity_NMR_Dry) with the TOC and clay mineral content (CALY) of the cores, the TOC and clay mineral content decreased, the dry-state NMR porosity decreased, as depicted in Figure 4. From the figure, sample 4 exhibits the highest NMR porosity in the dry state, primarily due to its highest clay mineral content. The aforementioned analysis indicated that the dry-state NMR signal was likely attributed to the organic matter and clay minerals.
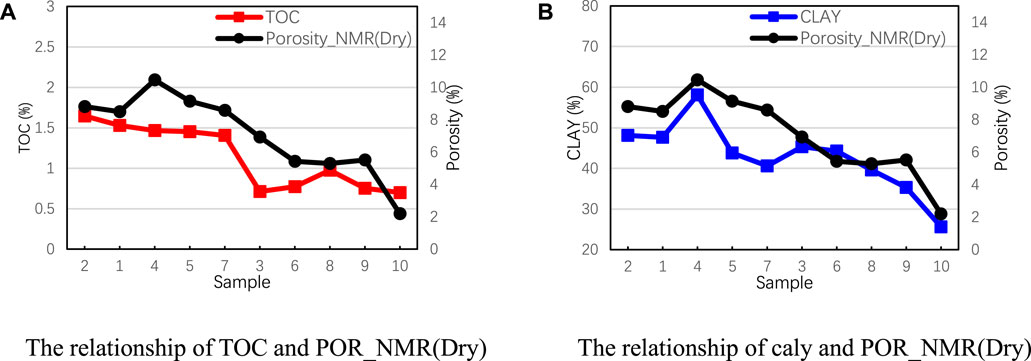
FIGURE 4. Relationship between POR_NMR (dry) and TOC and clay content. (A) The relationship of TOC and POR_NMR(Dry). (B) The relationship of clay and POR_NMR(Dry).
After the core was saturated with water, the NMR T2 spectrum showed doublet peaks, and the short relaxation component spectrum peaks basically coincided with the dry-state spectrum peaks. Therefore, it can be concluded that the 0.01–0.2 ms spectrum peaks in the saturated water state were caused by organic matter and clay mineral crystal water, while the spectrum peaks with a relaxation time greater than 0.2 ms, i.e., P2 and P3, could reflect the core porosity. The determination of core porosity should eliminate the influence of crystal water in clay minerals and hydrogen signals in organic matter. That is, the difference between the water-saturated state porosity and the dry-state NMR porosity was the size of core pores.
Figure 5 presents a comparative illustration of the porosity measurement results using the helium gas charging method, the saturation liquid method, and the method of calibrating NMR hydrogen signals under the water-saturated and dry states. From the figure, the porosity can be ranked as helium porosity < porosity by saturation liquid method < porosity by NMR method under the water-saturated state. The helium porosity is notably lower than that using the saturation liquid method and the NMR method under the water-saturated state. Weng Jianqiao et al. suggested that the micro-nano shale pores make it difficult for helium gas molecules to enter the micropores through gas expansion, leading to underestimated porosity measurements (Weng et al., 2022). The difference value between the NMR signals in the water-saturated and dry states reflected the amount of water charging in the core. The difference value (PORE_NMR) between the NMR porosity in the water-saturated and dry states was close to the porosity by saturation liquid method. Except for sample 10, the difference in obtained porosities between the two methods was within 1%, confirming the accuracy of the NMR measurements.
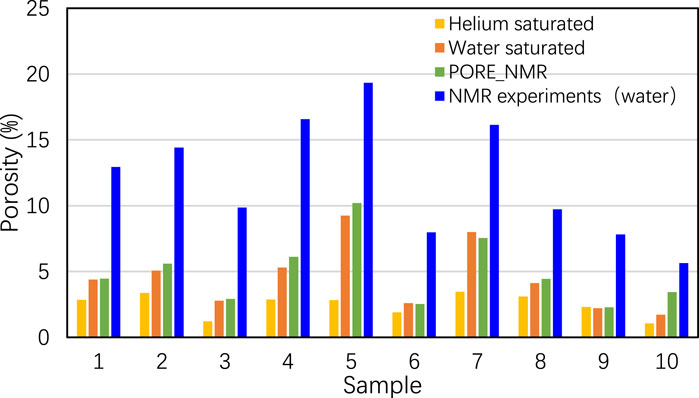
FIGURE 5. Comparison of sample porosity experimental measurements.
Figure 6 shows the comparison between the water-saturated core NMR T2 spectrum (NMR_Water) and the NMR logging T2 spectrum (CMR_NG) at the same depth. From the figure, the NMR logging T2 spectrum exhibits a doublet peaks characteristic. The spectrum peaks are distributed in the range of 0.3–10 ms and 10–100 ms, respectively. The amplitude of the peak corresponding to 0.3–10 ms is much larger than that corresponding to 10–100 ms. Compared with NMR loggings, water-saturated NMR experiments mainly showed the three-peaks or multi-peaks distribution characteristic, and the main spectrum peaks P1 and P2 were distributed in the range of 0.01–0.2 ms and 0.2–2 ms. Compared to the NMR logging, during NMR experiments we obtained the NMR spectrum at a T2 range of 0.01–0.3 ms, primarily due to the difference in the selected echo spacing. The NMR logging of CMR-NG had a minimum echo spacing (TE) of 0.2 ms, while the echo spacing in the core NMR instrument was as low as 0.06 ms. The distribution range of the spectrum peaks corresponding to 0.3–10 ms in NMR loggings overlapped with the range of spectrum peaks corresponding to 0.2–2 ms in NMR experiments, but there were differences in their amplitudes. This discrepancy might be attributed to the differences in the contained fluids. Unlike the fully water-saturated cores in NMR experiments, the pores detected in NMR loggings of the actual formation contained not only clay and capillary-bound water but also adsorbed oil and movable oil. Samples 1, 2, 4, 5, and 7, which appeared darker colors and have higher TOC contents, were presumed to have developed organic pores, with oil mainly exhibiting surface relaxation and no significant peaks in the 10–100 ms range. Samples 3, 6, 8, 9, and 10, which had a lighter color and a lower TOC content, were speculated to have developed inorganic pores, with oil in inorganic pores exhibiting volume relaxation and showing distinct peaks in the 10–100 ms range. The abnormally high peak amplitude of sample 7 was attributed to borehole expansion. Typically, when using a large NMR echo interval (TE), the signal from the short relaxation component tends to be attenuated before the acquisition of the first echo. As a result, these signals become unobservable (Fan et al., 2005; Zhang et al., 2023). In terms of sample 2, the NMR T2 spectra in the dry and water-saturated states at different echo spacings of 0.2 and 0.06 ms respectively indicated that as the echo spacing increased, the spectrum peaks in the 0.01–0.2 ms range disappeared. This demonstrates that the 0.2 ms echo spacing was unable to obtain the signals from organic matter and the crystal water in clay minerals at T2 < 0.3 ms, as shown in Figure 7.
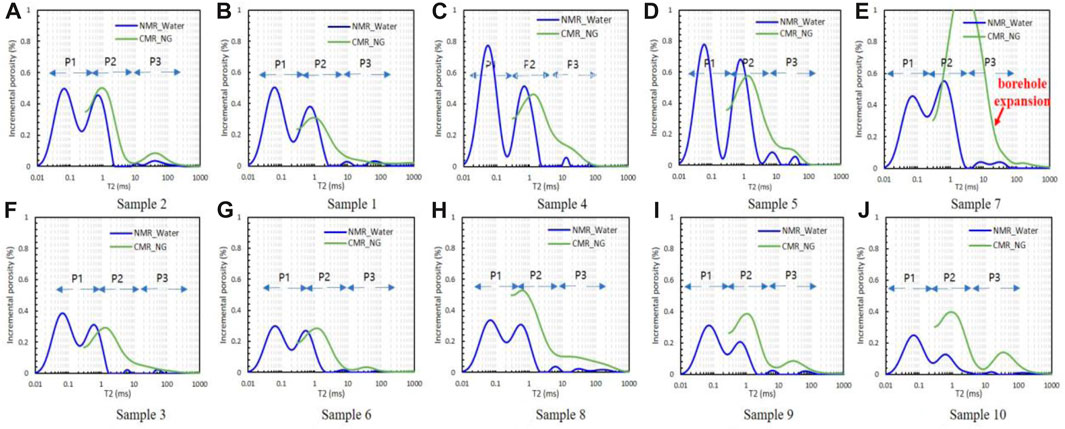
FIGURE 6. Comparison of POR_NMR (water) and POR_CMR.
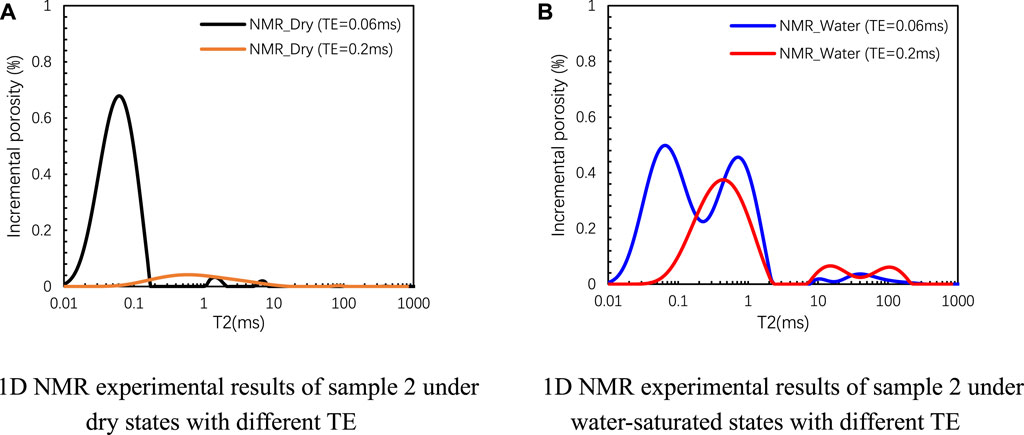
FIGURE 7. 1D NMR experimental results of sample 2 under dry and water-saturated states with different TE. (A) 1D NMR experimental results of sample 2 under dry states with different TE. (B) 1D NMR experimental results of sample 2 under water-saturated states with different TE.
The aforementioned analysis showed that the P1 peak in the water-saturated state was mainly caused by organic matter and the crystal water in clay minerals. Therefore, when determining the core porosity, it needs to be subtracted as a background signal to obtain the core NMR porosity (PORE_NMR). Intersecting the core NMR porosity (PORE-NMR) with NMR logging total porosity (PHIT) and NMR logging effective porosity (PHIE), the PORE_NMR was slightly smaller than PHIT. The reason is that PORE_NMR could not reflect the water in disconnected pores. There was an obvious positive correlation between the NMR experimental effective porosity PORE_NMR and NMR logging effective porosity PHIE, with a correlation of 0.84, as shown in Figure 8. Therefore, the NMR experimental effective porosity mainly reflects the effective pores of the core.
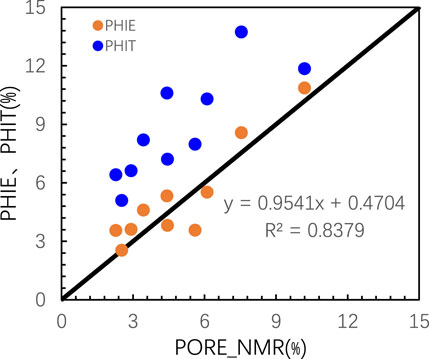
FIGURE 8. Comparison of PORE-NMR and POR_CMR.
Comparing the density porosity (PORD) and neutron porosity (PORN) by conventional loggings separately with the total porosity (PHIT) and effective porosity (PHIE) by NMR loggings, it is evident that the PORN is significantly higher than the PORD, PHIT, and PHIE. The higher neutron porosity is due to that in the neutron logging, the hydrogen atoms not only in the pore fluids but also in the rock matrix were measured. This led to an overestimation of porosity results due to the presence of organic matter and clay minerals in the shale oil reservoir. Both the PORD and PHIT represent the total porosity, and their values are quite close, both being higher than PHIE, as shown in Figure 9.
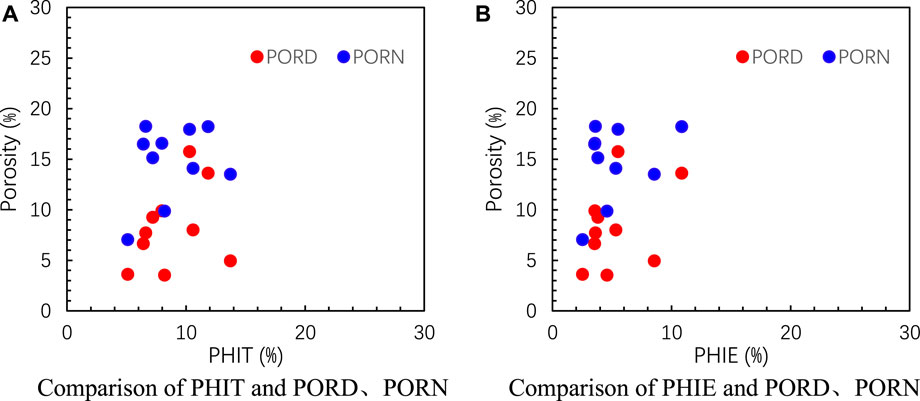
FIGURE 9. Comparison of POR_CMR and PORD, PORN. (A) Comparison of PHIT and PORD, PORN. (B) Comparison of PHIE and PORD, PORN.
The classical rock physics volume model indicates that rocks consist of three major components: mineral matrix particles, clay and organic matter, and pores. The neutron porosity by logging calculation is greater than that using other methods, which is due to the principle of neutron logging. From the perspective of logging principles, due to the influence of resolution and performance of the instruments, the density logging can only detect signals from the reservoir’s matrix pores and some clay mineral micropores. Whereas the neutron logging is based on the non-elastic and elastic scattering of high-energy neutrons emitted by the neutron source colliding with various elements in the formation. During this process, fast speed neutrons gradually lose energy and decrease in speed, and at this moment, the instrument can detect the intensity of the thermal and epithermal neutrons to calculate the formation porosity. Among various elements, hydrogen element has the strongest ability to slow down neutrons, making its impact significant in neutron logging. Neutron logging can detect signals not only from matrix pores and clay mineral micropores but also from some clay minerals and solid organic matter, leading to the neutron logging porosity calculation being greater than the actual formation porosity, as shown in Figure 10. The NMR measurement experiments (TE = 0.06 ms) were similar to the neutron logging as they directly detect the hydrogen atom signals in the formation, allowing for the measurement of matrix pores and clay mineral micropores. However, the NMR logging (TE = 0.2 ms) lost the signal from structural water, and the obtained NMR logging total porosity (PHIT) included the movable water porosity, clay-bound water porosity, and capillary-bound water porosity. The NMR logging effective porosity (PHIE) included the capillary-bound water porosity and the movable water porosity.
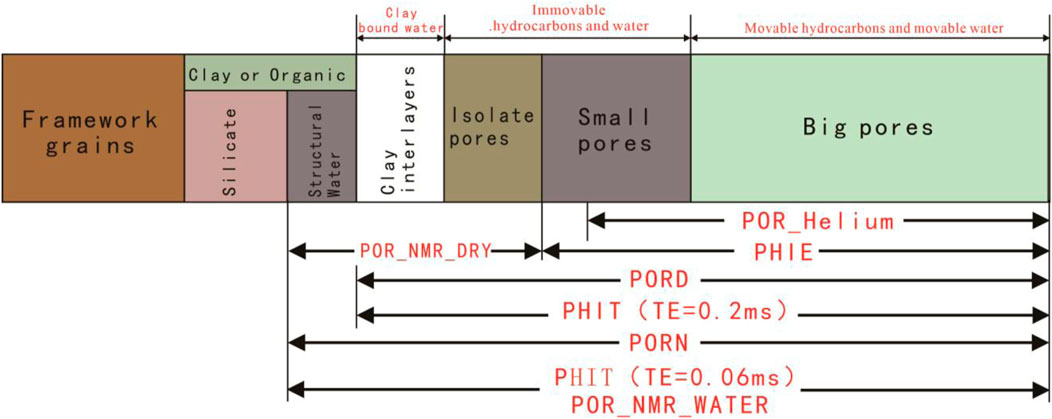
FIGURE 10. Schematic diagram of the porosity measurement range of various methods.
1) The measurement results by saturated liquid method were relatively consistent with that using the NMR experimental method, and it could also reflect the effective porosity of the formation. However, the helium gas charging method was affected by the complex pore structure of the shale, and it showed a significantly smaller measurement result than the saturated liquid method and the NMR experimental method.
2) In the shale oil reservoir of the Lianggaoshan Formation, Sichuan Basin, the signals from dry-state cores by the NMR experiment mainly came from clay mineral crystal water and organic matter in the formation. Under the water-saturated state, the short relaxation peaks in the core NMR experiment reflected the crystal water in clay minerals and organic matter, while the long relaxation peaks reflected the pore fluids in the formation. By subtracting the dry-state core NMR signal from the water-saturated core NMR signal, the effective porosity of the formation could be obtained.
3) Compared with NMR experiments (TE = 0.06 ms), the NMR logging (TE = 0.2 ms) was unable to reflect the signals from organic matter and the crystal water in clay minerals at T2 < 0.3 ms.
4) The combination of LS logging and neutron logging calculated a too high porosity, whereas the density porosity was close to the total porosity of the formation.
The raw data supporting the conclusion of this article will be made available by the authors, without undue reservation.
SS: Data curation, Formal Analysis, Investigation, Writing–original draft. LW: Conceptualization, Data curation, Funding acquisition, Project administration, Resources, Supervision, Writing–review and editing. JuL: Formal Analysis, Writing–review and editing. JiL: Formal Analysis, Writing–review and editing. YL: Formal Analysis, Writing–review and editing. JJ: Formal Analysis, Writing–review and editing.
The author(s) declare financial support was received for the research, authorship, and/or publication of this article. This study was supported by the Open foundation of the Sinnpec Key Laboratory of Shale Oil/Gas Exploration and Production Technology (No. 33550000-22-ZC0613-0209), the Natural Science Foundation of Sichuan Province (No. 2023NSFSC0260).
The authors declare that the research was conducted in the absence of any commercial or financial relationships that could be construed as a potential conflict of interest.
All claims expressed in this article are solely those of the authors and do not necessarily represent those of their affiliated organizations, or those of the publisher, the editors and the reviewers. Any product that may be evaluated in this article, or claim that may be made by its manufacturer, is not guaranteed or endorsed by the publisher.
Chalmers, G. R. L., and Bustin, R. M. (2012). Light volatile liquid and gas shale reservoir potential of the Cretaceous Shaftesbury Formation in northeastern British Columbia,Canada. AAPG 97 (7), 1333–1367. doi:10.1306/10041111041
Cui, J., Zhu, R., Zhiguo, M. A. O., and Shixiang, L. I. (2019). Accumulation of unconventional petroleum resources and their coexistence characteristics in Chang7 shale formations of Ordos Basin in central China. Front. Earth Sci. 13 (3), 575–587. doi:10.1007/s11707-019-0756-x
Domovan, A. D., Sterker, T. S., Gardner, R. M., et al. (2016). Find⁃ings from the Eagle Ford outcrops of west Texas&implication tothe subsurface of south Texas//BRYER J A.the Eagle FordShale-A renaissance in U. S. Oil production: AAPG Memoir110. Tulsa, Oklahoma: Tulsa:American Association of Petroleum Geologists, 301–336.
Fan, Y., Ni, Z., Deng, S., et al. (2005). Experimental study on NMR measurement parameers and reservoir properties. Petroleum Geol. Exp. 27 (6), 624–626. doi:10.11781/sysydz200506624
Fleuery, M., and Romero-Sarmiento, M. (2016). Characterization of shales using T1-T2 NMR maps. J. Petroleum Sci. Eng. 137, 55–62. doi:10.1016/j.petrol.2015.11.006
Fu, J., Li, S., Niu, X., Deng, X., and Zhou, X. (2020). Geological characteristics and exploration of shale oil in chang 7 member of triassic Yanchang formation, Ordos Basin, NW China. Petroleum Explor. Dev. 47 (5), 931–945. doi:10.1016/s1876-3804(20)60107-0
Fu, Y. (2018). Research on porosity measurement method of shale gas reservoir. Chengdu, China: SouthWest Petreleum University.
Fu, Y., Zeng, L., Ma, F., et al. (2012). An experimental analysis of expansibility and diffusion of shale rocks. Nat. Gas. Ind. 32 (09), 48–51. doi:10.3787/j.issn.1000-0976.2012.09.011
Ge, X., Fan, Y., Chen, H., Deng, S., Cao, Y., and Zahid, M. A. (2015). Probing the influential factors of NMR T1-T2 spectra in the characterization of the kerogen by numerical simulation. J. Magnetic Reson. 260, 54–66. doi:10.1016/j.jmr.2015.08.026
Han, Bo, Nan, Li, Xin, Li, et al. (2020). Study on shale porosity in different NMR measurement pattern. IFEDC 2020, 1805–1814. doi:10.26914/c.cnkihy.2020.042435
He, W., Bai, X., Meng, Q. 'an, et al. (2022a). Accumulation geological characteristics and major discoveries of lacustrine shale oil in Sichuan Basin. Acta Pet. Sin. 43 (7), 885–898. doi:10.7623/syxb202207001
He, W., He, H., Wang, Y., et al. (2022b). Major breakthrough and significance of shale oil of the jurassic Lianggaoshan Formation in well ping’an 1 in northeastern Sichuan Basin. China Pet. Explor. 27 (1), 40–49.
Hu, S., Zhao, W., Hou, L., Yang, Z., Zhu, R., Wu, S., et al. (2020). Development potential and technical strategy of continental shale oil in China. Petroleum Explor. Dev. 47 (4), 877–887. doi:10.3969/j.issn.1672-7703.2022.01.004
Jian-fei, H., Can-can, Z., Xia, Li, et al. (2012). Summary of shale gas evaluation applying geophysical logging. Prog. Geophys. (4), 1624–1632. doi:10.6038/j.issn.1004-2903.2012.04.040
Jiao, K., Yao, S., Wu, H., et al. (2014). Advances in characterization of pore system of gas shales. Geol. J. China Univ. 20 (1), 151–161.
Jin, Z., Bai, Z., Gao, Bo, et al. (2019). Has China ushered in the shale oil and gas revolution? Oil Gas Geol. 40 (3), 451–458. doi:10.3969/j.issn.1006-7493.2014.03.015
Kontorovich, A. E., Ponomareva, E. V., Burshtein, L. M., Glinskikh, V., Kim, N., Kostyreva, E., et al. (2018). Distribution of organic matter in rocks of the Bazhenov horizon (West Siberia). Russ. Geol. Geophys. 59, 285–298. doi:10.1016/j.rgg.2018.03.007
Li, J., Wu, Q., Lu, J., et al. (2017). Measurement and logging evaluation of total porosity and effective porosity of shale gas reservoirs:A case from the Silurian Longmaxi Formation shale in the Sichuan Basin. Oil Gas Geol. 38 (3), 602–609. doi:10.11743/ogg20170320
Li, M., Ma, X., Jiang, Q., et al. (2019). Enlightenment from formation conditions and enrichment characteristics of marine shale oil in North America. Petroleum Geol. Recovery Effic. 26 (1), 13–28. doi:10.13673/j.cnki.cn37-1359/te.2019.01.002
Liu, R., and Liu, Z.-jun (2006). Oil shale resource situation and multi purpose development potential in China and abroad. China’s shale gas shale oil Resour. 36 (6), 892–0898.
Liu, X., Sun, J., and Guo, Y. (2004). Application of elemental capture spectroscopy to reservoir evaluation. Well Logging Technol. 1, 26–30. doi:10.3969/j.issn.1671-5888.2006.06.005
Ma, Y., Li, M., Cai, X., et al. (2020). Mechanisms and exploitation of deep marine petroleum accumulations in China: advances, technological bottlenecks and basic scientific problems. Oil Gas Geol. 41 (4), 655–672. doi:10.3969/j.issn.1004-1338.2005.03.016
Modica, C. J., and Lapierre, S. G. (2012). Estimation of kerogen porosity in source rocks as a function of thermal transformation: example from the Mowry shale in the Powder River Basin of Wyoming. AAPG Bull. 96 (1), 87–108. doi:10.1306/04111110201
Ning, Li, Zhou, F., Wu, H., et al. (2023). New advances in methods and technologies for well logging evaluation of continental shale oil in China. Acta Pet. Sin. 44 (1), 28–44. doi:10.7623/syxb202301003
Pollastro, R. M., Roberts, L. N. R., and Cook, T. A. (2012). Geologic model for the assessment of technically recoverable oil in the DevonianMississippian bakken Formation,Williston basin//BREYER J A.shale reservoirs-giant resources for the 21st century: AAPG Memoir97. Tulsa, Oklahoma: Tulsa:American Association of Petroleum Geologists, 205–257. doi:10.1306/13321469M97948
Ramirez, T. R., Klein, J. D., Ron, J. M., et al. (2011). Comparative study of formation evaluation methods for unconventional shale gas reservoirs: application to the Haynesville shale (Texas). The Woodlands, Texas, USA: Society of Petroleum Engineers, 332–362. doi:10.5724/gcs.09.29.0150
Renyan, Z. (2016). Experimental study on physical parameters of shale gas reservoirs. Chengdu, China: SouthWest Petreleum University.
Rui, F., Jiang, Y., Yang, C., et al. (2023). Geological characteristics of shale oil in the jurassic Lianggaoshan Formation in Sichuan Basin. China Pet. Explor. 28 (4), 66–78. doi:10.3969/j.issn.1672-7703.2023.04.007
Schmoker, J. W. (2002). Resource-assessing perspectives for unconventional gas systems. AAPG Bull. 86 (11), 1993–2000. doi:10.3969/j.issn.1672-7703.2023.04.007
Shihe, Y., and Zhang, C. (1996). Logging data processing and comprehensive interpretation. Dong Ying, China: China University of Petroleum Press.
Sun, L., Liu, He, He, W., Zhang, S., Zhu, R., et al. (2021). An analysis of major scientific problems and research paths of Gulong shale oil in Daqing Oilfield, NE China. Petroleum Explor. Dev. 48 (3), 527–540. doi:10.1016/s1876-3804(21)60043-5
Tian, C., Yi, Li, Li, D., et al. (2023). Selection and recommendation of shale reservoir porosity measurement methods. Nat. Gas. Ind. 43 (06), 57–65. doi:10.3787/j.issn.1000-0976.2023.06.005
Tian, H., Zhang, S., Liu, S., et al. (2012). Determination of organic-rich shale pore features by mercury injection and gas adsorption methods. Editor. office Acta Petrolei Sinica 33 (3), 419–427. doi:10.7623/syxb201203011
Wang, L., Yin, R., Liqiang, S., Fan, L., Wang, H., Yang, Q., et al. (2018). Insights into pore types and wettability of a shale gas reservoir by nuclear magnetic resonance: Longmaxi Formation, Sichuan Basin, China. Energy Fuel 32, 9289–9303. doi:10.1021/acs.energyfuels.8b02107
Wang, Y. M., Dong, D. Z., Yang, H., Wang, S., Huang, J., et al. (2014). Quantitative characterization of reservoir space in the lower silurian Longmaxi shale, southern sichuan, China. Sci. China Earth Sci. 57, 313–322. doi:10.1007/s11430-013-4645-y
Weng, J., Li, X., Qi, M., et al. (2022). Study on porosity measurement determination methods of a shale reservoir in the Longmaxi Formation, Sichuan Basin. Rock Mineral Analysis 41 (4), 598–605. doi:10.15898/j.cnki.11-2131/td.202012270173
Wu-yang, Y., and Wang, C.-bin (2010). Utilizing pre-stack simultaneous inversion to predict reservoir physical properties. OGP 45 (3), 414–417. doi:10.1306/07021413140
Xiao, lizhi, et al. (2001). NMR logging interpretation and China case studies. Beijing, China: Petroleum Industry Press. doi:10.1306/02221615104
Xiu-wen, Mo, Zhou-bo, Li, and Bao-zhi, P. (2011). Method and advance of shale gas formation evaluation by means of well logging. Geol. Bull. China 30 (0203), 400–405. doi:10.3969/j.issn.1671-2552.2011.02.027
Yan, X., Cao, C., and Wang, H. (2018). Research and application on processing and interpretation of litho scanner logging data. Well Logging Technol. 42 (05), 503–508. doi:10.16489/j.issn.1004-1338.2018.05.003
Yang, W., Xue, L. H., Tang, J., et al. (2015). Analysis and evaluation of different measuring methods for shale porosity. Acta Sedimentol. Sin. 33 (6), 1258–1264. doi:10.14027/j.cnki.cjxb.2015.06.018
Yang, Z., Hou, L., Lin, S., et al. (2018). Geologic characteristics and exploration potential of tight oil and shale oil in Lucaogou Formation in Jimsar sag. China Pet. Explor. 23 (4), 76–85. doi:10.3969/j.issn.1672-7703.2018.04.009
Zeng, X.-liang, Shu-gen, L., Huang, W.-ming, et al. (2011). Comparison of silurian Longmaxi Formation shale of Sichuan Basin in China and carboniferous Barnett Formation shale of fort worth basin in United States. Geol. Bull. China 30 (0203), 372–384. doi:10.3969/j.issn.1671-2552.2011.02.024
Zhang, J.-yan (2012). Well logging evaluation method of shale oil reservoirs and its applications. Prog. Geophys. 27 (3), 1154–1162. doi:10.6038/j.issn.1004-2903.2012.03.040
Zhang, L., Li, J., Zheng, Li, et al. (2014). Advancements in shale oil/gas research in north American and considerations on exploration for lacustrine shale oil/gas in China. Adv. Earth Sci. 29 (06), 700–711. doi:10.11867/j.issn.1001-8166.2014.06.0700
Zhang, R., Wang, W., Gao, Yi, et al. (2023). Sensitivity analysis of T2-T1 2D NMR measurement parameters in shale oil reservoirs[J]. Chin. J. Magnetic Reson., 40(2): 122–135. doi:10.11938/cjmr20223025
Zhang, T., Peng, Z., Yang, W., et al. (2015). Enlightenments of American shale oil research towards China. Lithol. Reserv. 27 (3), 1–10. doi:10.3969/j.issn.1673-8926.2015.03.001
Zhi, D., Tang, Y., Yang, Z., et al. (2019). Geological characteristics and accumulation mechanism of continental shale oil in Jimusaer sag,Junggar Basin. Oil Gas Geol. 40 (3), 524–534. doi:10.11743/ogg20190308
Zhi-qiang, M., Zhang, C., and liang, X. (2010). A NMR-based porosity calculation method for low porosity and low permeability gas reservoir. OGP 45 (1), 105–109. doi:10.13810/j.cnki.issn.1000-7210.2010.01.026
Zhou, S., Dong, D., Zhang, J., et al. (2021). Optimization of key parameters for porosity measurement of shale gas reservoirs. Nat. Gas. Ind. 41 (05), 20–29. doi:10.3787/j.issn.1000-0976.2021.05.003
Zou, C., Dong, D., Wang, S., et al. (2010). Geological characteristics, formation mechanism and resource potential of shale gas in China. Petroleum Explor. Dev. 37 (6), 1875.
Zou, C., Pan, S., Jing, Z., et al. (2020). Shale oil and gas revolution and its impact. Acta Pet. Sin. 41 (1), 1–12. doi:10.7623/syxb202001001
Keywords: Sichuan Basin, Lianggaoshan Formation, shale oil, porosity, NMR experiment, logging
Citation: Su S, Wang L, Li J, Lu J, Luo Y and Jia J (2024) Research on porosity characterization methods of shale oil reservoirs in Lianggaoshan Formation, Sichuan Basin. Front. Earth Sci. 11:1325094. doi: 10.3389/feart.2023.1325094
Received: 20 October 2023; Accepted: 23 November 2023;
Published: 16 January 2024.
Edited by:
Lidong Dai, Chinese Academy of Sciences, ChinaReviewed by:
Zhihao Jiang, Xi’an Shiyou University, ChinaCopyright © 2024 Su, Wang, Li, Lu, Luo and Jia. This is an open-access article distributed under the terms of the Creative Commons Attribution License (CC BY). The use, distribution or reproduction in other forums is permitted, provided the original author(s) and the copyright owner(s) are credited and that the original publication in this journal is cited, in accordance with accepted academic practice. No use, distribution or reproduction is permitted which does not comply with these terms.
*Correspondence: Liang Wang, d2FuZ2xpYW5nX3N3cHVAMTYzLmNvbQ==
Disclaimer: All claims expressed in this article are solely those of the authors and do not necessarily represent those of their affiliated organizations, or those of the publisher, the editors and the reviewers. Any product that may be evaluated in this article or claim that may be made by its manufacturer is not guaranteed or endorsed by the publisher.
Research integrity at Frontiers
Learn more about the work of our research integrity team to safeguard the quality of each article we publish.