 Xin Li1
 Zhaoxia Pu
 Zhan Zhang
- 1Department of Atmospheric Sciences, University of Utah, Salt Lake City, UT, United States
- 2Cooperative Institute for Marine and Atmospheric Studies, University of Miami, Miami, FL, United States
- 3Hurricane Research Division, NOAA/AOML, Miami, FL, United States
- 4Environmental Modeling Center, NCEP/NOAA, College Park, MD, United States
Vertical eddy diffusivity (VED) in the planetary boundary layer (PBL) has a significant impact on forecasts of tropical cyclone (TC) structure and intensity. VED uncertainties in PBL parameterizations can be partly attributed to the model’s inability to represent roll vortices (RV). In this study, RV effects on turbulent fluxes derived from a large eddy simulation (LES) by Li et al. (Geophys. Res. Lett., 2021, 48, e2020GL090703) are added to the VED parameterization of the PBL scheme within the operational Hurricane Weather Research and Forecasting (HWRF) model. RV contribution to VED is parameterized through a coefficient and varies with the RV intensity and velocity scale. A modification over land has also been implemented. This modified VED parameterization is compared with the original wind-speed-dependent VED scheme in HWRF. Retrospective HWRF forecasts of Hurricanes Florence (2018) and Laura (2020) are analyzed to evaluate the impacts of the modified VED scheme on landfalling hurricane forecasts. Results show that the modified PBL scheme with the RV effect leads to an improvement in 10-m maximum wind speed forecasts of 14%–31%, with a neutral to positive improvement for track forecasts. Improved wind structure and precipitation forecasts against observations are also noted with the modified PBL scheme. Further diagnoses indicate that the revised PBL scheme enhances moist entropy in the boundary layer over land, leading to improved TC intensity prediction compared to the original scheme.
1 Introduction
Accurate prediction of the track and intensity of tropical cyclones (TCs), especially landfalling TCs, can significantly reduce the casualties and economic loss induced by these severe meteorological disasters. Vertical eddy diffusivity (VED) in the planetary boundary layer (PBL) scheme is a key parameter for simulating and forecasting TC intensity (e.g., Smith, 1968; Ooyama, 1969; Emanuel, 1986, 1995; Braun and Tao, 2000; Chen et al., 2007; Van Sang et al., 2008; Smith and Thomsen, 2010; Zhang et al., 2011; Zhang and Pu, 2017). Modification of VED based on aircraft observations over the ocean significantly improved hurricane track and intensity forecasts (Zhang et al., 2011; Zhang and Drennan, 2012; Tallapragada et al., 2014; Zhang et al., 2015, 2017). Improved VED parameterization can also potentially lead to improved TC track, intensity, and structure forecasts during landfalls (Zhang and Pu, 2017).
Near-surface vertical mixing impacts flux and entropy distributions that affect TC intensity through the energy balance argument (e.g., Zhu and Furst, 2013; Doyle et al., 2014; Wing et al., 2019). Above the surface layer, both the maximum value and vertical distribution of VED could affect the simulated track, intensity, and structure of TCs (Gopalakrishnan et al., 2013; Zhu et al., 2014; Bu et al., 2017; Gopalakrishnan et al., 2021; Kalina et al., 2021). Zhang and Rogers (2019) found that relatively low but realistic values of VED in the Hurricane Weather Research and Forecasting (HWRF) model led to a strong and deep forecasted hurricane vortex, which are more resilient to shear before and during rapid intensification than large VED. Small VED also led to a more symmetric distribution of deep convection and enhanced PBL inflow over the ocean before TC intensification. On the other hand, in landfalling TCs, the underlying surface roughness increases from ocean to land, which affects the VED in the PBL (Yu et al., 2008; Zhang et al., 2011; Zhang et al., 2017; Zhang and Pu, 2017). Based on fast-response wind data collected during typhoons in 2010, Tang et al. (2018) found that VED is larger near the coast when winds blow from land than from the ocean. Zhang and Pu (2017) and Zhang et al. (2017) found that using different VED parameterizations over land and ocean in the PBL scheme resulted in more realistic intensity forecasts of landfalling hurricanes by HWRF, especially during the wind decay stage over land.
Furthermore, previous studies have found that roll vortices (RVs), a type of large turbulence eddy, exist in the TC PBL (Wurman and Winslow, 1998; Katsaros et al., 2000; Morrison et al., 2005; Huang et al., 2018). Numerical simulations by Foster (2005), Gao and Ginis (2016), and Gao et al. (2017) showed that these large-scale eddies could generate strong and counter-gradient flux, in contrast to that predicted by the traditional down-gradient turbulence parameterizations in mesoscale numerical models. Aircraft observations in TCs confirmed that counter-gradient turbulent transfer exists, leading to large VEDs near the top of the boundary layer in the eyewall and outer-core regions (Zhang and Drennan, 2012; Zhao et al., 2020). Results from large eddy simulation (LES) are consistent with these observations (Zhu, 2008; Li et al., 2021). A laboratory study found that horizontal rolls could even impact the intensification rate of TCs (Sukhanovskii and Popova, 2020). Therefore, the omission of RVs in the PBL scheme could potentially lead to relatively poor TC intensity forecasts (Ernst et al., 2019).
In light of the linkage between VED and RV in the PBL scheme within the Weather Research and Forecasting (WRF) model, Li and Pu (2021) improved the Yonsei University (YSU) PBL scheme (Hong et al., 2006; Hong, 2010) by adding RV effects based on the LES of landfalling Hurricane Harvey (2017). Numerical experiments indicated that the revised YSU scheme produced better hurricane track, intensity, and quantitative precipitation forecasting (QPF). The positive impacts of including RV effects in the WRF model motivate us to further evaluate these effects and implement the findings in other models. Specifically, RV effects have not yet been included in the NCEP operational Hurricane WRF (HWRF) regional model. The hybrid Global Forecast System (GFS) PBL scheme in the current version of the HWRF model was previously modified based on observations (Bu et al., 2017; Wang et al., 2018; Zhang et al., 2020) with a wind-speed-dependent VED parameterization, but no RV effect was considered. Therefore, the purpose of this study is to improve the previous RV parameterization and implement it into the PBL scheme of the HWRF model. We also aim to evaluate the effects of the RV parameterization on hurricane prediction. We use the operational version of the HWRF model (version 2020, referred to as H220 hereafter). Specifically, considering the high impact of landfalling hurricanes on our society, our focus is on improving forecasts of landfalling storms.
The development of the RV parameterization in the HWRF model is described in Section 2. The forecast results and evaluations are discussed in Section 3. The influence of the modified PBL scheme with RV effect on the hurricane intensity and structure is examined in Section 4. A summary and concluding remarks are provided in Section 5.
2 Modifying the RV parameterization in the HWRF model
2.1 A brief description of the HWRF model and GFS PBL scheme
HWRF (Version 4) is a NOAA/NCEP regional operational hurricane model. It is composed of the WRF (Weather Research and Forecasting) non-hydrostatic mesoscale model (NMM) on an E-grid dynamic core (Janjic et al., 2010), the Message Passing Interface Princeton Ocean Model for Tropical Cyclones (MPIPOM-TC) (Yablonsky et al., 2015), the NCEP coupler, and the GSI data assimilation platform (Kleist, et al., 2009; Wang, 2010). The HWRF model domains are configured to have a parent domain and two storm-following moving nested domains, with resolutions of ∼13.5 km, ∼4.5 km, and ∼1.5 km, respectively. The atmospheric model in the HWRF system employs a suite of advanced physics developed for TC applications, such as the Ferrier-Aligo microphysics scheme (Ferrier et al., 2002; Aligo et al., 2018), the simplified Arakawa-Schubert (SAS) deep convection scheme (Pan and Wu, 1995; Hong and Pan, 1998), the Geophysical Fluid Dynamics Laboratory (GFDL) longwave and shortwave radiation schemes (Lacis and Hansen, 1974; Schwarzkopf and Fels, 1991), the GFDL surface layer scheme (Kurihara and Tuleya, 1974; Sirutis and Miyakoda, 1990), the Noah land surface model (Ek et al., 2003), and the hybrid NCEP GFS or “GFS EDMF” PBL parameterization scheme (Gopalakrishnan et al., 2013; Wang et al., 2018; Zhang et al., 2020; Kalina et al., 2021).
The “GFS” or “GFS EDMF” PBL scheme is essentially a first-order nonlocal scheme that originated from the traditional NCEP Medium-Range Forecast (MRF) scheme (Troen and Mahrt, 1986; Hong and Pan, 1996; Han and Bretherton, 2019). In the latest operational version of the HWRF model (as of the end of 2020), a wind-speed-dependent VED of momentum (Km) modification has been applied in the GFS EDMF PBL scheme since 2015 (Bu et al., 2017; Wang et al., 2018):
where k=0.4 is the Von Kármán constant;
where WS denotes the wind speed and the subscript 500 stands for the variable collection height of 500 m.
2.2 RV parameterization
In Li and Pu (2021), the large eddy simulation (LES) of landfalling Hurricane Harvey (2017), was used to parameterize RV and its effect was added to the YSU PBL scheme in the WRF model. Figure 1 shows the azimuthally averaged Km (shading) from the simulations with the WRF YSU PBL scheme (Figure 1A) and LES (Figure 1B), and their difference (Figure 1C) at 17 UTC 25 August 2017 for Hurricane Harvey. The simulations indicated that RV always contributed to VED at distances less than 100 km from the hurricane center. The RV intensity, Iw =
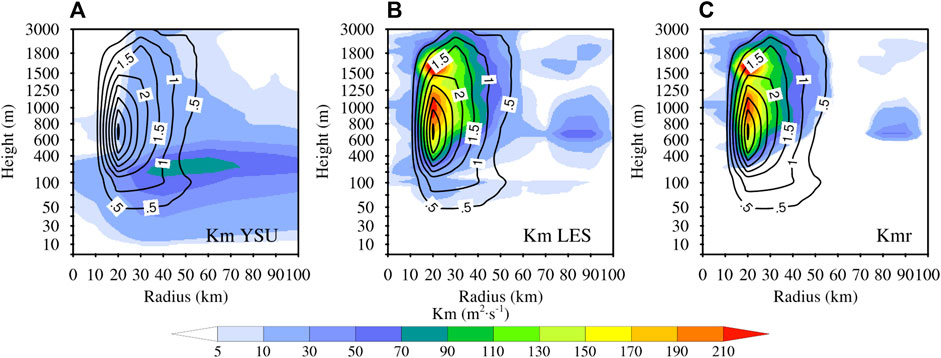
FIGURE 1. Azimuthally averaged vertical eddy diffusivity of momentum (shading) from the WRF simulations with (A) YSU PBL scheme, (B) LES, and (C) their difference (Kmr) at 17 UTC 25 August 2017 for Hurricane Harvey. The black contour line stands for the RV’s intensity at the same time.
Li and Pu (2023) found that the inflow transports the rolls in the entire storm boundary layer and accumulates near the eyewall to support the intense rolls there. Specifically, in Li and Pu (2021), RV intensity, Iw =
The coefficient a is 1.97 based on LES data following Li and Pu (2021). Note that below 400 m altitude, divergence is mostly negative, indicating convergence in the PBL.
To generate the vertical profile of Iw, the height of Iwm (Hm) is represented by the height of the minimum wind shear (du/dz). Then, with Hm and Iwm, Iw normalized by Iwm (g) in each vertical column is described by an adjusted gamma distribution function f as follows:
where h is the height above the ground and g(h) is the normalized Iw profile distribution function. Finally, the Iw profile in a single column is derived:
As in the setup of the YSU PBL scheme, Li and Pu (2021) used a velocity scale,
where Ht is the height of the top of RV, which is assumed to be above Hm, and Iw = 0.05 Iwm. A height of 3,000 m is used as the Ht maximum. According to the dimensional analysis,
where b, the linear coefficient, is equal to 0.08 in the PBL and 0.20 in the free atmosphere from Li and Pu (2021). Then, Kmr is determined through Eq. 7 in the modified PBL scheme.
Since the vertical eddy diffusivity of heat (Khr) and moisture (Kqr) produced by RV is weak, a fixed ratio for Khr/Kmr and Kqr/Kmr is set to the mean value of 4.79×10⁻² in LES for the RV parameterization in Li and Pu (2021). Finally, RV-induced Kmr, Khr, and Kqr are added to the original Km, Kh, and Kq of the PBL scheme. Further details can be found in Li and Pu (2021).
In the present study, we modify the RV parameterization of Li and Pu (2021) and apply it to the HWRF PBL scheme. The different horizontal grid spacings of WRF (coarse grid) and HWRF (fine grid) could lead to different values of coefficient b in Eq. 8, so a sensitivity test based on the WRF-LES simulation results was conducted with different horizontal grid spacings. Figure 2 shows the variation of b with the horizontal grid spacing, suggesting that b is not sensitive to the horizontal grid resolution, with a variance of less than 10%. This result also confirms that b = 0.20 for the free atmosphere and b = 0.08 for the PBL in Equation 8 work best for the HWRF model with the horizontal grid spacing of ∼0.033° for domain 2° and 0.011° for domain 3.
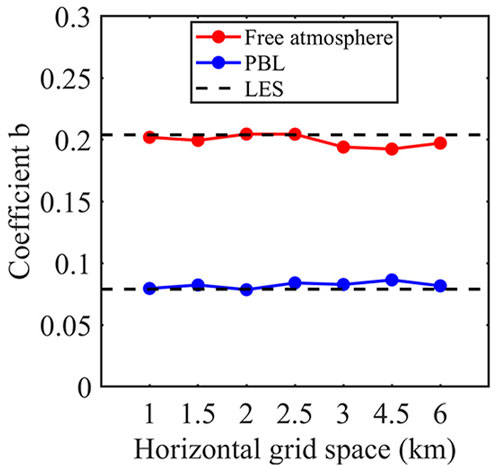
FIGURE 2. Coefficient b in Eq. 8 as a function of horizontal grid spacing. The dashed line represents coefficient b from LES in Li and Pu (2021).
In the LES simulation of Hurricane Harvey (2017) by Li et al. (2021) and Li and Pu (2021), the LES domain covers only the hurricane inner-core region (within a radius of less than 150 km from the hurricane center). Figure 1 shows that RV always contributes to VED at distances less than 100 km from the hurricane center. Therefore, an inner-core distance limitation, namely, 100 km, should be added to the HWRF system to avoid the RV contribution through the RV parameterization outside the inner core. To ensure that this hurricane’s inner-core region is covered by all three domains with their own grid spacings, distance limitations of 150 km for domain 1, 115 km for domain 2, and 101 km for domain 3 are used when modifying the HWRF PBL scheme to include the RV effect.
2.3 Improvement of RV parameterization over land
From Eq. 8, the relation of
FIGURE 3. Plot of
3 HWRF experiments and forecast impacts
3.1 Experiment configurations
Following the modification of the PBL scheme with the RV parameterization in the HWRF model as described in the previous section, the impacts of the modified PBL scheme on TC forecasts are examined with the operational HWRF model (version H220). Considering the tuning coefficient α in the PBL scheme, as mentioned above, the following three experiments are configured. Note that two of the experiments combine the α effect with RV parameterization in the PBL scheme.
1) Control: no change in the HWRF model, where Km is parameterized using Eqs. 1, 2.
2) RV-A-α: in the hurricane inner-core region, the first guess of Km is modified by including the RV parameterizations (Kmr) first, and then it is adjusted by α to generate the final Km as follows:
Outside the inner-core region, there is no change from Control.
3) RV-C-α: in the hurricane inner-core region, when Kmr is not equal to zero, the first-guess Km is modified only by adding the above RV parameterizations without α adjustment, namely
Otherwise, when Kmr is equal to zero, the first-guess Km is adjusted only by α as defined in the current HWRF to generate the final Km, as described in Eqs 1, 2. Outside the inner-core region, there is no change from Control.
In the modified PBL scheme, α interacts with the added RV parameterization. In RV-A-α, the RV parameterization is added to the HWRF PBL while retaining the effect of coefficient α. In RV-C-α, adding the RV parameterization is an option to replace coefficient α conditionally.
With the above configurations, HWRF forecasts are conducted for Hurricane Florence (2018), with cycled forecasts (equivalent to the procedure of operational runs in 6 hourly analysis and forecast cycles) from 18 UTC 13 to 18 UTC 14 September 2018, and for Hurricane Laura (2020), with cycled forecasts from 00 UTC 25 to 00 UTC 27 August 2020. The forecast case is spun up at 00 UTC 13 September 2018 for Hurricane Florence, and at 06 UTC 24 August 2020 for Hurricane Laura with the cycled run. A total of 14 cases, 5 for Florence and 9 for Laura, are analyzed to evaluate the impacts of the revised PBL scheme on track, intensity, and structure forecasts compared to the original scheme.
To assess the quantitative precipitation forecasting (QPF), observations from NCEP stage IV precipitation data (Lin and Mitchell, 2005) are used to compute the threat score:
where forecast is the point number of the simulated QPF with special threshold precipitation, and observation is the point number of the QPF from the stage IV data. Correct is the point number of the correct forecast that agrees with the observation.
3.2 Track, intensity, and precipitation forecasts
3.2.1 Hurricane Florence
Figure 4 shows the forecast tracks of Hurricane Florence from the three experiments at different forecast times. The hurricane tracks of RV-A-α and RV-C-α are different from that of Control, with a slower-moving TC through the revised PBL scheme. Compared to the NHC best-track data, the simulated storms in these three experiments move slightly faster after landfall. The storm in RV-C-α is the slowest and is closest to the best track. Then, to quantify the forecast skill, the track and intensity errors are computed as shown in Figure 5. The track error of RV-C-α is smaller than that of Control, with a mean error reduction of 6.02 km. The mean track error of RV-A-α is 65.13 km, which is slightly larger than that of Control. For the maximum surface wind (MSW) error, RV-C-α also produces a mean error of −4.42 kt, which is smaller than that of Control (−6.44 kt). RV-A-α produces an MSW error similar to that of Control, with a mean error of −6.21 kt. When the hurricane decays over land, the MSW error of RV-C-α decreases with time and is smaller than those of the other two experiments. The most significant intensity forecast improvement is at 12 UTC 14 September 2018, at hurricane landfall. For the minimum sea level pressure (MSLP) forecast, the improvement in RV-C-α is not consistent, in that the MSLP error is smaller than that in Control in the first 24 h but larger at 30–66 h. Finally, the mean MSLP error is −4.62 hPa for RV-C-α, close to the mean error of −4.02 hPa for Control. RV-A-α has an MSLP error similar to that of Control, with a mean error of −4.03 hPa. Overall, RV-C-α produces the best hurricane track and MSW forecasts against the best track from the NHC report. Note that the MSLP forecast reduction by RV-C-α compared to Control is smaller (15%) than the MSW forecast improvement (>31%).
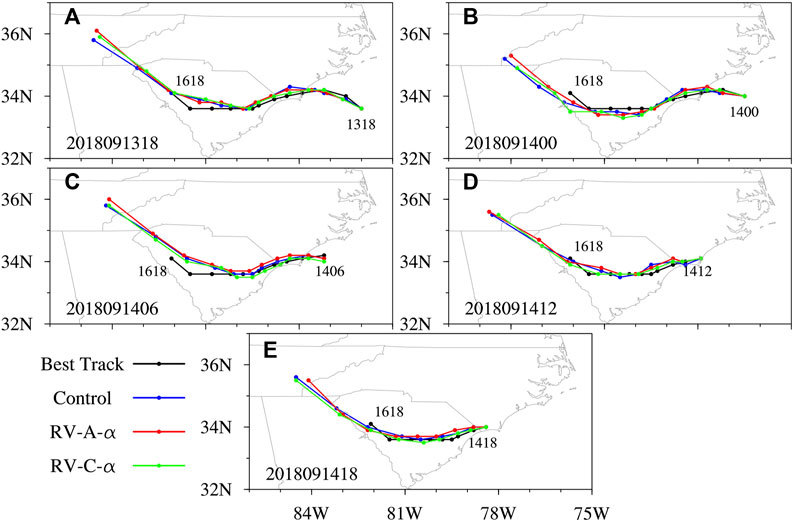
FIGURE 4. Comparison of forecast track with the best-track data for Hurricane Florence at (A) 18 UTC 13, (B) 00 UTC 14, (C) 06 UTC 14, (D) 12 UTC 14, and (E) 18 UTC 14 September 2018. Control, RV-A-α, RV-C-α, and best track are represented by the blue, red, green, and black lines, respectively.
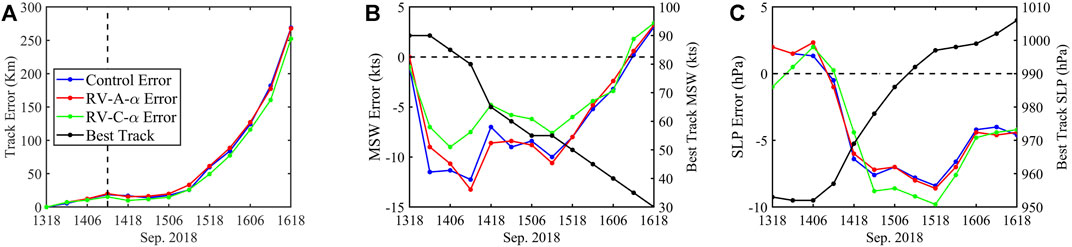
FIGURE 5. Mean forecast errors against the best-track data for Hurricane Florence (A) track, (B) maximum surface wind (MSW), and (C) minimum sea level pressure (SLP). The black lines in (A,C) denote the best-track MSW and minimum SLP, respectively. The dashed line in (A) denotes the landfall time.
Accurate precipitation forecasts near hurricane landfall time are essential for public warnings. The 12 h accumulated precipitation forecast, initialized at 06 UTC 14 September 2018, is compared with the NOAA Stage IV precipitation analysis (Lin and Mitchell, 2005) during Hurricane Florence’s landfall between 06 and 18 UTC 14 September 2018 (Figure 6). RV-C-α performs better than Control, which underestimates the rainfall over the ocean. RV-C-α has an even larger precipitation maximum (160 mm) than RV-A-α (120 mm) close to the hurricane eye and eyewall regions over the ocean. Overall, RV-C-α provides the best rainfall forecast for Florence, consistent with the result of Li and Pu (2021). To further examine the improvement in the precipitation of Florence, the mean threat score (TS) of the QPF based on the NOAA Stage IV data for 12 h, 24 h, 36 h, and 48 h accumulated precipitation is analyzed (figures not shown). The results show a strong increase in the mean TS for heavy rainfall (over 160 mm) in RV-C-α, with a TS increase of over 0.1 from Control. The increased mean TS indicates that RV-C-α significantly improves the rainstorm forecast, which is important for public warnings. The slightly reduced (less than 0.04) or similar mean TS for the smaller rainfall (<160 mm) reflects a similar QPF ability for RV-C-α and Control at these precipitation thresholds. RV-A-α shows poor QPF with a gradually smaller mean TS than Control and RV-C-α.
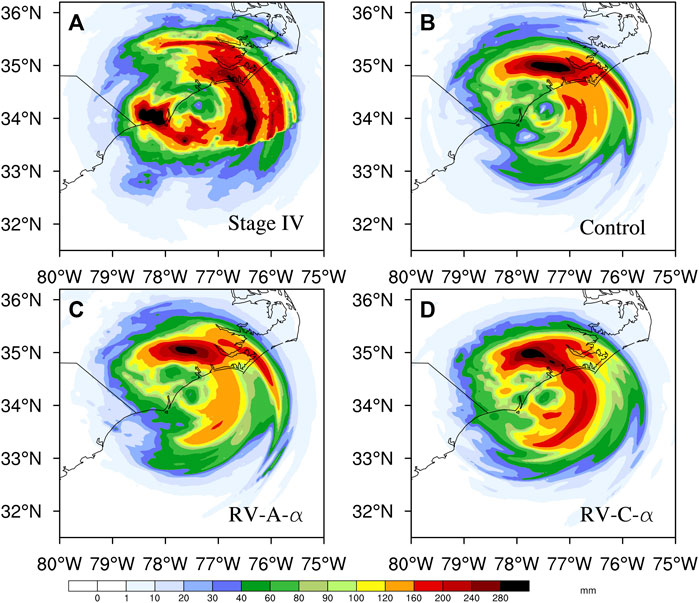
FIGURE 6. The 12 h accumulated precipitation from (A) Stage IV, (B) Control, (C) RV-A-α, and (D) RV-C-α during Hurricane Florence’s landfall at 06-18 UTC 14 September 2018.
3.2.2 Hurricane Laura
Figure 7 shows the forecast storm tracks from the three experiments at different forecast times for Hurricane Laura. The storm tracks in these forecasts are all close to the NHC best track, with a maximum error of less than 100 km. Figure 8 shows the forecast track and intensity errors from these experiments. Compared to Control, RV-C-α provides a comparable track forecast. The absolute track error is 36.29 km for Control, 40.48 km for RV-A-α, and 37.04 km for RV-C-α. For the MSW error, RV-C-α again provides a smaller error, −10.51 knot, compared to the −12.16 knot from Control. The MSW error reduction by RV-C-α, compared to Control, increases and then decreases with time. RV-A-α provides a slightly worse MSW forecast than the other two experiments, with a mean error of −13.34 knot. RV-C-α also provides a better MSLP forecast in the first 42 h than Control, with the mean error reducing in magnitude from −1.29 hPa (Control) to −0.83 hPa. Overall, RV-C-α performs the best, with a 14% reduction in the MSW forecast error and a 36% reduction in the MSLP forecast error compared to Control and best track. Furthermore, the track error increment is less than 2% for RV-C-α.
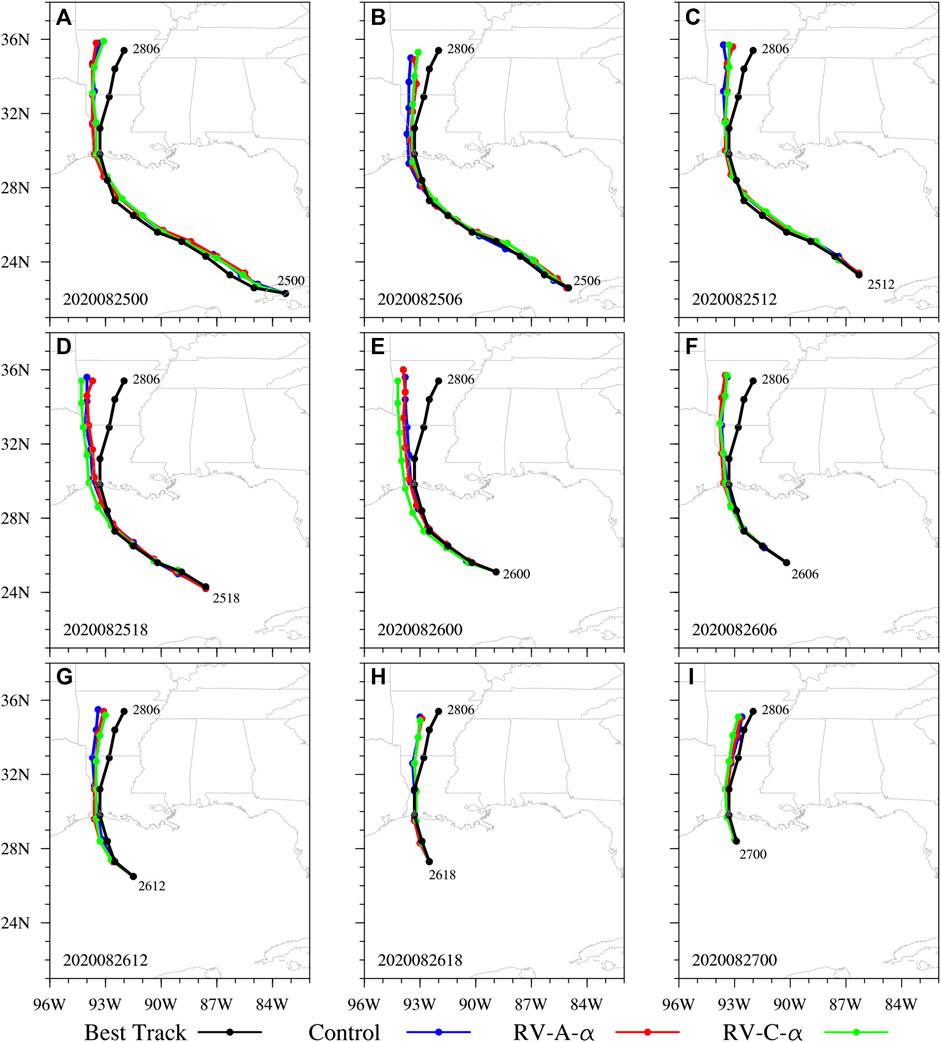
FIGURE 7. Comparison of forecast track with the best-track data for Hurricane Laura at (A) 00 UTC 25, (B) 06 UTC 25, (C) 12 UTC 25, (D) 18 UTC 25, (E) 00 UTC 26, (F) 06 UTC 26, (G) 12 UTC 26, (H) 18 UTC 26, and (I) 00 UTC 27 August 2020.
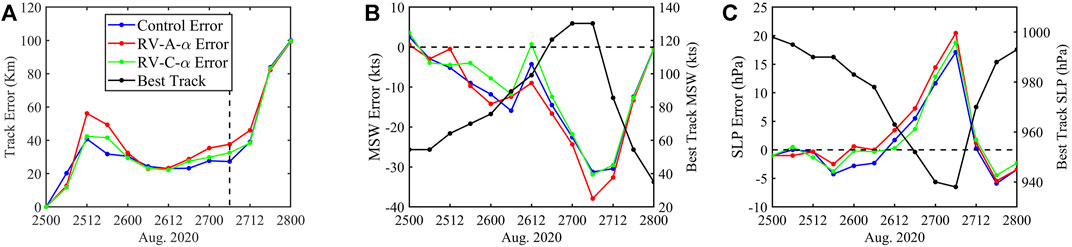
FIGURE 8. Mean forecast errors against the best-track data for Hurricane Laura (A) track, (B) maximum surface wind (MSW), and (C) minimum sea level pressure (SLP). The dashed line in (A) denotes the landfall time.
The 12 h accumulated precipitation forecasts, initialized at 18 UTC 25 August 2020, for Hurricane Laura from 00 to 12 UTC 27 August 2020 are compared with the NCEP Stage IV precipitation analysis (Figure 9). RV-C-α reduces the overestimated rainfall over the ocean in Control and RV-A-α. Control strongly overestimates the rainfall, especially near the coastline, with a maximum of ∼280 mm compared to observations, while RV-A-α reduces this overestimation to some degree and RV-C-α significantly reduces the precipitation forecast error with a precipitation maximum of ∼160 mm.
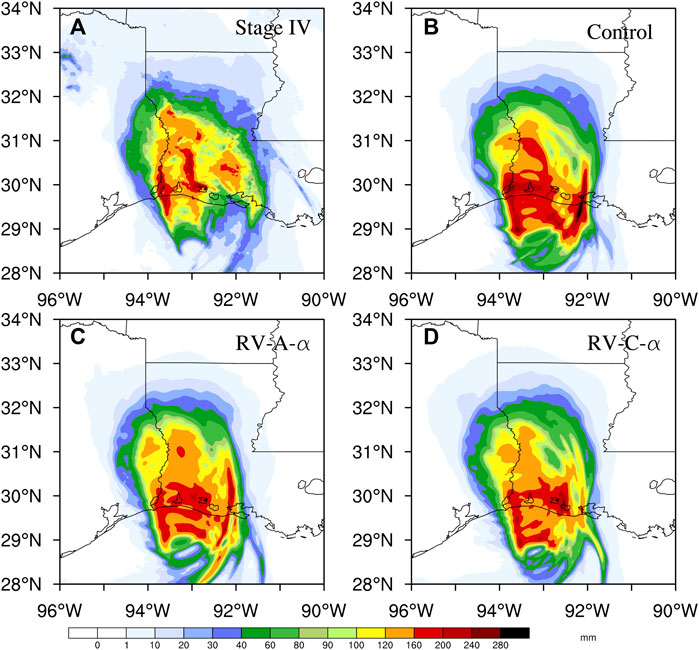
FIGURE 9. The 12 h accumulated precipitation from (A) Stage IV, (B) Control, (C) RV-A-α, and (D) RV-C-α during Hurricane Laura’s landfall at 00–12 UTC 27 August 2020.
As with Florence, the mean threat score (TS) of the QPF of Laura against the NOAA Stage IV data for 12 h, 24 h, and 36 h accumulated precipitation is analyzed (Figure not shown). Because of the relatively weak precipitation from Laura, the mean TS is small and often less than 0.4 for threshold precipitation over 80 mm. For precipitation of less than 80 mm, the revised PBL scheme in RV-A-α and RV-C-α provides a neutral impact on the QPF, with mean TS reduction and increment both less than 0.04 against Control. The revised HWRF PBL scheme improves the 24 h and 36 h QPF. Due to its quick decay and relatively weak rainfall, the improvement from RV-C-α is somewhat weaker for Laura than for Florence.
3.3 Inner-core horizontal and vertical winds
To evaluate whether the modified PBL scheme improved the hurricane inner-core representation, we compared the HWRF wind fields with available NOAA airborne Doppler radar observations. Figure 10 shows the winds at 1,500 m from the three experiments, initialized at 18 UTC 26 August 2020, and NOAA radar for Hurricane Laura at 00 UTC 27 August 2020 during landfall. Compared to the radar data, Control overestimates the inner-core winds with a larger area of strong winds (over 50 m_1). RV-A-α only slightly reduces the high winds in the northern portion of the inner-core region. RV-C-α reproduces an asymmetric pattern similar to the radar observations and has a small high wind (over 50 m−1) area around the eyewall.
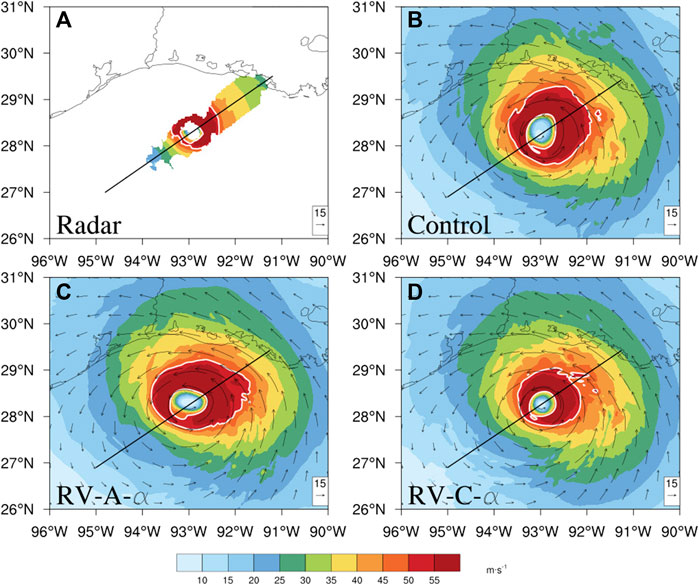
FIGURE 10. The 1,500 m wind from (A) NOAA Doppler radar, (B) Control, (C) RV-A-α, and (D) RV-C-α for Hurricane Laura near landfall time at 00 UTC 27 August 2020. The white contour line stands for wind over 50 m−1 for observations and simulations. The black line represents the cross-section in Figure 12.
Vertical wind profiles at 00 UTC 27 August 2020 from the NOAA P3 Doppler radar along the flight line (black line in Figure 10) are used to evaluate the forecasts of Hurricane Laura, initialized at 18 UTC 26 August 2020, shown in Figure 11. From the western portion of Laura, RV-C-α provides a high wind (>55 m−1) region closer to the radar observations, with high wind extending just to 7 km. Control and RV-A-α have too large an area with high wind (>55 m−1), extending to nearly 10 km. Compared to the eastern observations, RV-C-α provides a vertical structure similar to the radar data, with a separate high wind at ∼7 km and a small area with over 55 m−1 wind below 2 km altitude. Overall, RV-C-α shows a better wind speed pattern in both the east and west parts of hurricane with smaller area of strong winds. Control and RV-A-α still have stronger low-level and high-level wind.
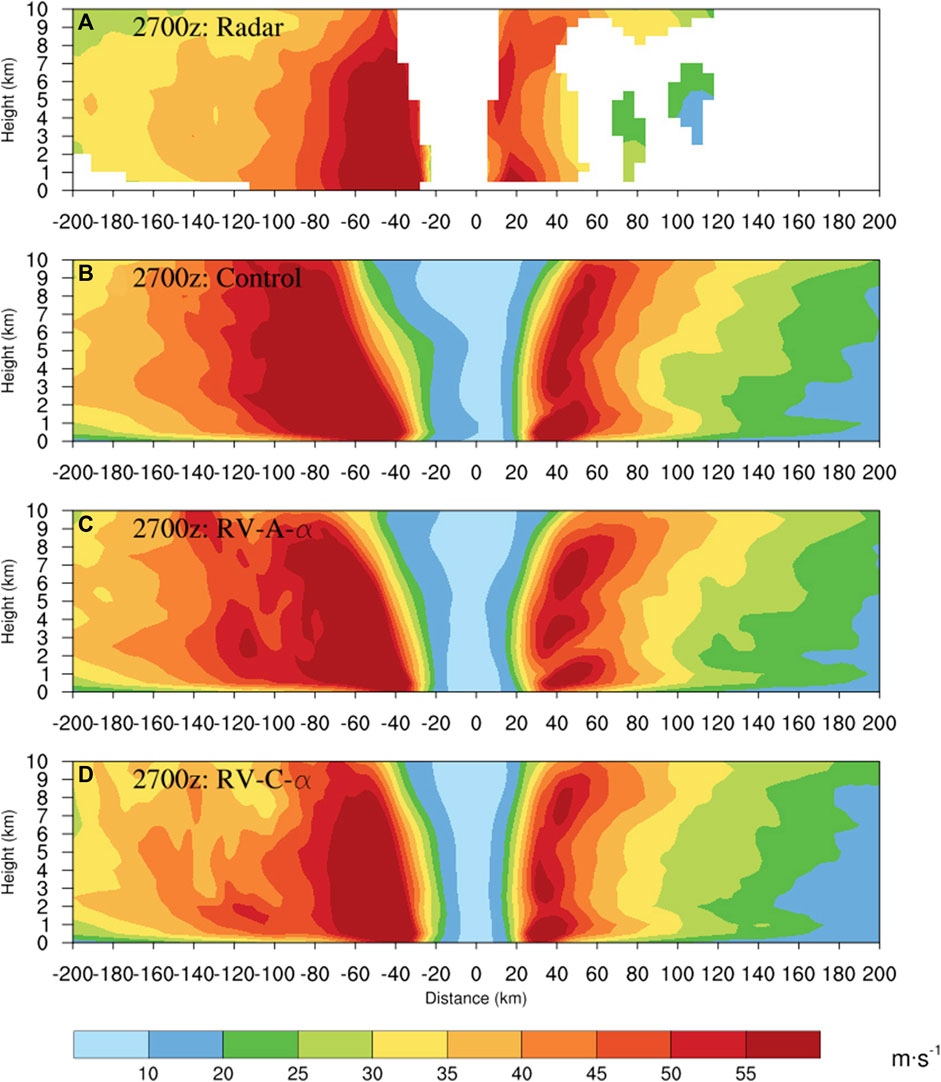
FIGURE 11. Wind field of vertical cross section for Laura at 00 UTC 27 August 2020, from (A) NOAA P3 TDR radar, (B) Control, (C) RV-A-α, and (D) RV-C-α.
The above results indicate that adding the RV effect into the HWRF PBL scheme can improve the representation of hurricane inner-core wind profiles. The result here is quantitatively consistent with the findings of Zhang et al. (2015), who adjusted the VED to obtain better wind structure forecasts of TCs over the ocean, although they did not include the RV effect.
4 Influence of RV parameterization on the evolution of hurricane inner core
The evolution of the hurricane inner-core structure is essential for hurricane track and intensity changes. In this section, we further examine the effects of the modified PBL scheme on the evolution of the hurricane inner-core structure, especially for the period near landfall. We use the Hurricane Florence case as an example, specifically, analyzing the forecasts initialized at 06 UTC 14 September 2018, when Florence was close to land.
Figure 12 shows the evolution of azimuthally averaged surface wind speed from Control (Figure 12A), RV-A-α (Figure 12B), and RV-C-α (Figure 12C) during the 60 h forecast. The maximum azimuthally averaged surface wind in RV-C-α is higher than that in Control and RV-A-α. The radius of MSW is smaller in RV-C-α in the first 12 h than in the other two experiments. After 24h, the azimuthally averaged surface wind speed in RV-C-α maintains a maximum wind of greater than 34 m-1. After this time, the maximum winds decay more slowly with time in RV-C-α than in the other two experiments. Through the intensity forecast analysis in Figure 5B, the simulated hurricane in Control and RV-A- α decays more quickly than the best track. The evolution of maximum wind here supports a much better intensity forecast of RV-C-α compared to Control (c.f., Figure 5).
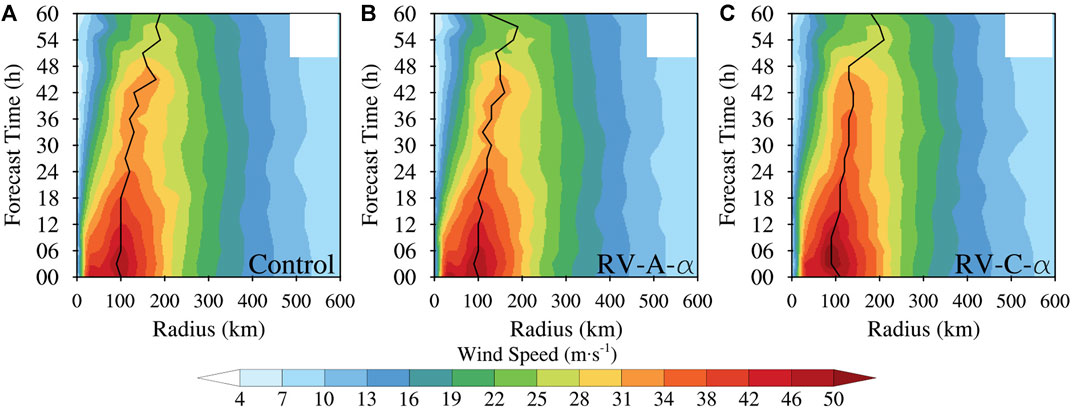
FIGURE 12. Evolution of azimuthally averaged surface maximum wind of Hurricane Florence initialized at 06 UTC 14 September 2018, from (A) Control, (B) RV-A-α, and (C) RV-C-α. The radius of MSW is represented by the black line.
To further examine the reason why RV-C-α leads to a better intensity forecast, Figure 13 shows the azimuthally averaged momentum VED from Control (Figure 13A), RV-A-α (Figure 13B), and RV-C-α (Figure 13C) at the 12 h, 24 h, and 36 h forecast times. The maximum azimuthally averaged VED in RV-C-α is higher than that in Control and RV-A-α at the 24 h and 36 h forecasts. Previous studies have indicated that RV can enhance the vertical mixing effect near the TC eyewall region (Zhu, 2008; Zhang and Drennan, 2012; Zhao et al., 2020; Li et al., 2021), thus influencing hurricane intensity and evolution. Therefore, the larger VED in RV-C-α implies a larger vertical mixing effect on the wind speed. With the decay of the hurricane, the hurricane eye enlarges, and the RV effects extend from the hurricane center to its vicinity. Consequently, RV-C-α results in the largest VED within a radius of 100–150 km at the 36 h forecast among all three experiments.
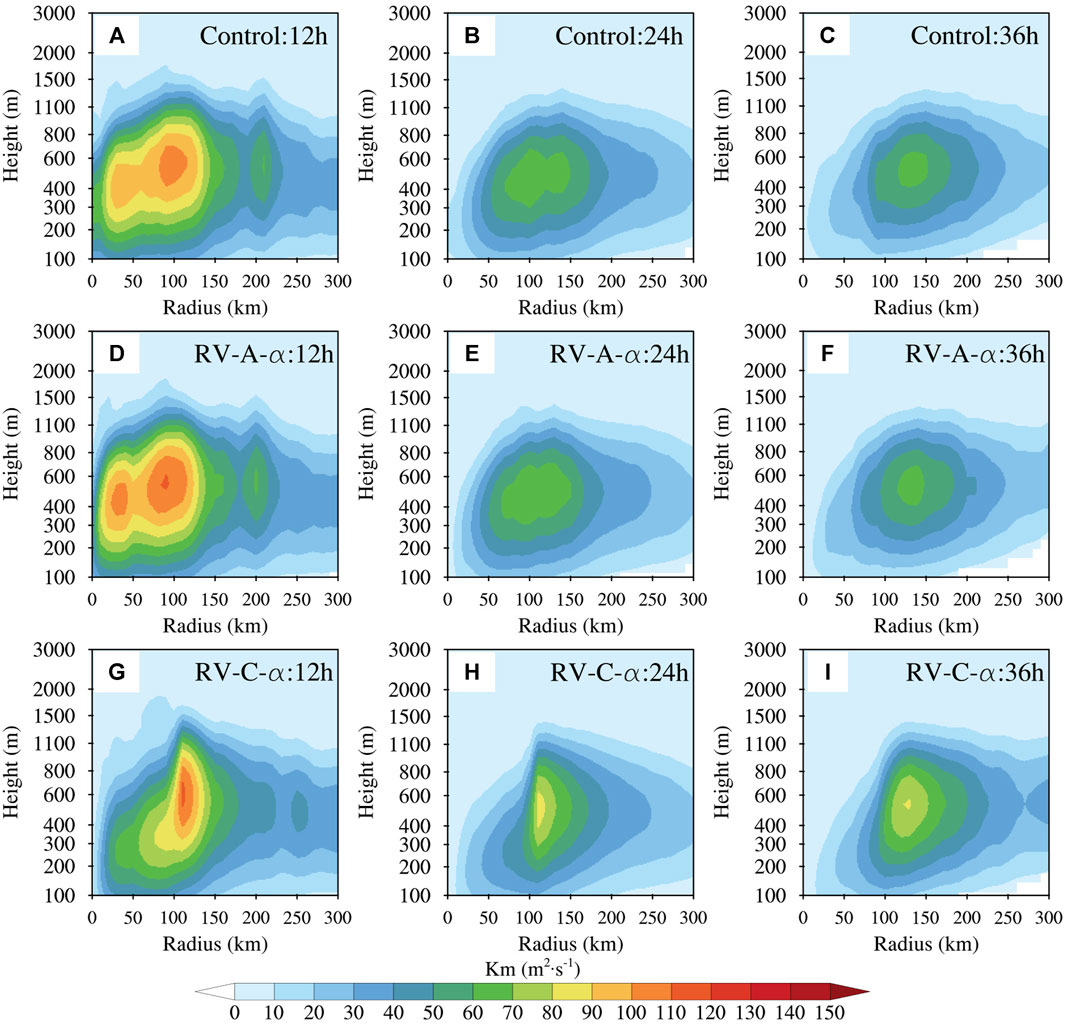
FIGURE 13. Azimuthally averaged momentum vertical eddy diffusivity (VED) of Hurricane Florence initialized at 06 UTC 14 September 2018, from (A–C) Control, (D–F) RV-A-α, and (G–I) RV-C-α at (A,D,G) 12 h, (B,E,H) 24 h, and (C,F,I) 36 h.
Figure 14 shows the azimuthally averaged wind speed from the three experiments at the 12 h, 24 h, and 36 h forecast times. The maximum azimuthally averaged wind speed, which is typically located at 850–900 hPa, is the same in Control as in RV-A-α, with a value of 42 ms−1 at 12 h, 33 ms−1 at 24 h, and 30 ms−1 at 36 h, respectively. In contrast, RV-C-α provides stronger azimuthally averaged wind speeds, with a maximum of 42 ms−1 at 12 h, 36 ms−1 at 24 h, and 33 ms−1 at 36 h, respectively. The larger VED (as shown in Figures 13G–I) indicates that adding the RV parameterization in RV-C-α causes a stronger mixing of high wind downward from levels above 900 hPa to the boundary layer that acts to increase the surface wind speed (near the 1,000 hPa level) by offsetting the surface friction effect and maintain the hurricane intensity over land (as shown in Figure 3C).
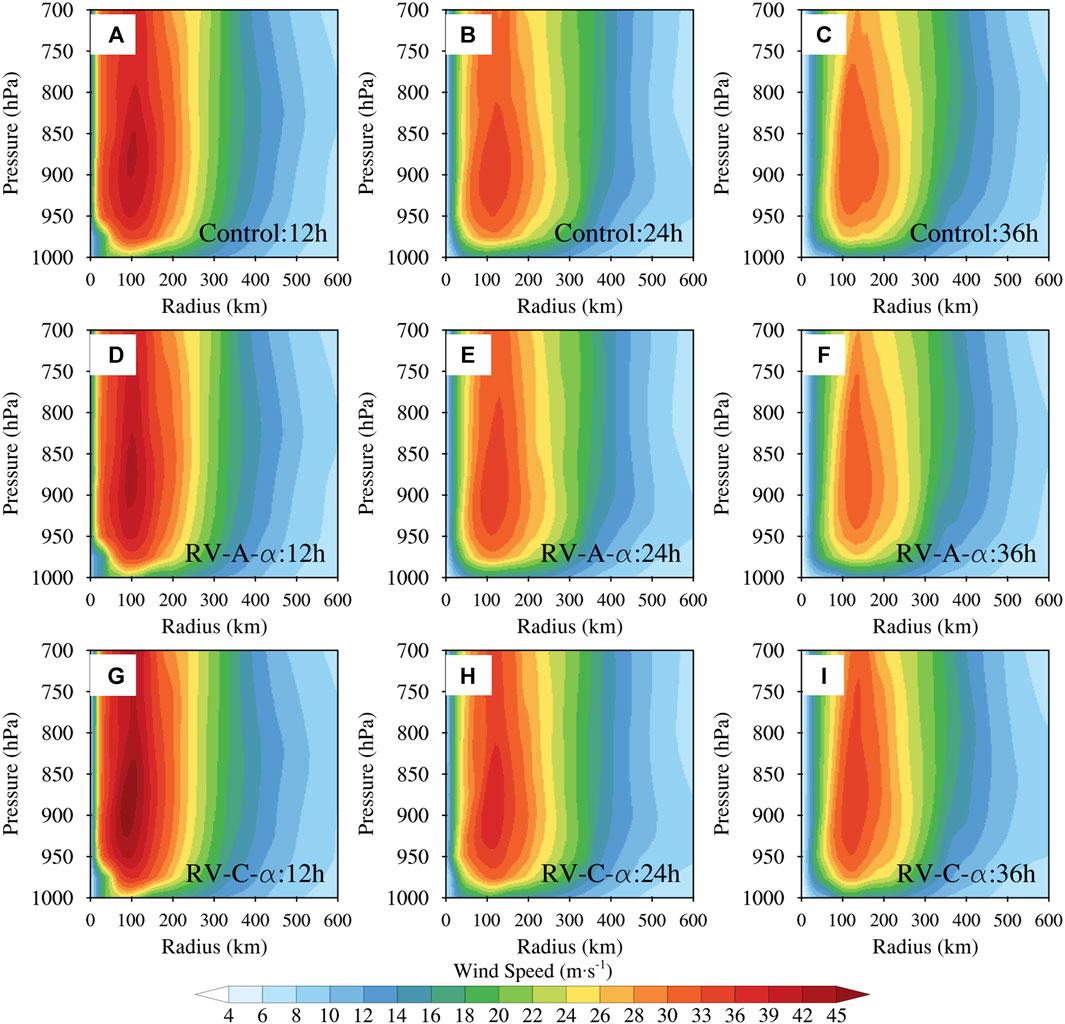
FIGURE 14. Azimuthally averaged wind speed of Hurricane Florence initialized at 06 UTC 14 September 2018, from (A–C) Control, (D–F) RV-A-α, and (G–I) RV-C-α at (A, D, G) 12 h, (B, E, H) 24 h, and (C, F, I) 36 h.
Although the above analysis indicates that the higher surface wind is associated with the vertical mixing in RV-C-α, the reason for the stronger high-level (above 900 hPa) winds in RV-C-α still needs to be clarified. According to Persing and Montgomery (2003) and Montgomery et al. (2006), the high-entropy air in a hurricane eye can lead to a stronger hurricane through eye-eyewall mixing. Therefore, the strong hurricane in the RV-C-α could be associated with the high-entropy air and eye-eyewall mixing process. To test this hypothesis, Figure 15 shows the equivalent potential temperature (θe) difference between RV-A-α and RV-C-α as well as Control at 12 h, 24 h, and 36 h. There is a large area of positive θe difference (>0.6 K) close to the storm center between RV-C-α and Control. This positive difference is generally smaller between RV-A-α and Control, indicating stronger eye-eyewall mixing with the RV effect. Wang and Xu (2010) found that higher entropy in the boundary layer inflow can significantly enhance hurricane development through an energy budget argument. Since the RV effect in RV-C-α provides stronger mixing near the surface (Figures 13G–I), the increase in boundary layer entropy is associated with stronger mixing. This high-entropy air helps offset the downdrafts induced by low-entropy air into the boundary layer in sheared TCs and helps maintain convective activity in combination with the strong inflow. Overall, the RV effect enhances the simulated hurricane intensity and reduces the intensity forecast error in RV-C-α. Of note, the wind-speed-dependent VED in RV-A-α offsets the RV contribution to VED, leading to a weaker storm compared to that in RV-C-α, but the RV effect still helps improve the intensity forecast in RV-A-α compared to Control.
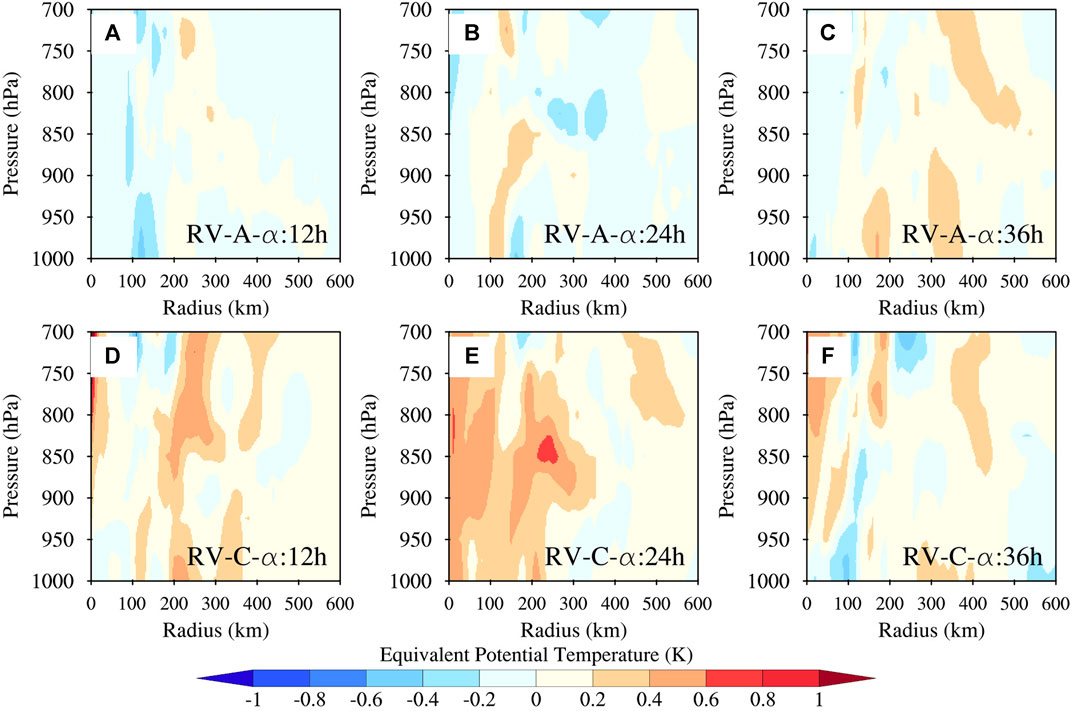
FIGURE 15. Difference in azimuthally averaged equivalent potential temperature of Hurricane Florence, initialized at 06 UTC 14 September 2018, between Control and (A–C) RV-A-α and (D-F) RV-C-α at (A,D) 12 h, (B,E) 24 h, and (C,F) 36 h.
5 Summary
In this study, the parameterization of roll vortices (RV), a type of large turbulence eddy in the TC boundary layer, was added to the PBL scheme of the NCEP HWRF model. The RV parameterization scheme that was originally developed by Li and Pu (2021) based on WRF-LES runs was adjusted to fit into the GFS PBL scheme within the HWRF model. Improvement was also made to the RV parametrization over land. Based on additional WRF-LES sensitivity experiments of landfalling storms beyond previous work, the coefficient that connects the RV intensity, velocity scale, and VED was modified from 0.20 to 0.06 for the free atmosphere and from 0.08 to 0.04 for the PBL in HWRF, taking into account differences in both grid spacing and land versus ocean. The new VED parameterization with the RV effect was compared with the original wind-speed-dependent VED parameterization in HWRF (Control) to evaluate their impacts on hurricane forecasts. Cycled HWRF forecasts are performed for Hurricanes Florence (2018) and Laura (2020), with a total of 14 cases during the analysis and forecast cycles of the two storms.
The results showed a better surface MSW forecast with a 14%–31% improvement in the experiment with the modified PBL scheme with the RV effect, compared with the original PBL scheme. The improved performance of the revised scheme on track and SLP forecasts was significant, with an increment of −2%–9% for track and −15%–36% for SLP forecasts.
Further diagnoses showed that the vertical turbulent mixing adjustment due to the RV effect in the revised scheme leads to a better wind structure forecast than the original scheme compared to NOAA airborne Doppler radar observations. The RV effect also modulates the moisture structure by enhancing θe in the boundary layer. The enhanced θe leads to a stronger storm during landfall in the HWRF forecast with the RV parameterization. The overall intensity forecast performance is better using the scheme with the RV effect according to the retrospective forecast. Overall, the modified PBL scheme with the RV effect could potentially be applied in the HWRF model for real-time TC forecasts. More cases will be performed in future work.
Data availability statement
The original contributions presented in the study are included in the article/supplementary material, further inquiries can be directed to the corresponding author.
Author contributions
XL: Data curation, Formal Analysis, Investigation, Methodology, Software, Validation, Visualization, Writing–original draft. ZP: Conceptualization, Funding acquisition, Investigation, Methodology, Project administration, Resources, Supervision, Writing–review and editing. JZ: Investigation, Resources, Writing–review and editing. ZZ: Investigation, Resources, Writing–review and editing.
Funding
The author(s) declare financial support was received for the research, authorship, and/or publication of this article. This study is supported by NOAA Award #NA19OAR4590239 (ZP), NASA Award # 08NSSC20K0900 (ZP), NSF Award #2004658 (ZP), NOAA Award NA21OAR4590370 (JZ), and ONR Grant N00014-20-1-2071 (JZ).
Acknowledgments
The computational resources and support from the Center for High-Performance Computing at the University of Utah and the UCAR CISL supercomputing system are appreciated.
Conflict of interest
The authors declare that the research was conducted in the absence of any commercial or financial relationships that could be construed as a potential conflict of interest.
Publisher’s note
All claims expressed in this article are solely those of the authors and do not necessarily represent those of their affiliated organizations, or those of the publisher, the editors and the reviewers. Any product that may be evaluated in this article, or claim that may be made by its manufacturer, is not guaranteed or endorsed by the publisher.
References
Aligo, E., Ferrier, B., and Carley, J. R. (2018). Modified NAM microphysics for forecasts of deep convective storms. Mon. Weather Rev. 146, 4115–4153. doi:10.1175/MWR-D-17-0277.1
Braun, S. A., and Tao, W. K. (2000). Sensitivity of high-resolution simulations of Hurricane Bob (1991) to planetary boundary layer parameterizations. Mon. Wea. Rev. 128, 3941–3961. doi:10.1175/1520-0493(2000)129<3941:sohrso>2.0.co;2
Bu, Y. P., Fovell, R. G., and Corbosiero, K. L. (2017). The influences of boundary layer mixing and cloud-radiative forcing on tropical cyclone size. J. Atmos. Sci. 74, 1273–1292. doi:10.1175/JAS-D-16-0231.1
Chen, S. S., Price, J. F., Zhao, W., Donelan, M. A., and Walsh, E. J. (2007). The CBLAST-Hurricane program and the next-generation fully coupled atmosphere–wave–ocean models for hurricane research and prediction. Bull. Am. Meteorol. Soc. 88, 311–318. doi:10.1175/bams-88-3-311
Doyle, J. D., Hodur, R. M., Chen, S., Jin, Y. I., Moskaitis, J. R., Wang, S., et al. (2014). Tropical cyclone prediction using COAMPS-TC. Oceanography 27, 104–115. doi:10.5670/oceanog.2014.72
Ek, M. B., Mitchell, K. E., Lin, Y., Rogers, E., Grunmann, P., Koren, V., et al. (2003). Implementation of Noah land surface model advances in the National Centers for Environmental Prediction operational mesoscale Eta model. J. Geophys. Res. 108 (D22), 8851. doi:10.1029/2002JD003296
Emanuel, K. A. (1986). An air-sea interaction theory for tropical cyclones. Part I: steady-state maintenance. J. Atmos. Sci. 43, 585–605. doi:10.1175/1520-0469(1986)043<0585:aasitf>2.0.co;2
Emanuel, K. A. (1995). Sensitivity of tropical cyclones to surface exchange coefficients and a revised steady-state model incorporating eye dynamics. J. Atmos. Sci. 52, 3969–3976. doi:10.1175/1520-0469(1995)052<3969:sotcts>2.0.co;2
Ernst, P. A., Jisan, M. A., and Ginis, I. (2019). On the characteristics of hurricane roll vortices over land. SURFO Tech. Rep. 19-02, 16–27.
Ferrier, B. S., Jin, Y., Lin, Y., Black, T., Rogers, E., and DiMego, G. (2002)). Implementation of a new grid-scale cloud and precipitation scheme in the NCEP Eta model. Conf. weather analysis Forecast. 19, 280–283.
Foster, R. C. (2005). Why rolls are prevalent in the hurricane boundary layer. J. Atmos. Sci. 62, 2647–2661. doi:10.1175/JAS3475.1
Gao, K., and Ginis, I. (2016). On the equilibrium-state roll vortices and their effects in the hurricane boundary layer. J. Atmos. Sci. 73, 1205–1222. doi:10.1175/JAS-D-15-0089.1
Gao, K., Ginis, I., Doyle, J. D., and Jin, Y. (2017). Effect of boundary layer roll vortices on the development of an axisymmetric tropical cyclone. J. Atmos. Sci. 74, 2737–2759. doi:10.1175/JAS-D-16-0222.1
Gopalakrishnan, S., Hazelton, A., and Zhang, J. A. (2021). Improving hurricane boundary layer parameterization scheme based on observations. Earth Space Sci. 8. doi:10.1029/2020EA001422
Gopalakrishnan, S. G., Marks, F., Zhang, J. A., Zhang, X., Bao, J. W., and Tallapragada, V. (2013). A study of the impacts of vertical diffusion on the structure and intensity of the tropical cyclones using the high-resolution HWRF system. J. Atmos. Sci. 70, 524–541. doi:10.1175/JAS-D-11-0340.1
Han, J., and Bretherton, C. S. (2019). TKE-based moist Eddy-Diffusivity Mass-Flux (EDMF) parameterization for vertical turbulent mixing. Weather Forecast 34, 869–886. doi:10.1175/WAF-D-18-0146.1
Hong, S. Y. (2010). A new stable boundary-layer mixing scheme and its impact on the simulated East Asian summer monsoon. Q. J. R. Meteorol. Soc. 136, 1481–1496. doi:10.1002/qj.665
Hong, S. Y., Noh, Y., and Dudhia, J. (2006). A new vertical diffusion package with an explicit treatment of entrainment processes. Mon. Weather Rev. 134, 2318–2341. doi:10.1175/MWR3199.1
Hong, S. Y., and Pan, H. L. (1996). Nonlocal boundary layer vertical diffusion in a medium-range forecast model. Mon. Weather Rev. 124, 2322–2339. doi:10.1175/1520-0493(1996)124<2322:nblvdi>2.0.co;2
Hong, S. Y., and Pan, H. L. (1998). Convective trigger function for a mass-flux cumulus parameterization scheme. Mon. Weather Rev. 126, 2599–2620. doi:10.1175/1520-0493(1998)126<2599:ctffam>2.0.co;2
Huang, L., Li, X., Liu, B., Zhang, J. A., Shen, D., Zhang, Z., et al. (2018). Tropical cyclone boundary layer rolls in synthetic aperture radar imagery. J. Geophys. Res. Oceans 123, 2981–2996. doi:10.1029/2018JC013755
Janjic, Z., Gall, R., and Pyle, M. E. (2010). Scientific documentation for the NMM solver (No. NCAR/TN-477+STR). Natl. Cent. Atmos. Res. Univ. Corp. Atmos. Res. doi:10.5065/D6MW2F3Z
Kalina, E. A., Biswas, M. K., Zhang, J. A., and Newman, K. M. (2021). Sensitivity of an idealized tropical cyclone to the configuration of the global forecast system–eddy diffusivity mass flux planetary boundary layer scheme. Atmosphere 12, 284. doi:10.3390/atmos12020284
Katsaros, K. B., Vachon, P. W., Black, P. G., Dodge, P. P., and Uhlhorn, E. W. (2000). Wind fields from SAR: could they improve our understanding of storm dynamics? Johns Hopkins Apl. Tech. Dig. 21, 86–93.
Kleist, D. T., Parrish, D. F., Derber, J. C., Treadon, R., Wu, W. S., and Lord, S. (2009). Introduction of the GSI into the NCEP global data assimilation system. Weather Forecast 24, 1691–1705. doi:10.1175/2009WAF2222201.1
Kurihara, Y., and Tuleya, R. E. (1974). Structure of a tropical cyclone developed in a three-dimensional numerical simulation model. J. Atmos. Sci. 3, 893–919. doi:10.1175/1520-0469(1974)031<0893:soatcd>2.0.co;2
Lacis, A. A., and Hansen, J. (1974). A parameterization for the absorption of solar radiation in the earth's atmosphere. J. Atmos. Sci. 31, 118–133. doi:10.1175/1520-0469(1974)031<0118:apftao>2.0.co;2
Li, X., and Pu, Z. (2021). Vertical eddy diffusivity parameterization based on a large eddy simulation and its impact on prediction of hurricane landfall. Geophys. Res. Lett. 48, e2020GL090703. doi:10.1029/2020GL090703
Li, X., and Pu, Z. (2023). Dynamic mechanisms associated with the structure and evolution of roll vortices and coherent turbulence in the hurricane boundary layer: a large eddy simulation during the landfall of Hurricane Harvey. Bound. Layer. Meteorol. 186, 615–636. doi:10.1007/s10546-022-00775-w
Li, X., Pu, Z., and Gao, Z. (2021). Effects of roll vortices on the evolution of Hurricane Harvey during landfall. J. Atmos. Sci. 78, 1847–1867. doi:10.1175/JAS-D-20-0270.1
Lin, Y., and Mitchell, K. E. (2005). “The NCEP Stage II/IV hourly precipitation analyses: development and applications,” in 19th Conf. on Hydrology (San Diego, CA: American Meteorological Society). Preprints Paper 1.2.
Montgomery, M. T., Bell, M. M., Aberson, S. D., and Black, M. L. (2006). Hurricane Isabel (2003): new insights into the physics of intense storms. Part I: mean vortex structure and maximum intensity estimates. Bull. Am. Meteorol. Soc. 87, 1335–1348. doi:10.1175/BAMS-87-10-1335
Morrison, I., Businger, S., Marks, F., Dodge, P., and Businger, J. A. (2005). An observational case for the prevalence of roll vortices in the hurricane boundary layer. J. Atmos. Sci. 62, 2662–2673. doi:10.1175/JAS3508.1
Ooyama, K. (1969). Numerical simulation of the life cycle of tropical cyclones. J. Atmos. Sci. 26, 3–40. doi:10.1175/1520-0469(1969)026<0003:nsotlc>2.0.co;2
Pan, H. L., and Wu, W. S. (1995). Implementing a mass flux convection parameterization package for the NMC medium-range forecast model.
Persing, J., and Montgomery, M. T. (2003). Hurricane superintensity. J. Atmos. Sci. 60, 2349–2371. doi:10.1175/1520-0469(2003)060<2349:hs>2.0.co;2
Schwarzkopf, M. D., and Fels, S. B. (1991). The simplified exchange method revisited: an accurate, rapid method for computation of infrared cooling rates and fluxes. J. Geophys. Res. Atmos. 96, 9075–9096. doi:10.1029/89JD01598
Sirutis, J., and Miyakoda, K. (1990). Subgrid scale physics in 1-month forecasts. Part I: experiment with four parameterization packages. Mon. Weather Rev. 118, 1043–1064. doi:10.1175/1520-0493(1990)118<1043:sspimf>2.0.co;2
Smith, R. K. (1968). The surface boundary layer of a hurricane. Tellus 20, 473–484. doi:10.1111/j.2153-3490.1968.tb00388.x
Smith, R. K., and Thomsen, G. L. (2010). Dependence of tropical-cyclone intensification on the boundary-layer representation in a numerical model. Q. J. R. Meteorol. Soc. 136, 1671–1685. doi:10.1002/qj.687
Sukhanovskii, A., and Popova, E. (2020). The importance of horizontal rolls in the rapid intensification of tropical cyclones. Boundary-Layer Meteorol. 175, 259–276. doi:10.1007/s10546-020-00503-2
Tallapragada, V., Kieu, C., Kwon, Y., Trahan, S., Liu, Q., Zhang, Z., et al. (2014). Evaluation of storm structure from the operational HWRF during 2012 implementation. Mon. Weather Rev. 142, 4308–4325. doi:10.1175/MWR-D-13-00010.1
Tang, J., Zhang, J. A., Aberson, S. D., Marks, F. D., and Lei, X. (2018). Multilevel tower observations of vertical eddy diffusivity and mixing length in the tropical cyclone boundary layer during landfalls. J. Atmos. Sci. 75, 3159–3168. doi:10.1175/JAS-D-17-0353.1
Troen, I. B., and Mahrt, L. (1986). A simple model of the atmospheric boundary layer; sensitivity to surface evaporation. Boundary-Layer Meteorol. 37, 129–148. doi:10.1007/BF00122760
Van Sang, N., Smith, R. K., and Montgomery, M. T. (2008). Tropical-cyclone intensification and predictability in three dimensions. Q. J. R. Meteorol. Soc. 134, 563–582. doi:10.1002/qj.235
Wang, W., Sippel, J. A., Abarca, S., Zhu, L., Liu, B., Zhang, Z., et al. (2018). Improving NCEP HWRF simulations of surface wind and inflow angle in the eyewall area. Weather Forecast 33, 887–898. doi:10.1175/WAF-D-17-0115.1
Wang, X. (2010). Incorporating ensemble covariance in the gridpoint statistical interpolation variational minimization: a mathematical framework. Mon. Weather Rev. 138, 2990–2995. doi:10.1175/2010MWR3245.1
Wang, Y., and Xu, J. (2010). Energy production, frictional dissipation, and maximum intensity of a numerically simulated tropical cyclone. J. Atmos. Sci. 67, 97–116. doi:10.1175/2009JAS3143.1
Wing, A. A., Camargo, S. J., Sobel, A. H., Kim, D., Moon, Y., Murakami, H., et al. (2019). Moist static energy budget analysis of tropical cyclone intensification in high-resolution climate models. J. Clim. 32, 6071–6095. doi:10.1175/JCLI-D-18-0599.1
Wurman, J., and Winslow, J. (1998). Intense sub-kilometer-scale boundary layer rolls observed in Hurricane Fran. Science 280, 555–557. doi:10.1126/science.280.5363.555
Yablonsky, R. M., Ginis, I., Thomas, B., Tallapragada, V., Sheinin, D., and Bernardet, L. (2015). Description and analysis of the ocean component of NOAA’s operational hurricane weather research and forecasting model (HWRF). J. Atmos. Ocean. Tech. 32, 144–163. doi:10.1175/JTECH-D-14-00063.1
Yu, B., Chowdhury, A. G., and Masters, F. J. (2008). Hurricane wind power spectra, cospectra, and integral length scales. Boundary-Layer Meteorol. 129, 411–430. doi:10.1007/s10546-008-9316-8
Zhang, F., and Pu, Z. (2017). Effects of vertical eddy diffusivity parameterization on the evolution of landfalling hurricanes. J. Atmos. Sci. 74, 1879–1905. doi:10.1175/JAS-D-16-0214.1
Zhang, F., Pu, Z., and Wang, C. (2017). Effects of boundary layer vertical mixing on the evolution of hurricanes over land. Mon. Weather Rev. 145, 2343–2361. doi:10.1175/MWR-D-16-0421.1
Zhang, J. A., and Drennan, W. M. (2012). An observational study of vertical eddy diffusivity in the hurricane boundary layer. J. Atmos. Sci. 69, 3223–3236. doi:10.1175/JAS-D-11-0348.1
Zhang, J. A., Kalina, E. A., Biswas, M. K., Rogers, R. F., Zhu, P., and Marks, F. D. (2020). A review and evaluation of planetary boundary layer parameterizations in Hurricane Weather Research and Forecasting model using idealized simulations and observations. Atmosphere 11, 1091. doi:10.3390/atmos11101091
Zhang, J. A., Nolan, D. S., Rogers, R. F., and Tallapragada, V. (2015). Evaluating the impact of improvements in the boundary layer parameterization on hurricane intensity and structure forecasts in HWRF. Mon. Weather Rev. 143, 3136–3155. doi:10.1175/MWR-D-14-00339.1
Zhang, J. A., and Rogers, R. F. (2019). Effects of parameterized boundary layer structure on hurricane rapid intensification in shear. Mon. Weather Rev. 147, 853–871. doi:10.1175/MWR-D-18-0010.1
Zhang, J. A., Zhu, P., Masters, F. J., Rogers, R. F., and Marks, F. D. (2011). On momentum transport and dissipative heating during hurricane landfalls. J. Atmos. Sci. 68, 1397–1404. doi:10.1175/JAS-D-10-05018.1
Zhao, Z., Chan, P. W., Wu, N., Zhang, J. A., and Hon, K. K. (2020). Aircraft observations of turbulence characteristics in the tropical cyclone boundary layer. Boundary-Layer Meteorol. 174, 493–511. doi:10.1007/s10546-019-00487-8
Zhu, P. (2008). Simulation and parameterization of the turbulent transport in the hurricane boundary layer by large eddies. J. Geophys. Res. 113, D17104. doi:10.1029/2007JD009643
Zhu, P., and Furst, J. (2013). On the parameterization of surface momentum transport via drag coefficient in low-wind conditions. Geophys. Res. Lett. 40, 2824–2828. doi:10.1002/grl.50518
Keywords: planetary boundary layer, hurricanes, landfall, parameterization, roll vortices, numerical prediction
Citation: Li X, Pu Z, Zhang JA and Zhang Z (2023) A modified vertical eddy diffusivity parameterization in the HWRF model based on large eddy simulations and its impact on the prediction of two landfalling hurricanes. Front. Earth Sci. 11:1320192. doi: 10.3389/feart.2023.1320192
Received: 11 October 2023; Accepted: 15 November 2023;
Published: 30 November 2023.
Edited by:
Liguang Wu, Fudan University, ChinaReviewed by:
Qingqing Li, Nanjing University of Information Science and Technology, ChinaQingyuan Liu, Chinese Academy of Meteorological Sciences, China
Copyright © 2023 Li, Pu, Zhang and Zhang. This is an open-access article distributed under the terms of the Creative Commons Attribution License (CC BY). The use, distribution or reproduction in other forums is permitted, provided the original author(s) and the copyright owner(s) are credited and that the original publication in this journal is cited, in accordance with accepted academic practice. No use, distribution or reproduction is permitted which does not comply with these terms.
*Correspondence: Zhaoxia Pu, Wmhhb3hpYS5QdUB1dGFoLmVkdQ==