 Min Song1
 Hongtian Wang
 Ying Zhao
 Ang Li
95% of researchers rate our articles as excellent or good
Learn more about the work of our research integrity team to safeguard the quality of each article we publish.
Find out more
ORIGINAL RESEARCH article
Front. Earth Sci. , 03 January 2024
Sec. Geoinformatics
Volume 11 - 2023 | https://doi.org/10.3389/feart.2023.1314378
This article is part of the Research Topic Response and Catastrophe Mechanisms of Geotechnical Underground Exploration: Theories and Numerical Modeling View all 14 articles
In the process of grading and dynamically optimizing the design and construction parameters of the surrounding rock mass of a rock tunnel face, efficiently and accurately acquiring the geometrical parameters of the rock discontinuities is an important basic task. To address the problems of time consuming, low accuracy, and high danger associated with traditional methods of obtaining the structural information of rock mass, this paper proposes a method for three-dimensional reconstruction and intelligent information extraction of tunnel face based on binocular stereo vision (BSV). First, the parallel binocular device with a single camera was improved, calibrated using the checkerboard calibration method. By integrating with the semi-global matching algorithm, the BSV based method for the three-dimensional reconstruction of the rock mass of the tunnel face was optimized. Furthermore, based on the results from on-site engineering applications, this study leveraged two parameters, point cloud density and algorithm runtime, to determine the optimal values for the disparity range and window size parameters within the semi-global stereo matching algorithm. This enhancement improved the performance of the 3D reconstruction method based on binocular stereo vision. Finally, efficient and refined intelligent methods for extracting structural parameters of the rock mass were proposed based on k-nearest neighbor search and kernel density estimation. The research results can provide reliable technical support for the intelligent and efficient acquisition of rock mass structural information in rock tunnel engineering faces.
In rock masses, numerous randomly developed joints, fissures, and discontinuities of varying scales exist. The geometric distribution and orientation analysis of these discontinuities are fundamental and necessary processes for the classification, stability assessment, and design and construction of rock tunnels in geotechnical engineering (Li et al., 2017; Wang et al., 2021). However, due to factors such as limitations in engineering exploration techniques, tunnel depth, topography, construction duration, and costs, it is challenging to achieve detailed coverage of the entire tunnel alignment during the early stages of engineering construction (Yu et al., 2023). Therefore, as tunnel excavation progresses, there is a need to monitor in real-time the changes in information regarding newly exposed rock joints on the tunnel face. This enables the swift completion of geological sketches, facilitating timely dynamic adjustments to optimize tunnel design and construction parameters.
However, in the context of collecting information about rock joints on tunnel faces, traditional manual geological sketching typically relies on contact measurements using tools such as compasses and calipers. This method is characterized by time-consuming processes, high subjectivity, and elevated safety risks (Ge et al., 2017; Wang et al., 2021). Hence, there is an urgent need for a systematic approach for the identification and parameter extraction of rock joints on tunnel faces that is both high-precision and efficient.
In recent years, non-contact measurement methods have found widespread application in the acquisition of discontinuities information in tunnels and underground engineering rock masses (Xu et al., 2021a; Battulwar et al., 2021; Xu et al., 2021b; Xu et al., 2022; Xu et al., 2023). Non-contact measurements primarily involve two methods: la-ser scanning and close-range photogrammetry. Three-dimensional laser scanning technology can rapidly acquire high-precision point cloud data of rock joints (Xu et al., 2017; Zhou et al., 2021). However, the cost of three-dimensional laser scanning equipment suitable for on-site engineering applications is substantial, limiting the method’s scalability and widespread use in pro-jects (Wei et al., 2015). Close-range photogrammetry, with its advantages of low cost, portability, and ease of operation, is capable of obtaining millimeter-level high-precision point clouds as well (Sturzenegger and Stead, 2009). Currently, the use of Structure from Motion (SfM) algorithms can effectively reconstruct entire rock specimens using photographic data (Zhang et al., 2022). However, for large-scale tunnel face rock masses, the use of SfM technology requires capturing dozens or even hundreds of images from different angles to reconstruct the entire rock surface (García-Luna et al., 2019; Chen et al., 2021), which is operationally complex and not conducive to rapid construction in engineering projects. García-Luna et al. (2019) conducted photogrammetric reconstructions of the surfaces of two tunnels, capturing 169 and 206 images, respectively. The reconstruction times for these datasets were 22 and 25 h, respectively. Even when using only 13 images for reconstruction, the average processing time remained approximately 14 min.
In comparison to SfM technology, stereo vision technology with binocular vision can achieve three-dimensional reconstruction using only two tunnel face images. This not only offers higher efficiency but also meets the accuracy requirements for extracting discontinuities information (Zhang et al., 2016). Li et al. (2017) applied stereo vision to construct a quantitative characterization system for tunnel face rock masses, utilizing the Australian photogrammetric system (
This paper is grounded in the context of intelligent design and construction in tunnel engineering, with a specific focus on the Yulin Diversion Tunnel Project (Tunnel #7) in China. It optimizes the process of three-dimensional reconstruction of tunnel faces based on binocular stereovision technology. It explores the impact of parameters such as disparity range and window size on the speed and quality of three-dimensional reconstruction. Furthermore, it proposes an intelligent extraction method for the discontinuity orientation information of tunnel face rock masses based on k nearest neighbor search and kernel density estimation. This approach furnishes a dependable application method for the digital geological sketching of rock mass tunnel faces.
Figure 1 illustrates a comprehensive binocular stereo vision photogrammetric process, encompassing the determination of the shooting device parameters, camera calibration, image acquisition, image preprocessing, stereo matching, three-dimensional reconstruction, and post-processing of point clouds (Hartley and Zisserman, 2003). The specific workflow is outlined as follows.
(1) Estimate the shooting range based on the contour map inside the tunnel to determine suitable device parameters (focal length, shooting distance, and baseline length) (Kim et al., 2016).
(2) Conduct camera calibration indoors using the selected device parameters, significantly reducing on-site shooting time. The calibration yields intrinsic parameters (focal length, principal point coordinates, axis skew parameters) and extrinsic parameters (rotation matrix and translation matrix).
(3) Capture two images of the tunnel face from the left and right positions inside the tunnel. Perform epipolar rectification to obtain the reprojection matrix (Bradski and Kaehler, 2008). Subsequently, apply grayscale transformation to the images and employ the semi-global stereo matching algorithm (
(4) Conduct post-processing on the three-dimensional point cloud, involving tasks such as region of interest segmentation, smoothing, denoising, and coordinate transformation (Gigli and Casagli, 2011). This post-processing mitigates potential noise or missing data in the three-dimensional point cloud, ensuring the acquisition of a high-quality three-dimensional point cloud for accurate estimation of structural parameters.
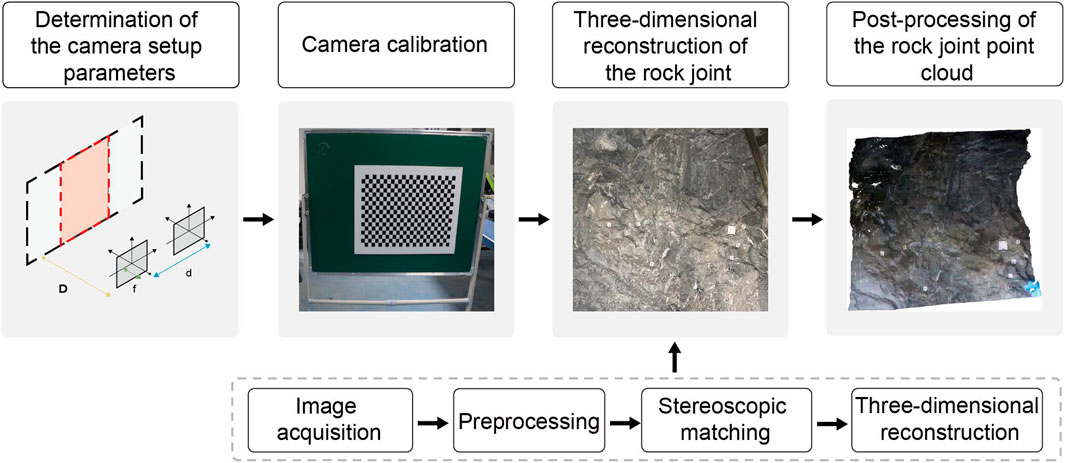
FIGURE 1. Parallel binocular stereo vision reconstruction process of tunnel face.
In the aforementioned process, the stereo matching step plays a decisive role in determining the quality of the reconstructed three-dimensional point cloud. Section 2.2 below will elaborate on the fundamental principles of the semi-global stereo matching algorithm and analyze the impact of algorithm parameters on the quality and speed of point cloud reconstruction.
An exemplary stereo matching algorithm must concurrently consider precision and efficiency while maintaining high robustness. The Semi-Global Matching Algorithm (SGM) fulfills these requirements (Ernst and Hirschmüller, 2008; Spangenberg et al., 2013). Binocular stereovision technology based on Semi-Global Matching Algorithm (SGM) exhibits high performance in applications requiring real-time geological information retrieval (Kim et al., 2016). The algorithm primarily encompasses four steps: cost computation, cost aggregation, disparity calculation, and disparity optimization (Xie et al., 2014). The fundamental concept involves selecting a disparity range and calculating the cost value between each pixel in one image and its corresponding pixel in another image for each disparity value within the chosen range. After cost aggregation, the minimum cost value within this disparity range corresponds to the optimal disparity for the best match. Following epipolar rectification, as depicted in Figure 2, a target point (
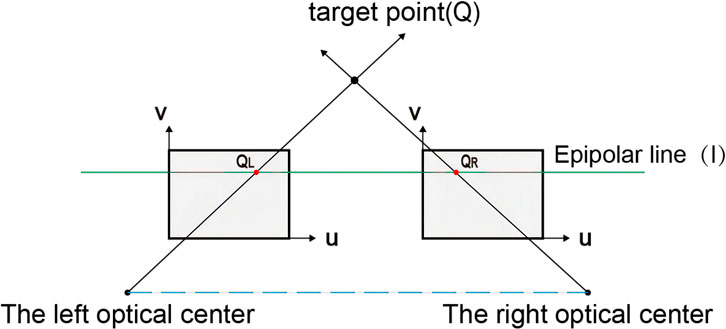
FIGURE 2. Polar geometry for parallel views.
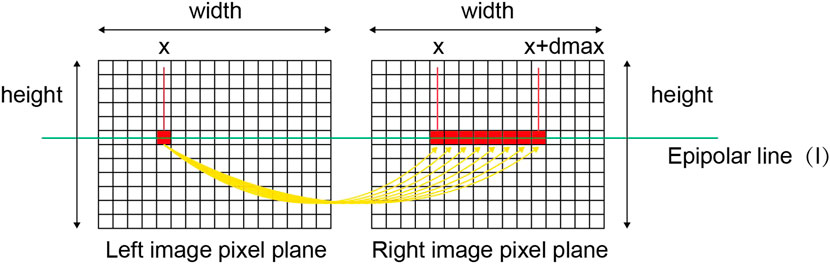
FIGURE 3. Stereo matching determines the corresponding point,
Various shooting scenarios encompass distinct disparity ranges; hence, it is imperative to select an effective disparity range for cost computation. A smaller disparity range can mitigate computational complexity but might overlook genuine differences. Conversely, a larger disparity range allows for more disparacies but could increase computation time. Therefore, judicious estimation of the disparity range is paramount in stereo matching. This paper will delve into methods for determining the disparity range in tunnel engineering scenes and examine the impact of this parameter on the quality of the disparity map and point cloud in Section 4.
After determining the disparity range, the algorithm relies on the Census Transform (Zabih and Woodfill, 1994) for matching cost computation (Figure 4). The transform compares the grayscale value of the central pixel (

FIGURE 4. Calculation of the matching cost.
Where,
It is not difficult to understand that the computed cost value represents the degree of matching between two pixels. According to the aforementioned principles, it is evident that the size of the neighborhood window determines the size of the matched image blocks. A smaller window size can capture more details of the tunnel face and lead to faster computation. However, it might be more susceptible to the influence of noise and texture blurring. Conversely, a larger window size can provide greater noise robustness and occlusion resistance but may result in a blurry or excessively smoothed disparity map, potentially missing finer details and edges. Therefore, it is necessary to select appropriate parameters to strike a balance between spatial resolution and noise robustness.
In summary, the optimal disparity range and window size depend on the specific characteristics of the shooting scene. In practical tunnel engineering applications, shooting sites often exhibit strong noise, high complexity, and intricate variations in tunnel face textures. Hence, for achieving high-quality and efficient three-dimensional reconstruction of tunnel faces, it is essential to choose suitable parameters to balance accuracy, robustness, and processing speed. Section 4.2.2 and Section 3.2.3 of this paper respectively discuss and optimize the disparity range and window size parameters.
The orientation of discontinuities is one of the parameters recommended by the International Society for Rock Mechanics for description. Riquelme et al. (2014) presented a methodology for the identification and analysis of flat surfaces outcropping in a rocky slope using the 3D data obtained with LiDAR. Zhang et al. (2018) proposed a method to automatically extract rock discontinuities from point clouds for rock slopes along highways. Li et al. (2019) proposed an automatic characterization method for rock mass discontinuities using 3D point clouds applied to drill-and -blast rock tunnels. Singh et al. (2022) proposed a new automated algorithm that used the spatial distribution of points on discontinuities to capture unique signatures in the form of sinusoidal waves. The discontinuities are then effectively characterized by clustering the amplitude and phase profiles of the sinusoidal waves. Building upon prior research findings, this method utilizes the acquired three-dimensional point cloud. It employs a developed algorithm for intelligent extraction of discontinuity orientation, implemented in Matlab. The accuracy of this algorithm was validated through manual measurements of surface orientation.
The computation of point cloud normals involves selecting target points from the processed point cloud of the tunnel face rock surface. To determine the normals at these target points, information from neighboring points is utilized for local searching (Terrell and Scott, 1992). Subsequently, a covariance matrix of the neighboring points is constructed, and the normals are computed by solving for the eigenvalues and eigenvectors of this matrix. In this study, the point cloud normal computation is implemented using the
The solved normals can be reoriented by mapping them to the horizontal projection grid. Considering the coordinate system where the positive Y-axis is oriented to the north (N), the positive X-axis is oriented to the east (E), and the positive Z-axis is oriented upwards; Eq. 4 and Eq. 5 are employed with the unit normal vector
Mapping the orientation of each point to the red-flat projection grid results in
The kernel density estimation algorithm (Riquelme et al., 2014) is a method for estimating the probability density function of data, which can be utilized to determine regions of data point clustering, thus extracting and visualizing dominant discontinuity orientations. The coordinates of the data point with the highest density are determined for the obtained
Due to varying degrees of convexity in the rock mass discontinuities, it is necessary to predefine a permissible error angle (
This study employs the K-means clustering algorithm (Hartigan and Wong, 1979), which operates on the principle of partitioning the sample point cloud into
E, F, and G are respectively the normal vector
The Yulin Diversion Tunnel No. 7 has a total length of 4188 m, making it an exceptionally long diversion tunnel. The maximum depth of its tunnel floor is 430 m, and it has a horseshoe-shaped cross-sectional design. The tunnel is situated in a region with steep terrain and significant topographical variations. The geological structure in this area is highly developed, presenting complex engineering geological conditions. Under the long-term regional stress in the north-south direction, the dominant basement structures have developed, primarily characterized by east-west trending folds and faults. The exposed geological formations within the survey area primarily consist of Neogene Quaternary strata, Upper Tertiary strata, and Lower Paleozoic Qinling Group Guozhuang Formation, as well as intrusive rocks. The predominant lithology is characterized by dark schistose diorite gneiss and hornblende schistose diorite gneiss. Moreover, the rock and soil formations in the area are significantly influenced by tectonic factors such as folding, faulting (layers), and jointing, resulting in a relatively fractured rock mass with high groundwater content.
(1) The shooting range was estimated based on the tunnel site conditions, with a determined shooting distance of approximately 6 m, a camera focal length of 18mm, and a baseline length of 67 cm. Under these conditions, the achievable precision for discernible objects is 2 mm. Calibration was performed indoors using an A2 sized chessboard calibration board to obtain the camera’s intrinsic and extrinsic parameters (Friedman et al., 1977) (Figure 5A). The calibration board used in the experiment had checkers with a size of 20 mm and was arranged in a grid of 17 rows and 26 columns. The average reprojection error for the left camera calibration was 0.21 pixels, while the right camera calibration exhibited an average reprojection error of 0.22 pixels.
(2) The selected on-site shooting range for the tunnel’s face was approximately 16 m2. Six ground control points (GCPs) and a target board were positioned on the rock surface, with each GCP having a side length of 80 mm. The target board featured four markers with equidistant spacing of 120 mm between them, and their three-dimensional coordinates at the center point were measured using a total station (Figure 5B). Additionally, two 800 W LED floodlights were set up to ensure adequate illumination inside the tunnel, preventing shadows on the rock surface that could lead to gaps in the point cloud.
(3) After placing the GCPs and target board, the discontinuity orientation of five typical discontinuities was measured on-site using a mechanical geological compass as a reference group (Figure 5C).
(4) A modified single-camera parallel stereo photography device was employed to obtain the stereoscopic information of the tunnel face (Figure 5D). This setup consisted of a digital camera, gimbal, tripod, support rod, slider, pantilt head, slider fixed clamp, and laser rangefinder. Detailed camera parameters are provided in Table 1. The slider was upgraded for this study, featuring a scale and slider fixed clamps. During use, the positions of the two slider fixed clamps could be adjusted based on the scale, allowing for the selection of baseline lengths to meet the requirements of different shooting ranges.
(5) The collected two photos were processed following the procedures outlined in Section 2.1, focusing on the region of interest (Zhou et al., 2021), which was approximately 12 m2 (Figure 6A). The parameters for the
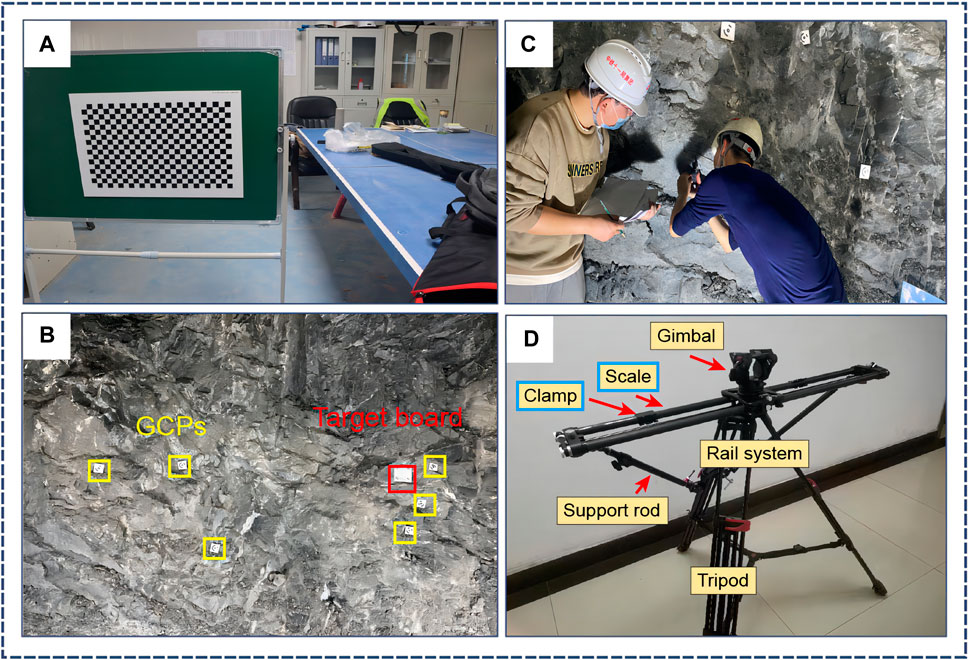
FIGURE 5. On-site collection of rock mass images on the face of the tunnel. Camera calibration (A). Setting up the shooting site (B). Measuring discontinuity orientations with a geological compass (C). Single-camera parallel binocular shooting device (D).

TABLE 1. Camera parameters.
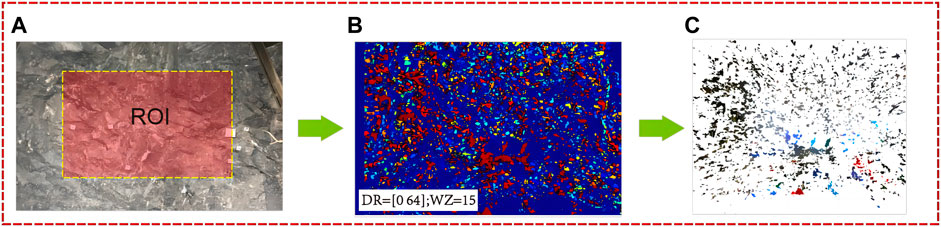
FIGURE 6. 3D reconstruction of tunnel face rock mass. Region of interest (ROI) delineation (A). The disparity map under default parameters (B). The point cloud image under default parameters (C).
From Figures 6B,C, it is evident that, under default parameters, the disparity map is excessively chaotic, leading to a very sparse and scattered point cloud. Consequently, applying the
The disparity range should be selected based on the minimum and maximum horizontal displacements between corresponding pixels in the rectified image pairs. Figure 7 illustrates the horizontal displacement values for some pixels in the tunnel face image pairs. From Figure 7, it can be observed that the disparity range within the region of interest is approximately [112, 144] (disparity range values are multiples of 16). When setting the disparity range, it is common to set the minimum value to 0 (Zhang et al., 1995). Therefore, in this study, the disparity range was set to [0 112], [0 128], [0 144], [0 160], [0 176], [0 192], [0 208], [0 224], [0 240], and [0 256], with a window size of 5 × 5 pixels. The optimal disparity range was determined by comparing the point cloud results under different range settings (see Figure 8).

FIGURE 7. Select disparity range.
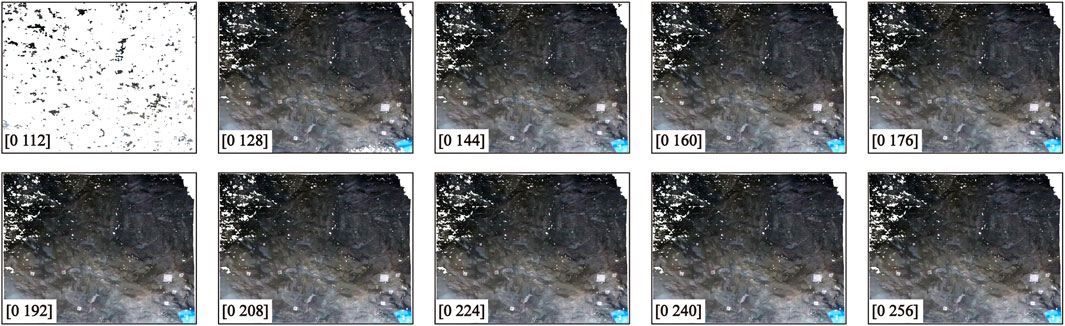
FIGURE 8. Point cloud images of the tunnel face under different disparity ranges.
The accuracy of discontinuity features extracted from a point cloud model is often a focal point of research attention. Point cloud density is one of the most intuitive factors affecting this accuracy (Chen et al., 2021). Furthermore, to investigate the rationality of parameter selection, this study compared the time consumption of the 3D reconstruction process under different parameter settings.
As observed in Figure 8, it is evident that when the maximum disparity value (
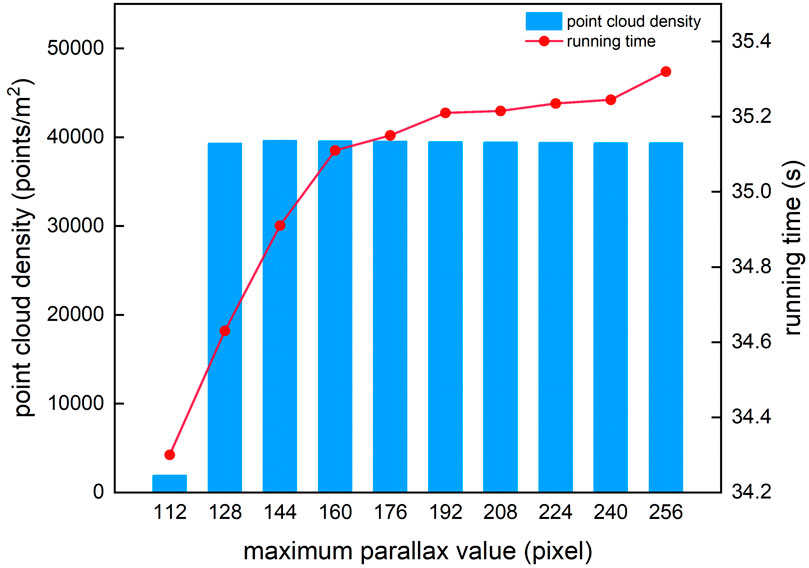
FIGURE 9. Point cloud density and running time under different parallax ranges.
Additionally, with a further increase in
In accordance with the optimal disparity range [0 144] derived in Section 4.2.3, this study investigates the influence of window size (5 × 5, 7 × 7, 9 × 9, 11 × 11, 13 × 13, 15 × 15, 17 × 17, 19 × 19, 21 × 21, and 23 × 23) on point cloud quality, point cloud density, and 3D reconstruction time under this parameter setting.
Figure 10 visually illustrates the quality of tunnel face point cloud reconstruction under different window sizes. It is evident that when the window size is between 5 × 5 and 11 × 11 pixels, a smaller window size results in a more fragmented point cloud within the red dashed line. This fragmentation is attributed to the presence of complex textures and shadows. When the window size is 15 × 15 pixels, the point cloud density reaches the maximum, which is 40357 points/m2, and the recognition accuracy reaches the highest level. However, as the window size increases from 19 × 19 to 23 × 23 pixels within the red dashed line, the point cloud becomes more fragmented, possibly due to over-smoothing. In terms of processing time, as observed in Figure 11, there is an overall decreasing trend in computation speed with the increase in window size, and the relationship with window size appears to be nonlinear. This phenomenon may be attributed to variations in memory consumption during different computation time intervals, leading to the irregularity in processing time. However, when the window size exceeds 21 × 21 pixels, there is a sudden decrease in processing time, contrary to expectations. This could be a result of the increased window size leading to higher smoothness, causing the loss of details in certain areas of the point cloud and, consequently, a reduction in the point cloud density in the point cloud (refer to Figure 10).
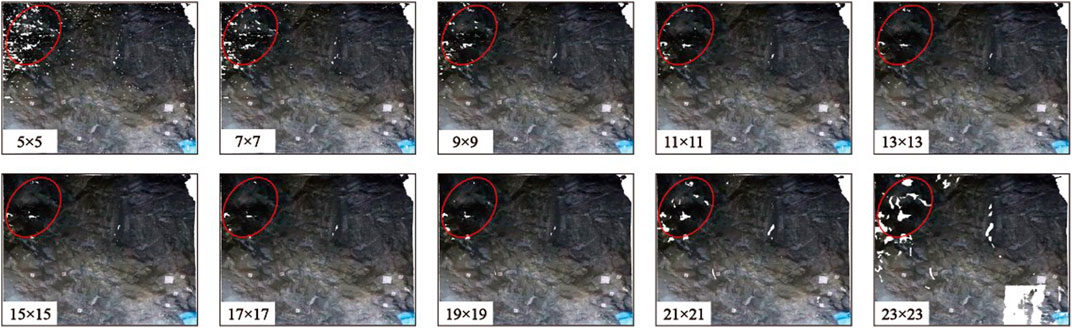
FIGURE 10. Point cloud images of the tunnel surface under different window sizes.
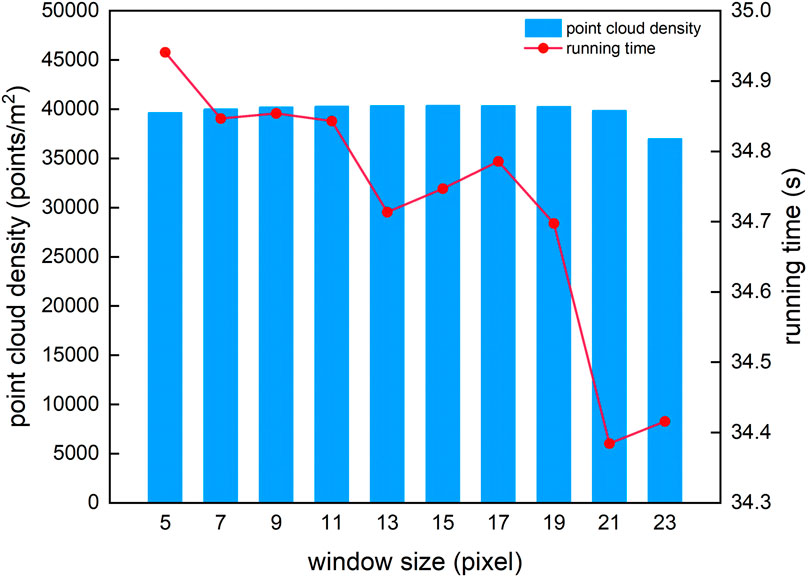
FIGURE 11. Point cloud density and running time under different window seizes.
Through experimental validation, it has been determined that the combination of a disparity range of [0 144] and a window size of 15 × 15 pixels represents the optimal parameter setting for the 3D reconstruction of tunnel face in this project. This holds significant importance for the automated collection of tunnel face information and can be directly applied to the intelligent data collection process of tunnel face information in similar scenarios. However, it should be noted that the selection of these parameters is influenced by other factors such as device parameters, lighting conditions, and size effects. Therefore, the optimal disparity range and window size may not be unique and could vary depending on different conditions. In conclusion, the parameter values optimized in this study are specific to the collection of tunnel face information in this project.
How to verify the accuracy of discontinuity extraction from 3D point cloud based on binocular stereo vision reconstruction is an extremely important issue. This study compares the tunnel face point cloud reconstructed by the SGM algorithm with the three-dimensional point cloud reconstructed by
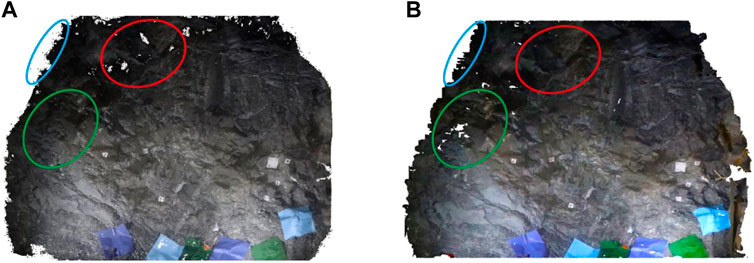
FIGURE 12. Point cloud quality comparison. Point cloud based on SFM reconstruction (A). Point cloud based on SGM reconstruction (B).
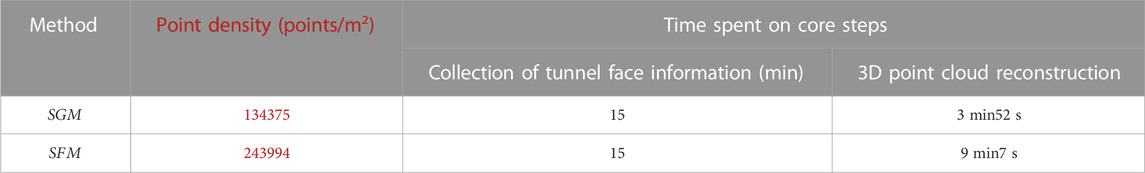
TABLE 2. Point cloud accuracy and core step time-consuming comparison.
Comparison from Figure 12 reveals that both algorithms exhibit varying degrees of point cloud loss due to the limited number of reconstructed images. Within the red solid line, Algorithm SFM shows noticeable gaps in the point cloud, while within the green solid line, it appears more complete. Conversely, Algorithm SGM demonstrates the opposite trend. This phenomenon can be attributed to the primary factor of missing data in the image collection from different angles. Analyzing the point cloud density in Table 2 and the region within the blue solid line in Figure 12, Algorithm SFM captures more point cloud information, providing better reconstruction along the edges of the rock surface. However, it comes at the cost of increased noise points. Algorithm SGM, on the other hand, demonstrates an advantage in smoothness and exhibits overall better reconstruction quality.
Regarding the time consumed for structural face recognition, the data collection process for tunnel rock surface information involved three graduate students and one on-site measurement personnel. The surveying instrument measurements of GCPs were conducted simultaneously with the binocular imaging. The total collection time for both methods depended on the measurement time of the surveying instrument, which is time-consuming. In terms of the time taken for three-dimensional point cloud reconstruction, Algorithm SGM required approximately 35 s for a single reconstruction (refer to Figure 9; Figure 11). Achieving high-precision point cloud quality took a total of 3 min and 52 s. This represents a 57.6% reduction in reconstruction time compared to Algorithm SFM, significantly enhancing the efficiency of the reconstruction process for practical engineering applications. It is important to note that the outlined procedures were carried out by experienced operators. With improved proficiency, there is potential for further reduction in application time for this technology.
(1) Firstly, a local coordinate system is established using the three-dimensional coordinates of the GCPs within the region of interest (as depicted in Figure 13A). In the coordinate transformation, only the coordinates of three GCPs are necessary for the conversion (Li et al., 2017). Considering the uncertainty in point cloud reconstruction, this study measured the coordinates of five GCPs with respect to a target board.
(2) Subsequently, the three-dimensional point cloud of the tunnel rock surface under the optimal parameter combination is fixed to the local coordinate system, resulting in the corrected three-dimensional point cloud.
(3) Following this, the discontinuity orientation intelligent extraction algorithm is applied to the corrected point cloud for intelligent recognition of discontinuities. This involves solving for the point cloud normals (refer to Figure 13B), yielding the clustered three-dimensional point cloud (refer to Figure 13C) and four sets of dominant structural planes (detailed orientations are presented in Figure 13C; Table 3). The algorithm required 3 min and 42 s to execute. Due to challenging on-site measurement conditions, the orientations of four representative discontinuities within the region of interest were manually measured, as illustrated in Figure 13A. To assess the applicability of the discontinuity orientation intelligent extraction algorithm, a comparison was made with the parameters of these four sets of discontinuities, as detailed in Table 3.
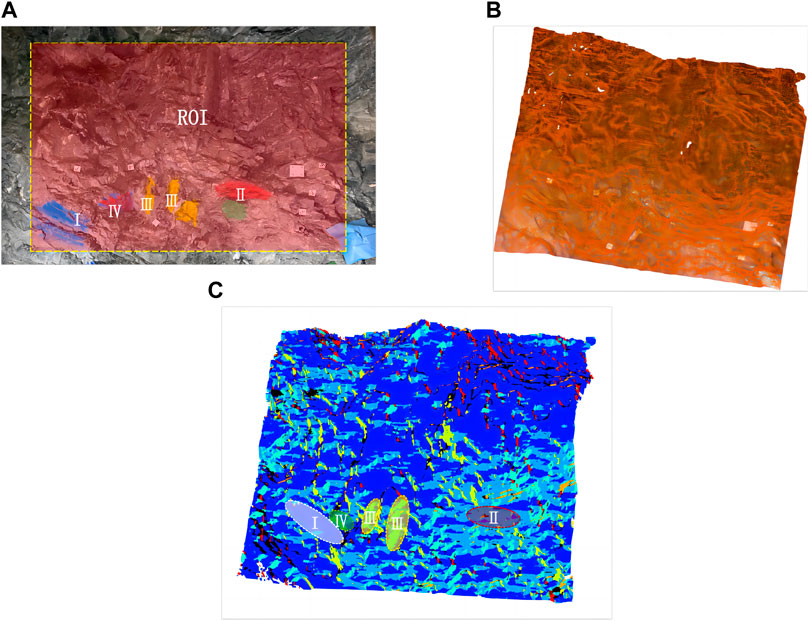
FIGURE 13. Discontinuities orientation extraction and grouping. The grouping of structural surfaces (A). The calculation of point cloud normal (B). Point cloud clustering (C).

TABLE 3. Comparison of discontinuities orientation.
In this study, the mechanical geological compass was employed to measure the dip and dip angle of discontinuities, serving as a benchmark for validating the intelligent recognition of discontinuity orientations. The measured dip and dip angle were used as the control group, while the discontinuity parameters extracted from the three-dimensional point cloud served as the experimental group. A comparative analysis was conducted to assess their accuracy. The results indicate that the algorithm exhibits a high degree of precision in dip angle identification, with an error range within ± 2°. However, in dip identification, the maximum error occurred in Group I, reaching up to 10°, and there was no apparent pattern in the errors among different groups. Two main factors contribute to these results: firstly, the application of binocular stereovision technology in the three-dimensional reconstruction process, where calibration errors, device parameter errors, and stereo matching errors can affect the accuracy of the point cloud (Hartley and Zisserman, 2003); secondly, inaccuracies in the magnetic needle readings during manual measurements contributed to the errors, with the latter being the dominant factor.
This study is anchored in the Yulin Diversion Tunnel Project (Tunnel #7), and it focuses on the non-contact acquisition of geological structural information of the tunnel face using binocular stereovision technology. Additionally, the three-dimensional reconstruction technique of the tunnel face rock mass point cloud was enhanced through the optimization of a semi-global stereo matching algorithm. Furthermore, an intelligent and efficient method for extracting structural information has been proposed. The main conclusions are as follows.
(1) Using binocular stereo vision technology, this study improved the single-camera parallel binocular setup by upgrading the sliding rail to achieve adjustable baseline length, adapting to different shooting ranges/rock sizes. Combining the semi-global stereo matching algorithm, it outlined the process of three-dimensional reconstruction of the rock face: device parameter selection, camera calibration, image acquisition, image preprocessing, stereo matching, and three-dimensional point cloud model generation. This allows the rock face information acquisition time to be controlled within 15 min, with a single three-dimensional reconstruction taking only 40 s. The discernible object accuracy is 2 mm, demonstrating the advantages of rapid acquisition and fine reconstruction. Therefore, it holds broad applicability for practical use.
(2) Based on the semi-global stereo matching principle, this study delved into the mechanisms affecting the disparity range and window size. The quality of the three-dimensional point cloud is significantly influenced by the disparity range and window size. The optimal reconstruction result is achieved when the disparity range is set to [0 144] and the window size is 15 × 15 pixels. Furthermore, the algorithm’s running speed is relatively unaffected by different disparity range and window size values. Different disparity ranges and window sizes have an impact on running speed of no more than 1s. Results from actual field applications show that using the optimized stereo matching algorithm for three-dimensional reconstruction yields excellent performance.
(3) On the foundation of the three-dimensional fine point cloud model, an intelligent extraction algorithm for discontinuity orientation based on k-nearest neighbor search and kernel density estimation is proposed. The obtained dip and dip angle values closely align with those measured by geological compass, validating the accuracy of the binocular three-dimensional reconstruction algorithm and the intelligent extraction algorithm for rock mass discontinuity orientation. This enables the systematic identification of rock mass structural information on tunnel rock faces.
The raw data supporting the conclusion of this article will be made available by the authors, without undue reservation.
MS: Writing–original draft. QM: Investigation, Resources, Writing–original draft. WY: Investigation, Resources, Writing–original draft. HL: Investigation, Resources, Writing–original draft. LR: Investigation, Resources, Writing–original draft. QY: Investigation, Resources, Writing–original draft. HW: Investigation, Resources, Software, Writing–original draft. YZ: Investigation, Resources, Writing–original draft. AL: Conceptualization, Writing–review and editing.
The author(s) declare financial support was received for the research, authorship, and/or publication of this article. The authors acknowledge the financial support provided by the Research Funds of Education Department of Shaanxi Provincial Government (No. 23JK0332), the Fundamental Research Funds for the Central Universities, CHD (No. 300102212207), the Research Funds of Department of Transport of Shaanxi Province (Nos 22-37K and 23-81X).
Authors MS, QM, WY, HL, and LR were employed by the China Construction Third Engineering Bureau Group Co., Ltd.
The remaining authors declare that the research was conducted in the absence of any commercial or financial relationships that could be construed as a potential conflict of interest.
All claims expressed in this article are solely those of the authors and do not necessarily represent those of their affiliated organizations, or those of the publisher, the editors and the reviewers. Any product that may be evaluated in this article, or claim that may be made by its manufacturer, is not guaranteed or endorsed by the publisher.
Battulwar, R., Zare-Naghadehi, M., Emami, E., and Sattarvand, J. (2021). A state-of-the-art review of automated extraction of rock mass discontinuity characteristics using three-dimensional surface models. J. Rock Mech. Geotechnical Eng. 13 (4), 920–936. doi:10.1016/j.jrmge.2021.01.008
Bradski, G., and Kaehler, A. (2008). Learning OpenCV: computer vision with the OpenCV library. O'Reilly Media, Inc.
Chen, J., Huang, H., Zhou, M., and Chaiyasarn, K. (2021). Towards semi-automatic discontinuity characterization in rock tunnel faces using 3D point clouds. Eng. Geol. 291, 106232. doi:10.1016/j.enggeo.2021.106232
Chen, J., Li, X., and Zhu, H. (2017). Automatic extract of rock mass spacing and roughness based on point clouds. Chin. J. Undergr. Space Eng. 13 (1), 133–140.
Ernst, I., and Hirschmüller, H. (2008). “Mutual information based semi-global stereo matching on the GPU,” in International symposium on visual computing (Berlin, Heidelberg: Springer Berlin Heidelberg), 228–239.
Friedman, J. H., Bentley, J. L., and Finkel, R. A. (1977). An algorithm for finding best matches in logarithmic expected time. ACM Trans. Math. Softw. (TOMS) 3 (3), 209–226. doi:10.1145/355744.355745
García-Luna, R., Senent, S., Jurado-Piña, R., and Jimenez, R. (2019). Structure from Motion photogrammetry to characterize underground rock masses: experiences from two real tunnels. Tunn. Undergr. Space Technol. 83, 262–273. doi:10.1016/j.tust.2018.09.026
Ge, Y. F., Xia, D., Tang, H. M., Zhao, B. B., Wang, L. Q., and Chen, Y. (2017). Intelligent identification and extraction of geometric properties of rock discontinuities based on terrestrial laser scanning. Chin. J. Rock Mech. Eng. 36 (12), 3050–3061.
Gigli, G., and Casagli, N. (2011). Semi-automatic extraction of rock mass structural data from high resolution LIDAR point clouds. Int. J. Rock Mech. Min. Sci. 48 (2), 187–198. doi:10.1016/j.ijrmms.2010.11.009
Hartigan, J. A., and Wong, M. A. (1979). Algorithm AS 136: a k-means clustering algorithm. J. R. Stat. Soc. Ser. c Appl. statistics) 28 (1), 100–108. doi:10.2307/2346830
Hartley, R., and Zisserman, A. (2003). Multiple view geometry in computer vision. Cambridge University Press.
Hirschmuller, H. (2005). “Accurate and efficient stereo processing by semi-global matching and mutual information,” in 2005 IEEE Computer Society Conference on Computer Vision and Pattern Recognition (CVPR'05) (IEEE), 807–814.
Kim, D. H., Poropat, G., Gratchev, I., and Balasubramaniam, A. (2016). Assessment of the accuracy of close distance photogrammetric JRC data. Rock Mech. Rock Eng. 49, 4285–4301. doi:10.1007/s00603-016-1042-9
Lai, X. B. (2010). Research on some key theoretical issues for robotic binocular stereo vision and its techniques implementation[D]. Zhejiang University.
Li, S. C., Liu, H. L., Li, L. P., Shi, S. S., Zhang, Q. Q., Sun, S. Q., et al. (2017). A quantitative method for rock structure at working faces of tunnels based on digital images and its application. Chin. J. Rock Mech. Eng. 36 (1), 1–9.
Li, X., Chen, Z., Chen, J., and Zhu, H. (2019). Automatic characterization of rock mass discontinuities using 3D point clouds. Eng. Geol. 259, 105131. doi:10.1016/j.enggeo.2019.05.008
Riquelme, A. J., Abellán, A., Tomás, R., and Jaboyedoff, M. (2014). A new approach for semi-automatic rock mass joints recognition from 3D point clouds. Comput. Geosciences 68, 38–52. doi:10.1016/j.cageo.2014.03.014
Singh, S. K., Banerjee, B. P., Lato, M. J., Sammut, C., and Raval, S. (2022). Automated rock mass discontinuity set characterisation using amplitude and phase decomposition of point cloud data. Int. J. Rock Mech. Min. Sci. 152, 105072. doi:10.1016/j.ijrmms.2022.105072
Spangenberg, R., Langner, T., and Rojas, R. (2013). “Weighted semi-global matching and center-symmetric census transform for robust driver assistance,” in Proceedings, Part II Computer Analysis of Images and Patterns: 15th International Conference, York, UK, August 27-29, 2013 (Springer Berlin Heidelberg), 34–41. CAIP 2013.15
Sturzenegger, M., and Stead, D. (2009). Close-range terrestrial digital photogrammetry and terrestrial laser scanning for discontinuity characterization on rock cuts. Eng. Geol. 106 (3-4), 163–182. doi:10.1016/j.enggeo.2009.03.004
Terrell, G. R., and Scott, D. W. (1992). Variable kernel density estimation. Ann. Statistics 20, 1236–1265. doi:10.1214/aos/1176348768
Wang, P. T., Qin, T., Huang, Z. J., Ren, F., and Cai, M. (2021). Fast identification of geometric properties of rock discontinuities based on 3D point cloud. Chin. J. Rock Mech. Eng. 40 (3), 503–519.
Wei, Z. Y., Arrowsmith, R., He, H. L., and Gao, W. (2015). Accuracy analysis of terrain point cloud acquired by “structure from motion” using aerial photos. Seismol. Geol. 37 (2), 636–648.
Xie, Y., Zeng, S., and Chen, L. (2014). “A novel disparity refinement method based on semi-global matching algorithm,” in 2014 IEEE International Conference on Data Mining Workshop (IEEE), 1135–1142.
Xu, D., Feng, X. T., Li, S. J., Wu, S. Y., and Gao, Y. H. (2017). Research on key information extraction of rock mass deformation and failure characteristics in jinping underground laboratory based on 3d laser scanning technique. Rock Soil Mech. 38, 488–495.
Xu, Z., Ma, W., Li, S. C., Lin, P., Liang, F., Xu, G. L., et al. (2022). Lithology identification: method, research status and intelligent development trend[J]. Geol. Rev., 68(06):2290–2304.
Xu, Z., Ma, W., Lin, P., Shi, H., Liu, T., and Pan, D. (2021b). Intelligent lithology identification based on transfer learning of rock images. J. Basic Sci. Eng. 29 (5), 1075–1092.
Xu, Z., Shao, R., Lin, P., Li, S. C., Xiang, H., Han, T., et al. (2023). Adverse geology identification in tunnel: method, research status and intelligent development direction[J/OL]. Acta Geosci. Sin., 1–21.
Xu, Z., Shi, H., Lin, P., and Liu, T. (2021a). Integrated lithology identification based on images and elemental data from rocks. J. Petroleum Sci. Eng. 205, 108853. doi:10.1016/j.petrol.2021.108853
Yu, X. Y., Liu, F., Xu, Y., and Zhu, H. (2023). Point cloud identification of joints in tunnel faces and its implementation in a microservice. Chin. J. Undergr. Space Eng. 19 (02), 586–593.
Zabih, R., and Woodfill, J. (1994). “Non-parametric local transforms for computing visual correspondence,” in Computer Vision—ECCV'94: Third European Conference on Computer Vision Stockholm, Sweden, May 2–6 1994 Proceedings (Springer Berlin Heidelberg), 151–158.
Zhang, P., Du, K., Tannant, D. D., Zhu, H., and Zheng, W. (2018). Automated method for extracting and analysing the rock discontinuities from point clouds based on digital surface model of rock mass. Eng. Geol. 239, 109–118. doi:10.1016/j.enggeo.2018.03.020
Zhang, P. X., Li, X. Z., Zhang, Y. S., Yu, J., Xu, Z. H., Huang, Z., et al. (2022). Three-dimensional model construction and application of fault trenching based on photogrammetry[J]. J. Basic Sci. Eng., 30(05): 1161–1176.
Zhang, Y. H., Li, L. P., Liu, H. L., Yang, W. M., and Shi, S. S. (2016). Digital identification of evaluation of tunnel surrounding rocks discontinuity. Tunn. Constr. 36 (12), 1471–1477.
Zhang, Z., Deriche, R., Faugeras, O., and Luong, Q. T. (1995). A robust technique for matching two uncalibrated images through the recovery of the unknown epipolar geometry. Artif. Intell. 78 (1-2), 87–119. doi:10.1016/0004-3702(95)00022-4
Zhou, M. L., Cheng, W., Zhang, D. M., and Huang, H. W. (2021). Automated 3D inspection and visualization of structural defects in shield tunnel linings[J]. J. Basic Sci. Eng., 29(05):1265–1279.1
Keywords: tunnel engineering, binocular stereo vision, rock mass discontinuity, three-dimensional reconstruction, intelligent extraction, discontinuities orientation
Citation: Song M, Ma Q, Yan W, Lv H, Ren L, Yang Q, Wang H, Zhao Y and Li A (2024) Three-dimensional reconstruction optimization of tunnel face and intelligent extraction of discontinuity orientation based on binocular stereo vision. Front. Earth Sci. 11:1314378. doi: 10.3389/feart.2023.1314378
Received: 10 October 2023; Accepted: 21 November 2023;
Published: 03 January 2024.
Edited by:
Yongqiang Zhou, Institute of Rock and Soil Mechanics (CAS), ChinaReviewed by:
Shanchao Hu, Shandong University of Science and Technology, ChinaCopyright © 2024 Song, Ma, Yan, Lv, Ren, Yang, Wang, Zhao and Li. This is an open-access article distributed under the terms of the Creative Commons Attribution License (CC BY). The use, distribution or reproduction in other forums is permitted, provided the original author(s) and the copyright owner(s) are credited and that the original publication in this journal is cited, in accordance with accepted academic practice. No use, distribution or reproduction is permitted which does not comply with these terms.
*Correspondence: Ang Li, YW5nbGlfNjEzQGNoZC5lZHUuY24=
Disclaimer: All claims expressed in this article are solely those of the authors and do not necessarily represent those of their affiliated organizations, or those of the publisher, the editors and the reviewers. Any product that may be evaluated in this article or claim that may be made by its manufacturer is not guaranteed or endorsed by the publisher.
Research integrity at Frontiers
Learn more about the work of our research integrity team to safeguard the quality of each article we publish.