 Di Ning1
 Qingshan Ma
94% of researchers rate our articles as excellent or good
Learn more about the work of our research integrity team to safeguard the quality of each article we publish.
Find out more
ORIGINAL RESEARCH article
Front. Earth Sci., 27 December 2023
Sec. Geoinformatics
Volume 11 - 2023 | https://doi.org/10.3389/feart.2023.1312326
This article is part of the Research TopicSpatial Modelling and Failure Analysis of Natural and Engineering Disasters through Data-Based Methods,volume IIIView all 18 articles
Conducting quantitative research on the microstructure of soft clay can reveal the essence of its soil mechanical behavior, which is of important practical significance for geological disaster risk assessment and prevention. To quantitatively investigate the microscopic properties of natural structured clay, soft clay soils from various sedimentary environments in the Hangzhou Estuarine Bay area were chosen as the research subject in this study. Subsequently, a comprehensive investigation into the microstructure of clay was conducted, involving X-ray phase analysis and SEM imaging analysis. The results revealed the following: (1) In comparison to the deep clay deposited in fluvial-lacustrine environments, the shallow mucky clay in marine sediments had a higher clay mineral content, accounting for 48%. Illite makes up the majority of it, with minor levels of kaolinite and montmorillonite being present. (2) The shallow mucky clay in the Hangzhou Estuarine Bay area had a typical agglomerate-flocculated structure. In contrast, the deeper clay showed a flocculated structure with less uniform particle sizes, strong stacking randomness, poor directional alignment of soil pores, and tends to form arrangements where edges are adjacent to faces or edges are adjacent to other edges. (3) Compared to the deep clay deposited in fluvial-lacustrine environments, the marine-deposited shallow mucky clay displayed orderly pore arrangements, strong directional alignment, significant pore shape variability, and minimal pore size changes between adjacent pores. The microstructure of soil plays a crucial role in determining the physical, mechanical, and other engineering properties of the soil. This study provides insightful information about the relationship between clay microstructure and geotechnical characteristics in Hangzhou and the surrounding areas.
Soft soil strata are widely distributed in the Yangtze River Delta region, which is represented by Hangzhou and Shanghai, and range in thickness from a few meters to several tens of meters. These soil layers are characterized by complexity, high moisture content, low strength, poor permeability, and high compressibility. In recent years, due to the sustained rapid economic growth in the Yangtze River Delta area, a large number of infrastructure projects, including highways, railways, bridges, airports, and more, need to be built on such soft soil foundations. In the construction process, issues related to low soil strength and excessive deformation of soft soils often lead to significant engineering problems such as ground settlement and instability (Ma et al., 2012; Shen et al., 2017; Xu et al., 2018; Chen et al., 2019; Yong et al., 2022). Numerous study results have indicated that the characteristics and distribution of pores within the soil mass are intrinsic factors that influence the changes in soil microstructure. And they also play a primary role in determining the physical and mechanical properties of the soil (Schmitz et al., 2005; Jiang et al., 2017; Gu et al., 2018; Huang et al., 2020; Huang et al., 2023). In these studies, various methods, including geotechnical tests, MIP, SEM, XRD and others, were employed to reveal how soil structure impacts its macroscopic mechanical properties. Characterization of soil microstructure makes great benefits to the improved understanding of overall soil behaviors (Sivakumar et al., 2002; Liu et al., 2011).
Due to the uneven particle size massive quantity, and irregular distribution of pore spaces within soil, traditional geometric analysis methods have encountered significant limitations in exploring the microstructure of soils. Early research on soil microstructure was primarily qualitative in nature. However, in recent years, the increasing richness of observation methods and the continuous development of computer science have provided a solid foundation for quantitative research on soil microstructure. This has collectively driven the quantitative study of soil microstructures (Tovey and Krinsley, 1992; Smart and Leng, 1993; Tovey et al., 1995; Dathe et al., 2001; Rouse et al., 2008; Calero and Delgado, 2009; Ahmed, 2015; Latifi et al., 2016). Shi et al. (1995) explored a simple quantitative analysis method for the microstructure of cohesive soils based on the fundamental principles of computer image processing. Bai and Zhou. (2001) provided a comprehensive overview of the advances in scanning electron microscopy (SEM) testing technology in geotechnical engineering, covering aspects like sample preparation and testing methods, dynamic monitoring of microstructural changes, and quantitative analysis techniques of SEM. Yang and Gong (2010) conducted analyses on the components of particles and aggregates, pore size distribution, microstructure, and pore solution and cation exchange properties of Shanghai soft clay. He discussed the possible impacts of pore size changes and artificial recharge on soil properties before and after consolidation. Xu et al. (2015) conducted SEM image scanning on soft clays in the Hangzhou area. They established a three-dimensional pore calculation model and analyzed the impact of factors such as magnification, calculation step size, and threshold size on the calculation results of three dimensional pore volume using Image-pro plus software. Tang et al. (2020) developed an analysis program called SMAS based on digital image processing technology. It enables the quantitative determination of various geometric and morphological indicators of soil particles/pores at the microscale. The program improves the reliability of quantitatively characterizing soil microstructures based on SEM images.
Despite a series of breakthroughs achieved by scholars both domestically and internationally in the quantitative study of soil structure, the diversity of cohesive soils, variations in their physical properties, and the inherent complexity of their true internal structures pose significant challenges. These challenges are further compounded by limitations in measurement techniques and the lack of unified standards for describing microstructures. Consequently, a systematic quantitative analysis of the microstructure of cohesive soils remains a formidable task. Given these challenges, this study focuses on the soft clay soils in the Hangzhou Estuarine Bay area. It aims to investigate the microstructure of clay from two perspectives: X-ray-based phase analysis and SEM-based imaging analysis. The study reveals the essence of its soil mechanical behavior and provides insights into the relationship between the microstructure of clay and its geotechnical properties, which has important practical significance for geological disaster risk assessment and prevention in Hangzhou and the surrounding areas.
Hangzhou is situated in the southern edge of the Yangtze River Delta coastal plain. Influenced by dramatic climate changes, fluctuations in sea levels, and tectonic movements since the Quaternary period, the region’s Quaternary sediments have undergone several cycles of deposition and erosion. As a result, complex sedimentary strata that interact with both terrestrial and marine environments have formed (Li and Wang, 1998; Wang et al., 2014). All things considered, these layers show traits like intricate lithological changes, notable thickness fluctuations, vertical alternations between hard and soft soil layers, and the existence of numerous layers in the vertical sequence.
The sample borehole, GX01, is located in the Hangzhou Estuarine Bay area, with a total Quaternary sediment thickness of approximately 69.5 m. Lithological analysis of the strata indicates the presence of two soft clay layers within this borehole. Between 9.6 and 34.1 m below the surface, there is a layer of soft clay that is mostly made up of marine sedimentary elements like mucky silty clay and mucky clay. The second soft clay layer is found between depths of 55.8 and 58.4 m, which is composed of deposits of soft, pliable clay that were formed in a fluvial-lacustrine environment. As representative specimens for further research, samples were taken from the first layer of mucky clay (Sample 1, abbreviated as SP1) and the second layer of soft clay (Sample 2, abbreviated as SP2) (Figure 1). The basic physical and mechanics parameters of samples are shown in Table 1.
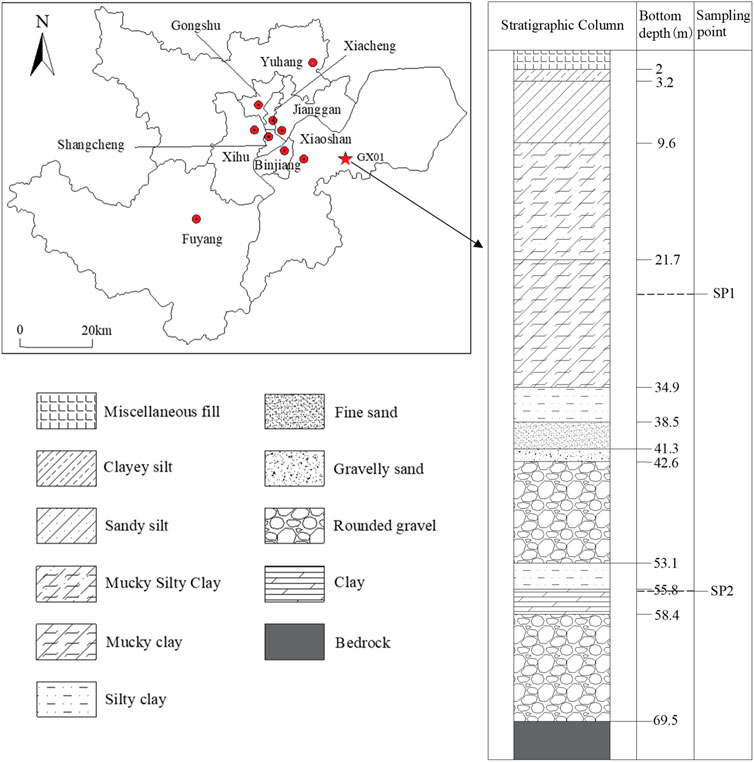
FIGURE 1. Sampling hole location, stratigraphic column and sampling point in the study area.
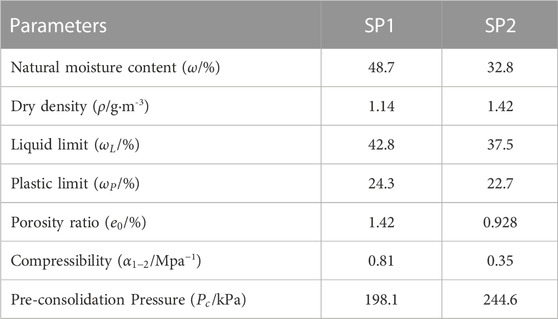
TABLE 1. Physical and mechanics parameters of samples.
The undisturbed soil samples were preserved by tightly sealing them with plastic wrap to prevent exposure to sunlight and rain during storage. Efforts were made to minimize moisture loss from the soil. During transportation, the soil samples were secured and cushioned with materials like bubble wrap and sponge to prevent vibrations and maintain the soil samples in their original state. The dimensions of the collected soil samples were 300 mm in height and 89 mm in diameter. The photos of the collected samples are presented in Figure 2.
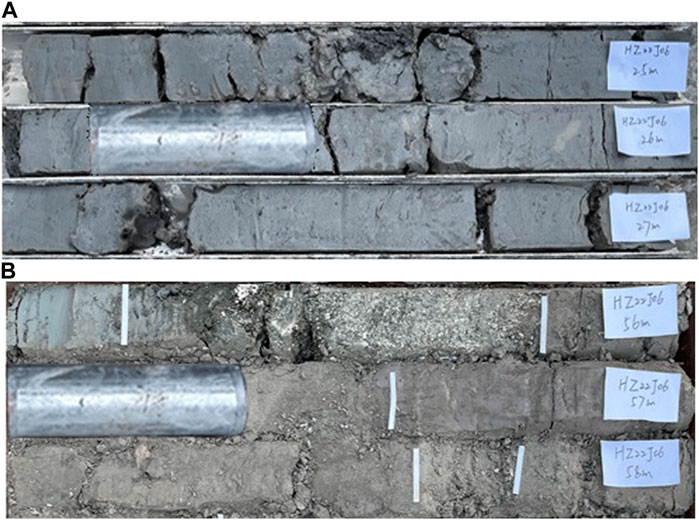
FIGURE 2. The photos of the collected samples: (A) mucky clay (SP 1); (B) clay (SP 2).
The clay minerals present in the clay samples were identified using the X-ray power diffraction (XRD) method. X-ray diffraction method is suitable for identifying and quantifying the clay minerals present in soils. It is a rapid analytical technique primarily used for phase identification of a crystalline material. It is also based on constructive interference of X-rays and a crystalline sample. The analysis was conducted using a GBC Enhanced Mini Material Analyzer (EMMA) X-ray diffractometer equipped with Cu-Kα radiation source and operated at 40 kV and 100 mA. The representative clay samples were step-scanned from 2.5°–65° at scan speed of 0.02° 2θ/s. The interpretation of the diffractograms of clay samples was based on the comparison of the peaks obtained with those of the standard minerals established by Ademila and Adebanjo. (2017).
SEM analysis was performed to investigate the morphology of undisturbed red clay using an electron microscope scanner Phenom pro-x. The test soil sample was cut into small pieces (1 cm3) with a thin steel wire with a 0.5 mm deep groove cut in the middle of the sample, then freeze-dried for 24 h. The observed surface was a horizontal profile of soil samples, with samples cut along the direction of soil deposition. Before scanning, the soil sample was gently forced apart from the groove position, and a relatively flat and fresh section selected for testing. The broken soil sample was sprayed with gold to improve conductivity, then placed in the specimen holder and SEM images were collected at different magnifications using a secondary electronic SE probe and backscatter BSE detector (Zhang et al., 2020).
Soil is an open system made up of numerous elements and mineral particles of varied sizes, the majority of which are solid. Minerals can be categorized as either primary or secondary minerals based on their origin and composition. Primary minerals are those that, despite weathering, retain their initial chemical composition. These minerals are the byproducts of the parent rock’s weathering that were left behind. On the other hand, secondary minerals are those that are subjected to further chemical weathering both during the weathering of the parent rock and during the transit operations. The original minerals eventually disintegrate due to chemical weathering processes such as oxidation, hydrolysis, hydration, and dissolution. As a result, new minerals are formed, and the particle size may become finer. Generally speaking, the minerals in the coarse fractions are mainly primary minerals (such as feldspar, calcite, muscovite, etc.), and in the fine fractions they are mainly clay minerals (such as kaolinite, montmorillonite, etc.) (Ruehlmann and Korschens, 2020).
X-ray diffraction (XRD) is used for semi-quantitative investigation and assessment of mineral components. The principle is as follows: When X-rays pass through clay minerals with different surface structures, they exhibit diffraction patterns that vary with the type of clay, each displaying distinctive characteristics. By recording these diffraction patterns, mineral components can be determined based on the patterns. The mineral content is positively correlated with the intensity of the diffraction (Kahle et al., 2002; Zhou et al., 2018). The spectra and main diagnostic peaks used for their identification are shown in the respective figures. The names of the minerals, their chemical formula, d-space, counts, relative intensity, and glancing angle are given in Table 2.
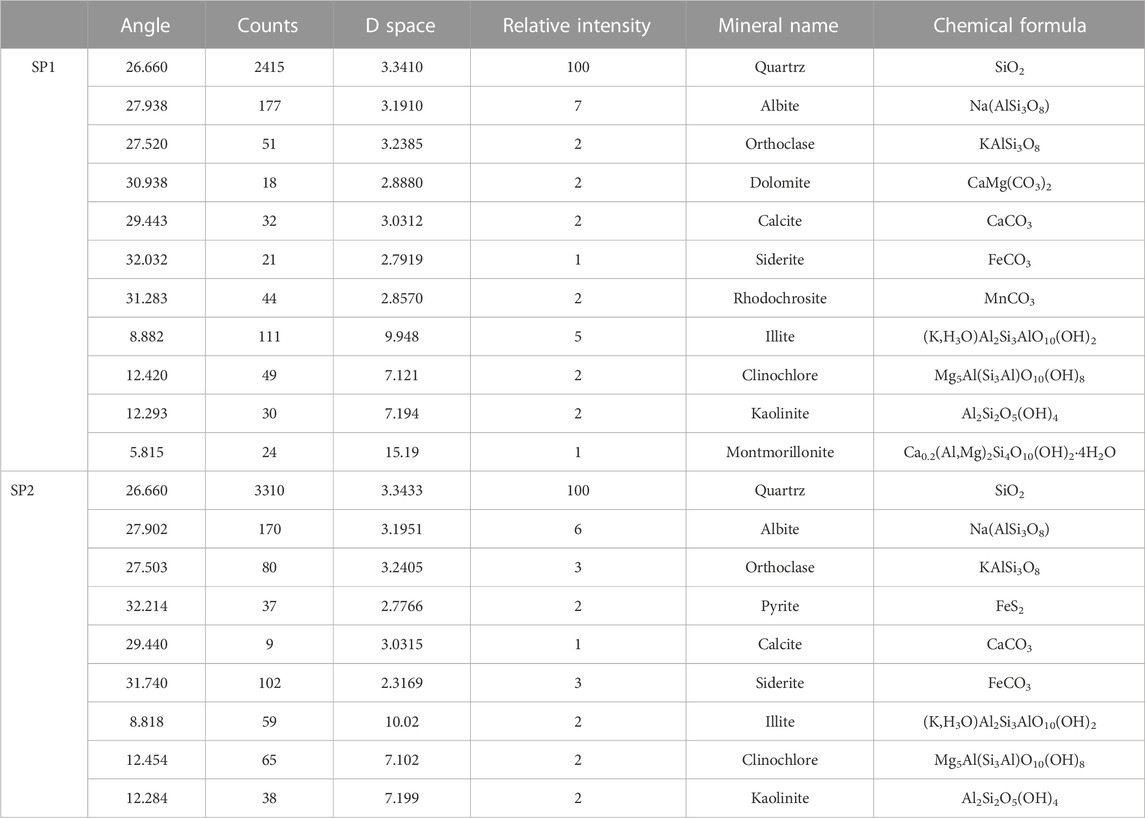
TABLE 2. Structural parameters of SP 1 and SP 2.
X-ray powder diffraction analysis for SP 1 and SP 2 detected dominantly the presence of quartz (SiO2) and albite (Na (AlSi3O8)) (Figure 3). For SP1, the occurrence of montmorillonite in the sample is attributed to a swelling clay group with high plasticity which is a characteristic of Ball clays. Swelling clays such as vermiculites and montmorillonites are formed in areas of poor drainage and alkali conditions (Moore and Reynolds, 1989).
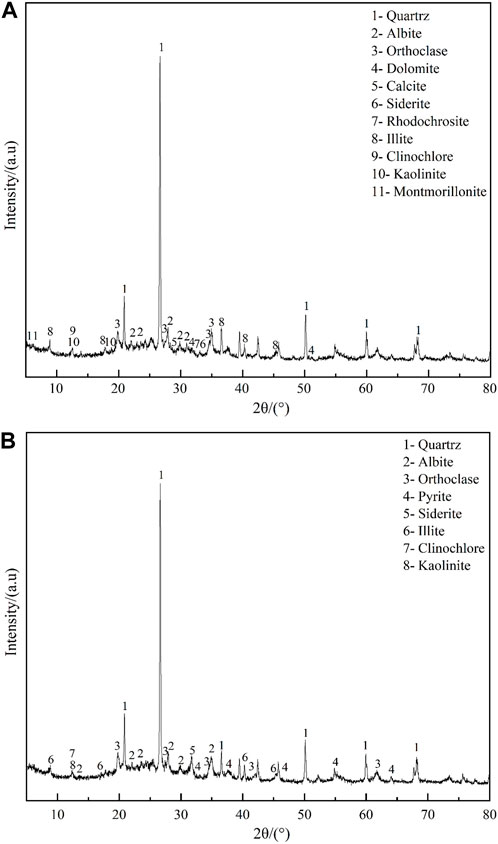
FIGURE 3. XRD diffractogram of representative samples: (A) mucky clay (SP 1); (B) clay (SP 2).
The results of mineral analysis are shown in Figure 4. It can be seen in Figure 4A, the content of primary minerals in both samples of mucky clay and clay (over 52%) is higher than that of secondary clay minerals (over 40%). Among these, quartz is a representative primary mineral, dominating with a content exceeding 25%, while the content of other primary minerals generally remains below 10%. Typically, primary mineral particles are coarser, and their size distribution falls mainly within the sand and silt fractions. Secondary minerals, represented by clay minerals, belong to the clay-size category (Figure 4B) (Tang and Sun, 1987). In the clay sample, the content of primary minerals is slightly higher, with quartz being the primary constituent, while the clay mineral content is relatively lower, and the particle size is larger. The content of quartz and clay minerals is 37% and 40%, respectively. In mucky clay, the content of quartz among primary minerals is 25%, while the content of clay minerals significantly increases, reaching up to 48%. Secondary clay minerals in both cases have relatively finer particles (Figure 4C), with Illite being the dominant mineral, constituting more than 50% of the content (60% in mucky clay). No montmorillonite is observed in the secondary clay minerals of clay samples, while mucky clay’s secondary clay minerals contain small amounts of montmorillonite, kaolinite, and clinochlore. The widespread deposition of clinochlore also indicates a marine depositional environment.
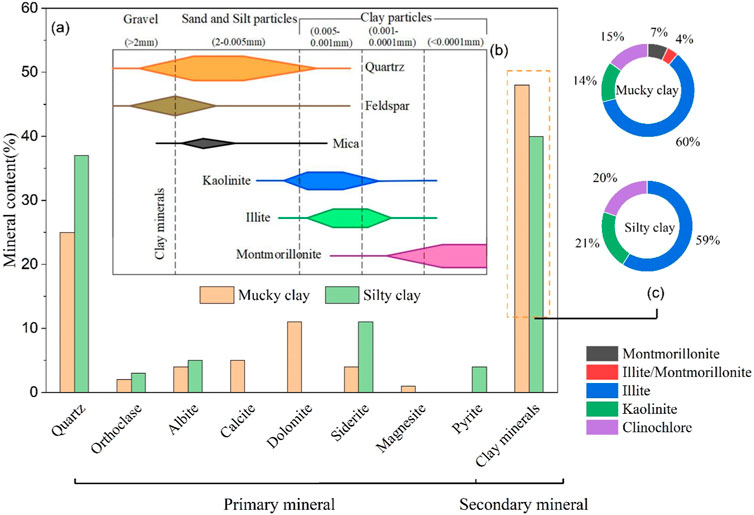
FIGURE 4. Soil mineral analysis: (A) relative mineral composition of the entire soil; (B) correspondence between major minerals and particle sizes from Tang and Sun. (1987); (C) relative content of clay minerals.
Quantitative analysis of microstructures involves the study of structural units and pores, utilizing statistical methods, nonlinear theories, and computer technology to extract quantitative data from SEM images for the analysis and evaluation of the morphology, orientation, and pore characteristics of structural units (Chen et al., 2019). In this study, the PCAS image recognition and analysis system was employed to separate structural units and pores based on the grayscale differences observed in SEM images. This approach provides quantitative data that can mechanistically explain the macroscopic geological characteristics of the soil.
Figure 5 displays SEM images of representative soil layers in the study area. From Figure 5A, it can be observed that particles are clustered together to form aggregates or agglomerates, and the microstructure of the shallow layer mucky clay exhibits a typical floccule aggregate structure. In contrast to single grain or honeycomb structures, the arrangement is more complex, and there are no distinct boundaries between aggregates. The soil particles are fine, making it difficult to distinguish individual grains, and there is a lower content of larger particles. The pore distribution is uneven and lacks apparent orientation, with the presence of larger pore channels that promote soil connectivity. With increasing depth, deep clay undergoes fragmentation and reorganization of its soil structure due to self-weight stress and soil interactions, resulting in the formation of smaller particle units. The stacking arrangement of these micro units becomes highly random, exhibiting limited directional alignment and low overall orderliness. Numerous occurrences of “edge-face” overlap between the frames are observed, with the prevailing microstructure being a classic flocculated (frame) structure (Figure 5B).
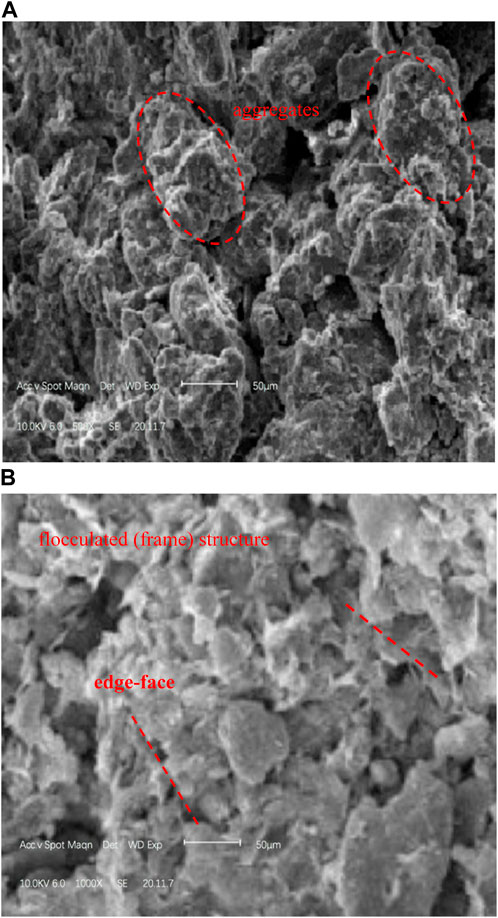
FIGURE 5. SEM images of representative soil samples: (A) mucky clay and (B) clay.
The PCAS micro-quantitative testing technique was utilized for pore quantification analysis using SEM images at a 1000× magnification. This analysis involves two main steps: binarization processing to identify pores and particles, followed by vectorization processing. The extraction of microstructural parameters is illustrated in Figure 6.

FIGURE 6. The process of the extraction and analysis of the microstructural parameters (the above is mucky clay and clay below): (A) image preprocessing; (B) threshold segmentation; (C) morphologic.
The extracted pore parameters of SP1 and SP2 are shown in Table 3. It includes basic microstructural parameters such as average region area, average perimeter, along with quantitative parameters like pore fractal dimension, probability entropy, average shape factor, and fractal dimension. The parameters of probability entropy, probability distribution index and fractal dimension describe the direction, area distribution and shape factor change of pore system. In terms of the soil pore shape, which is represented by the average shape factor, also called roundness, the parameter ranged from 0 to 1. As the shape factor increased, the particle or pore gets closer to a circle. Conversely, with the decrease in the average shape factor, the pore shape becomes longer and narrower, thus the arrangement and combination of pores become more complex.
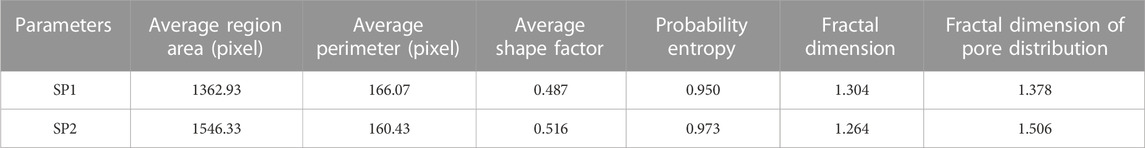
TABLE 3. Pore parameters of SP1 (shallow mucky clay) and SP2 (deep clay).
The directional frequency is a parameter that can reflect the directional arrangement of structural units. With a directional angular density of
Figure 7 presents the statistical results of the orientation frequency of representative sample structural unit. The figure shows that there were little differences in the hydrodynamic circumstances during deposition for both mucky clay and clay, both of which were deposited in quiescent aquatic conditions. Therefore, the arrangement of particles in both cases lacks pronounced orientation, and the peaks in the orientation frequency are not prominent. In the case of clay, the arrangement of structural units is relatively scattered, with only a small portion of structural units having orientation angles falling within the range of 75° ± 5°. Conversely, in the case of mucky clay, the majority of structural units exhibit orientation angles within four groups: 35° ± 5°, 75° ± 5°, 95° ± 5°, and 125° ± 5°, demonstrating better orientation. This may be explained by the fact that mucky clay’s smaller particles are more susceptible to being disturbed by water flow during deposition, which makes it simpler for them to form multi-oriented structural units rather than a disorganized arrangement of particles.
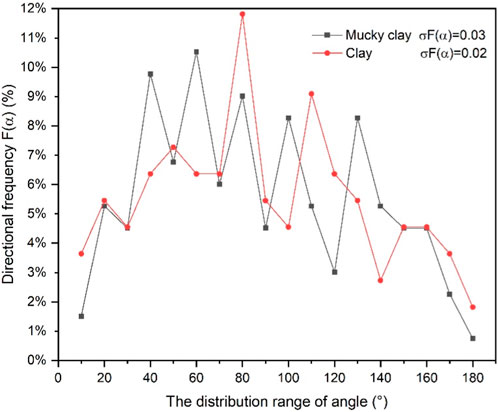
FIGURE 7. The statistical results of the directional frequency of structural units in shallow mucky clay and deep clay.
From the perspective of probability entropy, both mucky clay and clay demonstrate probabilities close to 1, suggesting disordered and low regularity in pore arrangements. Moreover, the probability entropy of mucky clay, at 0.95, is slightly lower than that of clay, which is 0.973. This indicates that the pore arrangement in mucky clay exhibits relatively better orderliness.
The shape factor (F) is a parameter used to quantify the complexity of the shape of structural units. The individual pore’s shape factor has a significant margin of error, so the average shape factor is employed to statistically analyze pore shape characteristics. F values range from 0 to 1, with higher values indicating more rounded pore shapes, while lower values suggest more elongated shapes. As shown in the Table 3, the average shape factor for mucky clay is 0.487, while for clay, it is 0.516. This suggests that, compared to clay, mucky clay has elongated pore shapes and slightly more complex structural unit shapes. This is because, as the clay content increases, the combination and connectivity with coarse particles become more diverse. Simultaneously, the bonding effect on coarse particles is enhanced, resulting in rougher particle surfaces and an increase in pore complexity.
The pore distribution fractal dimension is a metric proposed to address the uneven distribution of pores in porous media profiles, and these fractal dimensions reflect the static structural parameters of porous media. The analysis process involves calculating the equivalent area (A) and perimeter (P) of each pore and plotting this data on a double-logarithmic coordinate system (lgP∼lgA). If the data points can be fitted into a straight line, it indicates that the morphology of pores in the microstructure is fractal, and the double of the slope of this line represents the fractal dimension of pore morphology.
The linear fit lines of the lgP∼lgA double-logarithmic points for the samples are shown in Figure 8. It can be observed that the lgP∼lgA relationships for the samples are either completely or nearly linear, with absolute values of the fitting coefficient R exceeding 0.97 for all cases. The fractal dimensions of pore structures for the mucky clay and clay are 1.304 and 1.264, respectively. Comparatively, the mucky clay, with its lower content of primary minerals and the ability of clay particles to disperse as well as aggregate to varying degrees, exhibits more complex microstructural changes as the clay content increases. This complexity is characterized by the presence of both aggregation and flocculation, leading to a greater degree of non-uniformity in pore morphology.
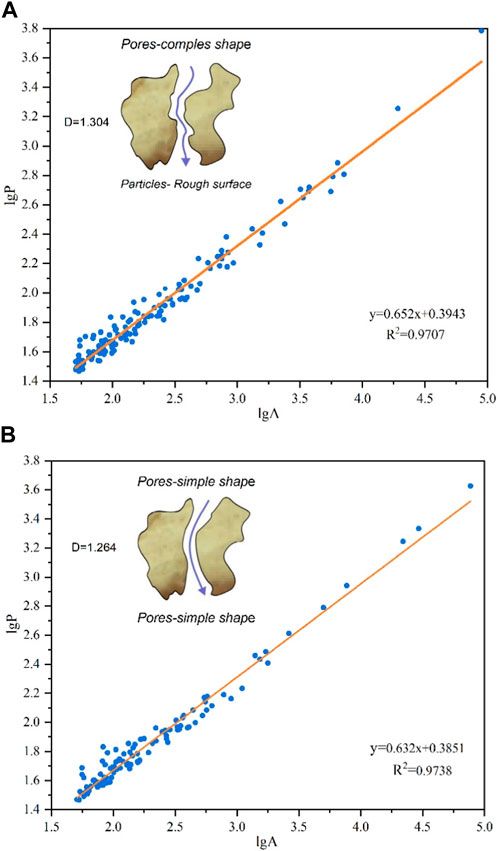
FIGURE 8. Fitting diagram of lgP ∼ lgA curve of samples: (A) shallow mucky clay; (B) deep clay.
The pore size distribution characteristics are depicted in Figure 9. It can be observed that both shallow mucky clay and deep clay exhibit large and very large pore features, with pore diameters primarily concentrated within the 30 µm range. Specifically, the pore content of mucky clay and clay within the pore diameter range of (10 µm–15 µm) is 37.7% and 40%, respectively, which is relatively high, indicating the dominance of pore sizes in this range. Furthermore, when compared to deep clay, shallow mucky clay exhibits higher pore content within the pore diameter ranges of (<10 µm), (15 µm–30 µm), (30 µm–50 µm), and (>50 µm). Moreover, the pore content within each pore size range shows less variability. This suggests that, unlike clay, shallow mucky clay has a more uniform pore size distribution.
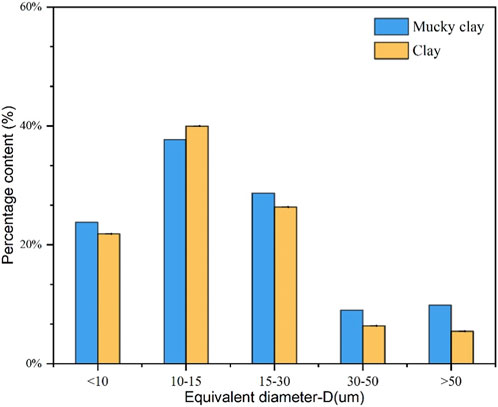
FIGURE 9. The statistical results of pore interval division for mucky clay and clay.
The size of pore fractal dimension reflects the variation in the distribution of the number of pores of different sizes. For a given image, assuming a constant total number of pores, the characteristics of the distribution of the cumulative number of pores smaller than a certain pore size “r” (where “r” represents pore diameter) are often used to describe the variation in the number of pores. In other words, the form of the curve representing “r∼N (<r)” is used to characterize this change.
The linear regression lines for the double logarithmic points of the lg(r)∼lgN(r) relationship are displayed in Figure 10. From the figure, it is evident that the results show a close fit between the regression lines and the actual data points, with all R-squared values exceeding 0.99. This suggests that they effectively represent the characteristics of the pore structure. The pore fractal dimension of clay (1.506) is higher than that of mucky clay (1.378), indicating that mucky clay displays less variation in pore sizes, resulting in a more uniform pore size distribution. This variation is attributed to the influence of depth, self-weight stress, and interactions between soil particles, which lead to the fragmentation and reorganization of the clay soil structure. Larger pores are compressed, while smaller ones are compacted, resulting in increased heterogeneity in pore size distribution.
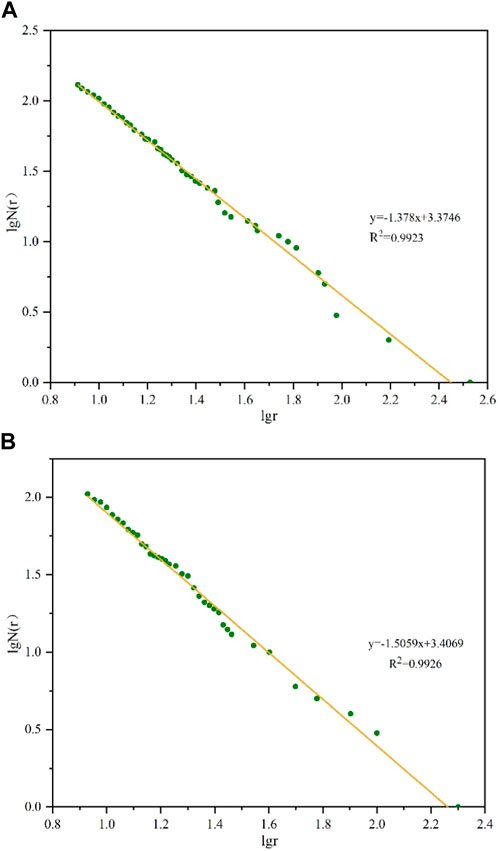
FIGURE 10. Fitting diagram of lgN(r)–lgr curve of samples: (A) shallow mucky clay; (B) deep clay.
(1) The content of primary minerals in both mucky clay and clay samples (over 52%) exceeds that of secondary clay minerals (over 40%). Among these, quartz serves as a representative primary mineral. Furthermore, the shallow mucky clay in marine deposits exhibits a higher clay mineral concentration than the deep clay deposited in fluvial-lacustrine settings, accounting for 48% of the composition, with Illite as the predominant clay mineral. It also contains various levels of kaolinite and montmorillonite. Montmorillonite, with its strong hydrophilic properties and significant volumetric expansion upon water absorption, is one of the reasons for the poor engineering properties of the soil.
(2) From a qualitative perspective of microstructure, shallow mucky clay microstructural investigation indicates a typical agglomerate-flocculated structure. The arrangement is more complicated than single grain and honeycomb structure types, and aggregate boundaries are not well defined. In contrast, deep clay exhibits a flocculated structure at the microstructural level, with poor uniformity in particle size, strong stacking randomness, and a tendency to form arrangements with edges overlapping faces or edges.
(3) Although the test results of shallow and deep soil samples are generally similar, there are also certain differences in microstructure parameters due to different sedimentary environments. Compared to the deep clay deposited in fluvial-lacustrine environments, the marine-deposited shallow mucky clay presents orderly pore arrangements, strong directional alignment, significant pore shape variability, and minimal pore size changes between adjacent pores.
The raw data supporting the conclusion of this article will be made available by the authors, without undue reservation.
DN: Project administration, Writing–review and editing. QM: Formal Analysis, Methodology, Software, Writing–original draft. WG: Project administration, Writing–review and editing. ZS: Formal Analysis, Software, Writing–review and editing. TL: Formal Analysis, Writing–original draft, Writing–review and editing. HX: Formal Analysis, Writing–review and editing.
The author(s) declare financial support was received for the research, authorship, and/or publication of this article. This research is supported by the Open Fund of Hebei Cangzhou Groundwater and Land Subsidence National Observation and Research Station (No. CGLOS-2022-02).
We appreciate the funding support from Hebei Cangzhou Groundwater and Land Subsidence National Observation and Research Station. We also thank reviewers for their helpful comments and suggestions which have led to significant improvement of this paper.
The authors declare that the research was conducted in the absence of any commercial or financial relationships that could be construed as a potential conflict of interest.
All claims expressed in this article are solely those of the authors and do not necessarily represent those of their affiliated organizations, or those of the publisher, the editors and the reviewers. Any product that may be evaluated in this article, or claim that may be made by its manufacturer, is not guaranteed or endorsed by the publisher.
Ademila, O., and Adebanjo, O. J. (2017). Geotechnical and mineralogical characterization of clay deposits in parts of Southwestern Nigeria. Geosciences Res. 2 (2), 127–137. doi:10.22606/gr.2017.22006
Ahmed, A. (2015). Compressive strength and microstructure of soft clay soil stabilized with recycled bassanite. Appl. Clay Sci. 104, 27–35. doi:10.1016/j.clay.2014.11.031
Bai, B., and Zhou, J. (2001). The applications and advances of SEM in geotechnical engineering. J. Chin. Electron Microsc. Soc. 20 (2), 154–155. doi:10.3969/j.issn.1000-6281.2001.02.014
Calero, J., Delgado, R., Delgado, G., and Martín-García, J. M. (2009). SEM image analysis in the study of a soil chronosequence on fluvial terraces of the middle Guadalquivir (Southern Spain). Eur. J. Soil Sci. 60 (3), 465–480. doi:10.1111/j.1365-2389.2009.01131.x
Chen, H., Jiang, Y., Niu, C., Leng, G., and Tian, G. (2019). Dynamic characteristics of saturated loess under different confining pressures: a microscopic analysis. Bull. Eng. Geol. Environ. 78, 931–944. doi:10.1007/s10064-017-1101-9
Dathe, A., Eins, S., Niemeyer, J., and Gerold, G. (2001). The surface fractal dimension of the soil–pore interface as measured by image analysis. Geoderma 103 (1-2), 203–229. doi:10.1016/S0016-7061(01)00077-5
Gu, K., Shi, B., Liu, C., Jiang, H., Li, T., and Wu, J. (2018). Investigation of land subsidence with the combination of distributed fiber optic sensing techniques and microstructure analysis of soils. Eng. Geol. 240, 34–47. doi:10.1016/j.enggeo.2018.04.004
Huang, F., Cao, Z., Guo, J., Jiang, S. H., Li, S., and Guo, Z. (2020). Comparisons of heuristic, general statistical and machine learning models for landslide susceptibility prediction and mapping. Catena 191, 104580. doi:10.1016/j.catena.2020.104580
Huang, F., Xiong, H., Yao, C., Catani, F., Zhou, C., and Huang, J. (2023). Uncertainties of landslide susceptibility prediction considering different landslide types. J. Rock Mech. Geotechnical Eng. 15, 2954–2972. doi:10.1016/j.jrmge.2023.03.001
Jiang, M. J., Li, Z. Y., Huang, H. P., and Liu, J. (2017). Experimental study on microstructure and mechanical properties of seabed soft soil from south China sea. Chin. J. Geotechnical Eng. 39, 17–20. doi:10.11779/CJGE2017S2005
Kahle, M., Kleber, M., and Jahn, R. (2002). Review of XRD-based quantitative analyses of clay minerals in soils: the suitability of mineral intensity factors. Geoderma 109 (3-4), 191–205. doi:10.1016/S0016-7061(02)00175-1
Latifi, N., Meehan, C. L., Majid, M. Z. A., and Horpibulsuk, S. (2016). Strengthening montmorillonitic and kaolinitic clays using a calcium-based non-traditional additive: a micro-level study. Appl. Clay Sci. 132, 182–193. doi:10.1016/j.clay.2016.06.004
Li, C. X., and Wang, P. X. (1998). Late quaternary stratigraphy of the Yangtze Delta. Beijing: Science Press, 172.
Liu, C., Shi, B., Zhou, J., and Tang, C. (2011). Quantification and characterization of microporosity by image processing, geometric measurement and statistical methods: application on SEM images of clay materials. Appl. Clay Sci. 54 (1), 97–106. doi:10.1016/j.clay.2011.07.022
Ma, Y., de Jong, M., Koppenjan, J., Xi, B., and Mu, R. (2012). Explaining the organizational and contractual context of subway construction disasters in China: the case of Hangzhou. Policy Soc. 31 (1), 87–103. doi:10.1016/j.polsoc.2012.01.001
Moore, D. M., and Reynolds, R. C. (1989). X-Ray diffraction and the identification and analysis of clay minerals. New York, NY: Oxford University Press.
Rouse, P., Fannin, R., and Shuttle, D. (2008). Influence of roundness on the void ratio and strength of uniform sand. Géotechnique 58 (3), 227–231. doi:10.1680/geot.2008.58.3.227
Ruehlmann, J., and Körschens, M. (2020). Soil particle density as affected by soil texture and soil organic matter: 2. Predicting the effect of the mineral composition of particle-size fractions. Geoderma 375, 114543. doi:10.1016/j.geoderma.2020.114543
Schmitz, R. M., Schroeder, C., and Charlier, R. (2005). “Influence of microstructure on geotechnical properties of clays,” in Unsaturated soils: experimental studies springer proceedings in physics. Editor T. Schanz (Berlin, Heidelberg: Springer). doi:10.1007/3-540-26736-0_7
Shen, S. L., Wang, Z. F., and Cheng, W. C. (2017). Estimation of lateral displacement induced by jet grouting in clayey soils. Geotechnique 67 (7), 621–630. doi:10.1680/jgeot.16.p.159
Shi, B., Li, S., and Tolkachev, M. (1995). Quantitative approach on SEM images of microstructure of clay soils. Sci. China Chem. 6, 741–748. doi:10.1007/BF00707077
Sivakumar, V., Doran, I. G., and Graham, J. (2002). Particle orientation and its influence on the mechanical behaviour of isotropically consolidated reconstituted clay. Eng. Geol. 66 (3-4), 197–209. doi:10.1016/S0013-7952(02)00040-6
Smart, P., and Leng, X. (1993). Present developments in image analysis. Scanning Microsc. 7 (1), 5–16. doi:10.1016/0379-6787(84)90043-7
Tang, C. S., Lin, L., Cheng, Q., Zhu, C., Wang, D. W., Lin, Z. Y., et al. (2020). Quantification and characterizing of soil microstructure features by image processing technique. Comput. Geotechnics 128, 103817. doi:10.1016/j.compgeo.2020.103817
Tovey, N., and Krinsley, D. (1992). Mapping of the orientation of fine-grained minerals in soils and sediments. Bull. Eng. Geol. Environ. 46 (1), 93–101. doi:10.1007/BF02595039
Tovey, N. K., Hounslow, M. W., and Wang, J. (1995). Orientation analysis and its applications in image analysis. Adv. Imaging & Electron Phys. 93, 219–329. doi:10.1016/S1076-5670(08)70136-8
Wang, Z., Yang, S., Wang, Q., Zhang, Z., Zhang, X., Lan, X., et al. (2014). Late Quaternary stratigraphic evolution on the outer shelf of the East China Sea. Cont. Shelf Res. 90, 5–16. doi:10.1016/j.csr.2014.04.015
Xu, R. Q., Deng, Y. W., Xu, B., Lai, J. P., Zhan, X. G., Xu, L. Y., et al. (2015). Calculation of three dimensional porosity of soft soil based on SEM image. Chin. J. Rock Mech. Eng. 7, 1497–1502. doi:10.13722/j.cnki.jrme.2014.1302
Xu, Y. S., Shen, J. S., Zhou, A. N., and Arulrajah, A. (2018). Geological and hydrogeological environment with geohazards during underground construction in Hangzhou: a review. Arabian J. Geosciences 11, 544–618. doi:10.1007/s12517-018-3894-7
Yang, T. L., and Gong, S. L. (2010). Microscopic analysis of the engineering geological behavior of soft clay in Shanghai, China. Bull. Eng. Geol. Environ. 69, 607–615. doi:10.1007/s10064-010-0305-z
Yong, C., Jinlong, D., Fei, G., Bin, T., Tao, Z., Hao, F., et al. (2022). Review of landslide susceptibility assessment based on knowledge mapping. Stoch. Environ. Res. Risk Assess. 36 (9), 2399–2417. doi:10.1007/s00477-021-02165-z
Yu, Q., Yan, X., Wang, Q., Yang, T., Lu, W., Yao, M., et al. (2021). A spatial-scale evaluation of soil consolidation concerning land subsidence and integrated mechanism analysis at macro-and micro-scale: a case study in Chongming East Shoal Reclamation Area, Shanghai, China. Remote Sens. 13 (12), 2418. doi:10.3390/rs13122418
Zhang, Y., Pu, S., Li, R. Y. M., and Zhang, J. (2020). Microscopic and mechanical properties of undisturbed and remoulded red clay from Guiyang, China. Sci. Rep. 10 (1), 18003. doi:10.1038/s41598-020-71605-7
Zhou, X., Liu, D., Bu, H., Deng, L., Liu, H., Yuan, P., et al. (2018). XRD-based quantitative analysis of clay minerals using reference intensity ratios, mineral intensity factors, Rietveld, and full pattern summation methods: a critical review. Solid Earth Sci. 3 (1), 16–29. doi:10.1016/j.sesci.2017.12.002
Keywords: microstructure, quantitative analysis, X-ray testing, SEM testing, soft clay
Citation: Ning D, Ma Q, Ge W, Shao Z, Lei T and Xing H (2023) Investigation of the microscopic properties of natural structured clay. Front. Earth Sci. 11:1312326. doi: 10.3389/feart.2023.1312326
Received: 10 October 2023; Accepted: 06 November 2023;
Published: 27 December 2023.
Edited by:
Faming Huang, Nanchang University, ChinaReviewed by:
Ali Murtaza Rasool, NESPAK, PakistanCopyright © 2023 Ning, Ma, Ge, Shao, Lei and Xing. This is an open-access article distributed under the terms of the Creative Commons Attribution License (CC BY). The use, distribution or reproduction in other forums is permitted, provided the original author(s) and the copyright owner(s) are credited and that the original publication in this journal is cited, in accordance with accepted academic practice. No use, distribution or reproduction is permitted which does not comply with these terms.
*Correspondence: Qingshan Ma, bXFzbWFydGluMDAxQGdtYWlsLmNvbQ==; Weiya Ge, Z2V3eUBtYWlsLmNncy5nb3YuY24=
Disclaimer: All claims expressed in this article are solely those of the authors and do not necessarily represent those of their affiliated organizations, or those of the publisher, the editors and the reviewers. Any product that may be evaluated in this article or claim that may be made by its manufacturer is not guaranteed or endorsed by the publisher.
Research integrity at Frontiers
Learn more about the work of our research integrity team to safeguard the quality of each article we publish.