- 1Department of Geological Environment, Faculty of Earth Systems and Environmental Sciences, Chonnam National University, Gwangju, Republic of Korea
- 2Department of Earth and Environmental Sciences, Korea University, Seoul, Republic of Korea
Deep-learning (DL) pickers have demonstrated superior performance in seismic phase picking compared to traditional pickers. DL pickers are extremely effective in processing large amounts of seismic data. Nevertheless, they encounter challenges when handling seismograms from different tectonic environments or source types, and even a slight change in the input waveform can considerably affect their consistency. Here, we fine-tuned a self-trained deep neural network picker using a small amount of local seismic data (26,875 three-component seismograms) recorded by regional seismic networks in South Korea. The self-trained model was developed using publicly available waveform datasets, comprising over two million three-component seismograms. The results revealed that the Korean-fine-tuned phase picker (KFpicker) effectively enhanced picking quality, even when applied to data that were not used during the fine-tuning process. When compared to the performance of the pre-trained model, this improvement was consistently observed regardless of variations in the positions of seismic phases in the input waveform, Furthermore, when the KFpicker predicted the phases for overlapping input windows and used the median value of probabilities as a threshold for phase detection, a considerable decrease was observed in the number of false picks. These findings indicate that fine-tuning a deep neural network using a small amount of local data can improve earthquake detection in the region of interest, while careful data augmentation can enhance the robustness of DL pickers against variations in the input window. The application of KFpicker to the 2016 Gyeongju earthquake sequence yielded approximately twice as many earthquakes compared to previous studies. Consequently, detailed and instantaneous statistical parameters of seismicity can be evaluated, making it possible to assess seismic hazard during an earthquake sequence.
Introduction
Earthquake catalogs, which are usually initiated from picking of seismic phases, are the fundamental inputs required for earthquake monitoring and seismic hazard analysis. The completeness of a catalog, which is measured using the minimum magnitude following the Gutenberg–Richter law, can be improved by detecting additional small earthquakes or by identifying additional seismic phases from noisy seismograms.
The Korean Peninsula located at the eastern margin of the Eurasian Plate is a stable intraplate region owing to its relatively low seismicity. However, the earthquakes on 12 September 2016 (Mw 5.6 Gyeongju) and 15 November 2017 (Mw 5.5 Pohang) were accompanied by thousands of aftershocks (Woo et al., 2019; Woo et al., 2020). In addition, low-magnitude earthquakes, such as those on 3 May 2020 (Mw 3.2 Haenam) and 28 October 2022 (Mw 3.7 Goesan), were accompanied by several tens of foreshocks and aftershocks (Sheen, 2021; Son et al., 2021; Song et al., 2022; Sheen et al., 2023). The emergence of these earthquake sequences in a region of low seismicity has necessitated the enhancement of earthquake catalogs for seismic hazard mitigation.
Deep-learning (DL) pickers have demonstrated superior performance in seismic phase picking compared with traditional pickers (Ross et al., 2018; Woollam et al., 2019; Zhu and Beroza, 2019; Mousavi et al., 2020; Liao et al., 2021; Saad et al., 2023). They can effectively process large amounts of seismic data and detect seismic phases with errors similar to that of an experienced analyst, with more phases under low signal-to-noise ratio (SNR) conditions in a shorter time (García et al., 2022). Furthermore, their picks exhibit better consistency than manual picks (Liao et al., 2021).
DL pickers can be generalized to other regions or source types that were not used for their training (Mousavi et al., 2020; Liao et al., 2021; Tan et al., 2021; Walter et al., 2021; García et al., 2022; Harsuko and Alkhalifah, 2022; Heck et al., 2022; Liao et al., 2022; Münchmeyer et al., 2022; Wang et al., 2023). However, the performance of the picker is sometimes degraded when applied to those regions or source types (Jiang et al., 2021; Heck et al., 2022; Han et al., 2023). This issue can be resolved by retraining the neural network (Chai et al., 2020; Johnson et al., 2020; Lapins et al., 2021).
A traditional real-time earthquake monitoring system continuously acquires several second-long packets of waveforms from dataloggers in seismic stations or dataservers (Olivieri and Clinton, 2012) and computes a characteristic function to detect the onset of a seismic phase for each sample of seismograms (Mele et al., 2010). The association of phases to identify the occurrence of seismic events usually relies on P arrivals (Dietz, 2002; Olivieri and Clinton, 2012; Sheen and Friberg, 2021). Retailleau et al. (2022) applied a DL picker, PhaseNet (Zhu and Beroza, 2019), to a real-time seismic processing system, Earthworm (Johnson et al., 1995), for monitoring seismic and volcanic activity. They downloaded 30 s of three-component data for each station from either an online server or a disk archive, with a 50% overlap in the time windows, resulting in an inevitable delay of more than several seconds in seismic analysis. In addition, the seismic phases to pick could appear anywhere within the input waveform.
DL pickers sometimes exhibit inconsistencies owing to input data characteristics. Szegedy et al. (2013) and Goodfellow et al. (2014) demonstrated that DL models are vulnerable to adversarial attacks due to imperceptible perturbations added to the original input, which cause the model to commit mistakes. This phenomenon is also observed in DL pickers, where a position change or a slight perturbation in the input waveform can cause differences in the results (Heck et al., 2022; Park et al., 2022). The performance of DL pickers is critical, particularly for near-real time monitoring of seismicity, as continuous waveforms are processed with a controlled level of false-positive rate (Munchmeyer et al., 2022).
In this study, our primary objective was to develop a robust DL picker, i.e., the Korean-fine-tuned phase picker (KFpicker). The aim was to enhance the determination of seismic phase arrival times for local earthquakes, ultimately contributing to the improvement of local earthquake catalogs. We first introduce the data and methods used to train and fine-tune the KFpicker. Next, we compare the performance of the KFpicker with PhaseNet (Zhu and Beroza, 2019) using a local South Korean earthquake dataset and demonstrate its contribution to improving the 2016 Gyeongju earthquake sequence catalog. Finally, we discuss the effectiveness of KFpicker for the potential application to real-time earthquake monitoring and seismic hazard assessment during an earthquake sequence.
Data
Owing to low seismicity, sufficient seismograms are not available to train deep neural networks in South Korea. Therefore, we used publicly available waveform datasets to train the deep neural network as a base model. INSTANCE (Michelini et al., 2021) is an Italian earthquake waveform dataset collected for machine learning applications, which comprises of approximately 1.2 million three-component waveforms (each with a duration of 120 s) sampled at 100 Hz. STEAD (Mousavi et al., 2019) encompasses 1.2 million three-component waveforms (each with a duration of 60 s) sampled at 100 Hz and recorded on a global scale, comprising both local events and ambient and cultural noises. Considering the seismotectonics of South Korea, only the seismograms of earthquakes occurring at depths shallower than 30 km and observed within an epicentral distance of 150 km were selected from both datasets. The last 60 s of the INSTANCE waveforms were trimmed to match their length with the STEAD waveforms, and the same frequency bandpass filter (1–45 Hz) used for STEAD was applied to the INSTANCE waveforms. Subsequently, we combined both datasets and obtained over 2.3 million three-component waveforms.
To fine-tune our base model, we gathered 26,875 three-component waveforms of earthquakes that occurred in and around South Korea. The earthquake catalog of the Korea Meteorological Administration (KMA) was used to screen local events that occurred between 2017 and 2020 (Figure 1). Seismograms recorded at an epicentral distance of <150 km were selected because we focused on improving the completeness of the earthquake catalog for local events. The seismic stations are operated by the KMA and the Korea Institute of Geoscience and Mineral Resources and are equipped with broadband sensors, short-period sensors, or accelerometers. The P- and S-wave arrivals were manually identified and selected for labeling. To minimize human error and picking uncertainty, the labeled arrivals were used to determine the hypocenters and were cross-validated by several analysts. Because earthquakes with magnitudes greater than or equal to 2.0 were routinely cataloged by the KMA, we gathered seismic waveforms and arrivals of a microearthquake sequence with a magnitude lower than 2.0 near Suncheon City from 2009 (Kwak et al., 2022). All waveforms were sampled at 100 Hz and filtered in the frequency range of 1–45 Hz. The data augmentation technique can generate new training samples using collected datasets to expand the size and variety of training datasets, thereby improving the generalization of DL models (Zhu et al., 2020). For data augmentation during fine-tuning, each trace in the local dataset was 60 s long and centered at P arrival, thus allowing the position of labeled arrivals to be randomly shifted within the 30 s input waveform.
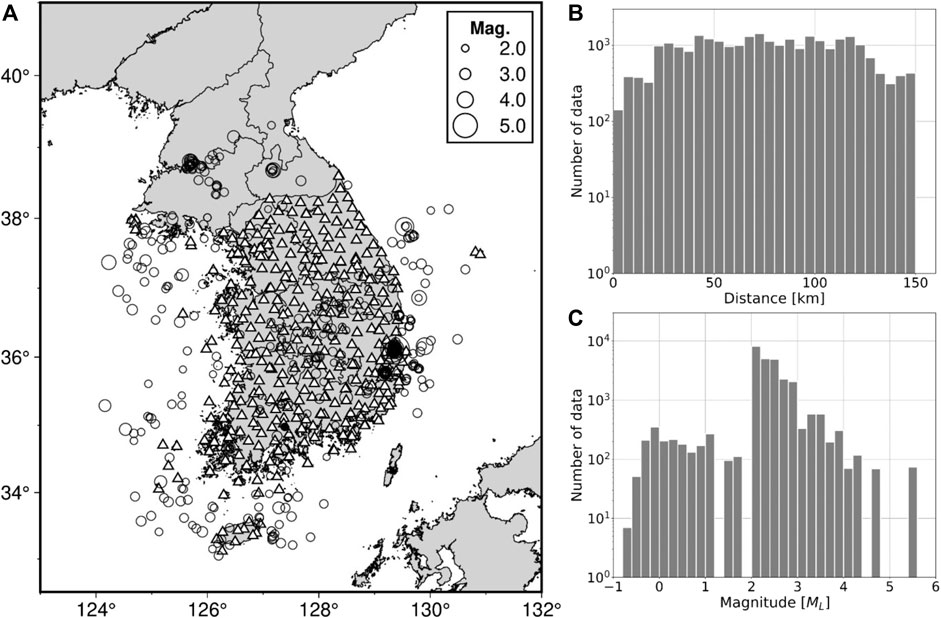
FIGURE 1. Map of events and stations used for training. (A) Locations of events (circles) and seismic stations (triangles) for the training dataset. (B,C) Distance and magnitude distributions of the training dataset.
In the typical evaluation of a pre-trained model, a test dataset is usually randomly chosen from the collected data to ensure an unbiased assessment of the model’s performance on unseen data (e.g., Zhu and Beroza, 2019; Mousavi et al., 2020). However, even if the data are randomly chosen from our dataset, some may share the same source characteristics, making it challenging to assert that they represent entirely new types of data. To thoroughly evaluate the performance of DL pickers, we employed two separate datasets, both of which were distinct and had not been previously seen: 30-s long event data and 1-day long continuous data. This was based on the belief that employing an independent test dataset for evaluation would provide a genuinely unbiased assessment of the model’s performance (Wang et al., 2022).
Seismograms of events that occurred in the southern Korean Peninsula in 2021, comprising 5,065 sets of three-component waveforms, and ground-truth labels (P picks: 5,065; S picks: 2,879) were prepared using the same procedure used for the training dataset. To investigate the performance in the analysis of earthquake sequences, we also collected 1-day-long continuous seismograms from 13 stations within 50 km of the epicenter of the 2020 Haenam earthquake sequence, specifically during the Mw 3.2 mainshock (Sheen, 2021). PhaseNet (Zhu and Beroza, 2019) was used to generate candidate picks, which were then used to identify ground-truth picks. To address the inconsistency of PhaseNet caused by variations in the input window position (Heck et al., 2022) and maximize the number of candidates, we shifted the input window by a 1 s stride and selected the picks exceeding a 0.1 threshold based on the point-by-point maximum of overlapping prediction outputs. Through careful visual inspection, a total of 1,354 ground truth picks were identified, consisting of 489 P picks and 865 S picks, primarily due to the low SNR of the P phases. Several regional and teleseismic phases were ignored because we focused on local events.
Methods
Liao et al. (2021) measured the performance of DL pickers based on the U-Net architecture and demonstrated that the recurrent residual convolutional neural network based on U-Net (R2U-Net; Alom et al., 2018) had a similar or slightly lower performance than that of the model with attention gates (AR2U-Net). However, the R2U-Net and AR2U-Net models exhibited similar performances in picking P arrivals, although the former required approximately one-fifth of the number of trainable parameters compared with the latter. Increasing the number of trainable parameters and the depth of DL models can improve the capturing of the characteristics in seismograms. However, phase picking does not require such high levels of complexity (Yu and Wang, 2022). Therefore, the R2U-Net represented in Figure 2 was adopted for this study, whose complexity is comparable to that of PhaseNet. During the fine-tuning step, the entire network, except for the last layer, was frozen, and only the last layer in Figure 2 was retrained. The model classifies the probability at each time sample on the seismogram into three categories: P-wave arrival, S-wave arrival, and noise. The sum of the probabilities for these three target functions at each time sample is constrained to be one, achieved through the implementation of the softmax activation function in the output layer of the network.
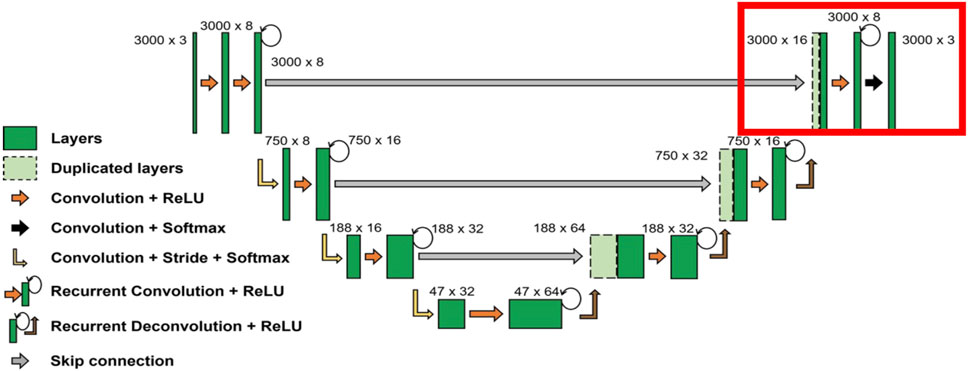
FIGURE 2. Recurrent residual convolutional neural network based on the U-Net (R2U-Net) architecture used in this study. The last layers in the red box were fine-tuned using the local dataset represented in Figure 1.
The global dataset encompassing INSTANCE and STEAD was divided into a training set comprising 80% of the waveforms, and the remaining 20% were left as unseen to validate the model. The local dataset was split at the same ratio for fine-tuning.
Instead of increasing the amount of input data for the generalization of the DL model, the training and fine-tuning datasets were augmented by randomly shifting the waveforms, adding Gaussian noise, and randomly dropping one channel of waveforms (Mousavi et al., 2020). Following PhaseNet, three-component 30-s long seismic waveforms were considered as the model input. Seismic waveforms of this duration can adequately capture both the P and S phases of a local earthquake. During the training of our base model, the input waveform window in the 60-s-long dataset was shifted randomly within a maximum of 10 s because both STEAD and INSTANCE did not have a sufficient waveform length prior to the arrival of the P phase. This shift was performed within a range that guaranteed the inclusion of either the P or S phase, or both. During the fine-tuning of the model, the input waveform window was freely and randomly shifted within the dataset owing to the sufficient length of the waveform before and after the P arrival in the local dataset. Each input waveform was normalized using its standard deviation, and a truncated Gaussian distribution was used to label the ground-truth picks for detection (Zhu and Beroza, 2019).
In the training and fine-tuning of the base model, we set the dropout rate to 0.1 for all dropout layers in the neural network and used the Adam optimizer. The learning rate for both training and fine-tuning started at 0.001 and was reduced by a factor of 0.5 when the validation loss did not decrease in 5 consecutive epochs. Both processes were stopped when the validation loss did not improve for 20 consecutive epochs and generally terminated within 100 epochs. The elapsed times for training and fine-tuning per epoch using a single NVIDIA A100 were approximately 40 and 2 min, respectively.
Results
Application to events data from local earthquakes
PhaseNet (Zhu and Beroza, 2019), trained with over 0.6 million 30 s long seismic waveforms, was chosen for comparison with our fine-tuned neural network, KFpicker. We used 30-s of three-component seismograms from events that occurred in 2021. These seismograms were filtered in the frequency range of 1–45 Hz and standardized by dividing each one by its standard deviation to prepare the input data. The prediction results for the event data starting from the origin time are illustrated in Figure 3. We assessed the detection capability of DL pickers using precision and recall metrics, defined as follows:
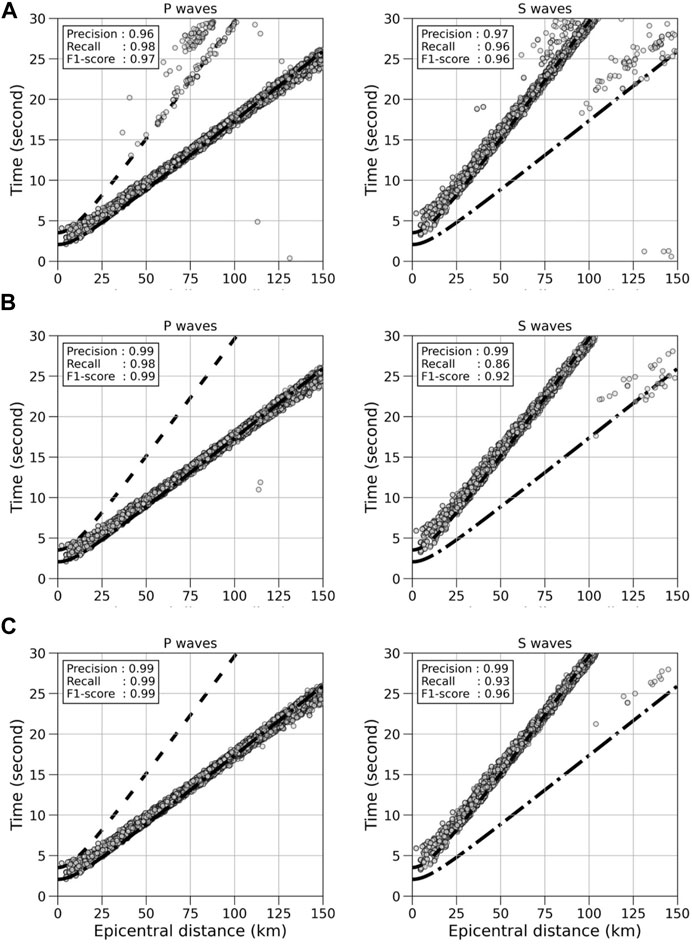
FIGURE 3. Picking performances of (A) PhaseNet (Zhu and Beroza, 2019), (B) the base model trained in this study, and (C) Korean-fine-tuned phase picker (KFpicker) for seismograms of earthquakes that occurred in South Korea in 2021. Predicted arrivals are represented by circles. Theoretical travel times of P-waves (5.8 km/s) and S-waves (3.4 km/s) are denoted by dashed-dot and dashed lines, respectively.
where TP is the number of true positives (TPs), FP is the number of false positives (FPs), and FN is the number of false negatives (FNs). A probability threshold of 0.3 was applied to both DL pickers, and a predicted pick was classified as a TP if its arrival-time residual was less than 0.5 s, while FP was designated if the residual was 0.5 s or more (Mousavi et al., 2020; Saad et al., 2023). If there was no prediction, we considered it an FN. Precision measures the picker’s ability to accurately predict an arrival, while recall measures the ability of the picker to detect all arrivals of a given phase. Precision and recall vary between 0 and 1, where higher values are associated with better-performing models.
The precision and recall of PhaseNet were high for both P and S arrivals, indicating the accuracy of the detections, which is comparable to the result obtained by Mousavi et al. (2020). The precision of both P and S picking obtained from our base model and KFpicker was 0.99, which was marginally superior to that of PhaseNet. It is important to note that neither model had seen this dataset during training. PhaseNet falsely identified mantle reflections (PmP, SmS, and SmP) as P or S phases (Pg, Pn, Sg, and Sn). The picks for mantle reflections predicted by PhaseNet were noticeably lacking in the picks made by the base model and KFpicker, resulting in enhanced precision for both models. Fine-tuning the base model led to an increase in the recall of both the P and S phases. However, the recall for S-waves was still lower than that of PhaseNet, indicating that KFpicker missed more S arrivals than PhaseNet.
The distributions of the arrival-time residuals between the DL and manual picks for the P and S waves are shown in Figure 4. The residual distributions for both of our base model and KFpicker (Figures 4B, C) showed marginally better performance compared to PhaseNet (Figure 4A), with KFpicker outperforming the base model. In particular, the mean errors of P picks for both the base model and KFpicker were less than 1 sample (0.01 s).

FIGURE 4. Histograms showing the distributions of arrival-time residuals (in seconds) of (A) PhaseNet (Zhu and Beroza, 2019), (B) the base model trained in this study, and (C) Korean-fine-tuned phase picker (KFpicker) for seismograms of earthquakes that occurred in South Korea in 2021.
To further evaluate the performance for S arrivals, we compared the distributions of S arrivals predicted by PhaseNet and KFpicker according to the SNR and distance (Figure 5). In this study, the SNR was based on the root mean square of three-component seismograms with two 0.5-s windows following and preceding the ground-truth S arrival. Among all the FPs and FNs of KFpicker, 85% came from seismograms with an SNR lower than 5 dB. In contrast, in PhaseNet, 44% were from data with an SNR higher than 5 dB. In both DL pickers, 79% of FPs and FNs resulted from data with epicentral distances greater than 70 km. These results suggest that KFpicker outperforms PhaseNet in picking S phases at short distances with a higher SNR, potentially leading to improved accuracy in earthquake depth estimation.
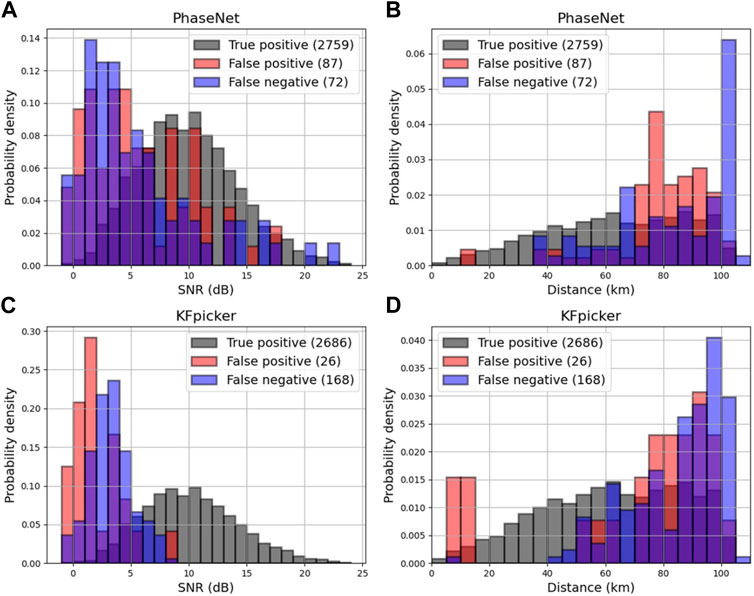
FIGURE 5. Histograms showing the distribution of S arrivals predicted by (A, B) PhaseNet (Zhu and Beroza, 2019) and (C, D) Korean-fine-tuned picker (KFpicker) from seismograms of earthquakes that occurred in South Korea during 2021. The number in parentheses indicates the number of the prediction. There are a total of 2,879 ground-truth S arrivals, with 39 duplicated S arrivals in the predictions of PhaseNet and one in those of KFpicker.
Figure 6 shows waveform examples of FNs and FPs for S arrivals predicted by KFpicker. The upper examples correspond to FNs, while the lower ones correspond to FPs. In all cases, KFpicker successfully predicted P arrivals. For comparison, arrivals predicted by PhaseNet are presented in Figures 6A–G, while KFpicker’s predictions are shown in Figure 6H.
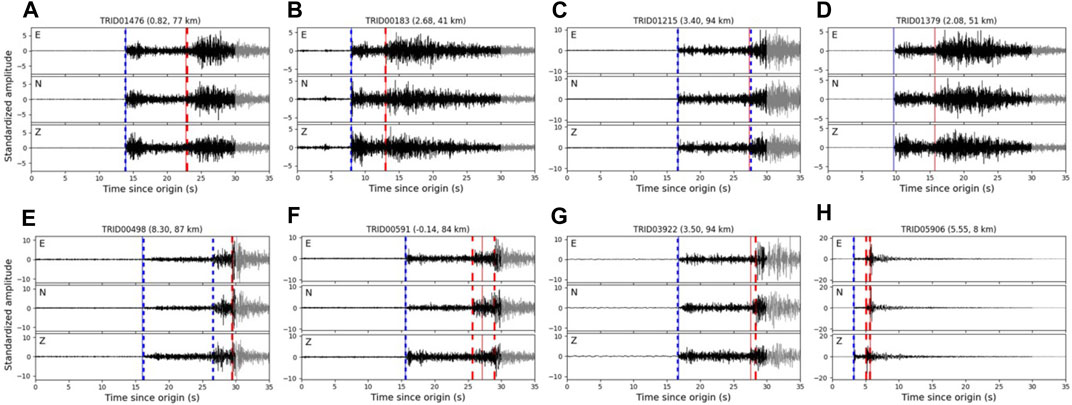
FIGURE 6. Example waveforms of earthquakes that occurred in South Korea in 2021. (A–G) Prediction results of PhaseNet (Zhu and Beroza, 2019) and (H) the results of Korean-fine-tuned phase picker (KFpicker). Solid and dashed vertical lines represent ground-truth and predicted arrivals by deep-learning pickers, respectively. Blue and red lines indicate P and S arrivals, respectively. Numbers in parentheses represent the signal-to-noise ratio and epicentral distance. All waveforms are normalized by their standard deviation within a 0–30 s input window. Gray seismograms after 30 s are provided for clarification.
As shown in Figure 5, PhaseNet had fewer FNs for S arrivals than KFpicker. This indicates that PhaseNet successfully predicted S arrivals in certain low SNR waveforms that KFpicker did not capture (Figures 6A, B). However, PhaseNet also had its shortcomings, as it sometimes misidentified S arrivals as P arrivals (Figure 6C) and, in some cases, failed to make predictions altogether (Figure 6D). Notably, in Figure 6D, the onset of the P-wave is easily visible, but PhaseNet missed it, whereas KFpicker predicted it correctly.
Moreover, most of the FPs in KFpickers were also incorrectly identified by PhaseNet. However, some of them resulted from mislabeled ground truths. In Figure 6E, where the SmS phase was incorrectly labeled as the S phase, PhaseNet misinterpreted the S phase as the P phase and incorrectly recognized SmS as the S phase, whereas KFpicker made the correct prediction. The S phase in Figure 6F was mistakenly labeled between the S and SmS phases. KFpicker correctly predicted the S arrival, while PhaseNet interpreted both S and SmS as S phases. Although both KFpicker and PhaseNet correctly determined the S arrival in Figure 6G, the S phase was manually picked at a converted phase. Nonetheless, these were classified as FPs due to incorrect labeling.
As shown in Figures 6C, E, F, PhaseNet picked multiple P or S arrivals in 30-s long event data, which increased the FPs of PhaseNet. KFpicker also made multiple predictions; for example, in Figure 6H, converted phases and S phases were picked as S arrivals. For all the event data, PhaseNet predicted multiple P arrivals in 142 cases and multiple S arrivals in 39 cases, while KFpicker predicted multiple P arrivals in 8 inputs and multiple S arrivals in one input.
Heck et al. (2022) demonstrated that the performance of PhaseNet depends on the input data window relative to the phase arrival time. To solve this dependence, they continuously moved the position of the input window at 10-s intervals and merged the overlapping prediction results using the maximum of PhaseNet outputs. Hence, Figures 3–6 would potentially vary depending on the positions of the input window within the dataset.
To check for variations in the performance of DL pickers owing to the position changes in the input waveform window, we realigned the event dataset with respect to the positions of P arrivals, moving from 1 to 29 s in the input window, whereas the dataset used in Figures 3–6 was aligned with the origin time of the event. Figure 7 shows the prediction results related to the position shifts of P arrivals in the input data. As reported by Heck et al. (2022), the performance of PhaseNet varied with position changes of P arrivals in the input window. However, KFpicker exhibited excellent performance and was consistent for P arrivals, regardless of variations in P arrival positions in the input window. Furthermore, the precision of S arrivals predicted by KFpicker was consistent and high (>0.98); however, the recall exhibited large variations. Notably, the recall of S arrivals of both DL pickers was lower when P arrivals were positioned within the first half of the input waveform compared to when they were positioned in the second half. The recall started to increase rapidly when P arrivals were located at 13 s in the input window, and remained constant after P arrivals reached 17 s. This is because both pickers failed to detect S arrivals recorded at epicentral distances greater than 100 km (see Figure 3). When only waveforms with less than 100 km epicentral distance were considered, aligning P arrivals at the 1 s position of the input window increased the recall of S arrivals of KFpicker to 0.95. Furthermore, regardless of the variations in the positions of P arrivals, the recall of S arrivals was generally consistent. The sudden changes observed from 25 s onwards are attributed to the small amount of data.
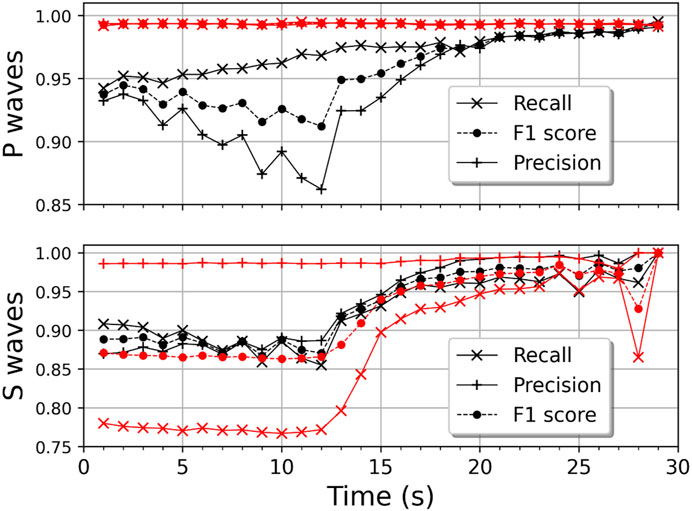
FIGURE 7. Variations in picking performances of deep-learning (DL) pickers corresponding to the position changes of P arrivals in the input window. The time represents the position of P arrivals in the input window. Red and black symbols represent the performances of Korean-fine-tuned phase picker (KFpicker) and PhaseNet (Zhu and Beroza, 2019), respectively.
In real-time earthquake monitoring, seismic phases can occur anywhere in the input seismogram. The phase association procedure typically uses P arrivals, followed by the event location procedure, which combines S arrivals to determine the hypocenter of an event (Dietz, 2002; Olivieri and Clinton, 2012; Sheen and Friberg, 2021). Therefore, the robustness of KFpicker against variations in the input window highlights its effectiveness for future applications in real-time seismic monitoring, especially in situations where repeated arrival predictions are not possible.
Before applying KFpicker to the 2016 Gyeongju earthquake sequence, we validated its performance by assessing the changes in the overlapping interval of the input window and differences in the merging method to determine the optimal conditions. While Heck et al. (2022) merged the overlapping prediction results using the maximum of PhaseNet outputs, this study introduced merging using the median of the prediction outputs. Figure 8 shows the number of TPs against the number of FPs for 1-day-long continuous seismograms processed using PhaseNet and KFpicker. Note that the total number of TPs obtained from the maximum of probabilities of PhaseNet with a 1 s stride of overlapping intervals is 1,347, while the number of FPs is 88,807, which falls outside the range shown in Figure 8. As this study considered 30-s input waveforms, 10 and 30 s of strides indicate that one-third of the input window overlapped with adjacent windows and the input waveforms did not overlap, respectively. In all cases, as the detection threshold decreased, the number of TPs and FPs increased. Therefore, it may be necessary to consider a bifurcation threshold for event detection. Furthermore, when the input window overlapped, there were more TPs than when it did not overlap.
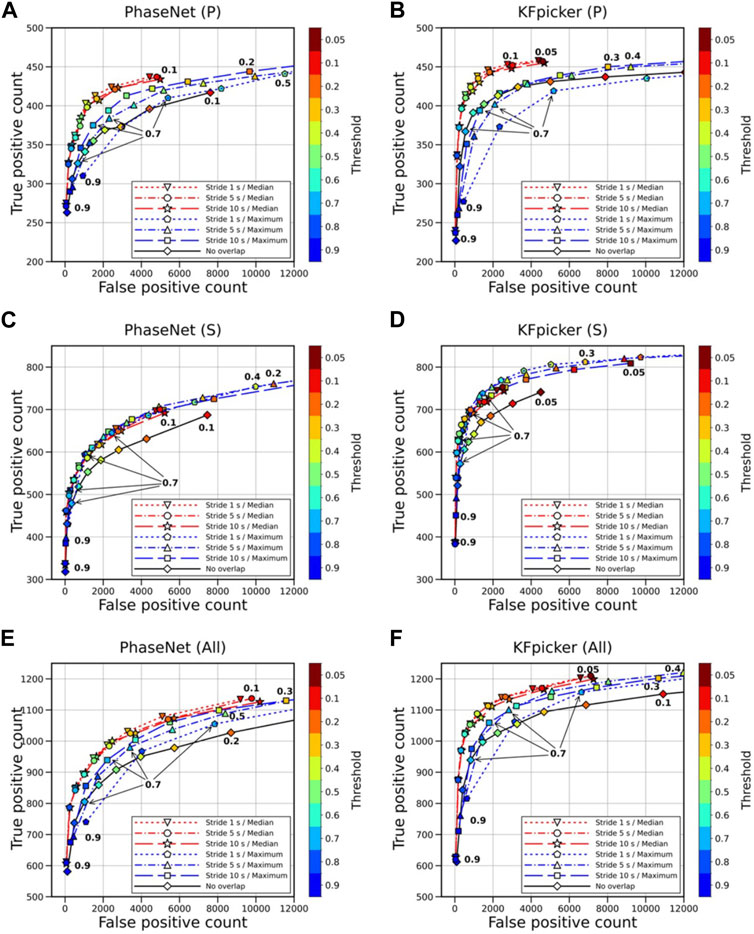
FIGURE 8. Performance comparison of deep-learning (DL) pickers based on the overlapping stride of the input window and the merging method of the prediction results. The left figures represent the performances of PhaseNet (Zhu and Beroza, 2019), while the right figures represent the performances of Korean-fine-tuned phase picker (KFpicker). (A–F) display the results for P arrivals, S arrivals, and all arrivals, respectively. The maximum number of true positives is 489 for P arrivals and 865 for S arrivals, while the numbers of false positives is 49,382 for P arrivals and 39,425 for S arrivals, respectively. The numbers near the symbols indicate the corresponding detection threshold values.
Reducing the overlapping stride was very effective in merging the overlapped prediction results using the maximum of prediction outputs, but it did not lead to significant improvement when using the median. When merging using the maximum of prediction outputs, the number of FPs increased more than the number of TPs, whereas merging using the median reduced the number of FPs and increased the number of TPs. In addition, as the overlapping interval decreased and the overlapping prediction results were merged using the maximum value, the number of TPs increased when compared under the same detection threshold. However, the number of FPs increased more than the number of TPs. In contrast, when the median was used for merging under the same detection threshold, the increase in the number of TPs was not substantial, although the overlapping interval decreased. In addition, a considerable decrease was observed in the number of FPs. We also found that merging the results using the median was more effective for decreasing FPs in the case of the P phase than merging them with the maximum value.
Although the optimum detection thresholds were different between DL pickers, the closer the curve was to the upper-left corner in Figure 8, where the number of FPs and FNs was zero, the higher the precision and recall. Therefore, KFpicker performed better than PhaseNet because it detected more true picks and fewer false picks.
Application to continuous data from an earthquake sequence
We applied KFpicker to the first 2 weeks of continuous seismograms obtained from the 2016 Gyeongju earthquake sequence, which comprised the mainshock, a moderate earthquake (Mw 5.6) that occurred in Gyeongju, South Korea, on 12 September 2016, several foreshocks, and numerous aftershocks. Woo et al. (2019) and Han et al. (2023) used seismic waveforms obtained from 35 seismic stations, comprising 8 permanent stations and 27 temporary stations that began operation within 2 h of the largest foreshock (Mw 5.1), which occurred approximately 50 min before the mainshock, whereas we only used waveforms from 13 permanent stations within an epicentral distance of 50 km (Figure 9A).
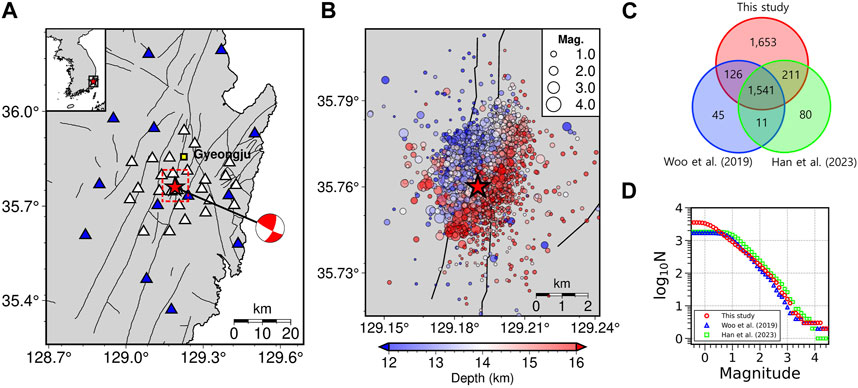
FIGURE 9. Results of earthquake detection using the 2016 Gyeongju earthquake sequence. (A) Distribution of seismic stations used in this study. Blue triangles represent permanent seismic stations used, while white triangles represent temporary stations not used in this study. The mainshock is indicated by a red star, and its focal mechanism was obtained from Woo et al. (2019). Known faults and lineaments are shown as solid lines. (B) Epicenters of the 2016 Gyeongju earthquake sequence, which were determined in this study. (C) Venn diagram of the number of events in the catalogs of this study, Woo et al. (2019), and Han et al. (2023). (D) Frequency–magnitude distributions of the 2016 Gyeongju earthquake sequence obtained from this study, Woo et al. (2019), and Han et al. (2023), represented by circles, crosses, and plus signs, respectively.
For phase picking using seismograms recorded between September 12 and 25, 2016, we overlapped the input window with a 5 s stride for KFpicker and merged the prediction results with the median. The optimum detection threshold for KFpicker was 0.3 or 0.4 (see Figure 8). However, to enhance the catalog by detecting more TPs, we used a low threshold of 0.2, and FPs were eliminated during the phase-association process (García et al., 2022). In this study, the Gaussian Mixture Model Association (Zhu et al., 2022) was used in this study, and the association parameters were at least six phases (a minimum of three P and three S phases). The associated events were located using Hypoinverse (Klein, 2002) with the local 1-D velocity model of Kim et al. (2011). During the period of interest, 4,035 earthquakes were detected using seismograms obtained from 13 permanent regional seismic stations. After careful inspection, we found that 30 blasts and 331 false events were included in the initial catalog. Blast events were screened through visual inspection of waveforms and epicenter locations, and most false events were found to be related to noise-induced picks. For comparison with the results of Woo et al. (2019) and Han et al. (2023), events located within 35.715°–35.815°N and 129.142°–129.242°E were chosen, resulting in 3,531 true events and 126 false events (Figure 9B).
Woo et al. (2019) picked P- and S-wave phase arrival times using the short-term average to long-term average ratio method of Withers et al. (1998) and manually inspected them to discriminate overlapping events and remove false detections. They reported 1,723 earthquakes within the same area in the first 2 weeks. Han et al. (2023) used the same dataset used by Woo et al. (2019) and picked seismic phases using EQTransformer (Mousavi et al., 2020) by overlapping 60 s of the input waveforms by 30%. The thresholds for P-waves, S-waves, and event detection were 0.3, 0.1, and 0.1, respectively. Before association, they screened the phases detected by EQTransformer based on waveform similarity with the phases picked by Woo et al. (2019) and selected phases whose cross-correlation coefficients were greater than 0.8. Then, they associated phases based on S-wave travel times. They reported 1,843 earthquakes within the same region and time period used in this study.
Earthquakes with an origin time difference of less than 1.0 s were considered the same among the three catalogs. Out of the 1,541 common earthquakes found in all three catalogs, our catalog had a hypocentral difference of 1.02 ± 0.75 km when compared to that of Woo et al. (2019) and a difference of 0.87 ± 0.65 km when compared to that of Han et al. (2023). We missed 56 events present in the catalog of Woo et al. (2019) and 91 events present in the catalog of Han et al. (2023). However, we identified 1,864 and 1,778 more earthquakes than Woo et al. (2019) and Han et al. (2023), respectively. Although only seismograms obtained from permanent regional stations were used in this study, we identified nearly twice the number of earthquakes compared to the previous studies (Figures 9C, D). This suggests that KFpicker and our customization can substantially enhance the catalog and lower the magnitude of completeness.
Discussion
Future applications to real-time earthquake monitoring
We have demonstrated that KFpicker can consistently and accurately predict P and S arrivals, irrespective of variations in the positions of seismic phases in the input waveform. The F1 score combines the precision and recall of a DL model into a single metric, defined as the harmonic mean. This is primarily used to compare the performance of two models and provides a balanced assessment. KFpicker achieved an F1 score of 0.99 ± 0.0004 for P arrivals corresponding to the position changes of P arrivals given in Figure 7, which is better than the PhaseNet score of 0.96 ± 0.0265. However, for S arrivals, PhaseNet showed a marginally better performance than KFpicker, with an F1 score of 0.93 ± 0.0468 compared to 0.92 ± 0.0511 for KFpicker.
A phase detection algorithm in the conventional earthquake monitoring system continuously analyzes each sample of seismograms to identify the onset of any seismic phase. In contrast, DL pickers determine the arrivals from sliced data of a given length, often with some overlap, which can result in a delay of several seconds in real-time seismic processing. Therefore, KFpicker can be considered effective for real-time applications because it is more robust against changes in the input waveform’s position and can consistently provide results, even without the need for overlap, which can introduce delays.
To compare the performance of DL pickers when applied to continuous seismograms of an earthquake sequence, we compared the number of associated phases and detected events for the 2016 Gyeongju earthquake sequence under different overlapping strides and thresholds (Table 1). Note that events located outside the region of interest, most of which were false events caused by noise, were not considered. The overlapped prediction results were merged using the median value, and a stride of 30 s indicated that the input waveform did not overlap.

TABLE 1. Comparison of detection results between Korean-fine-tuned phase picker (KFpicker) and PhaseNet (Zhu and Beroza, 2019) under different strides of overlapping and different probability thresholds.
As shown in Figure 8, the number of associated phases increased as the probability threshold for phase detection was lowered, leading to an increase in both true and false events. By overlapping the input waveforms, the number of associated phases decreased, but the total number of events increased. For a threshold of 0.2, the number of true events increased by 6% for both KFpikcer and PhaseNet, while the number of false events decreased by 27% for KFpicker and 20% for PhaseNet when merging with the median value of overlapping prediction results, as observed with a threshold of 0.3. These are in good agreement with the results presented in Figure 8, where true positives increased slightly, and false positives decreased significantly upon merging with the median value. Therefore, it is expected that by increasing the threshold further, the number of true events will remain relatively unchanged while minimizing the number of false events.
The precision of event detection, determined by comparing true events to all detected events, was 0.96 for KFpicker with a threshold of 0.3, even without overlapping, while the best precision for PhaseNet was 0.94, even when overlapping with a 5 s stride. Considering the real-time application of PhaseNet by Retailleau et al. (2022), where the input waveform overlapped by 50%, it is expected that the real-time application of KFpicker is not only possible but also more effective for real-time seismic hazard assessment.
Based on our understanding of previous studies, the input lengths for DL pickers are typically much longer when considering the requirements of a real-time earthquake monitoring system. For example, almost half of the seismic stations in South Korea sent data packets every second from stations to the monitoring system in 2017 (Sheen et al., 2023). Nowadays, the number of stations sending data every second are increasing. In contrast, most DL pickers, including KFpicker in this study, require 30 or 60 s seismograms to predict the arrival time of seismic phases (Zhu and Beroza, 2019; Mousavi et al., 2020; Liao et al., 2021; Saad et al., 2023), while only two pickers, GPD of Ross et al. (2018) and BasePhaseAE of Woollam et al. (2019), were designed to use the input of 4 and 6 s waveforms, respectively. Therefore, it is essential to develop a DL picker with a shorter input length to ensure efficiency in its application to a real-time system.
Future applications to real-time seismic hazard assessment
Detecting more events through DL pickers would facilitate the investigation of the detailed spatiotemporal evolution of earthquake sequences and the mapping of subsurface geometry (Liu et al., 2020; Wilding et al., 2022). These outcomes could serve as fundamental inputs for forecasting aftershocks and predicting the likelihood of a larger forthcoming event (Page et al., 2016; Gulia and Wiemer, 2019). Although our approach is anticipated to provide a better solution for understanding the seismogenic structure of the 2016 Gyeongju earthquake sequence compared to the work of Woo et al. (2019), further investigation is beyond the scope of our current study. Instead, we focused on analyzing the temporal evolution of the aftershocks in the sequence.
We measured the magnitude of earthquakes using an empirical relationship derived from 36 earthquakes greater than magnitude 2.5 in the Gyeongju sequence, as described in the Supplemental Material for this article. In contrast, Woo et al. (2019) estimated magnitudes relatively based on amplitude ratios with reference to the whole set of aftershocks of the sequence, while Han et al. (2023) utilized an empirical relationship established by Sheen et al. (2021). These approaches may have resulted in inconsistencies in earthquake magnitudes below 2.0, as observed when comparing the magnitudes of the 1,541 common earthquakes (Figure 10). Discrepancies in magnitude estimates for microearthquakes have been reported and addressed using second-order polynomial equations (Edwards and Rietbrock, 2009; Uchide and Imanishi, 2018). Therefore, before investigating temporal evolution, we scaled our estimates and those of Han et al. (2023) to match the magnitudes of Woo et al. (2019) using second-order polynomial equations. This adjustment increased the R-squared coefficient from 0.91 to 1.00 and from 0.81 to 1.00, respectively.
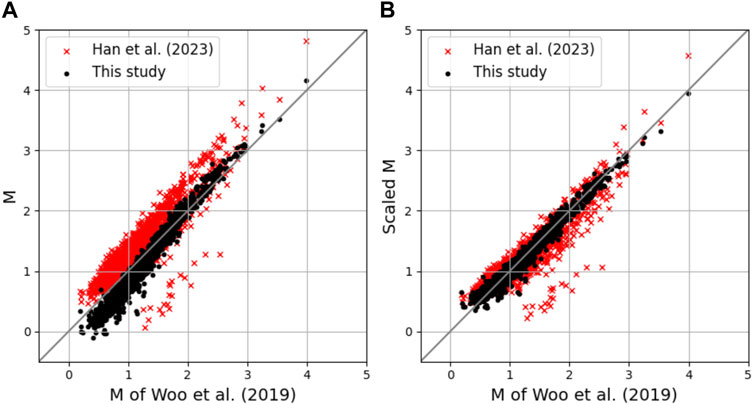
FIGURE 10. Comparison of (A) the original and (B) scaled magnitudes of 1,374 common earthquakes in the catalogs of Woo et al. (2019), Han et al. (2023), and this study. The magnitudes of Han et al. (2023) and this study were scaled using second-order polynomial equations.
Figure 11 depicts the statistical variations of each catalog over time, including the magnitude of completeness (Mc) and the Gutenberg–Richter b value (b-value), both measured using ZMAP (Wiemer, 2001). The Mc and b-value were estimated for every set of 500 events in chronological order, allowing for the duplication of 400 events, following the approach of Woo et al. (2019). To ensure comparability with Woo et al. (2019), we utilized the adjusted magnitudes from this study and the study by Han et al. (2023), as shown in Figure 10B.
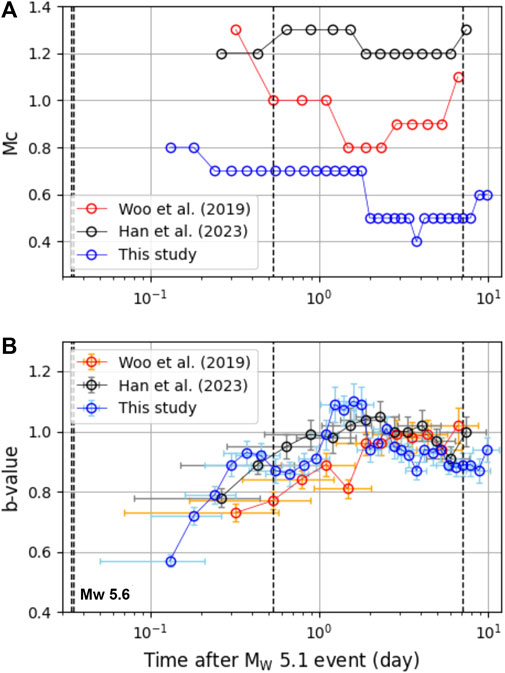
FIGURE 11. Temporal variation of (A) the magnitude of completeness (Mc) and (B) the Gutenberg–Richter b value (b-value). Vertical dashed lines indicate the origin times of the mainshock (Mw 5.6) and aftershocks greater than magnitude 3.0. The horizontal and vertical error bars in (B) represent one standard deviation of the event origin times and b-values, respectively.
Interestingly, the Mc in this study, which utilized seismograms exclusively from permanent seismic stations, was consistently lower than those in the studies of Woo et al. (2019) and Han et al. (2023), which used temporary stations operated near the epicenter. As demonstrated by Woo et al. (2019), the Mc values in all catalogs decreased during the initial few days, and this was attributed to the additional deployment of temporary seismic stations. However, our study also observed a similar decrease, suggesting that it may not be solely attributed to the enhanced seismic monitoring facilitated by the temporary network. This decrease could be related to superimposed seismic signals from an active aftershock sequence (Kagan, 2004; Hainzl, 2016; van der Elst, 2021), suggesting the possibility of undetected events during the initial few hours, either due to missing seismic phases or the failure to associate them.
We also found that the b-values of all catalogs temporarily increased during the initial few days and then decreased, consistent with the findings of Gulia et al. (2018). Due to the enhanced catalog obtained in this study, an increase in the b-value can be detected earlier compared to other studies, which is valuable for real-time seismic hazard assessment, whether the largest earthquake has already occurred or is yet to come (Gulia and Wiemer, 2019).
Conclusion
For seismic phase picking, we fine-tuned a deep neural network, which was initially trained using more than 2.3 million publicly available global waveforms, using a local dataset obtained from South Korea, which accounted for approximately 1% of the global dataset. KFpicker exhibited outstanding and highly consistent performance, irrespective of variations in the input window position, which would be effective for real-time seismic monitoring. Additionally, using the median value of probabilities as a threshold for phase detection, the number of FPs and TPs considerably decreased and increased, respectively. The application of KFpicker to the continuous seismograms of the 2016 Gyeongju earthquake sequence yielded a detection of approximately twice as many earthquakes compared to previous studies. These results demonstrated that fine-tuning the last layer of a deep neural network using a small amount of local data considerably improves earthquake detection in the region of interest, and that careful data augmentation enhances the robustness of DL pickers against variations in the input window. This highlights the effectiveness of DL pickers for future applications in real-time seismic monitoring, especially in situations where repeated arrival predictions are not feasible. Additionally, DL pickers are valuable for evaluating instantaneous statistical parameters of seismicity and, consequently, for assessing seismic hazard during an earthquake sequence.
Data availability statement
The data analyzed in this study is subject to the following licenses/restrictions: Seismograms used for fine-tuning are hosted at the Korea Meteorological Administration and the Korea Institute of Geoscience and Mineral Resources, and can be obtained upon request. Requests to access these datasets should be directed to www.kma.go.kr, www.kigam.re.kr.
Author contributions
YH: Data curation, Formal Analysis, Investigation, Methodology, Validation, Writing–original draft. A-HB: Data curation, Formal Analysis, Writing–original draft, Writing–review and editing. SK: Validation, Writing–review and editing. D-HS: Funding acquisition, Methodology, Project administration, Supervision, Validation, Writing–original draft, Writing–review and editing.
Funding
The author(s) declare financial support was received for the research, authorship, and/or publication of this article. This research was funded by the Korea Meteorological Administration under Grant KMI2021-01111.
Acknowledgments
The authors would like to express their sincere gratitude to Seongjin Kim for merging data and training KFpicker. Careful reviews and constructive comments from the associate editor and the reviewers improved this paper.
Conflict of interest
The authors declare that the research was conducted in the absence of any commercial or financial relationships that could be construed as a potential conflict of interest.
Publisher’s note
All claims expressed in this article are solely those of the authors and do not necessarily represent those of their affiliated organizations, or those of the publisher, the editors and the reviewers. Any product that may be evaluated in this article, or claim that may be made by its manufacturer, is not guaranteed or endorsed by the publisher.
Supplementary material
The Supplementary Material for this article can be found online at: https://www.frontiersin.org/articles/10.3389/feart.2023.1306488/full#supplementary-material
References
Alom, M. Z., Hasan, M., Yakopcic, C., Taha, T. M., and Asari, V. K. (2018). Recurrent residual convolutional neural network based on U-Net (R2U-Net) for medical image segmentation. Available at https://arxiv.org/abs/1802.06955 (Accessed July, 2023).
Chai, C., Maceira, M., Santos-Villalobos, H. J., Venkatakrishnan, S. V., Schoenball, M., Zhu, W., et al. (2020). Using a deep neural network and transfer learning to bridge scales for seismic phase picking. Geophys. Res. Lett. 47 (16), e2020GL088651. doi:10.1029/2020GL088651
Dietz, L. (2002). Notes on configuring binder_ew: earthworm’s phase associator. Available at: http://www.earthwormcentral.org/documentation4/ovr/binder_setup.html (Accessed July, 2023).
Edwards, B., and Rietbrock, A. (2009). A comparative study on attenuation and source-scaling relations in the Kantō, Tokai, and Chubu regions of Japan, using data from Hi-net and KiK-net. Bull. Seismol. Soc. Am. 99, 2435–2460. doi:10.1785/0120080292
García, J. E., Fernández-Prieto, L. M., Villaseñor, A., Sanz, V., Ammirati, J.-B., Díaz Suárez, E. A., et al. (2022). Performance of deep learning pickers in routine network processing applications. Seismol. Res. Lett. 93 (5), 2529–2542. doi:10.1785/0220210323
Goodfellow, I. J., Shlens, J., and Szegedy, C. (2014). Explaining and harnessing adversarial examples. Available at: https://arxiv.org/abs/1412.6572 (Accessed July, 2023).
Gulia, L., Rinaldi, A. P., Tormann, T., Vannucci, G., Enescu, B., and Wiemer, S. (2018). The effect of a mainshock on the size distribution of the aftershocks. Geophys. Res. Lett. 45 (13). doi:10.1029/2018gl080619
Gulia, L., and Wiemer, S. (2019). Real-time discrimination of earthquake foreshocks and aftershocks. Nature 574, 193–199. doi:10.1038/s41586-019-1606-4
Hainzl, S. (2016). Apparent triggering function of aftershocks resulting from rate-dependent incompleteness of earthquake catalogs. J. Geophys. Res. 121 (9), 6499–6509. doi:10.1002/2016JB013319
Han, J., Kim, S., Sheen, D.-H., Lee, D., Lee, S.-J., Yoo, S.-H., et al. (2023). Seismic event and phase detection using deep learning for the 2016 Gyeongju earthquake sequence. Geosci. J. 27, 285–295. doi:10.1007/s12303-023-0004-y
Harsuko, R., and Alkhalifah, T. A. (2022). StorSeismic: a new paradigm in deep learning for seismic processing. IEEE Trans. Geoscience Remote Sens. 60, 1–15. doi:10.1109/tgrs.2022.3216660
Heck, S. L., Young, C. J., and Brogan, R. (2022). Comparing traditional and deep learning signal features for event detection in the Utah region. Bull. Seismol. Soc. Am. 112 (5), 2344–2363. doi:10.1785/0120210275
Jiang, C., Fang, L., Fan, L., and Li, B. (2021). Comparison of the earthquake detection effects of PhaseNet and EQTransformer considering the yangbi and maduo earthquakes. Earthq. Sci. 34 (5), 20210038–20210435. doi:10.29382/q20210038
Johnson, C. E., Bittenbinder, A., Bogaert, B., Dietz, L., and Kohler, W. (1995). Earthworm: a flexible approach to seismic network processing. Iris Newsl. 14 (2), 1–4.
Johnson, S. W., Chambers, D. J. A., Boltz, M. S., and Koper, K. D. (2020). Application of a convolutional neural network for seismic phase picking of mining-induced seismicity. Geophys. J. Int. 224 (1), 230–240. doi:10.1093/gji/ggaa449
Kagan, Y. Y. (2004). Short-term properties of earthquake catalogs and models of earthquake source. Bull. Seismol. Soc. Am. 94 (4), 1207–1228. doi:10.1785/012003098
Kim, S., Rhie, J., and Kim, G. (2011). Forward waveform modelling procedure for 1-D crustal velocity structure and its application to the southern Korean Peninsula. Geophys. J. Int. 185 (1), 453–468. doi:10.1111/j.1365-246x.2011.04949.x
Klein, F. W. (2002). User’s guide to HYPOINVERSE-2000, a Fortran program to solve for earthquake locations and magnitudes. U.S. Geol. Surv. Open-File Rept. 02-171.
Kwak, D., Kim, S., Sheen, D.-H., and Kim, S. (2022). Seismological characteristics of microearthquake sequence near Suncheon, South Korea, from 2009 to 2020. Geosci. J. 26 (5), 609–620. doi:10.1007/s12303-022-0010-5
Lapins, S., Goitom, B., Kendall, J.-M., Werner, M. J., Cashman, K. V., and Hammond, J. O. S. (2021). A little data goes a long way: automating seismic phase arrival picking at Nabro volcano with transfer learning. J. Geophys. Res. 126, e2021JB021910–7. doi:10.1029/2021JB021910
Liao, W.-Y., Lee, E.-J., Mu, D., and Chen, P. (2022). Toward fully autonomous seismic networks: backprojecting deep learning-based phase time functions for earthquake monitoring on continuous recordings. Seismol. Res. Lett. 93 (3), 1880–1894. doi:10.1785/0220210274
Liao, W. Y., Lee, E. J., Mu, D., Chen, P., and Rau, R. J. (2021). ARRU phase picker: attention recurrent-residual U-Net for picking seismic P-and S-phase arrivals. Seismol. Res. Lett. 92 (4), 2410–2428. doi:10.1785/0220200382
Liu, M., Zhang, M., Zhu, W., Ellsworth, W. L., and Li, H. (2020). Rapid characterization of the July 2019 Ridgecrest, California, earthquake sequence from raw seismic data using machine-learning phase picker. Geophys. Res. Lett. 47, e2019GL086189. doi:10.1029/2019GL086189
Mele, F., Bono, A., Lauciani, V., Mandiello, A., Marcocci, C., Pintore, S., et al. (2010). Tuning an Earthworm phase picker: some considerations on the pick_ew parameters. Rapp. Tec. INGV 164.
Michelini, A., Cianetti, S., Gaviano, S., Giunchi, C., Jozinovic, D., and Lauciani, V. (2021). INSTANCE – the Italian seismic dataset for machine learning. Earth Syst. Sci. Data Discuss. 13 (12), 5509–5544. doi:10.5194/essd-13-5509-2021
Mousavi, S. M., Ellsworth, W. L., Zhu, W., Chuang, L. Y., and Beroza, G. C. (2020). Earthquake transformer—an attentive deep-learning model for simultaneous earthquake detection and phase picking. Nat. Comm. 11 (1), 3952. doi:10.1038/s41467-020-17591-w
Mousavi, S. M., Sheng, Y., Zhu, W., and Beroza, G. C. (2019). Stanford earthquake dataset (STEAD): a global data set of seismic signals for AI. IEEE Access 7, 179464–179476. doi:10.1109/ACCESS.2019.2947848
Münchmeyer, J., Woollam, J., Rietbrock, A., Tilmann, F., Lange, D., Bornstein, T., et al. (2022). Which picker fits my data? A quantitative evaluation of deep learning based seismic pickers. J. Geophys. Res. 127 (1), e2021JB023499. doi:10.1029/2021JB023499
Olivieri, M., and Clinton, J. (2012). An almost fair comparison between earthworm and seiscomp3. Seismol. Res. Lett. 83 (4), 833–727. doi:10.1785/0220120114
Page, M. T., Van Der Elst, N., Hardebeck, J., Felzer, K., and Michael, A. J. (2016). Three ingredients for improved global aftershock forecasts: tectonic region, time-dependent catalog incompleteness, and intersequence variability. Bull. Seismol. Soc. Am. 106, 2290–2301. doi:10.1785/0120160073
Park, Y., Beroza, G. C., and Ellsworth, W. L. (2022). Basement Fault activation before larger earthquakes in Oklahoma and Kansas. Seismic Rec. 2, 197–206. doi:10.1785/0320220020
Retailleau, L., Saurel, J.-M., Zhu, W., Satriano, C., Beroza, G. C., Issartel, S., et al. (2022). A wrapper to use a machine-learning- based algorithm for earthquake monitoring. Seismol. Res. Lett. 93, 1673–1682. doi:10.1785/0220210279
Ross, Z. E., Meier, M.-A., Hauksson, E., and Heaton, T. H. (2018). Generalized seismic phase detection with deep learning. Bull. Seismol. Soc. Am. 108, 2894–2901. doi:10.1785/0120180080
Saad, O. M., Chen, Y., Siervo, D., Zhang, F., Savvaidis, A., Huang, G. D., et al. (2023). EQCCT: a production-ready EarthQuake detection and phase picking method using the Compact Convolutional Transformer. IEEE Trans. Geosci. Remote Sens. 61, 1–15. doi:10.1109/tgrs.2023.3319440
Sheen, D.-H. (2021). Analysis of the 2020 Haenam, Korea, earthquake sequence. Geosci. J. 25 (1), 33–42. doi:10.1007/s12303-020-0038-3
Sheen, D.-H., and Friberg, P. A. (2021). Seismic phase association based on the maximum likelihood method. Front. Earth Sci. 9, 699281. doi:10.3389/feart.2021.699281
Sheen, D.-H., Seo, K. J., Kim, S., Kim, B., Hong, Y., and Byun, A.-H. (2023). A rapid and automatic procedure for seismic analysis based on deep learning and template matching: a case study on the M 4.1 Goesan earthquake on October 29, 2022. J. Geol. Soc. Korea 59 (2), 345–354. in Korean with English abstract. doi:10.14770/jgsk.2023.010
Son, M., Cho, C. S., Choi, J.-H., Jeon, J.-S., and Park, Y. K. (2021). Spatiotemporal patterns of the 2020 Haenam earthquake sequence, South Korea: lineament and migration implying fluid-driven earthquake swarm. Geosci. J. 25 (1), 19–31. doi:10.1007/s12303-020-0043-6
Song, S.-G., Cho, C.-S., and Choi, J.-H. (2022). 2022 goesan earthquake report. Korea: Korea Institute of Geosciences and Mineral Resources, 1–25. in Korean.
Szegedy, C., Zaremba, W., Sutskever, I., Bruna, J., Erhan, D., Goodfellow, I., et al. (2013). Intriguing properties of neural networks. Available at: https://arxiv.org/abs/1312.6199 (Accessed July, 2023).
Tan, Y. J., Waldhauser, F., Ellsworth, W. L., Zhang, M., Zhu, W., Michele, M., et al. (2021). Machine-learning-based high-resolution earthquake catalog reveals how complex fault structures were activated during the 2016–2017 Central Italy sequence. Seismic Rec. 1 (1), 11–19. doi:10.1785/0320210001
Uchide, T., and Imanishi, K. (2018). Underestimation of microearthquake size by the magnitude scale of the Japan Meteorological Agency: influence on earthquake statistics. J. Geophys. Res. 123, 606–620. doi:10.1002/2017jb014697
van der Elst, N. J. (2021). B-positive: a robust estimator of aftershock magnitude distribution in transiently incomplete catalogs. J. Geophys. Res. 126, e2020JB021027. doi:10.1029/2020JB021027
Walter, J. I., Ogwari, P., Thiel, A., Ferrer, F., and Woelfel, I. (2021). easyQuake: putting machine learning to work for your regional seismic network or local earthquake study. Seismol. Res. Lett. 92, 555–563. doi:10.1785/0220200226
Wang, C.-Y., Huang, T.-C., and Wu, Y.-M. (2022). Using LSTM neural networks for onsite earthquake early warning. Seismol. Res. Lett. 93, 814–826. doi:10.1785/0220210197
Wang, R., Yang, D., Chen, Y., and Ren, C. (2023). Lighting up a 1 km fault near a hydraulic fracturing well using a machine learning-based picker. Seismol. Res. Lett. 94, 1836–1847. doi:10.1785/0220220340
Wiemer, S. (2001). A software package to analyze seismicity: ZMAP. Seismol. Res. Lett. 72 (3), 373–382. doi:10.1785/gssrl.72.3.373
Wilding, J., Zhu, Z., Ross, Z. E., and Jackson, J. M. (2022). The magmatic web beneath Hawai‘i. Sci. 379. doi:10.1126/science.ade5755
Withers, M., Aster, R., Young, C., Beiriger, J., Harris, M., Moore, S., et al. (1998). A comparison of select trigger algorithms for automated global seismic phase and event detection. Bull. Seismol. Soc. Am. 88, 95–106. doi:10.1785/bssa0880010095
Woo, J.-U., Kim, M., Rhie, J., and Kang, T.-S. (2020). Aftershock sequence and statistics of the 2017 Mw 5.5 Pohang, South Korea, earthquake: implications of fault heterogeneity and postseismic relaxation. Bull. Seismol. Soc. Am. 110 (5), 2031–2046. doi:10.1785/0120200059
Woo, J.-U., Rhie, J., Kim, S., Kang, T.-S., Kim, K.-H., and Kim, Y. H. (2019). The 2016 Gyeongju earthquake sequence revisited: aftershock interactions within a complex fault system. Geophys. J. Int. 217, 58–74. doi:10.1093/gji/ggz009
Woollam, J., Rietbrock, A., Bueno, A., and De Angelis, S. (2019). Convolutional neural network for seismic phase classification, performance demonstration over a local seismic network. Seismol. Res. Lett. 90, 491–502. doi:10.1785/0220180312
Yu, Z., and Wang, W. (2022). LPPN: a lightweight network for fast phase picking. Seismol. Res. Lett. 93 (5), 2834–2846. doi:10.1785/0220210309
Zhu, W., and Beroza, G. C. (2019). PhaseNet: a deep-neural-network-based seismic arrival-time picking method. Geophys. J. Int. 216 (1), 261–273. doi:10.1093/gji/ggy423
Zhu, W., McBrearty, I. W., Mousavi, S. M., Ellsworth, W. L., and Beroza, G. C. (2022). Earthquake phase association using a bayesian Gaussian mixture model. J. Geophys. Res. 127, e2021JB023249–5. doi:10.1029/2021JB023249
Keywords: seismic phase picking, deep learning, fine tuning, 2016 Gyeongju earthquake sequence, seismic hazard assessment
Citation: Hong Y, Byun A-H, Kim S and Sheen D-H (2023) Customization of a deep neural network using local data for seismic phase picking. Front. Earth Sci. 11:1306488. doi: 10.3389/feart.2023.1306488
Received: 03 October 2023; Accepted: 23 November 2023;
Published: 06 December 2023.
Edited by:
Tariq Alkhalifah, King Abdullah University of Science and Technology, Saudi ArabiaReviewed by:
Omar Aly, King Abdullah University of Science and Technology, Saudi ArabiaChong Xu, Ministry of Emergency Management, China
Copyright © 2023 Hong, Byun, Kim and Sheen. This is an open-access article distributed under the terms of the Creative Commons Attribution License (CC BY). The use, distribution or reproduction in other forums is permitted, provided the original author(s) and the copyright owner(s) are credited and that the original publication in this journal is cited, in accordance with accepted academic practice. No use, distribution or reproduction is permitted which does not comply with these terms.
*Correspondence: Dong-Hoon Sheen, ZGhzaGVlbkBqbnUuYWMua3I=
 Yoontaek Hong
 Ah-Hyun Byun
 Seongryong Kim
 Dong-Hoon Sheen