 Danruo Wu
 Zhidan Chen
 Mikhail Zimin
94% of researchers rate our articles as excellent or good
Learn more about the work of our research integrity team to safeguard the quality of each article we publish.
Find out more
ORIGINAL RESEARCH article
Front. Earth Sci., 10 January 2024
Sec. Geohazards and Georisks
Volume 11 - 2023 | https://doi.org/10.3389/feart.2023.1305519
This article is part of the Research TopicWomen in Science: Geohazards and Georisks 2022View all 8 articles
The Kepingtage fold-and-thrust belt in the southwestern Tian Shan in western China hosted the 2020 Mw 6.0 Jiashi earthquake with no apparent surface ruptures. The thrust nappe structure in this region is characterized by moderate-magnitude (Mw5.5-6.5) seismicity, but the seismogenic mechanisms and controlling factors remain under investigation. In this study, we utilized Sentinel-1A synthetic aperture radar satellite data to reconstruct the InSAR coseismic deformation field of the 2020 Jiashi earthquake. To address the limitation imposed by residual orbital phases during the interferometric measurement, we proposed a novel automatic method that combines ascending and descending track data with terrain features for orbit refinement. Eight comparative tests were conducted to prove the effectiveness of the proposed method. Subsequently, we inverted the jointly constrained deformation field after orbit correction to obtain the fault geometric parameters and slip distribution. Our results show that the 2020 Jiashi earthquake is characterized by right-lateral transpressive motion. The smooth interference fringes demonstrate spatially continuous surface uplift and subsidence without detectable coseismic surface ruptures, with a maximum uplift of ∼0.08 m and a maximum subsidence of ∼0.03 m, caused by the subsurface folding due to deep seismic rupture. This event is best fitted by a north-dipping fault plane with a depth of 4.2 km, a dip angle of 11.6°, and a strike of 276° beneath the Keping thrust fault. In terms of various geometric parameters of the fault, the inversion results of this study are generally similar to the focal mechanism solution provided by USGS (MWb), but are different from the focal mechanism solutions of other institutions and previous research results. Combined with the published geological investigations and seismic reflection surveys, we suggest that the seismogenic structure of the 2020 Jiashi earthquake is the lower ramp of the Keping thrust fault and the abrupt fault bend between the lower and upper ramp may limit the propagation of the coseismic rupture to the surface. The limited rupture of this event is dominated by the irregularities in fault geometry along strike and dip, as well as the lower rock strength of the cover above the detachment, which contribute to a deeper understanding of the seismic behavior in fold-and-thrust belts and the moderate-magnitude seismicity in the southwestern Tian Shan region.
The Tian Shan region (“Shan” means “mountains” in Chinese), situated in Central Asia, is a significant orogenic belt reactivated in the late Cenozoic (Molnar and Tapponnier, 1975; Yin et al., 1998), resulting from the remote effect of the collision between the Indian and Eurasian plates. The intense north-south crustal shortening has caused the rapid uplift of mountain ranges and the formation of a series of east-west thrust faults in the Tian Shan (Avouac et al., 1993; Yin et al., 1998; Yang et al., 2008; Wu et al., 2023). Meanwhile, the tectonically active areas have been undergoing the outward expansion from the central part to the adjacent basins (Song et al., 2006; Zhang et al., 2021). Along the southern margin of Tian Shan, multiple fold-and-thrust fault zones have developed between the Tian Shan orogenic belt and the Tarim Basin (Figure 1) (Molnar and Tapponnier, 1975; Yin et al., 1998). Among them, the Kepingtage fold-and-thrust belt (Kepingtage FTB), an imbricate thrust nappe structure, was formed due to thrusting of the sedimentary cover above the Precambrian basement of the Tarim Basin along the detachment (Figure 1) (Yin et al., 1998; Song et al., 2006; Yang et al., 2006). Seismic sequences suggest that the Kepingtage FTB is characterized by frequent moderate-magnitude (M 5.5-6.5) seismic events rather than by strong earthquakes (M ≥ 7.0) as observed in other regions of Tian Shan (Lü et al., 2021). These moderate sized events indicate a special seismogenic background in the southwestern Tian Shan, which has attracted widespread attention (Li et al., 2019; Yao et al., 2020; Lü et al., 2021). Some suggest that the fault geometric discontinuities or irregularities hinder the rupture process (Li et al., 2019; Lü et al., 2021), while others argue that the thin-skinned structures in this area restricts the rupture propagation of earthquakes (He et al., 2021a), which are responsible for the moderate-magnitude seismogenic characteristics. The lack of understanding of geological structures and seismogenic mechanisms limit the interpretation of moderate-magnitude seismicity in this region.
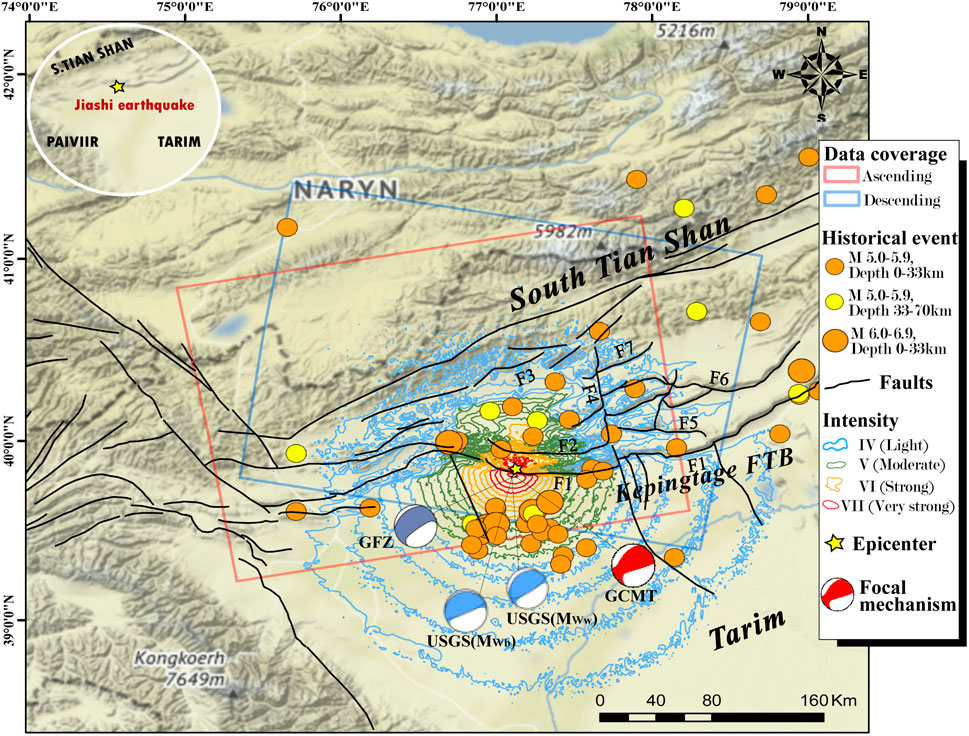
FIGURE 1. Regional tectonic background of the 19 January 2020 Jiashi earthquake. The yellow five-pointed star denotes the epicenter location of the 2020 Jiashi earthquake. Historical seismic events are earthquake catalog for the 1990–2019 period from the United States Geological Survey. The intensity data of the 2020 Jiashi earthquake were derived from the USGS National Earthquake Information Center. The focal mechanism solutions were derived from USGS, GCMT, CENC, and GFZ. Main active faults in the Kepingtage fault thrust belt at the southern front of Tian Shan: F1, Keping thrust fault; F2, Ozigertau thrust fault; F3, Kekebuke front thrust fault; F4, Piqiang strike-slip fault; F5, Tataiertage thrust fault; F6, Yimugantawu thrust fault; F7, Piqiangshan front thrust fault.
The 2020 Mw6.0 Jiashi earthquake provides a good example for understanding the seismogenic mechanisms and structural controls of the Kepingtage FTB in the southern mountain front of Tian Shan (Yao et al., 2020; He et al., 2021b). The epicenter of this event is located at the basin-mountain boundary between the southern Tian Shan and the Tarim Basin (Figure 1). The focal mechanism solutions from The U.S. Geological Survey (USGS), Global Centroid Moment Tensor (GCMT), China Earthquake Networks Center (CENC), and GFZ German Research Centre for Geosciences (GFZ) indicate predominately reverse slip occurred on either a shallow gentle plane dipping to the northwest, or on a steep plane dipping to the southeast (Table 1). Surface deformations and slip inversions using Interferometric Synthetic Aperture Radar (InSAR) observations prefer the shallow north-dipping plane with main thrust slips and slight strike-slip components (Yao et al., 2020; Yu et al., 2020). The seismic sequences and relocated aftershocks reveal a more complex thrust event, with deep basement-involved slips beneath the decollement (He et al., 2021a; Yao et al., 2021). Most studies suggest that the seismogenic structure of the Jiashi earthquake is the Keping thrust in the south leading edge of the Kepingtage FTB (Yao et al., 2020; Yu et al., 2020; He et al., 2021b; Yao et al., 2021; Zhang et al., 2021; Zhang et al., 2023). However, few studies reveal how surface deformation responds to deep coseismic slip (Yao et al., 2020; He et al., 2021a). No apparent surface rupture has been observed near the epicenter of the Jiashi earthquake (Wen et al., 2020), but InSAR monitoring reveals a continuous spatial distribution of surface uplift and subsidence (Yao et al., 2020; Yu et al., 2020; He et al., 2021b; Zhang et al., 2021), with the main deformation area observed in the north hanging wall of the Keping thrust (Wen et al., 2020; Yao et al., 2020; He et al., 2021a). Notably, there are no active faults or obvious surface ruptures in the transition area between uplift and subsidence (Wen et al., 2020). What is the relationship between deep coseismic slip and continuous surface deformation? What controlling factors are responsible for this continuously distributed surface deformation without identified surface ruptures? These issues are of great significance to unravel the seismogenic mechanisms and potential controls in the Kepingtage FTB and study the distinct seismogenic behaviors.
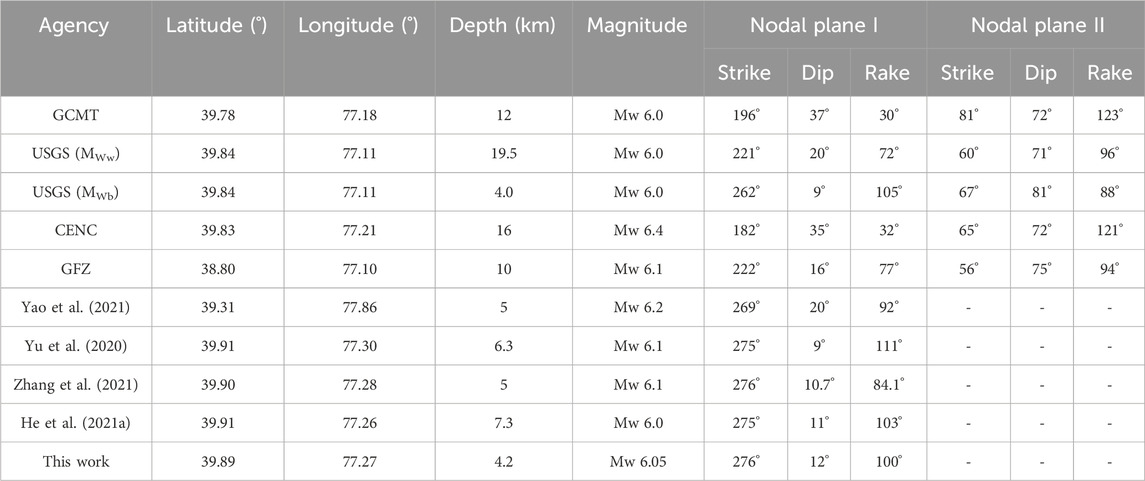
TABLE 1. Focal mechanism solutions of Jiashi earthquake.
In this study, we attempt to utilize the InSAR technology to invert the coseismic surface deformation of the 2020 Jiashi earthquake that enables us to obtain the geometric parameters of the seismogenic fault and its slip distribution. In processing InSAR data, one inevitable challenge is orbit refinement which involves using Ground Control Points (GCPs) to redefine baseline parameters, correct orbit parameters and phase offsets, and bring the orbit to its most accurate state. If the parameter information is not precise, it can affect the conversion from phase to deformation values. Currently, the most commonly used method to remove orbit errors is the polynomial method, which employs a polynomial to estimate a planar phase in both the azimuth and range directions (Li, 2014). The solution of polynomial coefficients requires multiple GCPs as known values. GCPs are usually manually extracted from SAR images. Due to the difficulty of identifying common points in SAR images, the quality of manually selected GCPs is highly correlated with the operator’s familiarity with SAR images, knowledge of the study area, and experience in SAR processing. Therefore, the process of selecting GCPs often requires repeated tests. Furthermore, obtaining the coseismic deformation field of an earthquake requires constraints from both ascending and descending track data. Coherence, position of residual topography and phase ramps and decorrelation vary under different observation geometries. This makes it more challenging to manually select GCPs that satisfy both ascending and descending interferometric pairs, introducing additional errors. Although field measurements and artificial corner reflectors can provide high-quality GCPs for InSAR processing, not all study areas allow field measurements or the installation of corner reflectors. Therefore, it is necessary to study new methods for selecting GCPs. To address this problem, we proposed a novel approach that combines ascending and descending track data with terrain features for automatic GCPs selection. This method enables us to improve the selection accuracy of GCPs to correct orbital status while avoiding tedious repeated tests. In addition, combined with the regional geological studies and seismic reflection data, the obtained InSAR coseismic deformation and kinematic information are utilized to reveal the seismogenic mechanism of the 2020 Jiashi earthquake and potential controls of the regional moderate-magnitude seismic hazards.
The Tian Shan orogen is one of the youngest intracontinental orogenic belts on Earth, extending for ∼2,500 km long from east to west and ∼300 km wide from north to south (Molnar and Tapponnier, 1975; Yin et al., 1998). The orogenic belt was formed on the remnants of the central Asian Paleozoic collisional orogeny (Xiao et al., 2015; Wu et al., 2023). During late Paleozoic-Mesozoic Tian Shan experienced series of collision and accretion of continental blocks and island arcs (Allen et al., 1993; Avouac et al., 1993; Yin et al., 1998). Since the Cenozoic, this belt has undergone intense crustal shortening and thickening in response to the far-field impact of collision between the Indian and Eurasian plates (Avouac et al., 1993; Yin and Harrison, 2000). Consequently, a series of subparallel thrust faults and east-west trending elongated mountain ranges were formed in the Tian Shan region since the late Miocene (Figure 1) (Charreau et al., 2009). GPS measurements indicate ∼20 mm/yr of crustal shortening rate across the Tian Shan orogen, accounting for roughly half of the India-Eurasia convergence (Wang et al., 2001; Zhang et al., 2004; Wang and Shen, 2020; Li et al., 2021; Wu et al., 2023).
The significant north-south crustal shortening across the Tian Shan orogen led to formation of series of thrust nappe structures along the northern and southern piedmonts of Tian Shan (Avouac et al., 1993; Yang et al., 2006). The Kepingtage FTB is a typical imbricated thrust nappe structure in southern Tian Shan, extending ∼300 km from east to west and 60–140 km from north to south (Figure 1) (Song et al., 2006; Yang et al., 2006; Yang et al., 2008). The belt consists of series of east-northeast-striking thrust faults and fault-related anticlines, which are interpreted as thin-skinned structures (Figure 1) (Yang et al., 2010). Seismic reflection profiles and balanced geological cross-sections suggest that these thrust faults converge to the same basement detachment of the Cambrian at a depth of 6–10 km (Yin et al., 1998; Yang et al., 2006; Yao et al., 2021; Li et al., 2022). Strata outcrop in elongated ridges in the hanging wall of each thrust exposed in the Kepingtage FTB are primarily Paleozoic and Cenozoic, with the absence of Mesozoic (Turner et al., 2010; Yao et al., 2020). The folded strata are in conformable or parallel unconformable contact, and mainly composed of Cambrian-Ordovician limestone and dolomite, Silurian sandstone, Devonian sandstone, Carboniferous sandstone, Permian limestone and Paleogene-Neogene sandstone and conglomerate (Yang et al., 2006; Yao et al., 2020; Wang et al., 2022). The NNW-trending left-lateral Piqiang fault is roughly perpendicular to the strike of the thrusts and divides the Kepingtage FTB into two (western and eastern) segments (Figure 1) (Yang et al., 2006; Turner et al., 2010; Li et al., 2022). GPS measurements estimated a total shortening rate of 4.0 ± 1.5 mm/yr across the Kepingtage FTB, the shortening rate in the eastern segment slightly greater than that in the western (Wang and Shen, 2020; Li et al., 2021; Wu et al., 2023). The late Quaternary crustal shortening rate of the foreland thrust system in the southern mountain front of Tian Shan is estimated to be 5–10 mm/yr (Yang et al., 2008).
The Keping thrust, the south leading thrust of the Kepingtage FTB, is deemed to be the seismogenic structure of the 2020 Mw6.0 Jiashi earthquake (Figure 1) (Yao et al., 2020; Yu et al., 2020; He et al., 2021b; Yao et al., 2021; Zhang et al., 2021; Wang et al., 2022; Zhang et al., 2023). The thrust fault has roughly east-west orientation and a length of ∼460 km. The plane of the fault dips to north and the dip angle varies from 30° to 70°, steep at the top and gentle at the bottom (Yu et al., 2020). The activity of the fault caused the Paleozoic thrust over the Cenozoic strata and formed an asymmetric anticline in the northern part of the thrust (Yang et al., 2008). In the deep structural level, the thrust merges northward into a detachment surface along the bottom of Cambrian with a depth of 5–9 km (Yang et al., 2008). Previous studies suggest that the coseismic deformation caused by the Jiashi earthquake is primarily distributed on the northern limb of the Keping thrust, between the Keping thrust and the Ozgertaou thrust (Yao et al., 2020; Yu et al., 2020; He et al., 2021a; Yao et al., 2021; Zhang et al., 2021; Wang et al., 2022). The coseismic deformation of the earthquake is predominated by vertical deformation, with a maximum vertical displacement of ∼90 mm (Yao et al., 2020; Yu et al., 2020; He et al., 2021b; Zhang et al., 2021; Wang et al., 2022).
Sentinel-1 Satellite Constellation is a part of the European Copernicus program’s Earth observation satellite system, which is equipped with advanced C-band synthetic aperture radar and provide all-weather, day-and-night imaging of the Earth’s surface. With its advantages of high resolution (5 m x 20 m), short revisit periods (6 or 12 days), and the capability for extensive monitoring (>250 km), it has wide applications in terrain mapping as well as surface deformation monitoring for phenomena such as volcanoes, landslides, and earthquakes. This study utilized four pre- and post-earthquake Sentinel-1A images with good spatial-temporal coherence in ascending and descending orbits to acquire the coseismic deformation field of the Jiashi earthquake. Based on that, the inversion of fault parameters and the slip distribution of fault were further conducted, with the parameter information of the data shown in Table 2. These data were collected using the highly advanced TOPSAR (Terrain Observation with Progressive Scans Synthetic Aperture Radar) scanning technique under the Interferometric Wide (IW) imaging mode. The characteristic of this technique is to form image bursts as the imaging basis in the azimuth direction, with overlapping regions between adjacent swaths and bursts, ensuring data continuity. On the other hand, the IW imaging mode sacrifices a certain azimuth resolution, and the TOPSAR technique partially compensates for the deficiency in obtaining effective azimuth deformation due to excessively low azimuth resolution (Jung et al., 2013).
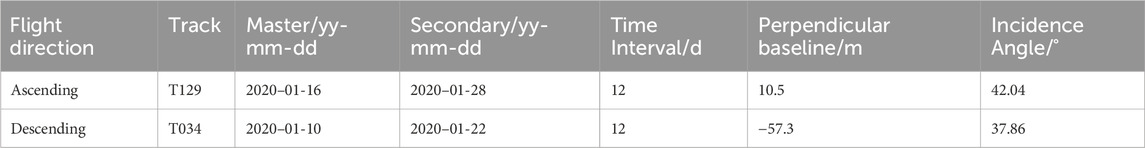
TABLE 2. Sentinel-1 synthetic aperture radar (SAR) image characteristics.
First, Precise Orbit Ephemerides data are used to register the image data. Before obtaining the interferogram via conjugate multiplication of the master and slave images, registered images are subjected to multi-looking processing with azimuth 1 and range 4 to reduce noise errors. The Shuttle Radar Topography Mission (SRTM) digital elevation model (DEM) terrain data, provided by NASA at 30 m resolution, is employed to simulate and eliminate terrain phase (Rabus et al., 2003). To enhance the clarity of interferometric fringes and reduce incoherence noise caused by temporal and spatial baselines, Goldstein filtering is selected for filtering (Goldstein and Werner, 1998), the filter window size is 32 x 32. Additionally, the GCPs obtained from the proposed automatic GCPs selection method in this paper are used for polynomial fitting to correct phase offset and eliminate phase ramp (Section 3.2). Then the phase unwrapping is performed using the minimum-cost flow method based on the Delaunay triangulation. This method’s advantage lies in its consideration of all pixels, particularly in regions with significant low coherence. Finally, utilizing SAR satellite parameters to convert phase into displacement and transforming SAR coordinates to the WGS-84 coordinate system through geocoding, we obtain the coseismic deformation field of the Jiashi earthquake.
To better observe deformation in different directions, the coseismic deformation field was decomposed from the radar line-of-sight into vertical and horizontal components. Since it is difficult to directly invert three-dimensional changes under two-dimensional observations of SAR, coupled with the limitations of InSAR observations in sensitivity and error impact on deformation, the stability of solving in the north-south direction is the weakest, followed by the east-west direction, the vertical direction provides the most accurate results (Wang et al., 2014). To address this, we simplified the process to solve for deformation in the vertical and east-west directions. The construction of the line-of-sight deformation
In the equations,
Therefore, based on Eqs 2, 3, we can derive the deformation components in the vertical and east-west directions:
We proposed a method for automatic Ground Control Points (GCPs) selection that combines ascending and descending track data with terrain features. Given that earthquakes often occur in mountainous regions with significant topographic variations, the selection of GCPs should consider avoiding areas with steep terrain. To achieve this, the first step involves segmenting the study area based on its terrain characteristics. Following the ridge and channel point identification algorithm proposed by Chen and Liu (2001), we extract ridge points, channel points, and mountain pass points within the study area. The algorithm employs a moving window approach, where the current data point serves as the center of the window. A local window of size (2k+1) x (2k+1) (where k=1,2, … ,5) is established. For a given elevation value z (i,j) at the current data point within the window, if it satisfies any of the conditions in Eqs 6–9, it is considered a ridge point. Similarly, if it satisfies any of the conditions in Eqs 10–13, it is categorized as a channel point. If the elevation value satisfies any condition from Eqs 6–9 along with any condition from Eqs 10–13, it is identified as a pass point. In formulas, “1 ≤
Previous research has demonstrated that the phase derivative variance function reliably reflects the quality of wrapped phase (Ghiglia and Pritt, 1998). In regions of the interferometric phase map where no residual points exist, the phase shows continuous variation. The presence of residual points indicates loss of coherence or abrupt changes in terrain leading to phase discontinuities. The definition of the phase derivative variance function is as follows:
In the equation,
Furthermore, GCPs should be located in regions with relatively high coherence. The coherence coefficient serves as a measure of the interferometric coherence, with values ranging between 0 and 1. A higher value indicates greater similarity between images and better quality of interferometric fringes. When dealing with two SAR complex images, the estimation of the coherence coefficient involves selecting an appropriate window of size m x n. The coherence coefficient approximation value
In the equation,
In summary, the fundamental concept behind the automatic Ground Control Points (GCPs) selection method that combines ascending and descending track data with terrain features is as follows: Using an 11 x 11 template, traverse through the entire interferogram of both ascending and descending tracks, calculating the phase derivative variance. This helps obtain continuous regions in both interferograms, which are then binarized. By taking the intersection of these regions, the common continuous areas for both observation geometries are extracted. The choice of the template size should not be too small or too large. If it is too small, the extracted phase may not be far enough from the deformation area and could be fragmented. Conversely, if the template is too large, the continuous regions extracted might be too few. As GCPs are best evenly distributed throughout the study area and ideally numbering more than 20, the entire study area is divided into 6 x 6 large blocks. The connected regions within each block are ranked in descending order based on their areas. Those exceeding an area ratio threshold are marked as candidate areas. However, each block cannot have more than 3 candidate areas. If one block has more than 3 candidate areas, the next connected region is considered. This approach extracts the larger connected regions within each block, preventing larger connected regions from being overlooked and ensuring even GCPs distribution. Subsequently, within the candidate areas, the point with the highest coherence sum is located. Nevertheless, the highest coherence sum might be the outcome of a single coherence value being excessively high. To avoid this, thresholds are set to constrain the ascending and descending coherence values. A coherence threshold of 0.5 is employed, meaning the coherence of both ascending and descending tracks must exceed 0.5. Finally, terrain features are extracted from the Digital Elevation Model (DEM), categorizing the study area’s terrain into ridge points, channel points, and pass points. Only points situated within channels and pass are considered as GCPs. The overall method flow is depicted in Figure 2.
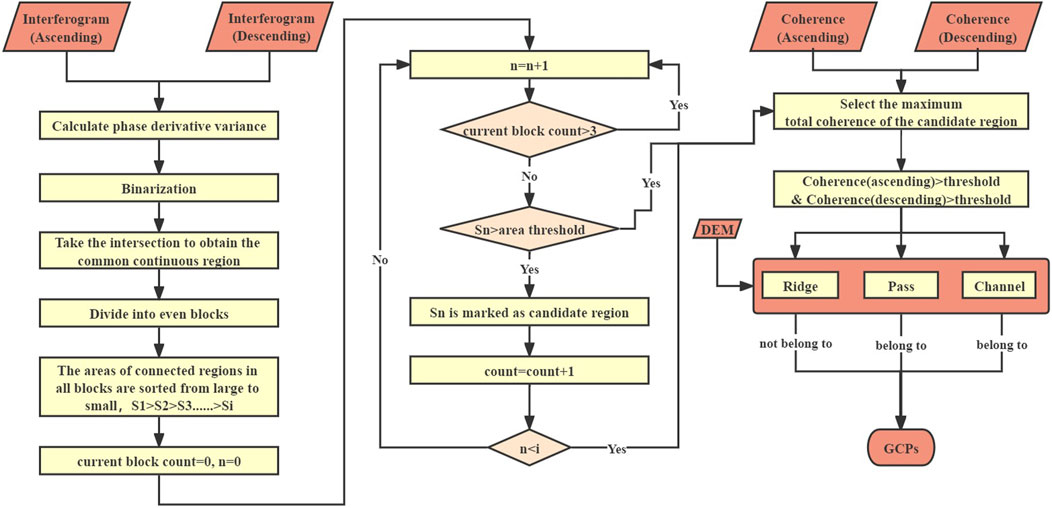
FIGURE 2. Process of Automatic ground control points (GCPs) selection method.
The coseismic deformation field of this earthquake was obtained using ascending and descending track data from Sentinel-1A, along with the two-pass differential interferometric measurement method. The processing of the experimental data was primarily carried out using the SARSCAPE commercial software platform (SARMAP, 2014). The method that combines ascending and descending track data with terrain features for automatic Ground Control Points (GCPs) selection was implemented on the MATLAB computational and programming software platform. The selected GCPs are depicted in Figure 3.
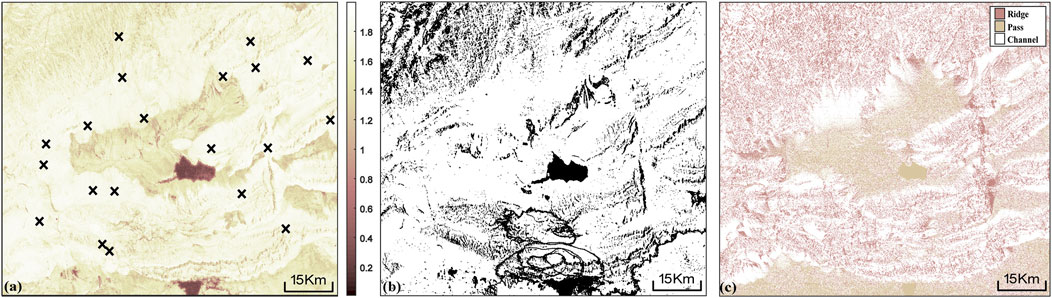
FIGURE 3. The automatic Ground Control Points (GCPs) selection method that combines ascending and descending track data with terrain features. (A) The coherence map of the ascending and descending track data, with values ranging from 0 to 2. The black cross symbols represent the selected GCPs. (B) Phase continuity mask, where the white areas indicate continuous phase. (C) Terrain features of the study area.
The Root Mean Square Error (RMSE) of the ascending track data is 10.0 m, and that of the descending track data is 9.4 m. RMSE is calculated from the elevation values of ground control points (GCPs) and the elevation values provided by the corresponding interferometric phases. A value between 2 and 10 indicates a highly reasonable selection of GCPs positions, and the refined orbit results are satisfactory (SARMAP, 2014). The mean differences after removing the residual refinement (rad) for the ascending and descending track data are 0.009 and 0.007 respectively, with standard deviation after remove residual refinement (rad) being 0.058 and 0.32 respectively. This indicates a precision in the refined results.
The distribution pattern of interferometric fringes is shown in Figures 4A, B. In both the ascending and descending track deformation fields of this earthquake, there are two elliptical-shaped deformation centers in the north and south. A west-east trajectory line runs through the middle of the deformation field. The span of the EW direction of the entire deformation field is approximately 40 km, and in the SN direction it is around 20 km. The reverse color sequence in the north-south deformation centers represents opposite deformation values. The northern region shows subsidence, while the southern shows uplift. The interference fringes are denser in the southern region, indicating larger deformation values in the south compared to the north. The overall coherence of the interferogram is relatively high, except for the areas of Xike’er reservoir in the south of the Keping fault and Xiao’er Kule Salt Lake in the north of the Ozigertau fault, where incoherence is observed. The interference fringes between the northern and southern deformation areas transition smoothly, suggesting that the seismic rupture has not reached the surface. The radar Line of Sight (LOS) deformation fields for the ascending and descending tracks are concentrated within the folds between the first-order thrust body (Keping fault) and the second-order thrust body (Ozigertau fault) (Figures 4C, D), both associated with the Kepingtag imbricate thrust structure. The deformation trend is similar for the two tracks, indicating dominant vertical movement. This is further evidenced in the vertical and east-west components of the deformation fields (Figures 4E, F). With east defined as positive, the east-west decomposition of the deformation field shows westward movement in the southern deformation area and eastward movement in the northern deformation area, accompanied by dextral motion. Deformation results from profiles across different locations in the deformation field (Figures 4G, H) show that in the ascending track results, the LOS experiences a maximum uplift of approximately 0.065 m and a maximum subsidence of about 0.031 m. In the descending track results, the LOS experiences a maximum uplift of around 0.06 m and a maximum subsidence of about 0.022 m. The vertical deformation range is approximately 0.03–0.08 m. East-west deformation is smaller than vertical deformation, with values not exceeding 0.03 m, whether eastward or westward. This reflects that the primary movement of the seismogenic fault in this earthquake is characterized by vertical displacement.
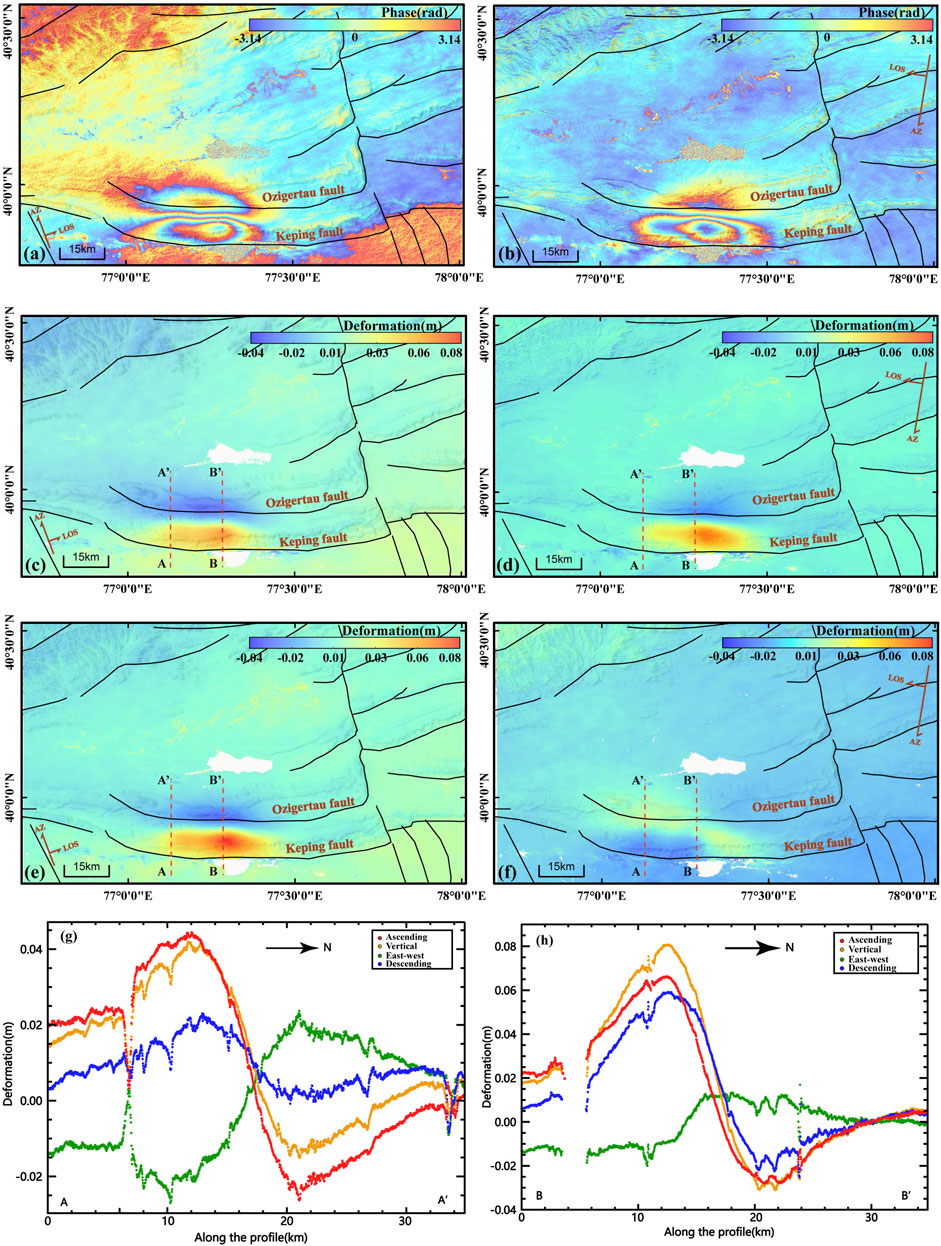
FIGURE 4. Deformation fields associated with the 2020 Ms 6.4 Jiashi earthquake from Sentinel-1 SAR interferograms. (A) and (B) show interferograms (before orbit refinement) from ascending and descending tracks, respectively. The positive values indicate that the earth’s surface moves toward the LOS direction. (C, D) show the ascending and descending LOS coseismic deformation maps, respectively. (E, F) are the decomposed deformation fields, (E) is the vertical direction: positive values upward, negative values downward, (F) is the east-west direction, positive values eastward, negative values westward. (G) and (H) display the deformations along the northsouth profiles AA’ and BB’, respectively.
In the absence of prior information about the seismic source, the uniform slip model is adopted as the fault model. This model assumes that the earthquake is caused by sliding along a single fault plane. The seismic fault plane is a rectangular surface embedded within a homogeneous and isotropic elastic half-space. The slip amount and rake on the seismic fault plane are both uniformly distributed (Okada, 1985). Due to the numerous unknown parameters (i.e., source parameters) that need to be determined, the inversion process can be transformed into a nonlinear parameter estimation problem. The nonlinear functional relationship between the surface deformation and the parameters of the uniform slip source to be determined is as follows (An and Yang, 2023):
In the equation,
The nonlinear inversion is based on the Levenberg-Marquardt least-squares minimization algorithm (Marquardt, 1963). Its key is to use the model function f to make a linear approximation of the parameter vector
Where
thereby
If
Initially, a uniform slip model is employed to perform nonlinear inversion for the geometric parameters of the seismogenic fault, including its location, source depth, strike, and dip. To preserve more deformation details while reducing data redundancy, a uniform sampling method was employed to downsample the observed values from the ascending and descending tracks before conducting nonlinear inversion (Lohman and Simons, 2005). In the near-field region, the sampling interval was set to 500 m, while in the far-field region it was set to 2000 m. After downsampling, a total of 5,496 observed values from the ascending track and 4,707 observed values from the descending track were obtained. Subsequently, the ascending and descending track deformation observations are used as constraint conditions. The source parameters are initialized using the earthquake mechanism solutions provided by Global-CMT. Through iterative adjustments and optimization of the parameter space, the optimal geometric parameters of the fault are determined. Because similar ground deformation patterns can be generated by ruptures of a fault striking east or west and dipping either southward or northward (Table 1), we set the two possible fault plane configurations as initial fault models. The results indicate that the observed surface deformation can be fitted by either a northward dipping fault with a depth of 4.21 km, a dip angle of 11.62°, and a strike of 275.99°, or a southward dipping fault with a depth of 4.18 km, a dip angle of 81.82°, and a strike of 79.46°. Geological studies suggest that the Kepingtage fold-and-thrust belt generally tilts to the north, and there is no evidence of a high-angle south-dipping fault in the region (Song et al., 2006; Yang et al., 2006; Yang et al., 2008; Turner et al., 2010; Li et al., 2022). Therefore, we favor the use of a low-angle north-dipping fault as the seismogenic fault. Figure 5 shows fault parameters derived by uniform slip inversion.
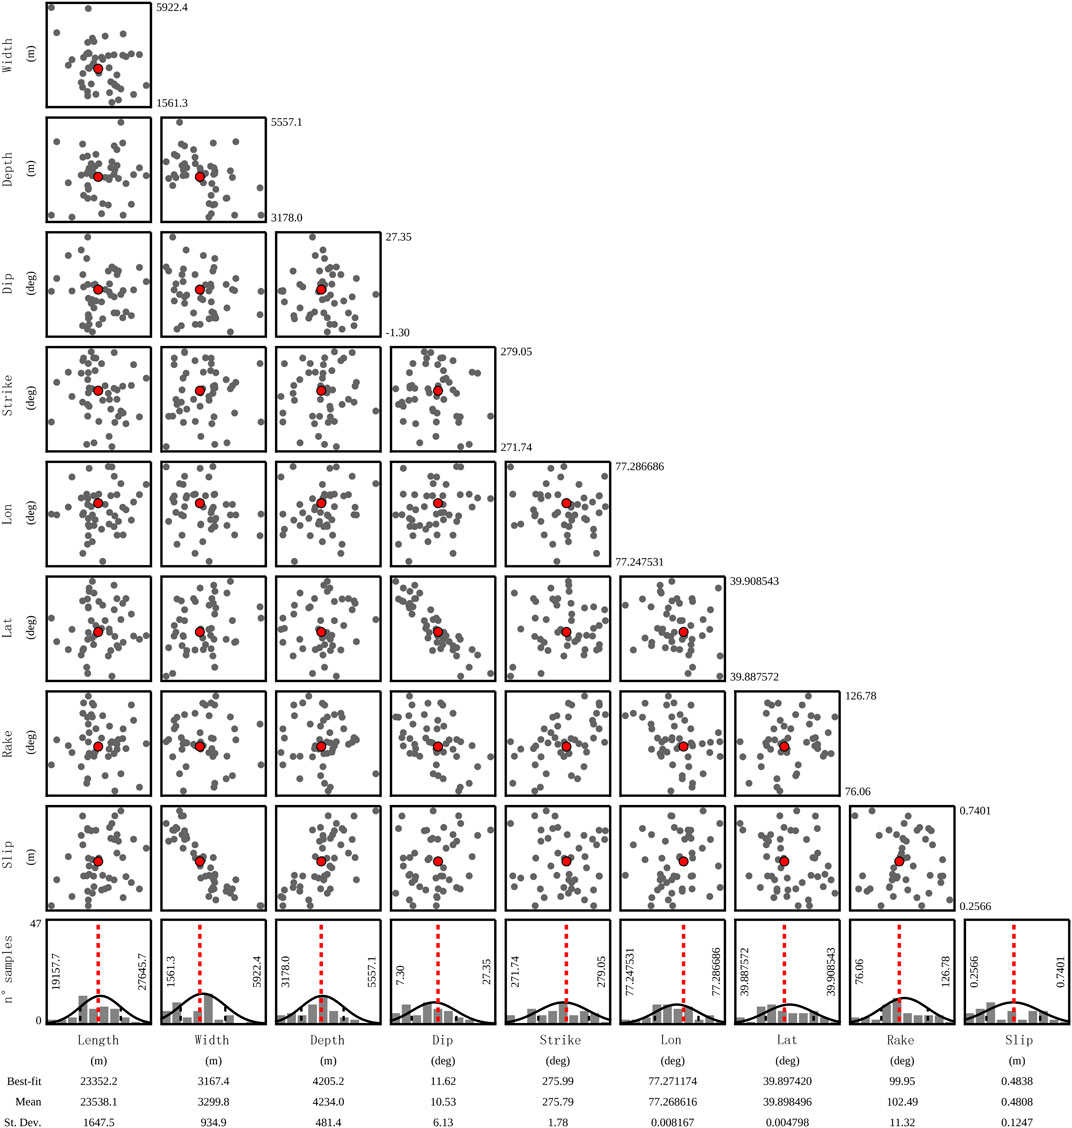
FIGURE 5. Scatter plots of trade-offs between parameters and the standard deviation of every free parameter.
Given the determined geometric parameters of the fault, the slip distribution on the fault plane was linearly related to the deformation data, allowing for a solution through linear inversion, the linear observation equation can be expressed as (Zhang et al., 2023):
Where: “d” represents the Line of Sight (LOS) displacement observed in InSAR. “G” is the Green function that relates predicted displacements to slip on the unit fault model. “m” denotes the slip amounts on the sub-faults. “k2” is the smoothing factor. “D” corresponds to the finite-difference approximation of the Laplacian operator, “ɛ” stands for the observation error.
To obtain a more detailed slip distribution of fault plane, based on the geometric parameters of the uniform slip source obtained through nonlinear inversion, a distributed slip model is constructed that is fixed in position, with a dip angle of 11.62° and a strike of 275.99°. The length of fault plane, obtained from the uniform slip model inversion, is extended to 30 km, and the width is extended to 20 km. This extended fault plane was divided into 600 sub-faults, with each sub-fault having an area of 1 km2. We assigned equal weights to the ascending and descending InSAR datasets used to constrain the model. By performing linear inversion, the slip distribution on the fault plane of the Jiashi earthquake is obtained (Figure 6). Results show that the prominent sliding area is approximately 20 km in length and 8 km in width, located at depths of 4–6 km. The prominent sliding area is approximately 20 km in length and 8 km in width, located at depths of 4–6 km. The aftershocks within 20 days after the earthquake are also distributed mainly within this area. At a location with coordinates 39°54′N and 77°18′E and a depth of approximately 4.2 km, a peak slip of up to 0.48 m is observed. The calculated Geodetic Moment is 1.34 x 10^18 N·m, corresponding to a magnitude of Mw 6.05. This magnitude is nearly consistent with the magnitudes reported by both USGS and GCMT. The detailed distribution of fault plane slip indicates that the Jiashi earthquake was a strong event controlled by the southward thrusting action of the southern Tian Shan orogenic belt. The primary movement was southward, with a minor right-lateral component.
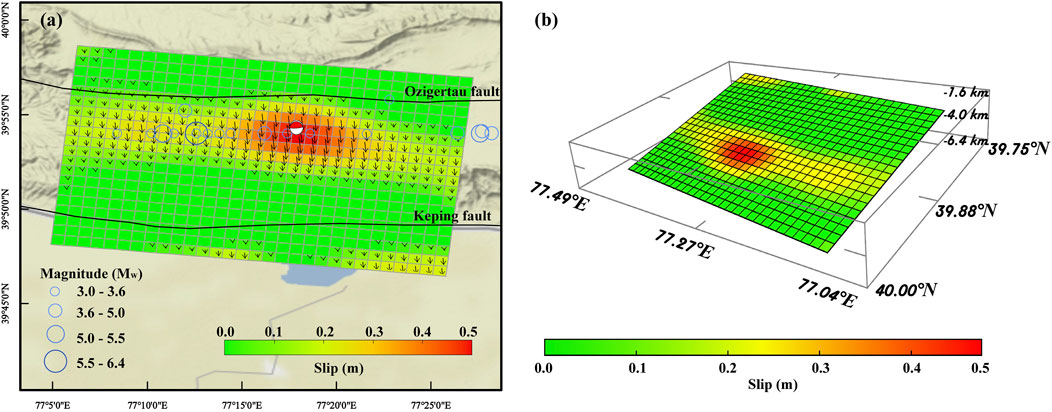
FIGURE 6. Slip distribution from joint InSAR ascending and descending observations. (A) The 3D visualization of the slip distribution. (B) The 2D view slip distribution. Blue circles indicate earthquakes that occurred within 20 days after the Jiashi earthquake. The slip direction of the coseismic deformation field is indicated by black arrows. The size of the arrow represents the amount of sliding. The red beach balls show the focal mechanism solution inverted by the InSAR ascending and descending data.
From Figure 7, it can be observed that the modeled ascending and descending track deformation fields closely match the observed deformation field in terms of distribution pattern and motion characteristics. The maximum uplift and subsidence values observed in the ascending track are 0.06 and −0.03 m, respectively, while the corresponding modeled values are 0.05 and −0.02 m. The residuals between the observed and modeled values range within −0.02–0.03 m. For the descending track observations, the maximum uplift value and maximum subsidence value are 0.06 and −0.02 m, respectively. The corresponding modeled results are 0.06 and −0.01 m, with residuals ranging from −0.03 to 0.02 m. Overall, the residuals in the deformation area are small, mostly fluctuating within the range of −0.01 to 0.01 m. In the southernmost region of the map, which corresponds to the transitional zone between the Keping thrust belt and the Tarim Basin with significant topographical variations, larger residuals are observed. This demonstrates that the modeled ascending and descending track deformation fields closely match the observed deformation field in terms of deformation amplitude, which reinforces the reliability of the inversion results presented in this study.
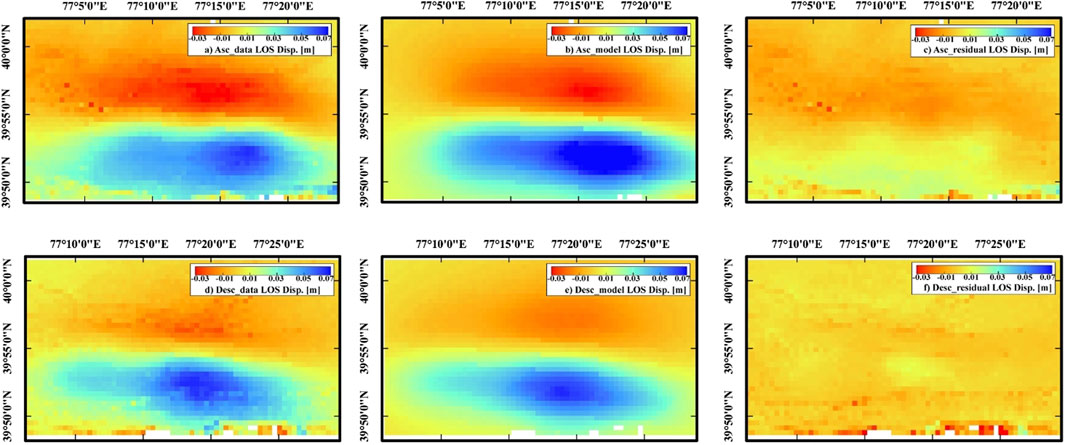
FIGURE 7. Observed, modeled, and the residual maps based on distributed sliding model for the ascending (top row) and the descending tracks (bottom row).
In order to evaluate the effectiveness of the proposed automatic GCPs selection method, we conducted eight tests involving manual GCPs selection as a comparison. Due to the limitations in SARSCAPE, which only allows simple judgment based on a single interferogram or a single coherence map to identify the locations of potential GCPs and considering the limited number of control points discernible to the naked eye, 10 GCPs were selected for each test and located as far as possible in regions of high coherence and stable phase (Figure 8). Subsequently, calculations and statistics were performed using the method outlined in this section. Table 3 displays the distribution of the selected GCPs across different categories and the RMSE for both ascending and descending track data in each test, with the test numbers arranged in ascending order of RMSE values.
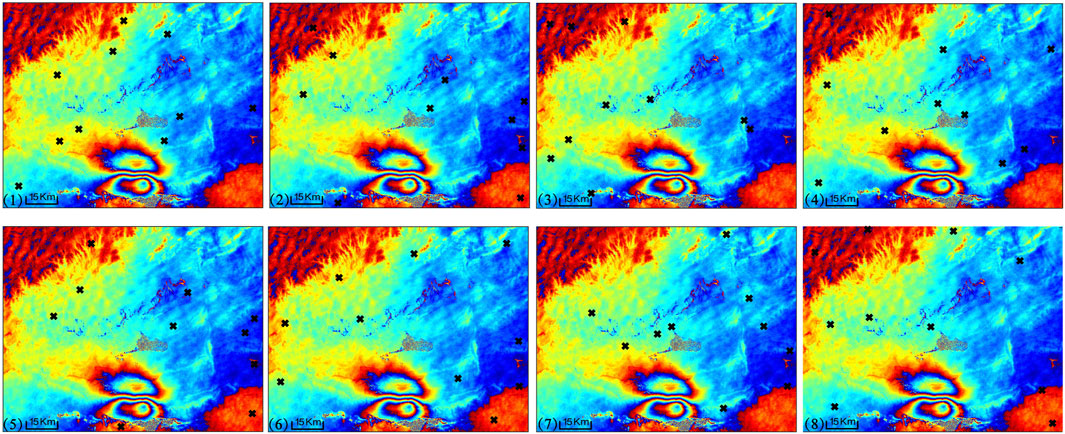
FIGURE 8. Eight tests of manually selecting ground control points. The black intersection points represent the positions of ground control points, and the background is the ascending differential interferogram without orbit refinement. (1–8) correspond to tests (1–8) in Table 3 respectively.
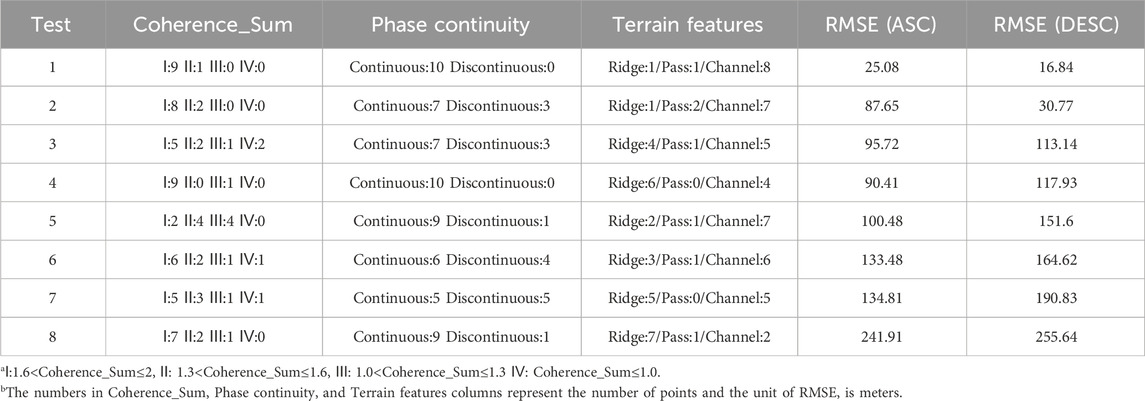
TABLE 3. Comparison of different manually selected ground control points.
From Table 3, it can be seen that manually selecting GCPs based solely on a single-track interferogram or single-track coherence still involves a certain degree of subjectivity, leading to diversity in the situations where GCPs are located. The eight tests indicate that factors such as total sum of coherence, phase continuity, and terrain features can influence the RMSE in the orbit refinement process. For example, among the 8 tests, the location selection of GCPs in test 1 is optimal, and 9 GCPs are in category I, all GCPs are located at phase stable locations and only one GCP is mistakenly selected at the ridge, which makes the orbit refinement result of test 1 have the smallest RMSE. Test 4 has a similar situation to test 1 in terms of coherence and phase continuity, but too many GCPs falling on the ridge resulted in poor refining results. Although test 2 and test 3 both have 7 points located in the phase continuous area, test 2 has more advantages in terms of coherence and topography. Compared with tests 6, 7, and 8, test 5 shows that GCPs perform very poorly in terms of total coherence. Only 2 GCPs belong to Category I and 4 GCPs are classified into Category III. However, 9 GCPs are located in phase stable areas and there are 8 points located on the gentle terrain. The advantages of phase and terrain make the RMSE smaller than the latter. In addition, the degree of impact on ascending and the descending track data is also different, which is reflected in the significant difference in the RMSE of the refined results in test 2 and test 5 between the ascending and descending track data, with the RMSE difference exceeding 50 m.
On the whole, the greater the number of GCPs with high total sum of coherence, continuous phase, and topography of pass and channel, the more conducive to the formation of a small RMSE. Table 4 illustrates the situation of GCPs finally extracted from this Jiashi earthquake study using the proposed automated method, demonstrating that the selected GCPs not only maintain phase continuity and a smooth terrain but also ensure high coherence locations in both ascending and descending track data. In comparison to the repeated trials required for manually selecting GCPs, the automated method significantly improves efficiency while improving the accuracy of orbital refinement results.
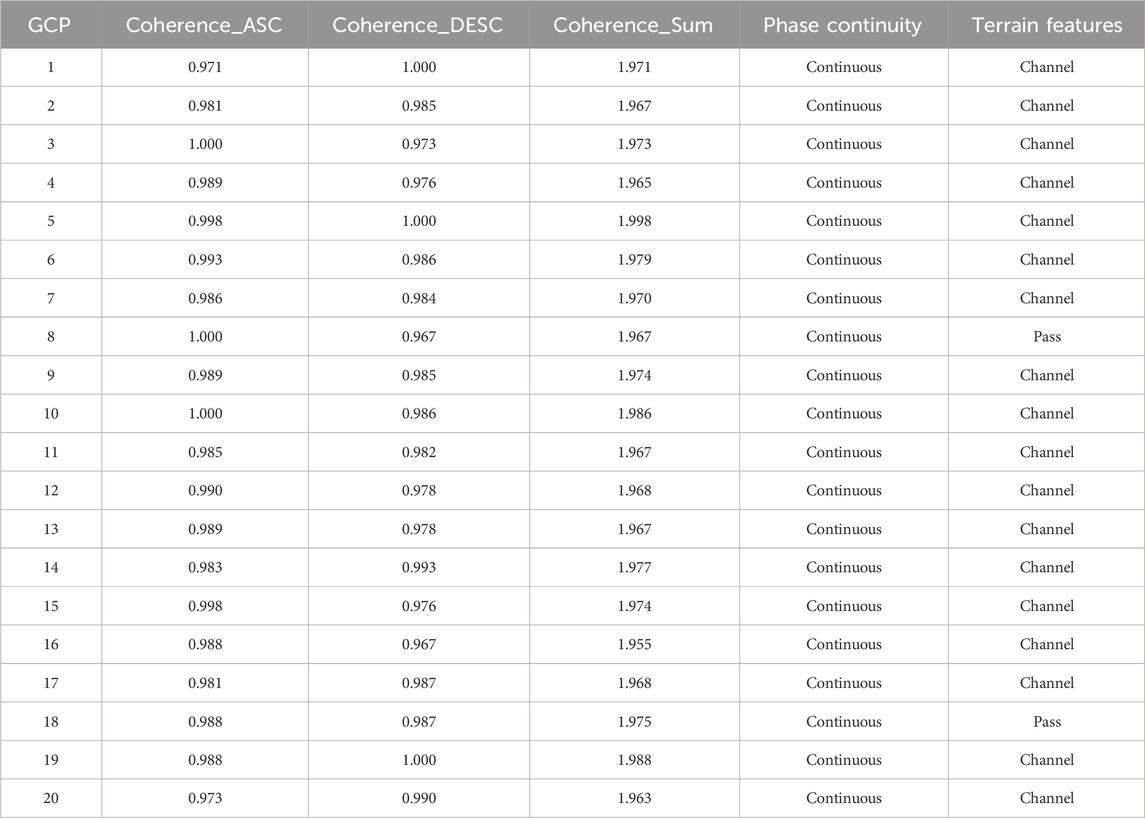
TABLE 4. GCPs selected by the method proposed in this article.
The InSAR coseismic deformation field in this study shows that the 2020 Jiashi earthquake is predominated by vertical deformation, with right-lateral component. The deformation range is approximately ∼40 km long from east to west and ∼20 km wide from south to north and can be divided into two different deformation parts: subsidence in the northern part and uplift in the southern part. The maximum uplift can reach up to ∼0.08 m and the maximum subsidence is about 0.03 m (Figures 4G, H). The interference fringes are continuously smooth, which suggests that there is no observed surface rupture in the deformation field. Meanwhile, no existing active fault has been reported previously in the transition area between surface uplift and subsidence (Deng et al., 2003; Wen et al., 2020), indicating the continuous surface uplift and subsidence caused by the Jiashi earthquake probably resulted from the subsurface folding due to deep coseismic rupture. In addition, the right-lateral displacement, with a maximum of ∼0.025 m, is significantly smaller than the vertical deformation, (Figures 4G, H). The coseismic displacement in horizontal direction has been neglected in previous studies (Yao et al., 2020; Yu et al., 2020; He et al., 2021a; Yao et al., 2021; Zhang et al., 2021; Wang et al., 2022; Zhang et al., 2023), but the observed horizontal displacement in this study demonstrates that the strike-slip motion is partially accommodated by the fold-and-thrust belts at the southern frontal margins of the Tian Shan except for the high-angle active faults within the mountain ranges (Wu et al., 2023).
The coseismic deformation field reveals that the deformation area is mainly distributed in the southern margin of the Kepingtage FTB and covers two important thrust faults, the Keping fault and Ozigertau fault (Yao et al., 2020; Yu et al., 2020; He et al., 2021b; Yao et al., 2021; Wang et al., 2022; Zhang et al., 2023). The surface uplift area is primarily located between the Keping fault and the Ozigertau fault, and the subsidence area is largely distributed on the northern side of the Ozigertau fault and partially on the southern side. Seismic reflection profiles and geological mapping studies suggest that the southern Tian Shan area where the Jiashi earthquake occurred is characterized by low-angle thrusting and folding due to the crustal north-south compression (Figure 9A) (Yin et al., 1998; Yang et al., 2006; Turner et al., 2010; Li et al., 2016; Yao et al., 2020; Li et al., 2022). Whether the fold-and-thrust belts are responsible for the seismogenic process of the 2020 Jiashi earthquake depends on the consistency between the deep rupture area of the earthquake and the geometry of thrust faults.
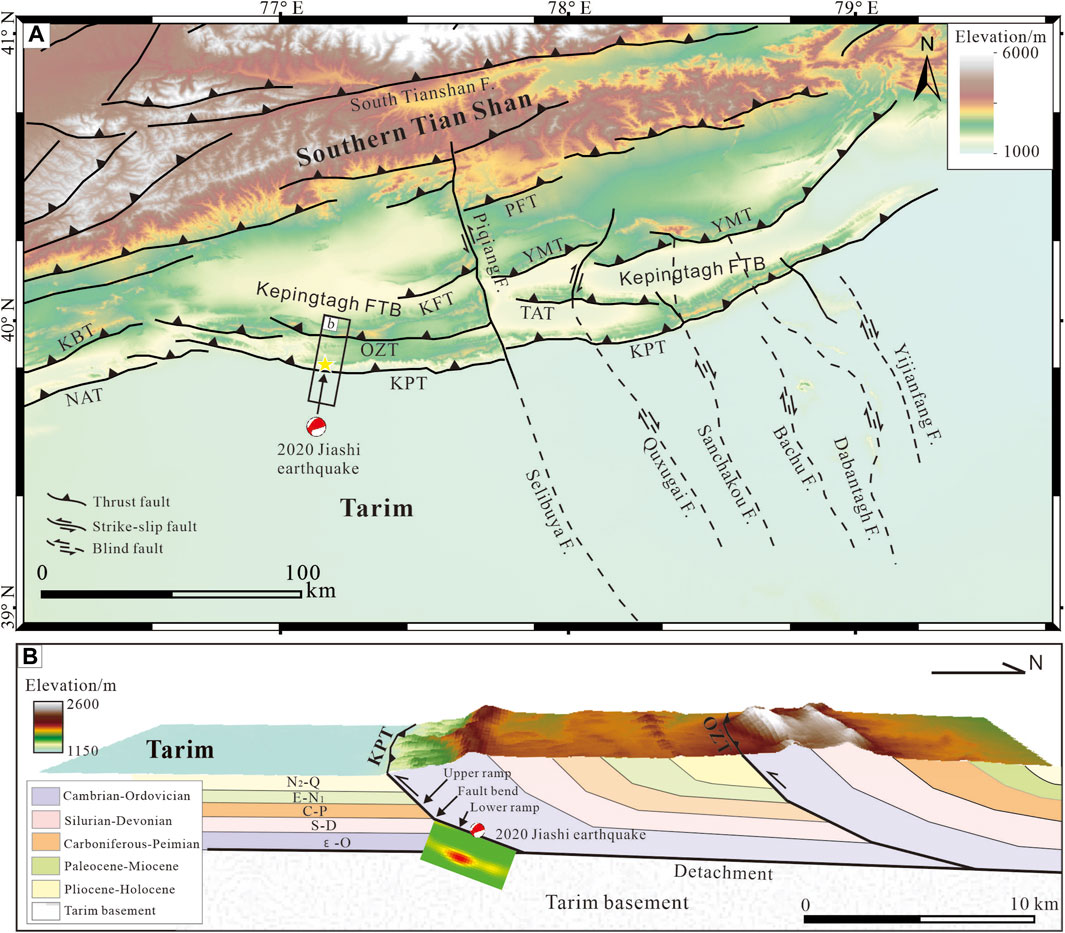
FIGURE 9. The seismogenic structure of the 2020 Jiashi earthquake. (A) Topographical map showing active faults in the Kepingtage FTB and the location of the 2020 Jiashi earthquake (modified from Li et al., 2021). The Kepingtage FTB consists of a series of east-west fold-and-thrust belts that extend from north to south along the same detachment (Yang et al., 2006; Lü et al., 2021). (B) The cross section across the Jiashi earthquake area showing the fault structures, stratigraphy, seismogenic structure and sliding distribution of the 2020 Jiashi earthquake (modified from Yao et al., 2020). Abbreviations of thrust fault names: KBT, Kashi basin thrust fault; KFT, Kekebuke front thrust fault; KPT, Keping thrust fault; NAT, Northern Atushi thrust fault; OZT, Ozigertau thrust fault; PFT, Piqiangshan front thrust fault; TAT, Tataiertage thrust fault; YMT, Yimugantawu thrust fault.
To understand the deep sliding distribution of the 2020 Jiashi earthquake, this study further inverted the geometric parameters of the seismogenic fault plane based on the InSAR coseismic deformation field. The focal mechanism solutions from seismic organizations (e.g., USGS, GCMT, CENC, GFZ) and previous studies indicate that either a south-dipping reverse or a north-dipping fault may cause the similar deformation pattern of the 2020 Jiashi earthquake (Yao et al., 2020; Yu et al., 2020; He et al., 2021a; Zhang et al., 2021). Our results suggest that the seismogenic structure of the Jiashi earthquake is more likely to be a north-dipping fault plane with a depth of 4.2 km, a dip angle of 11.6°, and a strike of 276° beneath the Keping thrust fault. The derived geometric parameters most closely correspond with the focal mechanism solution provided by USGS (MWb) (Table 1). The geological studies and seismic reflection profiles on the Kepingtage FTB demonstrate that the Keping fault dips to the north with lower angle in the deeper crust (Figure 9B) (Yin et al., 1998; Song et al., 2006; Yang et al., 2006; Yang et al., 2008; Turner et al., 2010; Li et al., 2016). The Kepingtage FTB consists of a series of east-west fold-and-thrust belts that extend from north to south along the same sliding detachment that is located 5–9 km below the surface, shallow in the south and deep in the north (Figures 9A, B) (Yang et al., 2006; Lü et al., 2021). When the Keping fault plane extends upwards, the dip angle increases, and the fault surface plane can be divided into two parts: the lower ramp and the upper ramp. The lower ramp has a dip of
The Jiashi region at the southwestern front of the Tian Shan is characterized by frequent moderate-magnitude seismicity instead of strong seismicity within the Tian Shan mountain ranges. From 1997 to 2000, nine events Ms ≧ 5.5 earthquakes and two of them with Mw ≧ 6.0 earthquakes occurred in the southwestern Tian Shan (Huang et al., 2016; Yao et al., 2020; Lü et al., 2021). In 2003, a Mw 6.2 earthquake occurred in this region (Yao et al., 2020). The 2020 Jiashi event is another moderate-magnitude earthquake that damaged the Jiashi region. What factors are responsible for these moderate events in the Jiashi region? Previous studies mainly attributed this to discontinuities or irregularities of the fault geometry that hinder the propagation of the ruptures and define the seismic magnitudes (Turner et al., 2010; Li et al., 2019; Yao et al., 2020; Lü et al., 2021). Certainly, active faults are generally segmented by stepovers, transfer fault, or high-angle bends along strike (Yao et al., 2020; Acocella, 2021). However, compared with strike-slip and normal faults, the seismic rupture process of the thrust faults is controlled not only by the discontinuities along the strike, but also by the angle variation of the fault plane along the dip (Yao et al., 2020). In other words, the coseismic rupture of thrust faults is more likely to rupture from deep to the surface only when the dip angle changes insignificantly. The Keping fault has an obvious fault bend between the lower ramp and the upper ramp and the change dip-angle between them reaches up to 15° (Figure 9B) (Yang et al., 2006; Yao et al., 2020). The focal depth of the 2020 Jiashi earthquake derived in this study is located in the lower ramp 4–6 km below the surface (Figure 9B). The steep fault bend between the lower ramp and the upper ramp of the Keping thrust may limit the propagation of the coseismic rupture to the surface, thereby constraining the moment magnitude of the seismic event.
Notably, the east-west thrust faults in the Kepingtage FTB are segmented by several north-south strike-slip faults (Figure 9A). In addition to the large-scale Piqiang fault, the seismic reflection profiles reveal several actively developing north-south left-lateral strike-slip faults in the Kepingtage FTB (Figure 9A), which are deemed to be caused by a greater crustal shortening rate in the western part of the Tian Shan orogenic belt than in the eastern part (Turner et al., 2010; Li et al., 2021; Lü et al., 2021; Wu et al., 2023). These lateral strike-slip faults cause the irregularities and discontinuities along the strike of the thrust faults in the southwestern Tian Shan (Figure 9A) (Li et al., 2019; Lü et al., 2021). Apart from the dip-angle change, the lateral structural variability along strike of the Keping thrust also provides a limitation to the rupture propagation of the Jiashi earthquake (Turner et al., 2010; Lü et al., 2021). Thus, the irregularities along strike and dip in the Kepingtage FTB define the complexity of the fault geometry, which plays an important role in limiting the seismic rupture propagation and magnitude of earthquakes.
Another potential factor that controls the moment magnitude of the earthquake is the difference in rock strength between the Cenozoic cover and the basement in the Kepingtage FTB. Geological studies show that the foreland area of the southern Tian Shan is characterized by thin-skinned thrust tectonics in the deformation form of thrusting and folding (Yang et al., 2006; Yang et al., 2008). The compressional forces cause the sedimentary cover thrusting over the Tarim Basin basement along the deep decollement and, meanwhile, lead to the cover layer to become deformed (Yin et al., 1998; Song et al., 2006; Li et al., 2021). The overlying cover is mainly composed of Cambrian-Ordovician limestone and dolomite, Silurian-Carboniferous sandstone, Permian limestone and Paleogene-Neogene sandstone and conglomerate (Figure 9B) (Yang et al., 2006; Yao et al., 2020; Wang et al., 2022), while the basement is the rigid pre-Cambrian metamorphic rock of the Tarim Basin (Song et al., 2006; Yang et al., 2006). The seismic tomograghy shows that the Tarim Basin appears to be a deeply rooted, mechanically strong unit underlain by craton-like lithosphere (Royden et al., 2008). Because the rock strength of the cover layer is obviously weaker than the basement of the Tarim Basin, the active structures in the southern Tian Shan foreland are predominantly confined within the sedimentary cover layer (Song et al., 2006; Yang et al., 2006; Yang et al., 2008; Acocella, 2021). However, the accumulated energy and elastic strain that can be stored in the sedimentary cover are so limited that the energy is more easily released by a large number of small and medium-sized earthquakes. Therefore, we suggest that the weaker rock strength of the sedimentary cover above the detachment is responsible for the moderate-magnitude seismicity in the southwestern Tian Shan region as well.
In short, the crustal shortening caused by the deep coseismic rupture leads to slight folding of the upper strata above the detachment, and eventually produce subtle continuous surface uplift and subsidence as observed in the 2020 Jiashi earthquake. The limited rupture and moment magnitude of the seismic event are dominated by the discontinuities or irregularities in fault geometry along strike and dip and the weaker rock strength of the sedimentary cover above the detachment. These controlling factors define the moderate-magnitude seismicity in the southwestern Tian Shan region and provide a new insight into the seismic behavior in fold-and-thrust belts and regional moderate seismic hazards.
We collected and processed Sentinel-1A SAR satellite data to derive the coseismic deformation field and model the fault geometry and slip distribution of the 2020 Mw6.0 Jiashi earthquake. In particular, the results presented in the paper indicate that:
(1) The automatic GCPs selection method proposed in this paper, which combines ascending and descending track data with terrain features, can effectively eliminate orbit errors and correct phase offsets. The intuitive results after orbit refinement demonstrate that the orbital phase has been successfully removed, and the results of the root mean square error support this observation. This method, to a certain extent, mitigates the limitations imposed by the terrain environment in interferometric regions and errors introduced by manual operations, increases the efficiency of InSAR processing, thereby providing a reference for the development of automated orbit refinement algorithms in the future.
(2) The InSAR coseismic deformation field shows that the 2020 Jiashi earthquake is characterized by prominent vertical deformation with right-lateral component. The right-lateral displacement indicates that the fold-and-thrust belts at the southern frontal margins of the Tian Shan accommodate part of the regional strike-slip shear motion. The continuous vertical deformation caused by the Jiashi earthquake is attributed to the subsurface folding due to deep seismic rupture in the southern mountain front of Tian Shan. The best-fitting model plane has a depth of 4.2 km, a dip angle of 11.6°, and strike of 276° beneath the Keping thrust fault, the maximum slip is approximately 0.5 m. With a total shear modulus of 30 GPa, the seismic moment estimated by geodetic data is 1.34 × 10¹⁸ N·m, which is equivalent to a moment magnitude (Mw) of 6.05.
(3) The agreement between the inverted geometric parameters and the regional geological structures suggests that the seismogenic structure of the 2020 Jiashi earthquake is the lower ramp of the Keping thrust fault on the south-leading edge of the Kepingtage FTB. The complexity of the fault geometry along strike and dip and the rock strength difference between the sedimentary cover and the rigid basement are responsible for the limitated rupture propagation of the Jiashi event and the moderate-magnitude seismicity in the southwestern Tian Shan. The limited rupture and seismogenic structure of the 2020 Jiashi earthquake provide a new insight into the regional active tectonics and moderate seismic hazards.
The original contributions presented in the study are included in the article/Supplementary material, further inquiries can be directed to the corresponding author.
DW: Conceptualization, Methodology, Validation, Visualization, Writing–original draft. ZC: Conceptualization, Investigation, Validation, Visualization, Writing–original draft. MZ: Supervision, Writing–review and editing.
The author(s) declare financial support was received for the research, authorship, and/or publication of this article. This research was financially supported by China Scholarship Council (CSC) and Center for Collective Use “Geoportal” of Lomonosov Moscow State University.
We thank Alaska Satellite Facility (https://asf.alaska.edu) for providing the Sentinel-1A ascending and descending track data, LP DAAC (https://lpdaac.usgs.gov) for providing the 30-m resolution DEM data and Sarmap company for providing SARscape radar image processing software for this study. We are grateful to two reviewers and editors for their constructive comments which significantly improve the manuscript.
The authors declare that the research was conducted in the absence of any commercial or financial relationships that could be construed as a potential conflict of interest.
All claims expressed in this article are solely those of the authors and do not necessarily represent those of their affiliated organizations, or those of the publisher, the editors and the reviewers. Any product that may be evaluated in this article, or claim that may be made by its manufacturer, is not guaranteed or endorsed by the publisher.
Acocella, V. (2021). Volcano-tectonic process. Switzerland: Springer, 1–522. doi:10.1007/978-3-030-65968-4
Allen, M. B., Windley, B. F., and Zhang, C. (1993). Palaeozoic collisional tectonics and magmatism of the Chinese Tien Shan, central Asia. Tectonophysics 220 (1-4), 89–115. doi:10.1016/0040-1951(93)90225-9
An, Y., and Yang, F. (2023). InSAR monitoring and inversion of fault slip distribution for the 2021 yangbi earthquake in yunnan province. J. Geodesy Geodyn. 43, 509–516. doi:10.14075/j.jgg.2023.05.013
Avouac, J. P., Tapponnier, P., Bai, M., You, H., and Wang, G. (1993). Active thrusting and folding along the northern tien Shan and late cenozoic rotation of the Tarim relative to dzungaria and Kazakhstan. J. Geophys. Res. Solid Earth 98 (B4), 6755–6804. doi:10.1029/92jb01963
Book Tyagi, K., Rane, C., and Manry, M. (2022). Artificial intelligence and machine learning for EDGE computing. London: Academic Press.
Charreau, J., Chen, Y., Gilder, S., Barrier, L., Dominguez, S., Augier, R., et al. (2009). Neogene uplift of the Tian Shan Mountains observed in the magnetic record of the Jingou River section (northwest China). Tectonics 28 (2), TC2008. doi:10.1029/2007tc002137
Chen, Y., and Liu, D. (2001). A new method for automatic extraction of ridge and valley axes from DEM. J. Image Graph. 6A, 1230–1234. doi:10.3969/j.issn.1006-8961.2001.12.014
Deng, Q., Zhang, P., Ran, Y., Yang, X., Min, W., and Chen, L. (2003). Active tectonics and earthquake activities in China. Earth Sci. Front. 10 (S1), 66–73. doi:10.3321/j.issn:1005-2321.2003.z1.012
Ghiglia, D. C., and Pritt, M. D. (1998). Two-dimensional phase unwrapping: theory, algorithms, and software. New York: Wiley-Intersciencepublication.
Goldstein, R. M., and Werner, C. L. (1998). Radar interferogram filtering for geophysical applications. Geophys. Res. Lett. 25, 4035–4038. doi:10.1029/1998GL900033
Hanssen, R. (2001). Radar interferometry data interpretation and error analysis. Amsterdam: Kluwer Academic Publishers. doi:10.1007/0-306-47633-9
He, P., Wen, Y., Li, S., Ding, K., Li, Z., and Xu, C. (2021a). Present-day orogenic processes in the western Kalpin nappe explored by interseismic GNSS measurements and coseismic InSAR observations of the 2020 Mw 6.1 Kalpin event. Geophys. J. Int. 226, 928–940. doi:10.1093/gji/ggab097
He, Y., Wang, T., Fang, L., and Zhao, L. (2021b). The 2020 Mw 6.0 Jiashi earthquake: coinvolvement of thin-skinned thrusting and basement shortening in shaping the keping-tage fold-and-thrust belt in southwestern tian Shan. Seismol. Res. Lett. 93 (2A), 680–692. doi:10.1785/0220210063
Huang, G.-C. D., Roecker, S. W., Levin, V., Wang, H., and Li, Z. (2016). Dynamics of intracontinental convergence between the western Tarim basin and central Tien Shan constrained by centroid moment tensors of regional earthquakes. Geophys. J. Int. 208 (1), 561–576. doi:10.1093/gji/ggw415
Jung, H.-S., Lu, Z., and Zhang, L. (2013). Feasibility of along-track displacement measurement from sentinel-1 interferometric wide-swath mode. IEEE Trans. Geosci. Electron. 51, 573–578. doi:10.1109/TGRS.2012.2197861
Li, A., Ran, Y., Liu, H., and Xu, L. (2016). Active characteristics and paleoearthquakes in the west kalpin nappe since the holocene, SW tianshan mountain. Adv. Earth Sci. 31 (4), 377–390. doi:10.11867/j.issn.1001-8166.2016.04.0377
Li, J., Yao, Y., Li, R., Yusan, S., Li, G., Freymueller, J. T., et al. (2022). Present-day strike-slip faulting and thrusting of the Kepingtage fold-and-Thrust belt in southern tianshan: constraints from GPS observations. Geophys. Res. Lett. 49 (11), e2022GL099105. doi:10.1029/2022gl099105
Li, T., Chen, Z., Chen, J., Thompson Jobe, J. A., Burbank, D. W., Li, Z., et al. (2019). Along-strike and downdip segmentation of the pamir frontal thrust and its association with the 1985 M<i>w</i> 6.9 wuqia earthquake. J. Geophys. Res. Solid Earth 124 (9), 9890–9919. doi:10.1029/2019jb017319
Li, Y. (2014). Surface deformation, co-seismic and post-seismic activity constrained by advanced InSAR time series analysis (in Chinese). Harbin: Doctor Degree, Institute of Engineering Mechanics, China Earthquake Administration. [dissertation thesis].
Li, Y., Liu, M., Hao, M., Zhu, L., Cui, D., and Wang, Q. (2021). Active crustal deformation in the Tian Shan region, central Asia. Tectonophysics 811, 228868. doi:10.1016/j.tecto.2021.228868
Lohman, R. B., and Simons, M. (2005). Some thoughts on the use of InSAR data to constrain models of surface deformation: noise structure and data downsampling. Geochem., Geophys., Geosyst. 6 (1), Q01007. doi:10.1029/2004GC000841
Lü, L., Li, T., Chen, Z., Chen, J., Jobe, J. T., and Fang, L. (2021). Active structural geometries and their correlation with moderate (M 5.5-7.0) earthquakes in the jiashi-keping region, tian Shan southwestern front. Tectonics 40 (12), e2021TC006760. doi:10.1029/2021tc006760
Marquardt, D. W. (1963). An algorithm for least-squares estimation of nonlinear parameters. J. Soc. Indust. Appl. Math. 11, 431–441. doi:10.1137/0111030
Molnar, P., and Tapponnier, P. (1975). Cenozoic Tectonics of Asia: effects of a Continental Collision: features of recent continental tectonics in Asia can be interpreted as results of the India-Eurasia collision. Science 189 (4201), 419–426. doi:10.1126/science.189.4201.419
Okada, Y. (1985). Surface deformation due to shear and tensile faults in a half-space. Bull. Seismol. Soc. Am. 75, 1135–1154. doi:10.1785/bssa0750041135
Rabus, B., Eineder, M., Roth, A., and Bamler, R. (2003). The shuttle radar topography mission—a new class of digital elevation models acquired by spaceborne radar. ISPRS J. Photogramm. Remote Sens. 57, 241–262. doi:10.1016/S0924-2716(02)00124-7
Royden, L. H., Burchfiel, B. C., and Van Der Hilst, R. D. (2008). The geological evolution of the Tibetan Plateau. Science 321 (5892), 1054–1058. doi:10.1126/science.1155371
Song, F., Min, W., Zhujun, H., and Xu, X. (2006). Cenozoic deformation and propagation of the Kalpintag fold nappe. Seismol. Geol. 28 (2), 224–233. doi:10.3969/j.issn.0253-4967.2006.02.006
Turner, S. A., Cosgrove, J. W., Liu, J. G., Goffey, G. P., Craig, J., Needham, T., et al. (2010). Controls on lateral structural variability along the keping Shan thrust belt, SW tien Shan foreland, China. Geol. Soc. Lond. 348 (1), 71–85. doi:10.1144/sp348.5
Wang, M., and Shen, Z. K. (2020). Present-day crustal deformation of continental China derived from GPS and its tectonic implications. J. Geophys. Res. Solid Earth 125 (2), e2019JB018774. doi:10.1029/2019jb018774
Wang, Q., Zhang, P.-Z., Freymueller, J. T., Bilham, R., Larson, K. M., Lai, X. A., et al. (2001). Present-day crustal deformation in China constrained by global positioning system measurements. Science 294 (5542), 574–577. doi:10.1126/science.1063647
Wang, S., Nissen, E., Pousse-Beltran, L., Craig, T. J., Jiao, R., and Bergman, E. A. (2022). Structural controls on coseismic rupture revealed by the 2020Mw 6.0 Jiashi earthquake (Kepingtag belt, SW Tian Shan, China). Geophys. J. Int. 230 (3), 1895–1910. doi:10.1093/gji/ggac159
Wang, Y., Zhang, L., and Ge, D. (2014). Experimental study of vertical and horizontal displacement retrieval by joint analysis of ascending and descending PSInSAR data. Remote Sens. Land Resour. 26, 94–102. doi:10.6046/gtzyyg.2014.04.16
Wen, S., Li, C., and Li, J. (2020). Preliminary discussion on characteristics of coseismic deformation field and InSAR seismogenic structure for Xinjiang Jiashi Ms6.4 earthquake on January 19th, 2020. Inland Earthq. 34 (1), 1–9.
Wu, C., Zhang, P., Zhang, Z., Zheng, W., Xu, B., Wang, W., et al. (2023). Slip partitioning and crustal deformation patterns in the Tianshan orogenic belt derived from GPS measurements and their tectonic implications. Earth-Sci. Rev. 238, 104362. doi:10.1016/j.earscirev.2023.104362
Xiao, W., Windley, B. F., Sun, S., Li, J., Huang, B., Han, C., et al. (2015). A tale of amalgamation of three permo-triassic collage systems in central Asia: oroclines, sutures, and terminal accretion. Annu. Rev. Earth Planet. Sci. 43 (1), 477–507. doi:10.1146/annurev-earth-060614-105254
Yang, H., Li, Y., Shi, J., Xiao, A., Huang, S., Wang, H., et al. (2010). Tectonic characteristics of the late Cenozoic south Tianshan fold-thrust belt. Quat. Sci. 30 (5), 1030–1043. doi:10.3969/j.issn.1001-7410.2010.05.21
Yang, X., Deng, Q., Zhang, P., and Xu, X. (2008). Crustal shortening of major nappe structures on the front margins of the Tianshan. Seismol. Geol. 30 (1), 111–131. doi:10.3969/j.issn.0253-4967.2008.01.008
Yang, X., Ran, Y., Song, F., Xu, X., Cheng, J., Min, W., et al. (2006). The analysis for crust shortening of Kalpin thrust tectonic zone, south-western Tianshan, Xinjiang, China. Seismol. Geol. 28 (2), 194–204.
Yao, Q., Yang, W., Jiang, X., Guo, Y., Liu, J., Zhang, Y., et al. (2021). The 2020 M6.4 Jiashi earthquake: an event that occurred under the décollement on the kaping fold-and-thrust belt in the southwestern tien Shan mountains, China. Front. Earth Sci. 9, 647577. doi:10.3389/feart.2021.647577
Yao, Y., Wen, S., Li, T., and Wang, C. (2020). The 2020 Mw 6.0 Jiashi earthquake: a fold earthquake event in the southern tian Shan, northwest China. Seismol. Res. Lett. 92 (2A), 859–869. doi:10.1785/0220200146
Yin, A., and Harrison, T. M. (2000). Geologic evolution of the himalayan-Tibetan orogen. Annu. Rev. Earth Planet. Sci. 28 (1), 211–280. doi:10.1146/annurev.earth.28.1.211
Yin, A., Nie, S., Craig, P., Harrison, T. M., Ryerson, F. J., Xianglin, Q., et al. (1998). Late Cenozoic tectonic evolution of the southern Chinese Tian Shan. Tectonics 17 (1), 1–27. doi:10.1029/97tc03140
Yu, P., Qiao, X., Xiong, W., Chen, W., Nie, Z., Wang, D., et al. (2020). Source model for the Mw 6.0 earthquake in Jiashi, China on 19 january 2020 from sentinel-1A InSAR data. Earth Planets Space 72, 169. doi:10.1186/s40623-020-01300-4
Zhang, H., and Geng, Z. (2009). Novel interpretation for Levenberg-Marquardt algorithm. Comput. Eng. Appl. 45, 5–8. doi:10.3778/j.issn.1002-8331.2009.19.002
Zhang, P.-Z., Shen, Z., Wang, M., Gan, W., Bürgmann, R., Molnar, P., et al. (2004). Continuous deformation of the Tibetan Plateau from global positioning system data. Geology 32 (9), 809. doi:10.1130/g20554.1
Zhang, W., Ji, L., Zhu, L., Jiang, F., and Xu, X. (2021). A typical thrust rupture event occurring in the foreland basin of the southern Tianshan: the 2020 Xinjiang Jiashi Ms6.4 earthquake. Seismol. Geol. 43 (2), 394–409. doi:10.3969/j.issn.0253-4967.2021.02.009
Zhang, X., Li, J., Liu, X., Li, Z., and Adil, N. (2023). Coseismic deformation field and fault slip distribution inversion of the 2020 Jiashi ms 6.4 earthquake: considering the atmospheric effect with sentinel-1 data interferometry. Sensors 23, 3046. doi:10.3390/s23063046
Keywords: 2020 Jiashi earthquake, the southwestern Tian Shan, InSAR coseismic deformation, fault geometric parameters, seismogenic structure
Citation: Wu D, Chen Z and Zimin M (2024) InSAR coseismic deformation field and seismogenic structure of the 2020 Mw6.0 Jiashi earthquake and the implication for the moderate-magnitude seismicity in the southwestern Tian Shan, western China. Front. Earth Sci. 11:1305519. doi: 10.3389/feart.2023.1305519
Received: 01 October 2023; Accepted: 27 December 2023;
Published: 10 January 2024.
Edited by:
Elisa Zuccolo, Fondazione Eucentre, ItalyReviewed by:
Bingquan Han, Chang’an University, ChinaCopyright © 2024 Wu, Chen and Zimin. This is an open-access article distributed under the terms of the Creative Commons Attribution License (CC BY). The use, distribution or reproduction in other forums is permitted, provided the original author(s) and the copyright owner(s) are credited and that the original publication in this journal is cited, in accordance with accepted academic practice. No use, distribution or reproduction is permitted which does not comply with these terms.
*Correspondence: Zhidan Chen, Y2hlbnpoaWRhbjE4OEAxNjMuY29t
Disclaimer: All claims expressed in this article are solely those of the authors and do not necessarily represent those of their affiliated organizations, or those of the publisher, the editors and the reviewers. Any product that may be evaluated in this article or claim that may be made by its manufacturer is not guaranteed or endorsed by the publisher.
Research integrity at Frontiers
Learn more about the work of our research integrity team to safeguard the quality of each article we publish.