 Meng Liu
 Wentao Yang
 Chong Xu
 Yuting Yang1
 Liam Taylor
95% of researchers rate our articles as excellent or good
Learn more about the work of our research integrity team to safeguard the quality of each article we publish.
Find out more
ORIGINAL RESEARCH article
Front. Earth Sci. , 16 January 2024
Sec. Geohazards and Georisks
Volume 11 - 2023 | https://doi.org/10.3389/feart.2023.1304969
This article is part of the Research Topic Prevention, Mitigation, and Relief of Compound and Chained Natural Hazards View all 10 articles
Investigating the response of landslide activity to climate change is crucial for understanding the disastrous effects of climate change on high mountains. However, the lack of long-term, spatial–temporal consistent measurement of landslide activity prohibits the study of this relationship. In this work, we used two methods to derive the time series of a landslide’s deformation and study its relationship with precipitation in the northeastern Tibetan Plateau. The small baseline subset-interferometric synthetic aperture radar (SBAS-InSAR) method with Sentinel-1A images is first applied to derive time series of the landslide’s deformation from 2020 to 2021. A recently developed method to derive cumulative deformations of optical images was used with Landsat 5 and Sentinel-2 images to derive the long-term deformation time series from 1986 to 2023. Centimeter-scale deformations detected by using the InSAR method are mainly located in the upper and eastern parts of the landslide, whereas meter-scale deformations detected by using the optical method are in the middle of the landslide. Time-series results from both methods show that intra-annual initiations of the landslide’s deformation occurred in rainy months (from July to October). Although there seems to be no direct relations between inter-annual deformations and precipitation, significant displacements since 2020 occurred after exceptionally wet years from 2018 (with a record-breaking precipitation year in 2020). With optical images, we found that the maximum cumulative deformation of the landslide has been >35 m since 1986 with major deformations (>20 m) found after 2020, which may indicate an imminent risk to the Lijie town near the toe of the landslide. With climate change, increased precipitation is expected in future, which may trigger more similar landslides in the vicinity of this region. This work demonstrates an executable framework to assess landslide hazard risk under climate change.
Landslide hazards are major threats to mountain communities (Froude and Petley, 2018). Due to complex topography, landslides usually act as the initiators of mountain disaster chains (Cook et al., 2018; Qi et al., 2021). For example, the 2000 Yigong landslide in Tibet blocked the Yigong River, forming a giant lake, the dam-breaking flood of which affected downstream regions of hundred kilometers (Delaney and Evans, 2015). In July 2016, another landslide in Tibet triggered the collapse of a moraine lake, which led to a flood disaster of the Sunkoshi River in Nepal and damaged downstream infrastructures such as roads and hydropower plants (Cook et al., 2018). In October and November 2018, the two Baige landslides dammed the Jinsha River and resulted in two mega floods in Yunnan province (Fan et al., 2019; Ouyang et al., 2019; Zhang et al., 2020). In February 2021, the Chamoli ice–rock avalanche in Uttarakhand, India, scraped glacial moraine, triggered a landslide-glacial debris flow (mountain torrent) disaster chain, destroyed two hydropower stations, and caused nearly 200 casualties (Qi et al., 2021). With ongoing climate change and increased human activities in mountains, similar disasters may become common phenomena.
The topic of climate change’s impact on landslide activities has long been recognized (Gruber et al., 2004; Crozier, 2010). More landslide activities have been expected with higher temperature and intense rainfall under climate change (Ozturk et al., 2022). Although theories have been formulated to explain the mechanisms of landslide due to climate change (Huggel et al., 2012; Ozturk et al., 2022), existing works mainly rely on statistics of regional landslide inventories of a few years (Pei et al., 2023). There are some limitations to use these landslide inventories: 1) most landslides are usually small in size and can only be recognized in very high spatial resolution (VHR) optical images (finer than 1 m), which became widely available in 2000s and not long enough to assess the impact of climate change (Deroin et al., 2012). In addition, frequent acquisitions (e.g., yearly) of VHR images for many years in remote mountains are expensive and very rare, and interpreting landslides from optical images of different spatial resolution could not generate temporally consistent landslide inventories. 2) Establishing regional landslide inventories is labor- and time-consuming. 3) Mapping of landslides is rather subjective depending on the interpreter’s’ personal experience (Galli et al., 2008; Van Westen et al., 2008). Therefore, there is a lack of long-term, temporally consistent observations of landslide activities that can be used to quantify the impacts of climate change (Patton et al., 2019).
In contrast, measurements of a slow, long-lasting, creeping landslide’s deformation could result in more frequent, longer-term observations. In addition, landslide deformation is simpler to study, with all influencing variables being constant (e.g., local slope and lithology), except for climate.
Based on the principle of radar phase interference, the interferometric synthetic aperture radar (InSAR) algorithm can identify landslide deformation of a few millimeters to centimeters (Meng et al., 2015; Zhang et al., 2020). However, the radar phase interferometry method has the following problems: 1) it is greatly affected by vegetation, and it is difficult to find the same point in densely vegetated areas; 2) the temporal interval between two phase-coherent synthetic aperture radar (SAR) images cannot be too long; otherwise, coherent imaging cannot be obtained; 3) it has difficulty in detecting surface deformation that exceeds a single wavelength in image pairs; 4) the monitoring accuracy is significantly affected by atmosphere conditions, and it is necessary to find a stable area to remove the atmospheric effect (Yang et al., 2018). The small baseline subset (SBAS) technique with multi-SAR images is frequently used to overcome some of the drawbacks of InSAR and to derive time series of surface deformation (Intrieri et al., 2018). Despite this, the deformation detected by using the radar phase interferometry method is a one-dimensional deformation in the radar line of sight (LOS) direction, and it may lead to omissions in complex terrains with single-orbit data.
The sub-pixel offset tracking (POT) of optical images is another commonly used method to invert landslide deformation based on the brightness information of remote sensing images (Liu et al., 2020). POT is simpler to operate when compared to the InSAR method. It could use image pairs of longer time intervals and is better at extracting larger displacement deformation (Yang et al., 2020b). The monitoring accuracy of this method is related to the spatial resolution of the imagery used (Stumpf et al., 2017). In recent years, high spatial resolution remote sensing data have become easier to access, and applications of POT (such as the Co-registration of Optically Sensed Image and Correlation (COSI-Corr) and MicMac) have become more common (Leprince et al., 2007; Bradley et al., 2019; Lacroix et al., 2020). A time series inversion method has recently been proposed to reduce background noise in optical POT results (Bontemps et al., 2018). However, most previous works used either InSAR or optical POT to derive landslide deformation, and few works compared both methods.
In this work, we used SBAS-InSAR and optical POT to study the spatial and temporal deformation of the Beishan landslide in northeast Tibet. Synthetic use of both methods could unveil a holistic picture of the landslide’s dynamics and its long-term deformation history and prompt a better understanding of its response to climate change. Our objectives are 1) to reveal and compare the surface deformations of the landslide with SBAS-InSAR and optical POT methods; 2) to analyze deformation dynamics in relation to climate drivers; and 3) to simulate potential disastrous scenarios for a nearby town.
In the eastern mountains of the Qinghai–Tibet Plateau, landslide hazards are very active because of the following reasons: 1) deep canyons incised by major rivers are pervasive; 2) tectonic activities are very active, and earthquakes occur frequently; and 3) local lithology is fragmented and fragile (Zhang et al., 2021). The study area is in the northeastern Tibetan Plateau. The study area has a monsoon climate, and the multi-year Global Precipitation Measurement (GPM) shows that the average annual precipitation of the study area is 598.5 mm.
The Beishan landslide in Zhouqu County, Gansu, China, is studied. The Bailong River runs through the study area, and the landslide occurred on the northern bank of the river. The Lijie town is located at the foot of the landslide along the Bailong River (Figure 1). The elevations of the landslide head and the toe are ∼2,473 and ∼1,582 m, respectively. The aspect of the landslide ranges from 135° to 219°, and the mean aspect is 178°. The landslide body has three major lithologies. The upper part of the landslide is Devonian limestone. The middle part of the landslide is Quaternary loess, and the lower part of the landslide is the Silurian slate and phyllite (Zhong et al., 2022). The surface of the landslide area is covered by sparse xerocolous grass and shrubs. Landslide scarps are clearly visible in optical images of earlier than 2017. The landslide had been reported in previous work, but its deformation was not well-studied (Zhong et al., 2022). The landslide has been slowly moving for a long time. In the past 40 years, it reactivated several times and transferred into debris flows during heavy rains in 1978, 1992, 2010, and 2018. In 1978, reactivation of the landslide damaged many cottages, and the local authorities displaced more than 100 threatened families (Wang et al., 2022). Since August 2020, the landslide has partly reactivated and caused some road collapses in Beishan village near the landslide head.
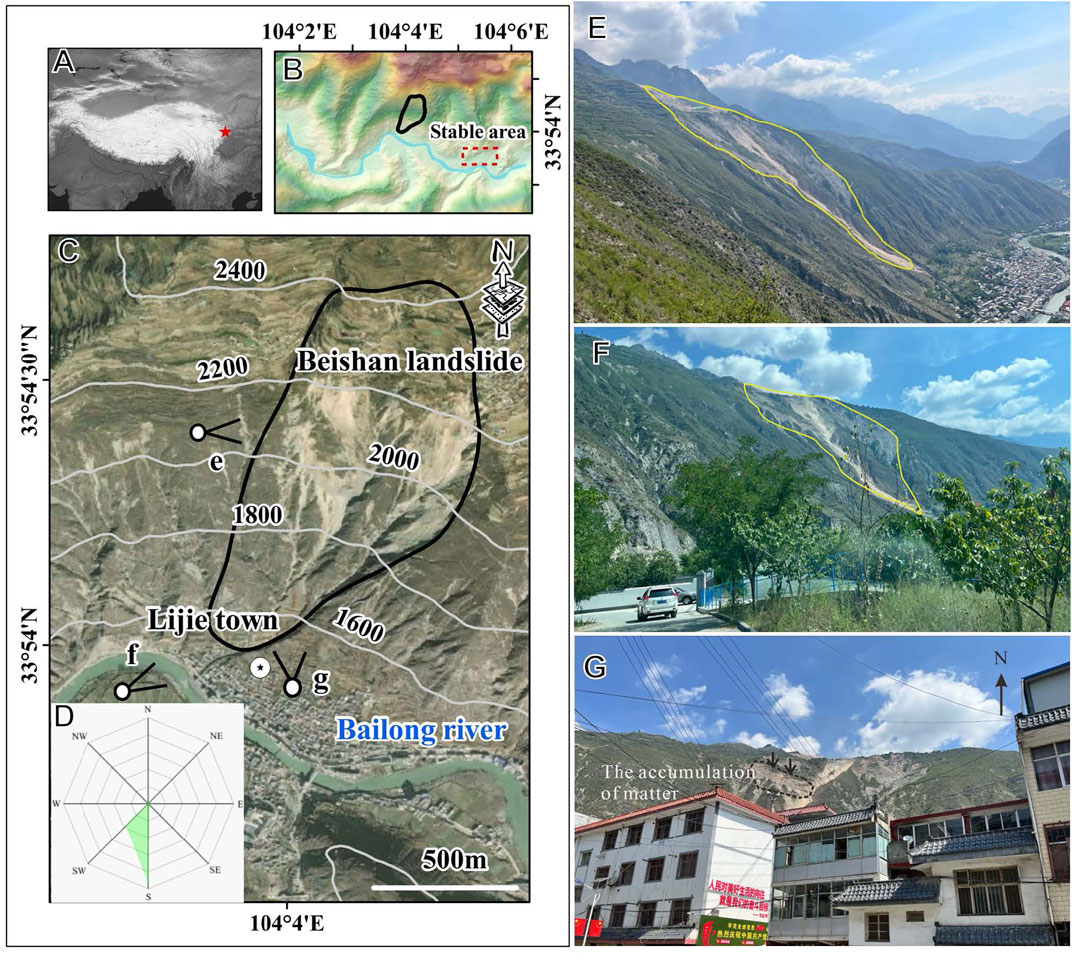
FIGURE 1. Study area (A–C), the Beishan landslide aspect distribution (D), and the field photos (E–G).
During 14–20 August 2022, we carried out field work in the study area and took some photos of the Beishan landslide. By interviewing residents, we found some people in the west part of the Lijie town had already moved to other places in awareness of the landslide hazard. Constructions have been implemented by the government at the landslide head to try to stabilize the slope since 2021.
In this work, three sets of precipitation data were used. The first set of precipitation data is the GPM. It is a joint satellite mission by the National Aeronautics and Space Administration (NASA) and the Japanese Aerospace Exploration Agency (JAXA) to measure rain and snow every 3 hours globally. GPM data are produced with microwave and infrared precipitation estimates of satellite and precipitation gauge estimates. using the Integrated Multi-satellitE Retrievals for GPM (IMERG) algorithm (Fang et al., 2019). The monthly GPM v6 data used in this work are downloaded from Google Earth Engine, and the data have a spatial resolution of 11,132 m. The monthly GPM v6 data from June 2000 to September 2021 are available. Annual GPM data from 2001 to 2020 were summed from the monthly GPM v6 data.
The second set of precipitation data is the Climate Hazards Group InfraRed Precipitation with Station (CHIRPS) data. It is a quasi-global rainfall dataset from 1981 to the present day. CHIRPS combines 0.05° resolution satellite imagery with field station data to create gridded rainfall time series for trend analysis and seasonal drought monitoring. The CHIRPS rainfall data are daily rainfall data, and we obtained monthly rainfall data from 1986 to 2022 through the Google Earth Engine (GEE). The third set of precipitation data is from a meteorological station in the Zhouqu city, which is ∼30 km east of the landslide area. Monthly precipitation data from 1986 to 2021 measured by this station are also used as a reference.
The Mann–Kendall (M-K) test is often used to analyze long-term, inter-annual, and seasonal trends and mutations in meteorology and hydrology (Pei et al., 2023). In this work, we mainly obtain the trend and p-value test of three sets of different sets of rainfall data through the trend analysis of the M-K test.
First, we defined time-series data as X1, X2, X3, … , Xn, where ni denotes the cumulative number of samples. Among them, Xj is greater than Xi in the time series (1≤i≤j). The statistic Sk is defined as follows:
Under the assumption that the time-series data are randomized and independent, the mean and variance of the statistic are expressed as E (Sk) and Var (Sk), respectively. They can be represented as follows:
Then, we normalize the statistic Sk and obtain the U(Sk).
We used a total of 46 scenes of Sentinel-1A single-look complex (SLC) images under the descending orbit and 59 scenes of ascending orbit data from April 2020 to April 2022 to derive surface deformation using SBAS-InSAR (https://search.asf.alaska.edu/), and the orbit correction is performed through the precise orbit file (https://scihub.copernicus.eu/) corresponding to the time. By setting a temporal baseline threshold of 60 days and a spatial baseline threshold of 20%, 261 and 219 interferometric pairs were generated for the ascending and descending track images, respectively. The image parameters are shown in Table 1. Among them, the maximum spatial thresholds in the descending track and ascending track image pairs are 228 and 218 m, respectively. Connections of SAR images are shown in Figure 2.
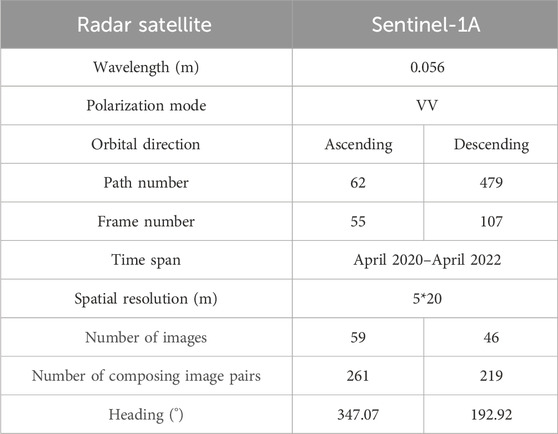
TABLE 1. Parameters of SAR images.
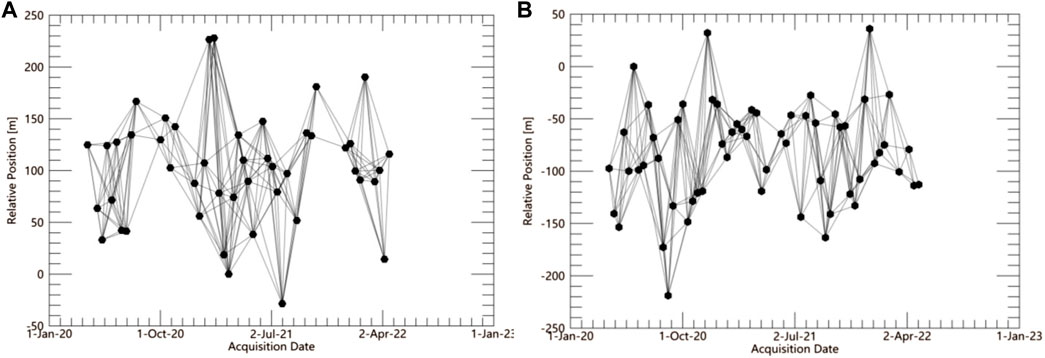
FIGURE 2. Descending (A) and ascending (B) InSAR pairs used in this work.
Adaptive filtering functions were used for improving interferogram quality, and unwrapping of the phase was done by using the minimum cost flow (MCF) algorithm (Werner et al., 2003; Pepe and Lanari, 2006). After these processes, we used SRTM-DEM (https://dwtkns.com/) data for terrain correction (Zhang et al., 2021). We set ground control points (GCPs) based on the selection of a relatively stable region. To estimate and remove the remnant constant phase, these points are used to do refinement and reflattening. We inverse the first deformation rate to flatten the resulting interferogram by selecting the linear model. Based on the result of the first deformation rate, we remove atmosphere phase delay by using a temporal high-pass filter and a spatial low-pass filter to separate the phase components. Finally, the singular value decomposition (SVD) method was used to obtain LOS deformation results from the unwrapped phase (Chen et al., 2021; Berardino et al., 2002). The SBAS-InSAR operation steps of this work are implemented in the ENVI/SARscape package. A 1:4 multi-look operation is used for the range and azimuth direction, and the final output image resolution is 20*20 m.
Sentinel-2 images with POT were first used to derive the surface deformation of the landslide. The Multi-Spectral Instrument (MSI) onboard Sentinel-2 images is a push-broom sensor. There are two Sentinel-2 satellites at space, 2A and 2B, both of which are phased at 180° to each other. For each satellite, the revisit time at the equator is 10 days. The constellation of two satellites can view the equator every 5 days. At mid to low latitude, the revisit time is even shorter (<5 days). There are 13 bands with a spatial resolution of 10, 20, and 60 m. Near-infrared (NIR), red, green, and blue are four bands with 10 m in spatial resolution. The 10-m red band is the most frequently used data to detect surface deformation (Yang et al., 2020a; Qi et al., 2021).
We downloaded 135 Sentinel-2 red band images (t0, t1, … t134) from 27 November 2015 to 24 May 2023 (Table 2) and 94 Landsat-5 red band images from 1986 to 2011 (Table 3). For this work, we selected images that were least affected by clouds. We used the COSI-Corr software, which was developed by a team in the California Institute of Technology (Leprince et al., 2007) and is a frequently used sub-pixel offset tracking method to derive surface deformation in Sentinel-2 images (Bontemps et al., 2018; Lacroix et al., 2018; 2020; Yang et al., 2020a; Qi et al., 2021). To derive surface deformation with the software, we must compose a pair of two images acquired at different dates. The principle of the COSI-Corr is to use sliding windows to find the difference between the earlier or the master image and the later image, also known as the slavery image. By taking the image of Sentinel-2 as an example, we composed 2069 image pairs with these 135 images.

TABLE 2. Dates of all 135 Sentinel-2 optical images used in this work.
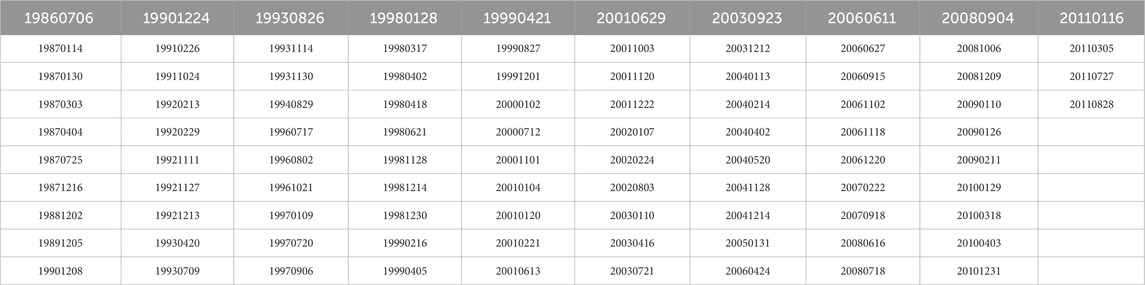
TABLE 3. Dates of all 94 Landsat-5 optical images used in this work.
Matrix A is a two-dimensional matrix. It has 2069 rows and 135 columns.
The rank of A is 135, which is the same as that of unknown variables.
Vector X is a one-dimensional vector. It has 135 rows and one column. Elements in X, such as
As we have 2069 equations and 135 unknowns, we used the singular value decomposition (SVD) method to find a solution. Because A is not a square matrix, it can be decomposed into three other matrices.
where U and V are square matrices. The columns of U are the eigenvectors of AAT, and the columns of V are the eigenvectors of ATA.
We also processed the inversion twice with a similar form of weights (Bontemps et al., 2018). In the first SVD inversion, we took the surface deformations within the stable area and calculated the reciprocal of the standard deviation as the weight. In the second inversion, we used the reciprocal of the residual error from the first SVD inversion as the weight.
MassFlow is a two-dimensional finite difference scheme developed to model mass movements in mountainous regions (Ouyang et al., 2013). The software has been used to simulate the collapse of the Beishan landslide (Zhong et al., 2020). In this work, we used MassFlow to model the potential collapses of the main deformation area. The spatial extents of the simulated landslide were from displacement >5 m by POT. To better meet the conditions of field hydrogeology and other conditions, we used the same simulation parameters as in the previous paper (Zhong et al., 2020). The simulation parameters used in this paper are a friction coefficient of 0.65 and cohesion of 6 Kpa. The shear shrinkage effect of the sliding soil and the fragmentation of particles caused by shearing make the pores of the sliding soil smaller, generating pore water pressure, and the shear strength completely or partially disappears. The pore water pressure coefficient in this work (used by Zhong et al. (2020)) is 0.05. However, they were simulated during January 2021 (dry wintertime), when the pore water pressure coefficient was at its lowest condition, which means that the same value of the parameter cannot represent the situations throughout the year, especially in rainy months. So we set up three gradients (0.05, 0.1, and 0.15) for this parameter to simulate three scenarios for the landslide.
The optical POT method was used to inverse the deformation results of the slope for nearly 8 years from November 2015 to May 2023. It was found that the deformation in the middle part of the landslide has the largest deformation (Figure 3A). Maximum deformation of this part of the landslide is >15 m during the studied period. The white border represents the deformation area greater than 5 m, which has an area of ∼196,094 m2, accounting for 31% of the entire landslide (Figure 3C). Figure 3B shows the directions of landslide movement. The dominant moving directions of the landslide are from northeast to southwest along the slope.
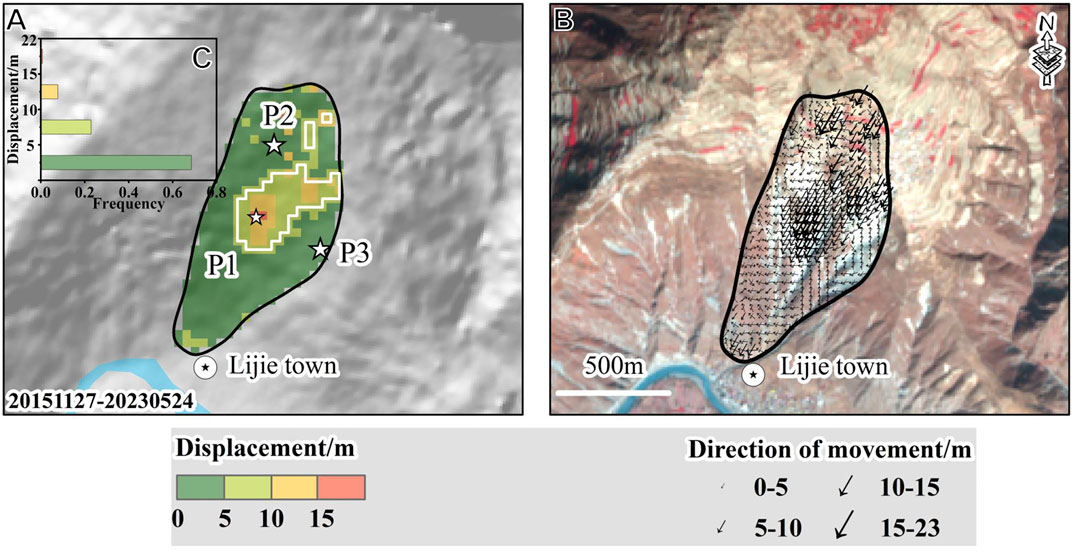
FIGURE 3. Derived displacement between 27 November 2015 and 24 May 2023 (A), the directions of landslide movement derived from POT (B), and the histogram of deformation distribution (C).
Figures 4A, B show the spatial pattern of the surface deformation in the LOS direction of landslides monitored by SBAS-InSAR under the descending and ascending orbits. From the SBAS-InSAR results of the descending orbit, discernible larger surface deformations (<-20 mm ± 4.06 mm) are found to the east and upper parts of the landslide (Figure 4A). From the results of the ascending orbit, large surface deformations (<-20 mm ± 3.61 mm) are only discerned on the upper part of the landslide (Figure 4B). The maximum deformation in the LOS direction detected by the descending and ascending tracks is of the same magnitude (close to 50 ± 4 mm). In the detected deformation, the uncertainty of these displacements was assessed using standard deviations of the InSAR and POT displacement results in the stable area.
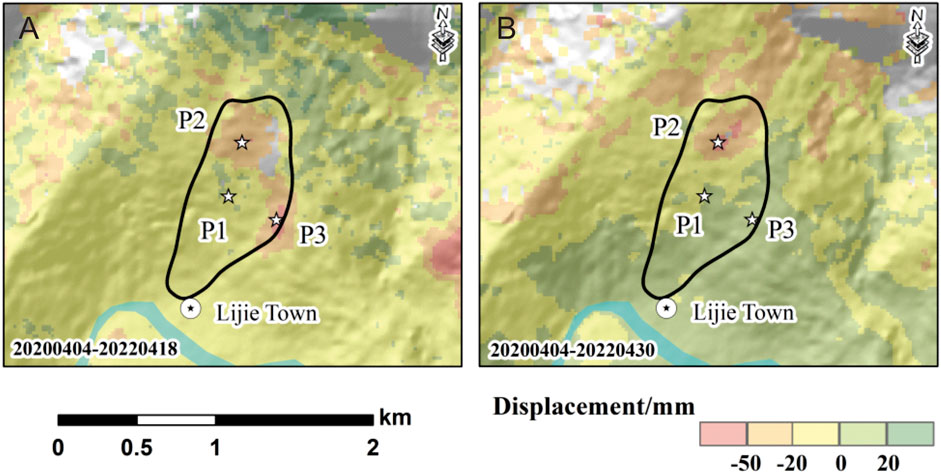
FIGURE 4. Slope deformation derived from descending and ascending SBAS-InSAR methods (A, B). Selected points from the middle (P1), upper (P2), and east sides (P3) of the landslide.
Figure 5 shows the deformation time series of three points on the middle (P1), upper (P2), and east (P3) parts of the landslide (P1, P2, and P3 are shown in Figures 3 and 4) derived from optical POT and ascending/descending InSAR from April 2020 to April 2022. The two vertical black dashed lines represent accelerated deformations of the landslide in the rainy months of 2020 and 2021. Figure 5A shows the cumulative deformation of P1 at the middle part of the landslide. For this point, only deformations measured by optical POT are valid because deformations of P1 derived from ascending/descending SBAS-InSAR are non-monotonic. Time series of its deformation increased rapidly by 4.76 m within 3 months from 8 July 2020 to 21 October 2020, with a deformation rate of 0.04 m/d, which is immediately after the rainy months of the year.
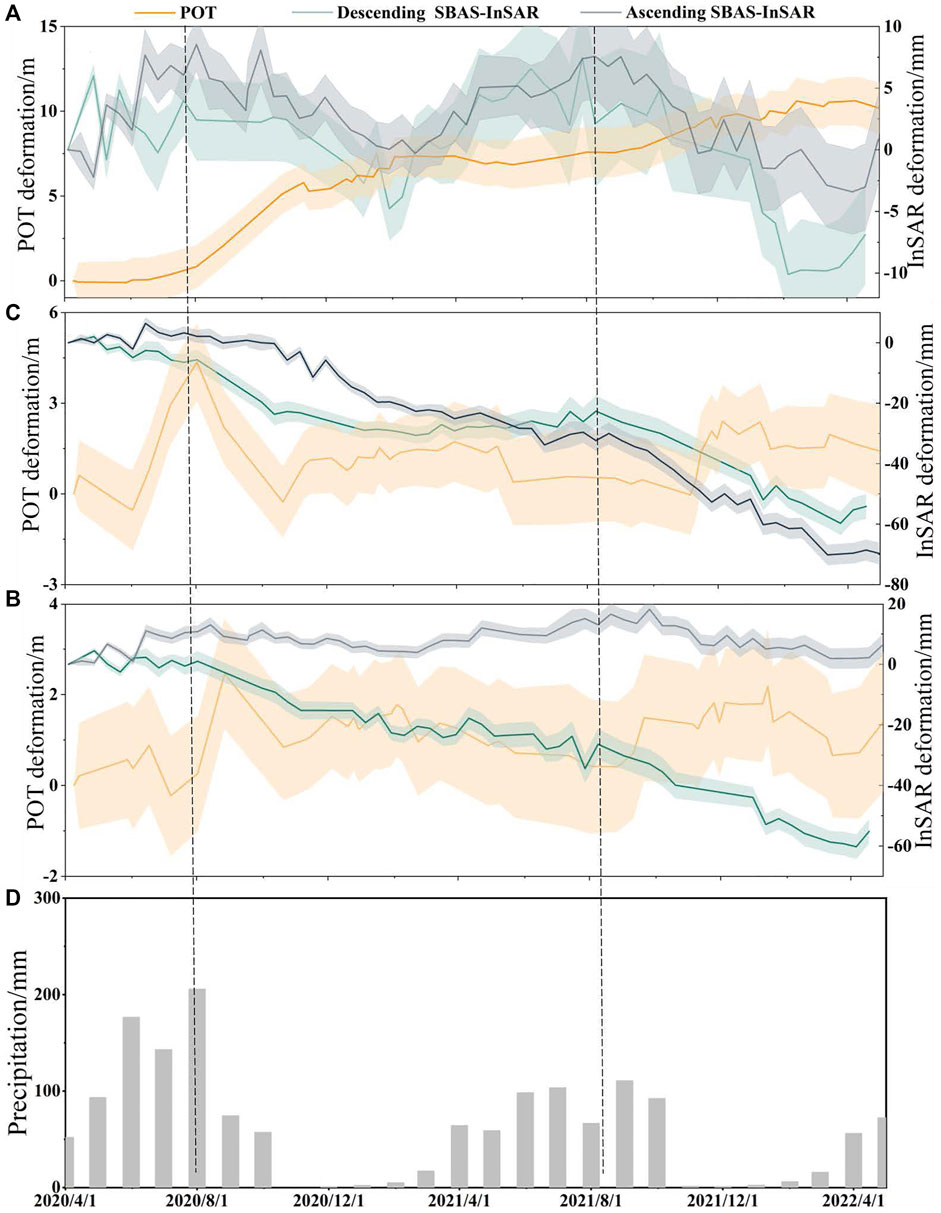
FIGURE 5. Optical POT- and SBAS-InSAR-derived cumulative displacements for P1 (A), P2 (B), and P3 (C) (labeled in Figures 3 and 4) and monthly rainfall from CHIRPS (D). The shaded area is the standard deviation of the deformation monitored using the optical POT and InSAR methods within the stable zone. In Figure 6, the title of the figure was changed to: The deformation time-series in 35 years (1986–2023) (A), precipitation change and distribution in 42 years (1981–2022) from three datasets, and the shadings are 95% confidence intervals for the linear models (B).
Deformation time series of P2 is valid for both ascending and descending SBAS-InSAR, but not for the optical POT. For the descending result, the deformation rate from August to October 2021 reached nearly 0.3 mm/d, far exceeding the annual average deformation rate of 0.07 mm/d. Figure 5C shows that the deformation of P3 is valid only in the descending InSAR result. The deformation velocities from August to October in 2020 and 2021 are 0.14 mm/d and 0.15 mm/d, respectively, much larger than the annual average deformation velocity of 0.07 mm/d from April 2020 to April 2022. The fast-moving deformations for both ascending and descending SBAS-InSAR also occurred immediately after rainy months.
Figure 6A shows the deformation time-series curve from 1986 to 2023. It can be found that the displacement velocities in 1986–2011 (phase 1) and November 2015–July 2020 (phase 2) are 0.59 m/year and 0.96 m/year, respectively. The slope of the two-stage fitting curve is equivalent. It shows that the displacement velocities in the two phases are roughly the same, and the deformation is stable. After July 2020, the deformation suddenly accelerated. The displacement velocity of phase 3 (July 2020–May 2023) is 6.3 m/year, nearly 10 times that of the previous stages (phase 1 and phase 2).
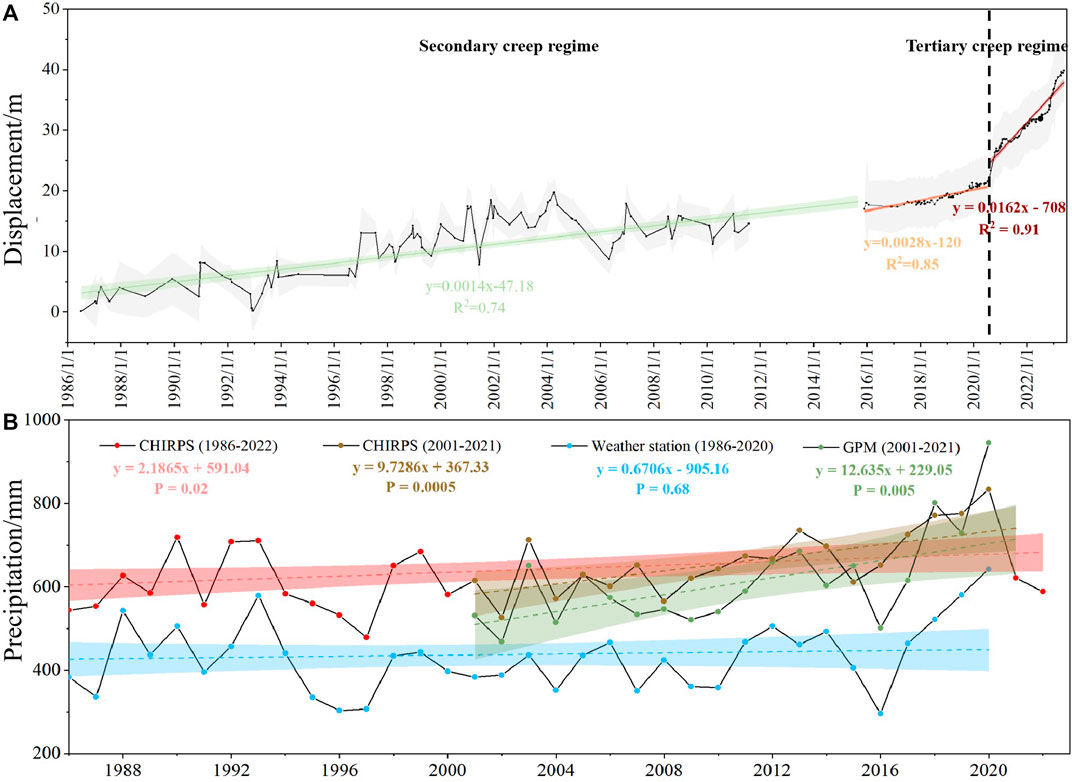
FIGURE 6. The deformation time-series in 35 years (1986–2023) (Figure 6A), precipitation change and distribution in 42 years (1981–2022) from three datasets, and the shadings are 95% confidence intervals for the linear models.
To explore the relationship between the trend of deformation and rainfall, we fitted the trend graphs of three sets of rainfall data (Figure 6B). Different rainfall data show that the annual rainfall in the past 20–30 years has an upward trend (except for the weather station data, the p-values of all other data after Mk testing are less than 0.05). Although the rainfall data of the weather station are approximately 150 mm lower than those of the satellite rainfall (GPM and CHIRPS) on average, the rainfall trend of the two is consistent. This may be caused by differences in the locations of weather stations and monitoring methods. The two sets of satellite rainfall data (GPM and CHIRPS) agree well with each other in the 20 years from 2001 to 2021. In addition, all three datasets show that the rainfall increased sharply after 2018 and peaked in 2020, which is very likely to be the reason for the sudden accelerated deformation in summer 2020.
We simulated the collapse of the pore water pressure at three different intensities. The houses and buildings in the Lijie town (the white area is the interpreted building area) will be possibly damaged with landslide collapse. The collapse of the landslide gradually increases with the increase in the pore water pressure (Figure 7). When the pore water pressure is 0.05, the collapse of the landslide has a less impact on the built-up area (Figure 7A). When the pore water pressure is 0.1, the collapsed material of the landslide begins to affect the northwest part of the urban area (Figure 7B).
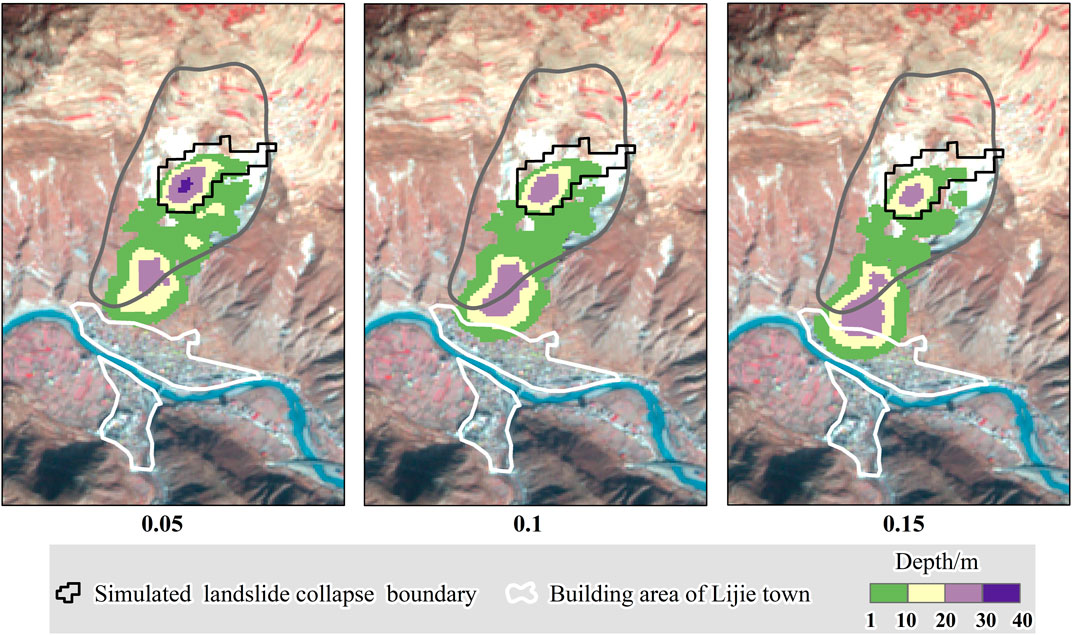
FIGURE 7. Collapse simulations for the main deformation area of the Beishan landslide.
When the pore water pressure is 0.15, the buried area of the landslide accumulation core is the largest (partial area>20 m). The buried area above 1 m reaches 39,664 m2, accounting for 18% of the construction area (the total construction area of the north and south areas of the river reaches 224,503 m2). In addition, the average buried depth of this area reaches 9.54 m (Figure 7C).
The SBAS-InSAR and optical POT techniques are two commonly used remote sensing methods to extract regional landslide deformation (Hu et al., 2018; Handwerger et al., 2019). Although one recent work compared InSAR and optical POT results, they did not derive time series of landslide deformation (Kuang et al., 2023). The recently developed time-series inversion model can significantly remove spatial noises and is indispensable to uncover landslide dynamics over time (Bontemps et al., 2018). Our work is the first to compare time series of deformations between SBAS-InSAR and optical POT for the same landslide.
Our results show that spatial deformation patterns of both methods are distinct from each other (Figures 3 and 4). This is because the POT is excellent in detecting larger deformations (>1 m) in the horizontal direction (Yang et al., 2021), whereas InSAR is better in detecting smaller deformations (centimeter scale) in the LOS direction of the satellite (Zhang et al., 2020). The smallest deformation that POT can detect relies upon the spatial resolution of the used optical images (Stumpf et al., 2017; Bontemps et al., 2018). With time series of POT results from 10-m resolution images, we are confident to say that we detected deformation signals of >1 m. These distinct results from both methods indicate that the onefold use of either InSAR or optical POT would underestimate the extent of the landslide’s spatial deformation. The spatial pattern of a landslide’s deformation is an important reference to assess the magnitude (e.g., detaching volume, moving speed, potential deposition area, and depositing depth) of a landslide hazard, which is the most important part for quantifying landslide risks. The complete spatial pattern of the landslide’s deformation unveiled by integration of both methods is also crucial for assessing the risks of other similar slow-moving landslides.
In this work, the maximum deformation detected by SBAS-InSAR is ∼50 mm, whereas the POT-derived deformation is >20 m. This is consistent with the findings of previous works that POT is excellent in detecting larger deformation (>1 m) in the horizontal direction (Yang et al., 2021) and InSAR is better in detecting smaller deformation (centimeter scale) (Zhang et al., 2020). In addition, InSAR detects deformation in the LOS direction (Zhang et al., 2020), which explains different performances between the ascending and descending track results shown in Figure 4. Deforming slopes with the west and east aspects are easier to detect by Sentinel-1A SAR images of ascending and descending orbits, respectively. The InSAR method is sensitive to the vertical deformation but not sensitive to the north–south deformation (Chen et al., 2023; Tian et al., 2023). In theory, InSAR cannot detect moving slopes with aspects to SAR tracks. This may have caused the SBAS-InSAR method to fail to effectively monitor the deformation in the central part of the landslide.
Deformations of a landslide can be used to help issue early warnings. Laboratory experiments and numerical models show that there are three creeping regimes before the collapse of a landslide: primary creep with decreasing velocity, secondary creep with constant slow velocity, and tertiary creep with accelerations (Main, 2000; Amitrano and Helmstetter, 2006). The last two schemes are frequently reported before paroxysmal collapses of some famous landslides (Intrieri et al., 2018; Liu et al., 2020). Our results of the deformation time series from 1981 to 2023 seem to follow those of the secondary creep and early stage of the tertiary creep. The landslide seems to be deforming with constant velocity, whereas accelerations were observed since 2020. Although the deforming velocity in 2022 is slower than that in 2020 and 2021, it is still larger than velocities before 2019. Similar to the famous Baige landslide (Liu et al., 2020), long-term deformation time series indicates that the middle part of this landslide is highly active and that it could be susceptible to collapse in the future.
A previous work simulated the collapse of the landslide and found that it had little influence on the nearby Lijie town (Zhong et al., 2022). However, their model used the pore water pressure parameter in wintertime, during which it was at its lowest level. Our results show that major deformations of the landslide occur in rainy months when pore water pressure is at its maximum. The most conservative scenarios in this work serve a baseline for the landslide’s impact. Our modeling indicates that collapse of the middle part of the landslide may cause destructions to the Lijie town.
Our results that deformation time series from both methods of SBAS-InSAR and Sentinel-2 POT shows accelerations in rainy months indicate that precipitation is likely to be the major driver for intra-annual landslide dynamics. Although measurements of Landsat 5 are very coarse and sparse with high uncertainties, it is possible that intra-annual landslide deformations from 1986 to 2011 also followed similar temporal patterns. During our study period, there is no seismicity with Modified Mercalli Intensity (MMI) larger than IV, and the deformation correlates well with precipitation. Consistent with others, these findings indicate that intra-annual acceleration of this landslide is initiated by precipitation (Handwerger et al., 2022; Liu et al., 2022). As the slope continues to slide down, the threshold to accelerate the moving of the slope may continue to decrease.
On an inter-annual time scale, our findings indicate that the relation between the landslide’s deformations and annual precipitation since 1986 has been complex. All precipitation data show that annual precipitations are among the highest in record from 2018 to 2020, overlying with significant acceleration of the landslide in 2020. These abnormally high precipitation years may cause the transition of the landslide from the second creep regime to the tertiary creep regime, indicating the impact of climate warming on landslide stability.
To investigate the correlation between rainfall and deformation, we conducted analysis of daily rainfall spanning from 1 November 2016 to 30 August 2023. During this period, we identified the 10 days with the highest recorded rainfall. Notably, a significant majority of these extreme rainfall events were observed in the month of July each year, constituting 80% of the total dates under consideration (Table 4). In July 2020, there were 2 days of extremely intense rainfall, which is highly likely to be associated with the substantial deformation observed during the summer of 2020 (Figure 8). An escalation in the occurrence of extreme rainfall events in alpine regions can intensify the occurrence of landslides (Shah et al., 2023). Beyond the direct erosive impact of rainfall, extreme precipitation can also induce landslides by influencing the hydrology of the watershed (Zhu et al., 2021).
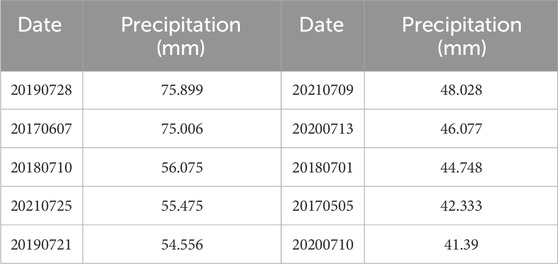
TABLE 4. The 10 days with the highest daily rainfall (CHIRPS) from 1 November 2016 to 30 August 2023.
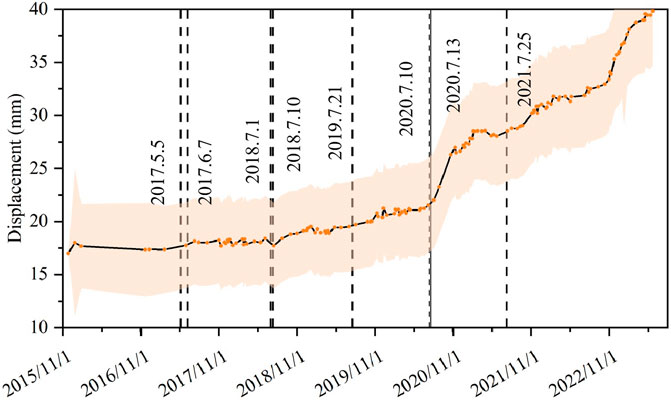
FIGURE 8. Deformation time series from 27 November 2015 to 24 May 2023 obtained by Sentinel-2 inversion and dates of the 10 wettest days from 1 November 2016 to 30 August 2023.
Most landslides in this part of the plateau are triggered by rainfall (Li et al., 2023; Peng et al., 2015). Based on the >40 years (1981–2022) of annual precipitation record, the climate in this region found getting wetter. In addition, as estimated in Coupled Model Intercomparison Project Phase 6, precipitation in this region will continue to increase with more extremity (Thackeray et al., 2022). Increasing annual precipitations may lead to more landslide activities in this part of the plateau in future. With ongoing climate change, there may be more similar landslides as this area becomes unstable. Frequent landslides will provide erosive loose materials in this semi-arid region of poor vegetation cover, potentially feeding more debris flows during extreme precipitations.
In this work, we studied deformations of a landslide in northeast Tibetan Plateau with SBAS-InSAR and optical POT. Deformations detected using both the methods are very different. Optical POT is sensitive to meter-scale deformations in the middle part of the landslide, where SBAS-InSAR is invalid. From 1986 to 2023, the middle part of the landslide moved >35 m. In contrast, SBAS-InSAR is more sensitive to centimeter-scale deformations in upper and east parts of the landslide, which is ineffective for optical POT to monitor. It is possible that sections of landslides with centimeter-scale deformations may be at its earlier stage toward meter-scale deformations in future. Based on theoretical landslide deformation regime and previous collapsing landslides, we speculate that the landslide may be at its final tertiary creep regime, meaning a partial collapse is susceptible in future.
Time series of deformations from both SBAS-InSAR and POT with Sentinel-2 images can detect seasonal deformation signals related to rainy months every year. However, inter-annual landslide deformation is not directly related to multiyear precipitations. The significant acceleration of the middle part of the landslide in 2020 may be related to the extraordinary wetting years from 2018 to 2020. With climate change, precipitation in this region will continue to increase, potentially posing more slopes unstable in future.
The original contributions presented in the study are included in the article/Supplementary material; further inquiries can be directed to the corresponding author.
ML: data curation, formal analysis, investigation, methodology, software, writing–original draft, and writing–review and editing. WY: resources, supervision, visualization, writing–review and editing, and writing–original draft. CX: supervision and writing–review and editing. YY: visualization, validation, and writing–review and editing. LT: writing–review and editing. PS: writing–review and editing and validation.
The author(s) declare financial support was received for the research, authorship, and/or publication of this article. This work is supported by the Second Tibetan Plateau Scientific Expedition and Research Program (STEP, Grant No. 2019QZKK0906).
The authors are grateful for the scholarship from the China Scholarships Council (No. 202006515016). The authors would like to thank Mr. Jiaxin Gao for his help in screening and downloading all optical images.
The authors declare that the research was conducted in the absence of any commercial or financial relationships that could be construed as a potential conflict of interest.
The author(s) declared that they were an editorial board member of Frontiers, at the time of submission. This had no impact on the peer review process and the final decision.
All claims expressed in this article are solely those of the authors and do not necessarily represent those of their affiliated organizations, or those of the publisher, the editors, and the reviewers. Any product that may be evaluated in this article, or claim that may be made by its manufacturer, is not guaranteed or endorsed by the publisher.
Amitrano, D., and Helmstetter, A. (2006). Brittle creep, damage, and time to failure in rocks. J. Geophys. Res. 111, n/a–n. doi:10.1029/2005JB004252
Berardino, P., Fornaro, G., Lanari, R., and Sansosti, E. (2002). A new algorithm for surface deformation monitoring based on small baseline differential SAR interferograms. IEEE Trans. Geosci. Remote Sens. 40, 2375–2383. doi:10.1109/TGRS.2002.803792
Bontemps, N., Lacroix, P., and Doin, M.-P. (2018). Inversion of deformation fields time-series from optical images, and application to the long term kinematics of slow-moving landslides in Peru. Remote Sens. Environ. 210, 144–158. doi:10.1016/j.rse.2018.02.023
Bradley, K., Mallick, R., Andikagumi, H., Hubbard, J., Meilianda, E., Switzer, A., et al. (2019). Earthquake-triggered 2018 Palu Valley landslides enabled by wet rice cultivation. Nat. Geosci. 12, 935–939. doi:10.1038/s41561-019-0444-1
Chen, M. K., Xu, G. Y., Zhang, T. X., Xie, X. W., and Chen, Z. P. (2023). A novel method for inverting coseismic 3D surface deformation using InSAR considering the weight influence of the spatial distribution of GNSS points. Adv. Space Res. 0273, 585–596. doi:10.1016/j.asr.2023.11.013
Chen, Y., Yu, S. W., Tao, Q. X., Liu, G. L., Wang, L. Y., and Wang, F. Y. (2021). Accuracy verification and correction of D-InSAR and SBAS-InSAR in monitoring mining surface subsidence. Remote Sens. 13, 4365. doi:10.3390/rs13214365
Cook, K. L., Andermann, C., Gimbert, F., Adhikari, B. R., and Hovius, N. (2018). Glacial lake outburst floods as drivers of fluvial erosion in the Himalaya. Science 362, 53–57. doi:10.1126/science.aat4981
Crozier, M. J. (2010). Deciphering the effect of climate change on landslide activity: a review. Geomorphology 124, 260–267. doi:10.1016/j.geomorph.2010.04.009
Delaney, K. B., and Evans, S. G. (2015). The 2000 Yigong landslide (Tibetan Plateau), rockslide-dammed lake and outburst flood: review, remote sensing analysis, and process modelling. Geomorphology 246, 377–393. doi:10.1016/j.geomorph.2015.06.020
Deroin, J.-P., Téreygeol, F., Cruz, P., Guillot, I., and Méaudre, J.-C. (2012). Integrated non-invasive remote-sensing techniques and field survey for the geoarchaeological study of the Sud Lípez mining district, Bolivia. Geophys Eng. 9, S40–S52. doi:10.1088/1742-2132/9/4/S40
Fan, X. M., Xu, Q., Alonso-Rodriguez, A., Subramanian, S. S., Li, W. L., Zheng, G., et al. (2019). Successive landsliding and damming of the Jinsha River in eastern Tibet, China: prime investigation, early warning, and emergency response. Landslides 16, 1003–1020. doi:10.1007/s10346-019-01159-x
Fang, J., Yang, W. T., Luan, Y. B., Du, J., Lin, A. W., and Zhao, L. (2019). Evaluation of the TRMM 3B42 and GPM IMERG products for extreme precipitation analysis over China. Atmos. Res. 223, 24–38. doi:10.1016/j.atmosres.2019.03.001
Froude, M. J., and Petley, D. N. (2018). Global fatal landslide occurrence from 2004 to 2016. Nat. Hazards Earth Syst. Sci. 18, 2161–2181. doi:10.5194/nhess-18-2161-2018
Galli, M., Ardizzone, F., Cardinali, M., Guzzetti, F., and Reichenbach, P. (2008). Comparing landslide inventory maps. Geomorphology 94, 268–289. doi:10.1016/j.geomorph.2006.09.023
Gruber, S., Hoelzle, M., and Haeberli, W. (2004). Permafrost thaw and destabilization of Alpine rock walls in the hot summer of 2003. Geophys. Res. Lett. 31, n/a. doi:10.1029/2004GL020051
Handwerger, A. L., Fielding, E. J., Huang, M. H., Bennett, G. L., Liang, C. R., and Schulz, W. H. (2019). Widespread initiation, reactivation, and acceleration of landslides in the northern California coast ranges due to extreme rainfall. J. Geophys. Res. Earth Surf. 124, 1782–1797. doi:10.1029/2019JF005035
Handwerger, A. L., Fielding, E. J., Sangha, S. S., and Bekaert, D. P. S. (2022). Landslide sensitivity and response to precipitation changes in wet and dry climates. Geophys. Res. Lett. 49, e2022GL099499. doi:10.1029/2022GL099499
Hu, K. H., Wu, C. H., Tang, J. B., Pasuto, A., Li, Y. J., and Yan, S. X. (2018). New understandings of the June 24th 2017 xinmo landslide, maoxian, sichuan, China. Landslides 15, 2465–2474. doi:10.1007/s10346-018-1073-2
Huggel, C., Clague, J. J., and Korup, O. (2012). Is climate change responsible for changing landslide activity in high mountains? Earth Surf. Process Landf. 37, 77–91. doi:10.1002/esp.2223
Intrieri, E., Raspini, F., Fumagalli, A., Lu, P., Del Conte, S., Farina, P., et al. (2018). The Maoxian landslide as seen from space: detecting precursors of failure with Sentinel-1 data. Landslides 15, 123–133. doi:10.1007/s10346-017-0915-7
Kuang, J. M., Ng, A. H.-M., Ge, L. L., Metternicht, G. I., and Clark, S. R. (2023). Joint use of optical and radar remote sensing data for characterizing the 2020 aniangzhai landslide post-failure displacement. Remote Sens. 15, 369. doi:10.3390/rs15020369
Lacroix, P., Bièvre, G., Pathier, E., Kniess, U., and Jongmans, D. (2018). Use of Sentinel-2 images for the detection of precursory motions before landslide failures. Remote Sens. Environ. 215, 507–516. doi:10.1016/j.rse.2018.03.042
Lacroix, P., Dehecq, A., and Taipe, E. (2020). Irrigation-triggered landslides in a Peruvian desert caused by modern intensive farming. Nat. Geosci. 13, 56–60. doi:10.1038/s41561-019-0500-x
Leprince, S., Barbot, S., Ayoub, F., and Avouac, J.-P. (2007). Automatic and precise orthorectification, coregistration, and subpixel correlation of satellite images, application to ground deformation measurements. IEEE Trans. Geosci. Remote Sens. 45, 1529–1558. doi:10.1109/TGRS.2006.888937
Liu, X. J., Zhao, C. Y., Zhang, Q., Lu, Z., and Li, Z. H. (2020). Deformation of the Baige landslide, Tibet, China, revealed through the integration of cross-platform ALOS/PALSAR-1 and ALOS/PALSAR-2 SAR observations. Geophys. Res. Lett. 47. doi:10.1029/2019GL086142
Liu, Y., Qiu, H. J., Yang, D. D., Liu, Z. J., Ma, S. Y., Pei, Y. Q., et al. (2022). Deformation responses of landslides to seasonal rainfall based on InSAR and wavelet analysis. Landslides 19, 199–210. doi:10.1007/s10346-021-01785-4
Main, I. G. (2000). A damage mechanics model for power-law creep and earthquake aftershock and foreshock sequences. Geophys. J. Int. 142, 151–161. doi:10.1046/j.1365-246x.2000.00136.x
Meng, Y. S., Lan, H. X., Li, L. P., Wu, Y. M., and Li, Q. W. (2015). Characteristics of surface deformation detected by X-band SAR interferometry over sichuan-tibet grid connection project area, China. Remote Sens. 7, 12265–12281. doi:10.3390/rs70912265
Ouyang, C. J., He, S. M., Xu, Q., Luo, Y., and Zhang, W. C. (2013). A MacCormack-TVD finite difference method to simulate the mass flow in mountainous terrain with variable computational domain. Comput. Geosci. 52, 1–10. doi:10.1016/j.cageo.2012.08.024
Ouyang, C. J., Zhao, W., An, H. C., Zhou, S., Wang, D. P., Xu, Q., et al. (2019). Early identification and dynamic processes of ridge-top rockslides: implications from the Su Village landslide in Suichang County, Zhejiang Province, China. Landslides 16, 799–813. doi:10.1007/s10346-018-01128-w
Ozturk, U., Bozzolan, E., Holcombe, E. A., Shukla, R., Pianosi, F., and Wagener, T. (2022). How climate change and unplanned urban sprawl bring more landslides. Nature 608, 262–265. doi:10.1038/d41586-022-02141-9
Patton, A. I., Rathburn, S. L., and Capps, D. M. (2019). Landslide response to climate change in permafrost regions. Geomorphology 340, 116–128. doi:10.1016/j.geomorph.2019.04.029
Pei, Y. Q., Qiu, H. J., Yang, D. D., Liu, Z. J., Ma, S. Y., Li, J. Y., et al. (2023). Increasing landslide activity in the Taxkorgan River Basin (eastern Pamirs Plateau, China) driven by climate change. Catena 223, 106911. doi:10.1016/j.catena.2023.106911
Pepe, A., and Lanari, R. (2006). On the extension of the minimum cost flow algorithm for phase unwrapping of multitemporal differential SAR interferograms. IEEE Trans. Geosci. Remote Sens. 44, 2374–2383. doi:10.1109/TGRS.2006.873207
Qi, W. W., Yang, W. T., He, X. L., and Xu, C. (2021). Detecting Chamoli landslide precursors in the southern Himalayas using remote sensing data. Landslides 18, 3449–3456. doi:10.1007/s10346-021-01753-y
Shah, B., Alam, A., Bhat, M. S., Ahsan, S., Ali, N., and Sheikh, H. A. (2023). Extreme precipitation events and landslide activity in the Kashmir Himalaya. Bull. Eng. Geol. Environ. 82, 328. doi:10.1007/s10064-023-03350-w
Stumpf, A., Malet, J.-P., and Delacourt, C. (2017). Correlation of satellite image time-series for the detection and monitoring of slow-moving landslides. Remote Sens. Environ. 189, 40–55. doi:10.1016/j.rse.2016.11.007
Thackeray, C. W., Hall, A., Norris, J., and Chen, D. (2022). Constraining the increased frequency of global precipitation extremes under warming. Nat. Clim. Chang. 12, 441–448. doi:10.1038/s41558-022-01329-1
Tian, Q. H., Zhang, W. T., and Zhu, W. (2023). Characterizing crustal deformation of the weihe fault, weihe basin (Central China), using InSAR and GNSS observations. Appl. Sci. 13 (11), 6835. doi:10.3390/app13116835
Van Westen, C. J., Castellanos, E., and Kuriakose, S. L. (2008). Spatial data for landslide susceptibility, hazard, and vulnerability assessment: an overview. Eng. Geol. 102, 112–131. doi:10.1016/j.enggeo.2008.03.010
Wang, Y. J., Cui, X. M., Che, Y. H., Li, P. X., Jiang, Y., and Peng, X. Z. (2022). Automatic identification of slope active deformation areas in the Zhouqu region of China with DS-InSAR results. Front. Environ. Sci. 10, 883427. doi:10.3389/fenvs.2022.883427
Werner, C., Wegmuller, U., Strozzi, T., and Wiesmann, A. (2003). “Interferometric point target analysis for deformation mapping,” in Igarss 2003. 2003 IEEE international geoscience and remote sensing symposium. Proceedings (IEEE cat. No.03CH37477) (Toulouse, France: IEEE), 4362–4364. doi:10.1109/IGARSS.2003.1295516
Yang, W. T., Fang, J., and Liu-Zeng, J. (2021). Landslide-lake outburst floods accelerate downstream hillslope slippage. Earth Surf. Dynam. 9, 1251–1262. doi:10.5194/esurf-9-1251-2021
Yang, W. T., Liu, L. Y., and Shi, P. J. (2020a). Detecting precursors of an imminent landslide along the Jinsha River. Nat. Hazards Earth Syst. Sci. 20, 3215–3224. doi:10.5194/nhess-20-3215-2020
Yang, W. T., Wang, Y. J., Wang, Y. Q., Ma, C., and Ma, Y. H. (2020b). Retrospective deformation of the Baige landslide using optical remote sensing images. Landslides 17, 659–668. doi:10.1007/s10346-019-01311-7
Yang, Z. F., Li, Z. W., Zhu, J. J., Preusse, A., Hu, J., Feng, G. C., et al. (2018). Time-series 3-D mining-induced large displacement modeling and robust estimation from a single-geometry SAR amplitude data set. IEEE Trans. Geosci. Remote Sens. 56, 3600–3610. doi:10.1109/TGRS.2018.2802919
Zhang, J. M., Zhu, W., Cheng, Y. Q., and Li, Z. H. (2021). Landslide detection in the linzhi–ya’an section along the sichuan–tibet railway based on InSAR and hot spot analysis methods. Remote Sens. 13, 3566. doi:10.3390/rs13183566
Zhang, S. L., Yin, Y. P., Hu, X. W., Wang, W. P., Zhang, N., Zhu, S. N., et al. (2020a). Dynamics and emplacement mechanisms of the successive Baige landslides on the upper reaches of the Jinsha River, China. Eng. Geol. 278, 105819. doi:10.1016/j.enggeo.2020.105819
Zhang, Y., Meng, X. M., Dijkstra, T. A., Jordan, C. J., Chen, G., Zeng, R. Q., et al. (2020b). Forecasting the magnitude of potential landslides based on InSAR techniques. Remote Sens. Environ. 241, 111738. doi:10.1016/j.rse.2020.111738
Zhong, Y., Chen, G., Meng, X. M., Yue, D. X., Zhang, Y., Guo, F. Y., et al. (2022). Analysis of the transformation mechanism and prediction of a landslide debris flow multi-hazards chain in an alpine canyon area: a case study in Zhouqu. J. Lanzhou Univ. Nat. Sci. 58 (3). doi:10.13885/j.issn.0455-2059.2022.03.012
Keywords: pixel offset tracking, small baseline subset-interferometric synthetic aperture radar, landslide deformation, climate change, landslide simulation
Citation: Liu M, Yang W, Xu C, Yang Y, Taylor L and Shi P (2024) Impact of precipitation on Beishan landslide deformation from 1986 to 2023. Front. Earth Sci. 11:1304969. doi: 10.3389/feart.2023.1304969
Received: 30 September 2023; Accepted: 27 December 2023;
Published: 16 January 2024.
Edited by:
Jie Dou, China University of Geosciences Wuhan, ChinaReviewed by:
Weile Li, Chengdu University of Technology, ChinaCopyright © 2024 Liu, Yang, Xu, Yang, Taylor and Shi. This is an open-access article distributed under the terms of the Creative Commons Attribution License (CC BY). The use, distribution or reproduction in other forums is permitted, provided the original author(s) and the copyright owner(s) are credited and that the original publication in this journal is cited, in accordance with accepted academic practice. No use, distribution or reproduction is permitted which does not comply with these terms.
*Correspondence: Chong Xu, eGMxMTExMTExMUAxMjYuY29t; Wentao Yang, eWFuZ193ZW50YW9AYmpmdS5lZHUuY24=
Disclaimer: All claims expressed in this article are solely those of the authors and do not necessarily represent those of their affiliated organizations, or those of the publisher, the editors and the reviewers. Any product that may be evaluated in this article or claim that may be made by its manufacturer is not guaranteed or endorsed by the publisher.
Research integrity at Frontiers
Learn more about the work of our research integrity team to safeguard the quality of each article we publish.