 Shigang Gao1,2
 Yongliang Liu
 Jing Chai
95% of researchers rate our articles as excellent or good
Learn more about the work of our research integrity team to safeguard the quality of each article we publish.
Find out more
ORIGINAL RESEARCH article
Front. Earth Sci. , 27 December 2023
Sec. Geoinformatics
Volume 11 - 2023 | https://doi.org/10.3389/feart.2023.1301595
This article is part of the Research Topic Coal and Rock Dynamic Disasters: Advances of Physical and Numerical Simulation in Monitoring, Early Warning, and Prevention, volume II View all 29 articles
The thickness of top coal is the main factor affecting the stability of the large cross section open-off cut under the goaf. The 1-2 lower 203 cross section open-off cut of the Huojitu Coal Mine was used as the background to investigate the top coal rational thickness of the large cross section open-off cut under the goaf in slicing mining. The top coal above the cut was simplified into a beam model to calculate its plastic zone range with the elastoplastic theory under the influence of the upper slicing mining and the lower slicing cut excavating. The deformation law of the top coal of the large cross section open-off cut under different top coal thicknesses was studied with both a simulation experiment and numerical simulation. The displacement, stress, and top coal structure of the surrounding rock of the cut were observed in situ using several observation methods. The results show that the plastic zone of the floor in the upper slicing face and the influence of the cut excavation are 2.02 m and 1.43 m, and the maximum plastic zone of the top coal is 3.45 m. A top coal thickness of more than 3.45 m is conducive to maintaining the stability of the large cross section open-off cut. The top coal of the cut can be divided into the roof-fall hazard zone and roof-fall warning zone according to the results monitored by distributed optical fiber. When the top coal thickness is 3.0 m, 3.5 m, and 4.0 m, the deformation law changes from an exponential deformation to a linear and then to a logarithmic relationship in the roof-fall hazard zone and from a linear to a logarithmic relationship in the roof-fall warning zone. When the thickness of top coal is 3.5 m and 4.0 m, the subsidence trend of the top coal visibly decreases, and the subsidence is only 56% and 39% of the subsidence of that of a thickness of 3 m. The deformation law of top coal measured using the DIC (Digital Image Correlation, DIC) is consistent with that of distributed optical fiber. The average thickness of the top coal reserved in the 1-2 lower 203 large cross section open-off cut is 4.0 m. The maximum surface subsidence of the top coal cut hole is 12 mm in the field monitoring. The maximum internal subsidence is 6 mm, and the maximum shed beam strain is –416 με. The deformation of the top coal is slight, indicating that the top coal thickness of 3.5–4.0 m is reasonable.
The cumulative proven coal reserves in northern Shaanxi are 138.8 billion tons, and the remaining coal reserves are 131.5 billion tons, making it rich in resources. Among them, the maximum recoverable thickness of a single layer in the Jurassic coalfield in the Shenfu mining area is 12.5 m. In the early days, due to technical limitations, many mines adopted layered mining technology for mining. When mining in the lower coal seam, due to the influence of small kilns, etc., the production roadway of the working face is laid out under the goaf of the upper layer. The thickness of the top coal and the support technology have become the main technical problems in the mining of the lower coal seam (LIU et al., 2013; CHAI et al., 2022a; HE and HUANG, 2022; XIA et al., 2022; XIA et al., 2023).
The research on the layered mining of thick coal seams and the top coal retention and support technology of the roadway in the lower coal seam mainly focuses on the tunnel excavation and supporting technology in the goaf area of close coal seams (DONG et al., 2013; GAO and ZHANG, 2014; Qi, 2018). WANG et al. (2020) studied the position and support method of the tunnel at the lower working face in the goaf area of the coal seam at a very close distance and reasonably offset it from the upper residual coal pillar by 9 m, effectively avoiding the influence of the residual coal pillar in the upper goaf area, and proposed this method of supporting the roadway under similar conditions. CAO (2015) used theoretical analysis and proposed a very close coal seam support scheme that used the top coal thickness of 3 m as the dividing line to carry out segmented support and improve the strength and pre-tightening force of the anchor bolts. The size of the large section cut hole of 1-2 coal seam in the Shigetai Mine is 7.9 × 3 m. It adopts an “anchor rod + steel mesh + anchor cable + steel beam shed + single pillar” approach. The joint support scheme has a maximum moving distance of 42 mm for the roof and bottom plates and a maximum moving distance of 26 mm for the two gangs, which can meet the requirements of working face installation and normal mining (ZHAO, 2018). In view of the disturbance caused by working adjacent faces under the goaf, Yang et al. (2019) suggested the technology of combining pressure relief with bolt support to control the stability of the surrounding rock of the roadway under the goaf after analyzing the fracture mechanism and stress distribution of the key strata of the overlying rock and the deformation distribution characteristics of the rock surrounding the roadway on the side of the goaf. GAO et al. (2021) simulated the deformation and stress of the surrounding rock and supporting structure during the tunneling process under the goaf, compared the deformation and stress concentration states of the tunnel-surrounding rock under different support row spacings, and verified the rationality of the support scheme.
In the theoretical research of the stability of a lower stratified mining roadway, scholars have studied the failure factors and failure rules of large-section tunnels and cut-hole surrounding rocks (CHAI et al., 2008; NIU et al., 2014). HE et al. (2014) used numerical simulation to analyze the zoning characteristics and crack evolution rules of the surrounding rock fissure fields when the hole width was 6–10 m. Anchor belt nets and double truss anchor cables were used to support the joint during excavation, resulting in completion of the hole in 10 days. The movement of the roof and floor of the tunnel and the two sides was small, and the surrounding rock control effect was good. ZHANG et al. (2004) studied the anchor network cable support scheme for the surrounding rock of fully mechanized caving in thick coal seams. They used Timoshenko beams to analyze the roof-like connectors and the side coal mass and determined the factors that affect the stability of the opening. The support plan was optimized, and specific support parameters were determined. Jiang et al. (2021) established a mechanical model of the roof under the goaf and deduced its internal force according to the failure characteristics of the surrounding rock of the stope roof. The shear and compression safety factors of the open-off cut roof were given, and the factors affecting the stability of the roof were the span of the open-off cut and the thickness of the roof. In order to solve the problem of roof coal support for large-span openings under goafs in layered mining of thick coal seams, CHAI et al. (2022b) and CHAI et al. (2022c) analyzed the load-bearing deformation and failure characteristics of large-span roof coals, derived the extreme value conditions of instability, and analyzed the deformation laws of the top coal with the hole peek device.
The roof of the cut hole in the lower coal seam was damaged before tunneling. The roof structure changed, cracks developed, stability was poor, and the risk of roof falling increased, which brought many technical difficulties to the lower coal seam tunneling (Yan et al., 2015; Xinjie et al., 2016; He et al., 2023). Scholars calculated the initial breaking distance and periodic breaking distance of the roof by constructing a plate model and used the beam model to analyze the stability of the tunnel roof (Xiao et al., 2011; Tulu et al., 2016). In terms of the broken load-bearing structure of the tunnel roof, JIANG et al. (2016) established a continuous deep beam mechanical structure model under uniform load and obtained the stress distribution law of the roof rock layer under tunnel mining. YAO (2014) analyzed the mining tunnel of the Hexi Mine and deduced the deep-seated reasons for the breakage of the roof anchor cables. The maximum deflection and angle under three different combination structures of the broken roof rock layer block beam, fixed beam, and composite beam of the roadway were discussed. Factors such as the roadway width, interburden thickness, upper coal seam mining height, and relationship with roof deformation were discussed. Through UDEC (Universal Distinct Element Code, UDEC), Liu et al. (2021) analyzed the fracture evolution law and failure form of the surrounding rock of the open-off cut roof during the first excavation and the second excavation. Xie et al. (2020) used numerical simulation software to analyze the distribution characteristics of effective prestress in the roof of the goaf and concluded that it can form an anchored rock beam structure. Few scholars have constructed a mechanical model of the tunnel roof to analyze the deformation laws of the top coal under the goaf, and there are few studies on related support technologies.
In summary, most of the existing research results are research on the support technology of large-section hole cutting under the goaf area of close coal seams. There are few reports on the thickness of the top coal left for large cross-section cut holes under the goaf and the coupling relationship between the surrounding rock and the supporting structure under layered mining conditions (Gong et al., 2019). Ensuring the stability of the surrounding rock of the cut holes while maximizing the reduction of the thickness of top coal can both improve the recovery rate of legacy coal resources and reduce the amount of tunneling work (undercover amount). This has become the focus of current research. This paper uses theoretical calculations to obtain the depth of damage to the upper-layer mining floor and the plastic damage range of the top coal caused by the lower coal seam cutting tunneling. Both physically similar simulation tests and numerical simulations were carried out to study the deformation of three groups of top coal thickness conditions. The work is expected to provide a scientific and reasonable basis for large cross-section open-off cut under similar working conditions.
The average coal thickness of the 1-2 203 coal seam composite area in the Huojitu Coal Mine is 10 m, the buried depth is 63–87 m, and the average buried depth is 80 m. Due to the limitations of the manufacturing level of mechanized mining equipment at that time, this panel adopted the layered mining method for mining. The upper-layer working face was designed to have a mining height of 4.5–5 m, and a remaining 5-m-thick coal seam was retained in the upper-layer goaf area. Under this situation, more than 30 million tons of coal resources have not been mined. In order to avoid the small kiln cross-border area, it is planned to arrange the 1-2 lower 203 large cross section open-off cut under the 1-2 upper 203 goaf area, as shown in Figure 1.
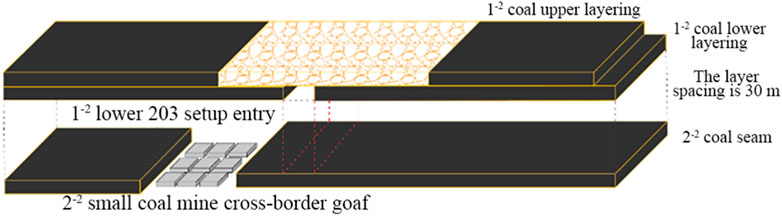
FIGURE 1. Cut selection scheme of the 1-2 lower 203 working face in the Huojitu mine.
The 1-2 lower 203 working face excavation tunnel includes the 1-2 lower 203 tunnel, the shunting chamber, the end frame nest, and the shearer machine nest. The design length of the cutout is 251.4 m, the width is 9.0 m, and the height is 3.9 m. The cross-section of the cut is large. In order to prevent the roof from connecting with the goaf above during the excavation process, leaving a reasonable thickness of top coal becomes the main issue to ensure safe production on the working face.
The 1-2 lower 203 working face is located below the goaf of the 1-2 upper 203 working face. After the working face is mined, the top coal plastic zone consists of two parts affected by the mining of the upper-layer working face. As shown in Figure 2, one part is calculated through elastic–plastic theory, which determines the maximum damage depth, hmax, of the floor after the upper layer is mined. The other part is the plastic state after the coal and rock mass is stressed during the tunneling process; its thickness is h1. The sum of the two thicknesses is regarded as the maximum range of the plastic zone H of the coal beam.
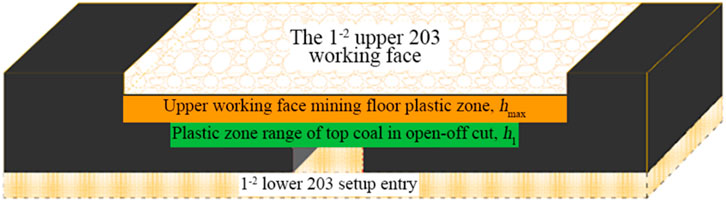
FIGURE 2. Composition of the plastic zone of cut top coal.
A goaf is formed behind the longwall working face, and it has a rectangular cross section. The mining height of the coal seam will be very small compared with the width of the longwall working face. Assume that the mining length of the working face is L, the vertical stress is γH, the horizontal stress is xγH (x is the lateral stress coefficient), and r0 is the maximum damage distance in front of the stope. Using elastic theory (Schenato et al., 2017), the horizontal stress, vertical stress, and shear stress near the stope can be obtained as follows:
Here, r is the boundary of the failure zone and θ is the angle between the edge and the horizontal direction at the maximum yield depth, h.
Analysis of Equation 1 shows that if the point (r, θ) is known, the stress of the surrounding rock of the stope is directly proportional to the buried depth of the working face and the length of the working face. Based on the actual mining conditions of the Huojitu Coal Mine, the boundary of the damage area is r<L, and the lateral pressure coefficient x is generally 1. Substituting these values into Equation 1, the principal stress of the stope edge is obtained as follows:
Here, r is the boundary of the failure zone, γ is the bulk density of the rock formation, H is the buried depth, L is the mining length of the working face, and θ is the angle between the edge and the horizontal direction at the maximum yield depth, h.
Assuming that the surrounding rock failure obeys the Mohr–Coulomb criterion, the following formula can be obtained:
Here, Rc represents the uniaxial compressive strength and ϕ represents the internal friction angle.
Substituting Equation 1 into Equation 3, the yield failure depth h of the floor caused by stress concentration below the edge of the mining layer can be calculated as
After finding the first-order derivative of θ in the aforementioned formula and allowing the derivative to be zero, the maximum value of the base plate failure depth under the plane stress state can be obtained:
This maximum value is obtained when θ is approximately −75°. According to the aforementioned formula, it can be seen that the damage depth of the floor is positively related to the square of the inclination length of the working face and the buried depth. It is negatively related to the square of the compressive strength of the floor. When calculating the thickness of floor failure, we use the elastic–plastic theory and take into account the factors affecting the joint cracks existing in the floor. Then, Equation 6 becomes
Here, δ is the influence coefficient of joints and fissures in the floor rock layer, γ is the average bulk density of the overlying rock layer of the mined coal seam in kN/m3, H is the average buried depth of the mined coal seam in m, L is the inclination length of the mining coal seam working surface in m, and Rc represents the compressive strength of the floor rock layer in MPa.
During the lower coal seam cut hole excavation process, without being disturbed by the mining of the upper layer, the top coal of the cut near the upper coal seam will first undergo elastic deformation and then plastic damage. According to the analysis of the stress characteristics of beam structures in elastic–plastic mechanics, the strain at the x-axis section is
Here, ρ is the radius of curvature of the beam, and the relationship with the deflection is
According to the elastic theory, the stress is
In the elastic stage, the relationship between curvature and bending moment is
It can be seen that the normal stress of elastic bending is distributed linearly in the direction, taking the maximum absolute value at y=± h/2:
According to the yield condition of the uniaxial stress state, when |σ|max <σs, the cross section is all in the elastic state; when |σ|max =σs, the elastic stage reaches the limit, and the elastic limit bending moment Me is
When M>Me, the cross section enters the plastic stage from the elastic stage, and the corresponding normal stress approaches the ultimate stress at y=±h/2. Forming a plastic zone in which the normal stress is evenly distributed, the area near the neutral axis is still an elastic zone, and the normal stress is still linearly distributed. Using the static equilibrium relationship, we can get
As M increases, ξ decreases; that is, the plastic zone continues to expand, and the elastic zone continues to shrink until ξ = 0, and the cross section completely enters the plastic state. At this time, the plastic limit bending moment Ms is
From the aforementioned formula, it can be seen that the plastic ultimate bending moment of the roof coal beam is related to the yield strength, span, and height of the coal beam. Therefore, measures can be taken to increase the thickness of the roof coal, improve its resistance to damage, and prevent the cut hole roof coal from entering a plastic state. The coal beam is stable before it is damaged by mining. According to material mechanics calculations, the maximum bending moment under a vertical load is
To ensure that all coal beams do not enter the plastic state, Ms ≥ Mmax must exist, that is,
The average buried depth of the 1-2 coal seam in the Huojitu Coal Mine is 76 m, the coal seam thickness is 9.5–10.6 m, the average mining height of the upper layer is 4 m, and the length of the 1-2 upper 203 working face is 210 m. The uniaxial compressive strength Rc of the 1-2 coal is 9.2 MPa, the influence coefficient δ of floor joint cracks is 0.95, the average bulk density of the overlying rock layer γ = 0.018 kN/m3, and the highest stress concentration coefficient K1 = 3.5. Substituting the aforementioned geological parameters into Equation 5, the specific calculation results are as follows:
The maximum damage depth of the upper layer mining floor is 2.02 m, and the range of plastic damage of the coal beam is 0–2.02 m.
According to the actual situation on site, the uniform load q=1.4 Mpa and σs=9.2 Mpa overlying the cut-out eye are substituted to obtain h1≥1.43 m. That is, when the hole is tunneled, the maximum plastic range of the top coal is 1.43 m. The maximum range of the plastic zone of the top coal of the cut hole is
That is, when the thickness of the top coal of the cutting hole is greater than 3.45 m, it is beneficial to maintain the stability of the cutting hole.
A simulation was conducted to determine the reasonable top coal thickness for cut hole in the 1-2 lower 203 coal seam working face using a simulation test platform with a length of 3,000 mm, a width of 200 mm, and a height of 2,000 mm. The geometric similarity ratio of the simulation experiment is 1:50, the stress similarity ratio is 78, and the time similarity ratio is 7.1. The model ratios are shown in Table 1.
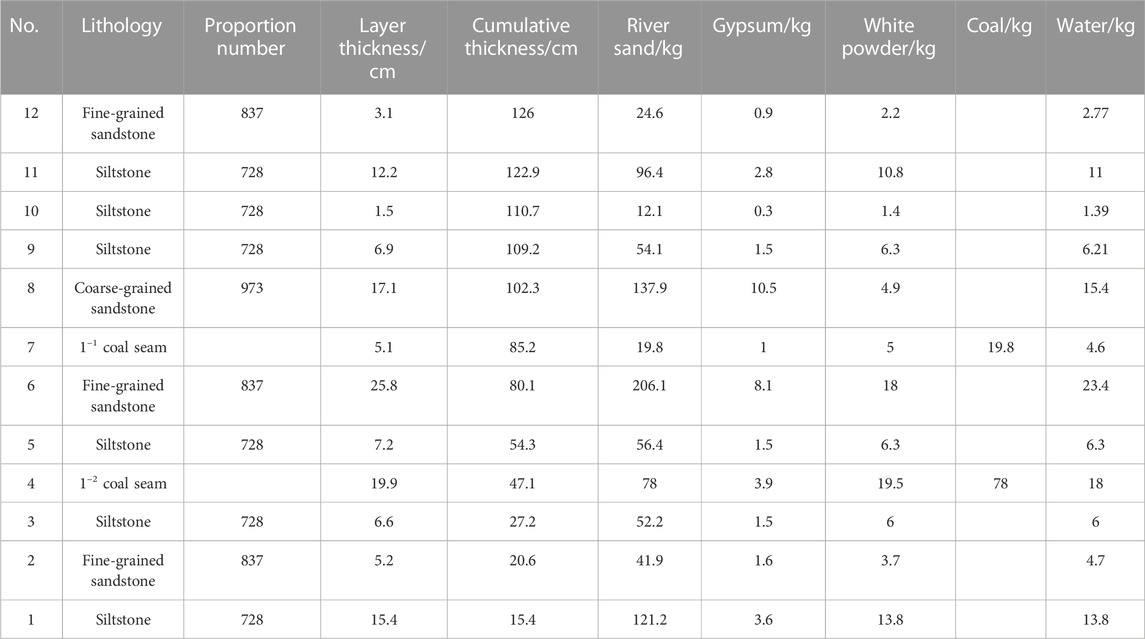
TABLE 1. Physical similarity simulation experiment material ratio.
According to the theoretical analysis results, the thickness of the top coal at cut hole No.1, No.2, and No.3 is 3 m, 3.5 m, and 4 m, respectively. During the model building process, the acrylic mold is pre-embedded and cut. According to the actual situation, the 1-2 upper 203 coal seam working face was mined to form the goaf, and then the die was pulled to simulate the cut hole mining process. The simulation was run six times.
Fiber optic sensing technology has the advantages of wide distribution and high precision and has been applied in similar simulation experiments to monitor overlying rock deformation and working face pressure (Xie et al., 2020). This article applies distributed fiber optic technology to similar simulation experiments. As shown in Figure 3, the experiment monitored the deformation of the top coal from the inside and the surface of the model. In this test, the layers were under the 1-2 coal, and a 2 mm horizontal optical fiber was arranged on the cut hole roof with a strain coefficient of 0.0497 MHz/με. In the test, the NBX6055 spatial resolution was set to 1 cm, and the monitoring accuracy was 50 με. A distributed optical fiber sensing system based on BOTDA (Brillouin Optical Time Domain Analysis, BOTDA) technology was used to monitor the internal deformation of the top coal of the cut hole. The equipment was an NBX-6055 photometer. During the test process, the spatial resolution of the instrument was 5 cm, the sampling interval was 1 cm, and the sensing distance was 20 km. The optical fiber was implanted into the physical model using pre-embedding. When the model was laid to the height of the sensor position, the optical fiber was horizontally laid into the center of the model. After the model was laid, tension was applied to the two segments of the optical fiber to maintain the horizontal state of the optical fiber in the model.
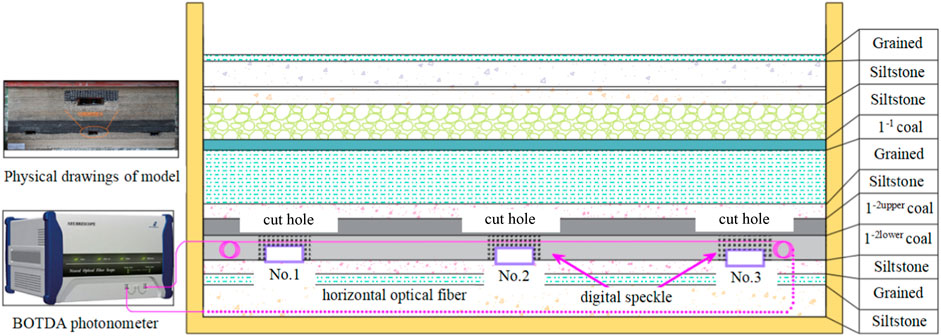
FIGURE 3. Model monitoring system.
After the model was built, speckle spots were arranged on the top coal above the cut holes and the two coal bodies. The digital speckle system camera has 12 million pixels and a strain measurement range of 0.005%–2,000%. During the experiment, the shooting frequency was 1 Hz, the strain measurement accuracy was 0.005%, and the displacement measurement accuracy was 10 μm (0.01 pixels). Data were collected for cut holes No.1, No.2, and No.3 for each excavation. The open-off cut process of the 1-2 coal seam is shown in Figure 4 a. The caving characteristics of overlying strata after the mining of the upper layer working face are shown in Figure 4b.
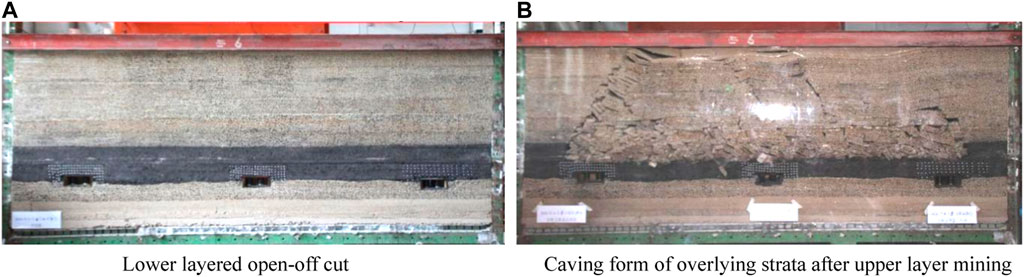
FIGURE 4. Physical similarity simulation experiment result diagram. (A) Lower layer open-off cut. (B) Caving form of overlying strata after upper-layer mining.
The optical fiber monitoring results of top coal deformation during the excavation process of entries No.1, No.2, and No.3 are shown in Figure 5, with the center of the top coal as the 0 point. It can be seen that the deformation of the top coal is distributed in a “W” shape. The deformation characteristics of positive fiber-optic sensing tension and negative pressure indicate that the middle part of the top coal appears to sink significantly due to the influence of its own weight and the load of the overlying goaf. With the tunneling, the subsidence within the ±50 mm range of the center of the top coal of cut holes No.1, No.2, and No.3 is significantly greater than that of the two sides, showing the zoning characteristics of a large deformation in the middle and small deformation on both sides. The area within ±50 mm of the center of the top coal can be divided into roof-fall hazard areas. It shows that when the cut hole width of the 1-2 203 working face is 9.96 m, the roof deformation is large within 5 m of the center of the cutout. If the support is not placed in a timely manner, there is a greater risk of top coal falling.
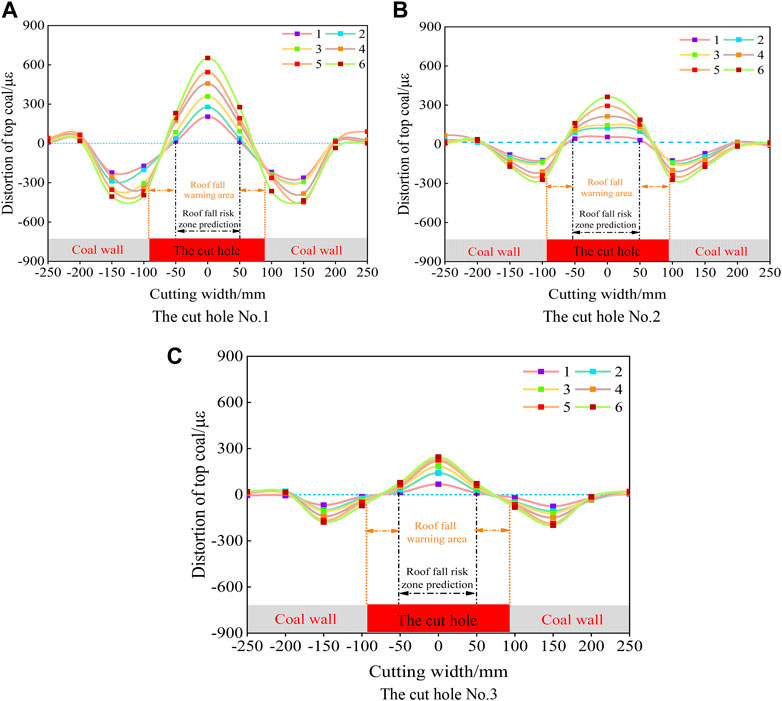
FIGURE 5. Deformation results of top coal monitored with the horizontal optical fiber. (A) cut hole No.1 (B) cut hole No.2. (C) cut hole No.3.
Within the range of ±50–100 mm on both sides of the cut holes No.1, No.2, and No.3, the horizontal optical fiber test results gradually changed from positive strain to negative strain, indicating that the subsidence of the top coal gradually decreased near the two sides of the cut hole. As the tunneling distance increases, the subsidence of the top coal in the area of cut holes No.1, No.2, and No.3 also gradually increases, but the peak deformation is only 7%–37% of the deformation in the center of the tunnel, indicating high stability. Therefore, within the range of 2.5 m between the two sides of the cut hole, the possibility of roof coal caving is small, and this area can be identified as a roof caving warning area.
The deformation characteristics of the roof risk zone during the excavation process of cut holes No.1, No.2, and No.3 are shown in Figure 6. Comparing the optical fiber test results of cut holes No.1, No.2, and No.3, the center subsidence of the top coal of cut hole 1 in the roof collapse danger zone was significantly greater than that of setup No.2 and No.3 at each excavation stage. After the cut hole was penetrated, it reached 652 με; the center of cut hole No.2 was 363 με, and the deformation amount was approximately 56% of that of cut hole No.1; the deformation of cut hole No.3 was the smallest, and the subsidence amount of the top coal after the cut hole was penetrated was only 228 με, which was approximately 35% of that of cut hole No.1. Fitting the deformation results of the top coal center points of cut holes No.1, No.2, and No.3 found that as the cut hole is tunneled to penetration, when the top coal thickness is 3 m, the subsidence amount of the top coal roof risk area of the cut hole increases approximately exponentially. When the thickness of the top coal is 3.5 m, the deformation amount in the risk zone of roof coal collapse increases approximately linearly. When the thickness of the top coal is 4 m, the deformation amount in the risk zone of roof coal collapse increases approximately logarithmically. These results show that when the width of the cut hole is constant and the thickness of the top coal of the cut hole in the 1-2 203 working face is set to 3 m, the stability of the top coal is poor, the subsidence of the roof collapse danger zone increases exponentially, the deformation of the top coal is large, and the maintenance of the cut hole is difficult. When the thickness of the top coal is set to 3.5 m, the stability of the top coal is moderate, the subsidence in the risk area of roof collapse increases linearly, and the deformation of the top coal is between that of the 3.0 m and the 4.0 thicknesses. When the thickness of the top coal is set to 4 m, the stability of the top coal is high, and the risk area width of roof collapse is minimum. The amount of subsidence increases with an approximate logarithmic law, and within a certain period of time after the hole is cut through, the amount of deformation of the top coal changes little.
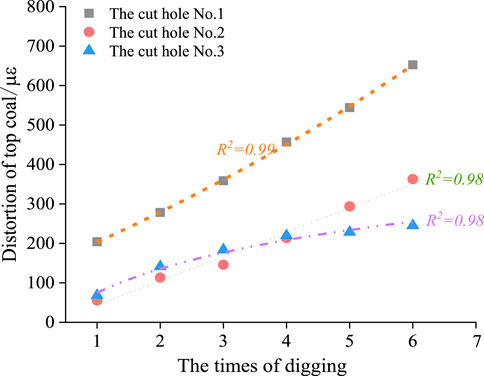
FIGURE 6. Deformation law of roof-fall hazard area.
As the hole is tunneled, the deformation patterns of the roof collapse warning zones with different top coal thicknesses are shown in Figure 7. Figure 7A shows the deformation characteristics of the roof collapse warning area on the left side of the cut holes No.1, No.2, and No.3, and Figure 7B shows the deformation characteristics of the roof collapse warning area on the right side of the cut holes No.1, No.2, and No.3. As the number of excavations increases, the subsidence of the roof collapse warning area on the left and right sides of the No.1 cut eye increases approximately linearly. When the tunnel is penetrated, the deformation of the roof collapse warning area on the left side of the No.1 cut eye reaches 231 με, and the roof collapse danger area on the right side reaches 278 με. The subsidence in the roof collapse warning area on the left and right sides of cut holes No.2 and No.3 increases logarithmically, and the growth rate of the top coal subsidence gradually decreases after the third tunneling. After the penetration, the subsidence amount of the roof collapse warning area on the left side of the cut hole No.2 is 161 με, and the subsidence amount on the right side is 187 με. The subsidence amount of the roof collapse warning area on the left side of the cut hole No.3 is 79 με and that on the right side is 72 με. The roof collapse warning areas of the cut hole No.2 and No.3 are significantly smaller than that of the cut hole No.1.
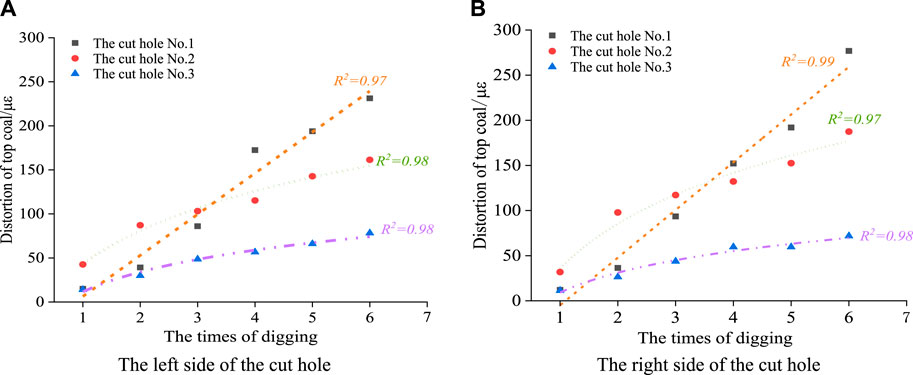
FIGURE 7. Deformation law of roof-fall warning area. (A) Left side of the cut hole. (B) Right side of the cut hole.
In summary, when the thickness of the top coal of the cut hole is 3.0 m, the subsidence of the roof collapse warning area increases linearly with the cut hole tunneling, the stability of the top coal is poor, and the probability of roof collapse risk is relatively high within a certain period of time after the breakthrough. When the thickness of the top coal is 3.5 m and 4.0 m, the subsidence amount in the roof collapse warning area increases logarithmically as the hole is tunneled. During the fourth to sixth tunneling process, the growth rate of the roof coal deformation in the roof collapse warning area slows down significantly; the top coal has better stability.
Comparative analysis of Figures 5 and 6 shows that under different top coal thicknesses, during the tunneling process, the deformation of the top coal roof collapse danger zone in the span direction of the borehole is significantly greater than the roof collapse warning areas on both sides. When the thickness of the top coal is 3.0 m, the deformation pattern of the top coal changes from exponential deformation to linear deformation from the top coal roof risk area to the roof collapse warning areas on both sides. The stability of the top coal is poor, and the risk of roof collapse is high. When the thickness of the top coal is 3.5 m, the deformation pattern of the top coal changes from linear deformation to logarithmic deformation from the roof collapse danger zone in the center of the top coal to the roof collapse warning areas on both sides. The top coal shows a certain self-stabilization ability and good stability. When the thickness of the top coal is 4.0 m, the subsidence law of the top coal is logarithmic within the width of the cut hole for both the roof collapse danger area and the roof collapse warning area. The top coal shows good self-stabilization ability, and the top coal is more stable.
The vertical displacement of the top coal measured using the DIC testing system at the 10 mm horizontal layer above the roof during the tunneling process of each cut was extracted, as shown in Figure 8. The top coal deformation measured using DIC in cut holes No.1, No.2, and No.3 is similar to the distributed optical fiber monitoring results. During the tunneling process, the deformation of the center of the top coal is significantly greater than that of the two sides, showing obvious zoning characteristics. It can still be divided into a roof collapse danger area and a roof collapse warning area. Among them, 45–145 mm is a roof collapse danger area, and the remaining areas are roof collapse warning areas. When the top coal thickness is 3.0 m, after the hole is cut through, the maximum subsidence of the roof collapse danger zone is 0.95 mm. When the top coal thickness is 3.5 m, the maximum subsidence is 0.49 mm. When the top coal thickness is 4.0 m, the maximum subsidence amount is only 0.26 mm. As the top coal thickness increases, the maximum subsidence amount in the roof collapse danger zone gradually decreases. When the top coal thickness is 3.5 m and 4.0 m, the subsidence amount is 52% and 27% of the subsidence at 3 m, respectively. Thicker coal yields higher stability.
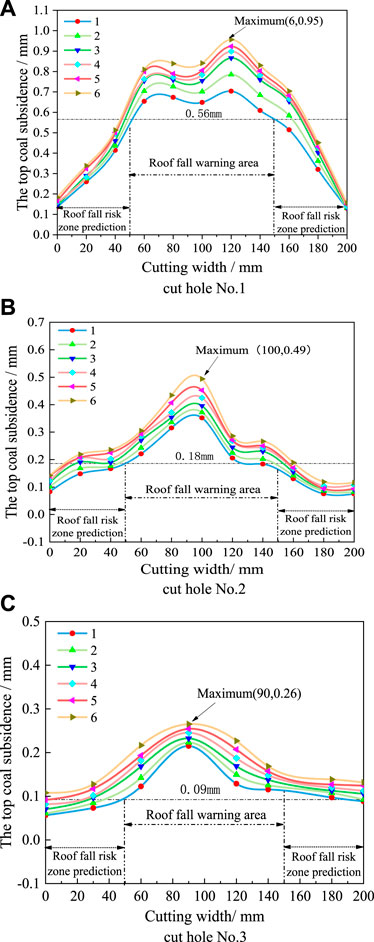
FIGURE 8. DIC monitoring data of cut hole roof subsidence. (A) cut hole No.1, (B) cut hole No.2, and (C) cut hole No.3.
The thickness of the top coal increases from 3.0 m to 4.0 m, and the maximum subsidence amounts in the roof collapse warning areas are 0.56 mm, 0.18 mm, and 0.09 mm, respectively. When the top coal thickness is 3.5 m and 4.0 m, the deformation is only 32% and 16% of that found with a 3.0 m thickness, and the subsidence amount is small. As the hole is cut, the subsidence of the top coal changes little. It shows that when the top coal thickness is greater than 3.5 m, the stability is better.
In order to study the deformation of the surrounding rock in the large-section cut hole under the goaf and verify the reliability of the cut hole support scheme, a local model of the cut hole was established, and different top coal thicknesses were set up, with and without support. The established numerical calculation model is shown in Figure 9. In order to be consistent with the onsite mining conditions, the model adopts the internal excavation method; that is, the working face is inside the model, and the front and back, left and right, and upper and lower parts of the working face are solid coal and rock masses. The stability of a hole cut with top coal thicknesses of 3.0 m, 3.5 m, and 4.0 m was analyzed under various conditions. 3DEC was used to compare and analyze the roof collapse of the hole and tunnel under different top coal thicknesses, and FLAC3D was used to analyze the plastic state and stress distribution characteristics of the surrounding rock mass of the excavation.
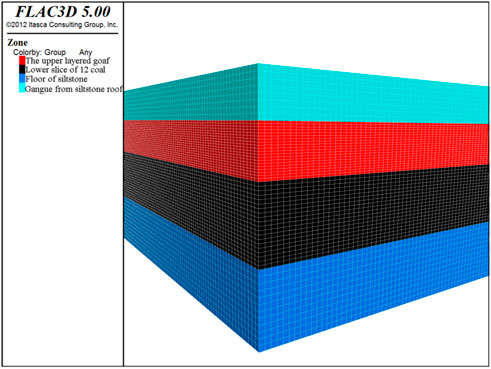
FIGURE 9. Design scheme of the local model.
Figure 10 shows the plastic zone distribution characteristics of cut holes with top coal thicknesses of 3.0 m, 3.5 m, and 4.0 m without support. The plastic zone of the rock surrounding the cut hole is symmetrically distributed. The coal walls on both the front and auxiliary sides of the cut hole with different top coal thicknesses are damaged by tension-shear mixing. There is no obvious change in the damage range. The damage range of the plastic zone of the coal wall is small. The damage depth of the left coal wall is 1 m, and the damage depth of the right coal wall is 0.9 m. The failure mode of the roof rock layer above the cut hole is mainly tensile failure. When the top coal thickness is 4 m, the plastic zone directly above the center of the cut hole reaches 2.9 m. When the top coal thickness is 3.5 m, the plastic zone is 2.5 m. When the thickness is 3 m, the plastic zone is 2.65 m. A "Λ" shaped shear failure area is formed with the cut hole as the center.
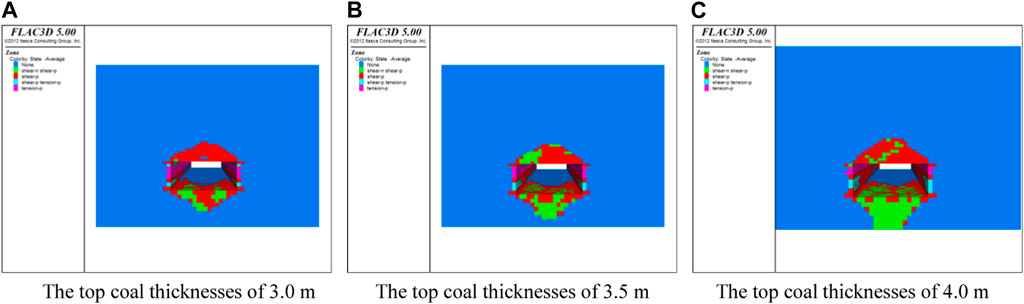
FIGURE 10. Roof caving of cut hole with different top coal thicknesses. (A) Top coal thickness of 3.0 m, (B) top coal thickness of 3.5 m, and (C) top coal thickness of 4.0 m.
Figure 11 shows the vertical displacement cloud diagrams of top coal thicknesses of 3.0 m, 3.5 m, and 4.0 m after support. No large-scale roof collapse was found after support was added, and some blocks were broken. When the top coal thickness is 3.0 m, 3.5 m, and 4.0 m, the maximum subsidence values of the roof are 282 mm, 171 mm, and 154 mm, respectively. Because some blocks have a large breakage subsidence value and the roof subsidence is not obvious at other locations, measuring lines were arranged at two height positions of the roof (0 m and 0.2 m), and the roof subsidence curve was drawn as shown in Figure 12.
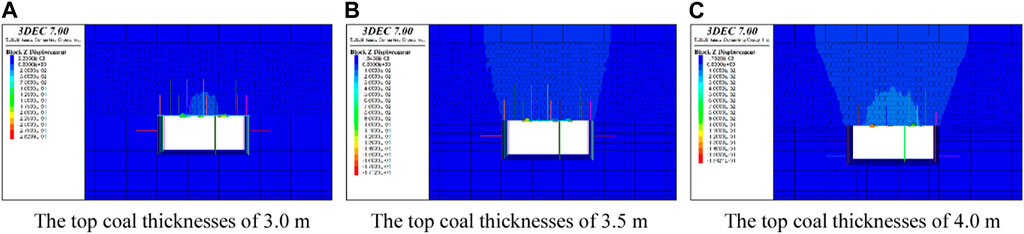
FIGURE 11. Roof subsidence of cut hole with different top coal thicknesses under a support condition. (A) Top coal thickness of 3.0 m, (B) top coal thickness of 3.5 m, and (C) top coal thickness of 4.0 m.
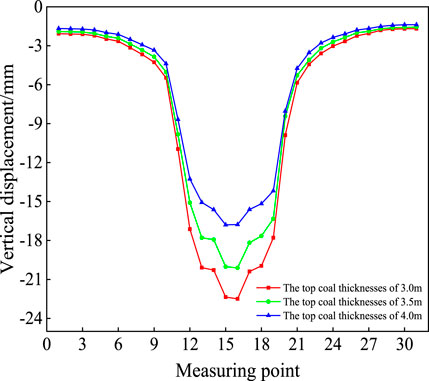
FIGURE 12. Roof subsidence of cut hole with different top coal thicknesses under a support condition.
It can be seen from Figure 10 that the subsidence values of the two height positions of the cut-out roof are small. When the top coal thickness is 3.0 m, 3.5 m, and 4.0 m, the maximum subsidence values of the roof are 23 mm, 20 mm, and 17 mm, respectively, and the support effect is obvious.
Figure 12 show the distribution of plastic zones with top coal thicknesses of 3.0 m, 3.5 m, and 4.0 m after support. The rock formation failure mode in the roof of the cut hole is mainly shear failure. Different top coal thicknesses also have certain damage range differences. When the top coal thickness is 3.0 m, the range of the plastic zone directly above the center of the cut hole reaches 2.58 m. The plastic zone changes less than that without support. The plastic zone is 1.95 m at 3.5 m and 1.31 m at 4.0 m. The range of the plastic zone for top coal thicknesses of 3.5 m and 4.0 m is significantly reduced after support. The effect is obvious.
Figures 13D, E, and 13f show the vertical stress distribution cloud diagrams of top coal thicknesses of 3.0 m, 3.5 m, and 4.0 m after support. When the top coal thickness is 3.0 m, the maximum stress value directly above the cut hole reaches 0.087 MPa; when the top coal thickness is 3.5 m, the maximum stress value is 0.69 MPa; when the top coal thickness is 4.0 m, the maximum stress value is 0.98 MPa. Compared with the no-support condition, the vertical stress cloud diagram changes from a symmetrical distribution to an asymmetrical distribution. Two pressure relief areas are formed with the middle single pillar as the boundary, a 5.4 m pressure relief area on the left and a 3.6 m pressure relief area on the right. The top and bottom plates at the central single pillar position form a certain degree of stress concentration. The degree of compressive stress concentration in the stress concentration areas of the coal walls and bottom corners on both sides is significantly reduced, and a new stress concentration area is formed on the top and bottom plates of the central single pillar. The supporting structure effectively improves the stress concentration of the surrounding rock, and the overall stress distribution of the surrounding rock is more balanced.
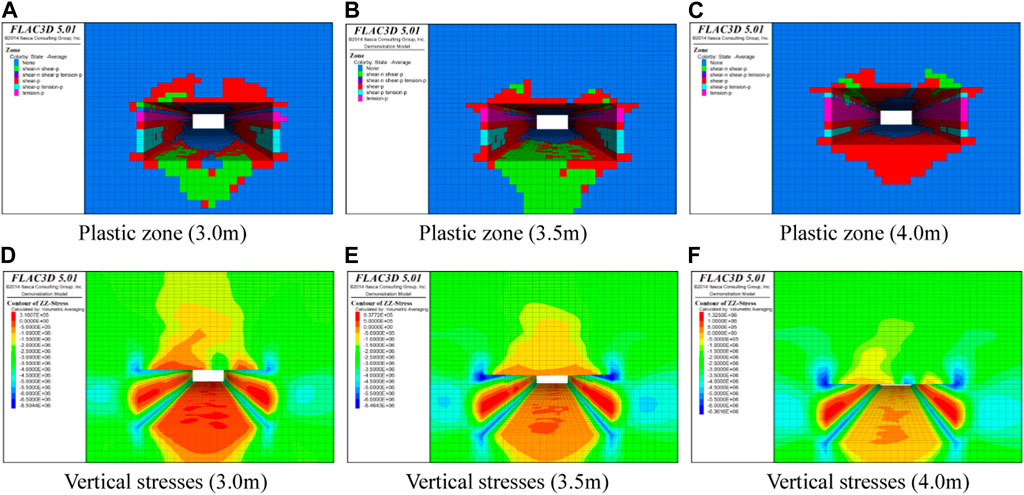
FIGURE 13. Plastic zone and stress field distribution of cut hole with different top coal thicknesses under support conditions. (A) Plastic zone (3.0 m), (B) plastic zone (3.5 m), (C) plastic zone (4.0 m), (D) vertical stresses (3.0 m), (E) vertical stresses (3.5 m), and (F) vertical stresses (4.0 m).
According to the theoretical and experimental results, the cut hole height of the 1−2 203 coal seam is 3.9 m, the thickness of the remaining top coal is 4.0 m. After the cut hole is penetrated, top coal thickness detection boreholes are arranged along the top coal of the cut hole. The thickness of the top coal of the cut hole is shown in Figure 14. The top coal thickness is between 3.4 m and 4.8 m, mainly concentrated in 3.7–3.9 m and 3.9–4.1 m within these two intervals, and the top coal is relatively thick on the side near the main gang. The design height of the cutting hole is 3.9 m, and the average thickness of the top coal is 4.0 m.
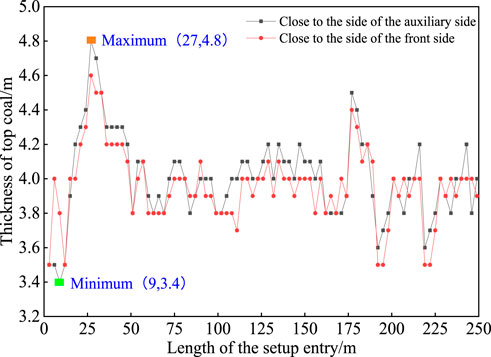
FIGURE 14. Top coal thickness distribution.
The internal failure characteristics of top coal at different depths are monitored by a borehole peeper, as shown in Figure 15. The total length of the peephole is 2.80 m, and cracks develop in the coal and rock mass near the cut hole area. Some cracks appear in the coal and rock mass at 0.73 m; long longitudinal cracks appear in the coal and rock mass at 1.09 m, and circumferential cracks in the coal and rock mass develop at 1.46 m. The coal mass is relatively broken; at 2.05 m, the coal and rock mass cracks develop and appear to be falling off; at 2.75 m, the crack reaches the goaf area of the overlying rock layer, and accumulated gangue can be observed. Among them, the surrounding coal rock mass shedding area at 2.05 m may be affected by the mining disturbance of the upper coal seam. After drilling 2.05 m, the integrity of the top coal is better, and the cracks are concentrated between 1.0 and 2.0 m. The integrity of the top plate can be determined by drilling and observing the results.
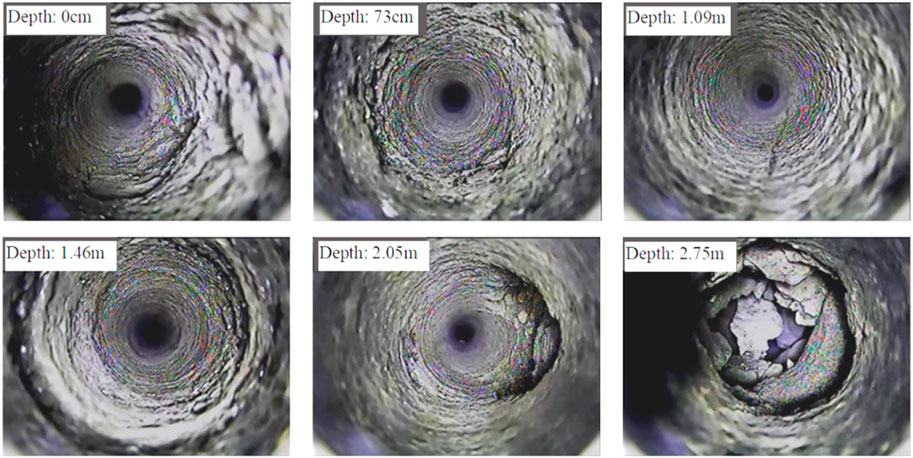
FIGURE 15. Characteristics of top coal failure of cut hole.
Affected by the cut hole excavation, the opening sections of the boreholes at the three measuring stations are relatively broken. Among the three boreholes, the integrity of the No.1 borehole is worse. This is mainly due to the thin thickness of the top coal at the eye-cutting and is within the scope of the double damage caused by layered mining.
Observing the surface displacement of the surrounding rock of the cut hole and the stress changes of the support body and roof coal structure shows that the maximum displacement of the roof and bottom plates is 12 mm, the maximum displacement of the two pillars is 6 mm, the maximum displacement of the deep part is 6 mm, and the support force of the pillars exceeds 15 MPa. The maximum displacement accounts for a small proportion, and the stress on the pillars is small. The maximum strain of the shed beam is −416 με, and no major deformation occurs. The maximum change in the axial force of the anchor cable is 20.625 kN. A peek at the drill hole shows that a small part of the drill hole in the roof plate is cut. There is fragmentation in the area, but the top coal structure in the remaining areas is relatively complete, and no collapse has occurred. The thickness of the top coal in the drilling hole is between 3.4 m and 4.8 m, mainly concentrated in the range of 3.7 m and 4.1 m, and the top coal is relatively thick on the side near the side of workface plant. The average thickness of the top coal is 4.0 m. Combined with the stability of the eye-cutting site, it shows that the top coal thickness is 3.5–4.0 m, which is reasonable and can meet production requirements after the required support has been added.
(1) The scope of the plastic zone of the top coal of the large cross-section under the goaf in layered mining consists of the plastic zone of the floor caused by the mining of the upper layer and the plastic zone of the top coal caused by the tunneling. According to elastic–plastic theory calculations, the depth of destruction of the upper layer mining floor is 2.02 m, the plastic range under the influence of tunneling is 1.43 m, the plastic zone of the top coal is 3.45 m, and the thickness of the top coal of the tunnel is greater than 3.45 m, which is conducive to maintaining the stability of the tunnel.
(2) The deformation of large cross-section roof coal can be divided into a roof collapse danger area and a roof collapse warning area. When the top coal thickness is 3.0, 3.5, and 4.0 m, the roof collapse danger zone decreases exponentially, linearly, and logarithmically, respectively. When the top coal thickness is 3.5–4.0 m, the sinking trend is slower, and the top coal support has higher stability. The roof collapse warning area decreases linearly and logarithmically, respectively. When the top coal thickness is 3.5–4.0 m, it has better self-stabilizing ability and higher stability.
(3) Under the condition of no support, when the thickness of the top coal of the cut hole is 3.5–4.0 m, the plastic zone range is significantly smaller than that of the top coal of 3.0 m; under the condition of support, the range of the plastic zone of the top coal is significantly smaller, and the stability is better. On-site monitoring shows that the thickness of the top coal is between 3.4 and 4.8 m, with an average remaining thickness of 4.0 m. The drill hole peek results and the shed beam deformation results show that the thickness of the top coal is 3.5–4.0 m, which is more reasonable.
The datasets presented in this study can be found in online repositories. The names of the repository/repositories and accession number(s) can be found in the article/Supplementary Material.
GS: data curation, formal analysis, funding acquisition, investigation, methodology, project administration, resources, writing–original draft, and writing–review and editing. DW: data curation, formal analysis, resources, software, writing–original draft, and writing–review and editing. LY: formal analysis, investigation, methodology, project administration, software, and writing–original draft. CJ: conceptualization, formal analysis, investigation, methodology, project administration, writing–original draft, and writing–review and editing. GD: data curation, investigation, project administration, resources, supervision, writing–original draft, and writing–review and editing. MC: formal analysis, investigation, validation, writing–original draft, and writing–review and editing. CJ: data curation, resources, validation, and writing–original draft.
The author(s) declare that financial support was received for the research, authorship, and/or publication of this article. This study was supported by the Key Program of the National Natural Science Foundation of China (No. 41027002).
We thank the National Natural Science Foundation of China. We thank the academic editors and reviewers for their kind suggestions and valuable comments.
Authors GS, CJ, GD, and CJ were employed by Shenhua Shendong Coal Group Corporation Limited, China Energy Group.
The remaining authors declare that the research was conducted in the absence of any commercial or financial relationships that could be construed as a potential conflict of interest.
All claims expressed in this article are solely those of the authors and do not necessarily represent those of their affiliated organizations, or those of the publisher, the editors, and the reviewers. Any product that may be evaluated in this article, or claim that may be made by its manufacturer, is not guaranteed or endorsed by the publisher.
Cao, D. (2015). Roadway supporting technology practice under extremely contiguous seams goaf in Yungang Mine. Coal Sci. Technol. 43 (S1), 73–75.
Chai, J., Han, Z., and Qiao, Yu (2022b). Top coal stability of long⁃span opening under goaf in layered mining. J. Min. Saf. Eng. 39 (02), 282–291. doi:10.13545/j.cnki.jmse.2021.0315
Chai, J., Liu, Y., and Wang, Z. (2022a). Pressure relief effect of protective layer mining and its optical fiber monitoring. J. China Coal Soc. 47 (8), 2896–2906. doi:10.13225/j.cnki.jccs.2022.0448
Chai, J., Qiao, Yu, and Gao, S. (2022c). Roof stability evaluation of large section cut hole in lower slice of slicing mining. J. Mine Automation 48 (5), 21–31. doi:10.13272/j.issn.1671-251x.2021110029
Chai, Z., Kang, T., and Li, Y. (2008). Anchoring effect of extre mely thick coal seam large section roadway for cable bolts supporting. J. China Coal Soc. 33 (7), 732–737.
Dong, Yu, Xie, W., and Jing, S. (2013). High strength stable type support technology of mining gateway under goaf in contiguous seams. Coal Sci. Technol. 41 (2), 19–23. doi:10.13199/j.cst.2013.02.25.dongy.007
Gao, J., and Zhang, Z. (2014). Study on support technology of gateway in contiguous seams under mining goaf in Pingshuo mining area. Coal Sci. Technol. 42 (5), 1–4. doi:10.13199/j.cnki.cst.2014.05.001
Gao, S., Chen, S., and Chai, J. (2021). Study on optimization of supporting technology for large cross section open-off cut under contigous gob. Coal Sci. Technol. 49 (12), 20–28. doi:10.13199/j.cnki.cst.2021.12.003
Gong, P., Zhao, T., and YetilmezsoyYi, K. K. (2019). Mechanical modeling of roof fracture instability mechanism and its control in top-coal caving mining under thin topsoil of shallow coal seam. Adv. Civ. Eng. 2019, 1–10. doi:10.1155/2019/1986050
He, Y. P., Huang, Q. X., Wei, Y. H., and Du, J. (2023). Research on roof load transfer by passing coal pillar of working face in shallow buried closely multiple-seam. Minerals 13 (1), 118. doi:10.3390/min13010118
He, F., Xu, L., and Wu, H. (2014). Fracture field evolution and stability analysis of surrounding rock in thick coal roof large-section cut hole. J. China Coal Soc. 39 (02), 336–346. doi:10.13225/j.cnki.jccs.2013.0307
He, Y., and Huang, Q. (2022). Research on roof structure and determination of working resistance of shallow buried Single key stratum based on grid-drillhole field method. Lithosphere S4, 4328618. doi:10.2113/2022/4328618
Jiang, L., Jiao, H., Wang, Y., and Wang, G. g. (2021). Comprehensive safety factor of roof in goaf underdeep high stress. J. Central South Univ. Springer 28 (2), 595–603. doi:10.1007/s11771-021-4624-y
Jiang, Y., Yang, Y., and Ma, Z. (2016). Breakage mechnism of roof strata above widespread mined-out area with roadway mining method and feasibility analysis of upward mining. J. China Coal Soc. 41 (04), 801–807. doi:10.13225/j.cnki.jccs.2015.0775
Liu, S., Bai, J., Wang, X., Wu, B., Wang, G., Li, Y., et al. (2021). Study on dynamic evolution of roof crack and support timing of secondary tunneling for large section Open-off cut in deep mines. Adv. Civ. Eng. 2021, 1–16. doi:10.1155/2021/9918470
Liu, J., Shen, B., and Jiang, P. (2013). Technical countermeasures of improving China coal production capacity. Coal Sci. Technol. 41 (1), 21–24. doi:10.13199/j.cst.2013.01.24.liujzh.006
Niu, S., Yang, S., and Yi, L. I. (2014). Shear instability mechanism and support methods of laminated roof and floor strata in roadway. J. China Coal Soc. 39 (S2), 325–331. doi:10.13225/j.cnki.jccs.2013.1404
Qi, S. (2018). Study on the stress field distribution & sup-porting technology for miing roadway under goaf in 1 M close distance coal seams mining. Taiyuan: Tai-yuan University of Technology.
Schenato, L., Palmieri, L., Camporese, M., Bersan, S., Cola, S., Pasuto, A., et al. (2017). Distributed optical fibre sensing for early detection of shallow landslides triggering. Rep 7 (1), 14686–14687. doi:10.1038/s41598-017-12610-1
Tulu, I. B., Esterhuizen, G. S., Klemetti, T., Murphy, M. M., Sumner, J., and Sloan, M. (2016). A case study of multi-seam coal mine entry stability analysis with strength reduction method. Int. J. Min. Sci. Technol. 26 (2), 193–198. doi:10.1016/j.ijmst.2015.12.003
Wang, Z., Fang, L. O. U., and Jin, S. (2020). Roadway position and surrounding rock control technology under mining goaf in extremely close coal seam. Coal Eng. 52 (02), 1–4.
Xia, K., Chen, C., Liu, X., Yuan, J., and Dang, S. (2023). Assessing the stability of high-level pillars in deeply-buried metal mines stabilized using cemented backfill. Int. J. Rock Mech. Min. Sci. 170, 105489. doi:10.1016/j.ijrmms.2023.105489
Xia, K., Chen, C., Wang, T., Zheng, Y., and Wang, Y. (2022). Estimating the geological strength index and disturbance factor in the Hoek-Brown criterion using the acoustic wave velocity in the rock mass. Eng. Geol. 306, 106745. doi:10.1016/j.enggeo.2022.106745
Xiao, T., Bai, J., Xu, L., and Xuebin, Z. (2011). Characteristics of stress distribution in floor strata and control of roadway stability under coal pillars. Min. Sci. Technol. (China) 21 (2), 243–247. doi:10.1016/j.mstc.2011.02.016
Xie, S., Zhang, Q., Chen, D., Wang, E., Zeng, J., Ji, C., et al. (2020). Research of roof anchorage rock beam bearing structure model of Extra-Large width Open-off cut and its engineering application in a coal mine, China. Adv. Civ. Eng. 2020, 1–19. doi:10.1155/2020/3093294
Xinjie, L., Xiaomeng, L., and Weidong, P. (2016). Analysis on the floor stress distribution and roadway position in the close distance coal seams. Arabian J. Geosciences 9 (2), 83. doi:10.1007/s12517-015-2035-9
Yan, H., Weng, M., Feng, R., and Li, W. K. (2015). Layout and support design of a coal roadway in ultra-close multiple-seams. J. Central South Univ. 22 (11), 4385–4395. doi:10.1007/s11771-015-2987-7
Yang, H., Han, C., Zhang, N., Sun, C., Pan, D., and Dong, M. (2019). Stability control of a Goaf-side roadway under the mining disturbance of an adjacent coal working face in an under-ground mine. Sustainability 11 (22), 6398. doi:10.3390/su11226398
Yao, B. (2014). Failure mechanism and control technology of surrounding rock of Roadway under Goaf. Beijing: China University of mining and Technology.
Zhang, Y., Xie, K., and He, F. (2004). Study on surrounding rock stability of working face supported by bolt-mesh-anchor in soft and thick coal seam. Chin. J. Rock Mechnics Eng. (19), 3298–3304. doi:10.3390/en13020305
Keywords: slicing mining, large cross-section open-off cut, top coal thickness, optical fiber sensor, field monitoring
Citation: Gao S, Du W, Liu Y, Chai J, Gao D, Ma C and Chen J (2023) Reasonable top coal thickness for large cross-section open-off cut in lower-layer mining. Front. Earth Sci. 11:1301595. doi: 10.3389/feart.2023.1301595
Received: 25 September 2023; Accepted: 20 October 2023;
Published: 27 December 2023.
Edited by:
Xuelong Li, Shandong University of Science and Technology, ChinaReviewed by:
Kaizong Xia, Chinese Academy of Sciences (CAS), ChinaCopyright © 2023 Gao, Du, Liu, Chai, Gao, Ma and Chen. This is an open-access article distributed under the terms of the Creative Commons Attribution License (CC BY). The use, distribution or reproduction in other forums is permitted, provided the original author(s) and the copyright owner(s) are credited and that the original publication in this journal is cited, in accordance with accepted academic practice. No use, distribution or reproduction is permitted which does not comply with these terms.
*Correspondence: Jing Chai, MTMxOTA3MTg3OEBxcS5jb20=
Disclaimer: All claims expressed in this article are solely those of the authors and do not necessarily represent those of their affiliated organizations, or those of the publisher, the editors and the reviewers. Any product that may be evaluated in this article or claim that may be made by its manufacturer is not guaranteed or endorsed by the publisher.
Research integrity at Frontiers
Learn more about the work of our research integrity team to safeguard the quality of each article we publish.