 Anna Warrener
- Department of Anthropology, University of Colorado Denver, Denver, CO, United States
Introduction: Muscle cross-sectional area is an important variable for understanding force generating potential and locomotor adaptation. Geometric scaling predicts area scales proportionally to body mass2/3. Previous research has quantified scaling relationships between hindlimb musculature and mass in apes, but these relationships have not been clearly established in humans. Scaling in the human lower-limb is likely influenced by bipedalism and dimorphism in lean and total body mass between the sexes.
Methods: To investigate these relationships, cross-sectional area in 20 muscles of the lower-limb were obtained through MRI in twenty-eight (14 female, 14 male) participants and measured in Analyze 14.0. Log transformed muscle cross-sectional areas were grouped by function (gluteals, knee extensors, hamstrings, biarticulate knee/hip flexors, plantarflexors), and least-squares regressions were calculated for each group against log-body mass.
Results: All muscle groups were significantly (p < 0.001) correlated with mass (0.56 < r2 < 0.70) and, except for the gluteals, all groups scaled with positive allometry with slopes outside the 95% CI reported in the literature for apes. Correlations and slopes were lower for females (0.05 < r2 < 0.62; 0.4 < b < 1.0), than males (0.56 < r2 < 0.79: 0. 7< b < 1.9) in all muscle groups, but there were no statistically significant differences in slope except for the tensor fasciae latae and the hamstrings. However, including sex as a predictor in multiple regression analysis increased the explained variance in cross-sectional area by 1-18% across functional muscle groups.
Discussion: These results suggest human lower-limb muscle scaling has responded to force production requirements of bipedalism, but differences in lean and total mass do not clearly impact allometric equations in males and females.
1 Introduction
Bipedalism is the defining characteristic of the hominin lineage (Stamos and Alemseged, 2023). Despite a shared upright, bipedal form of locomotion, fundamental differences in skeletal architecture between numerous hominin species indicate variation in the kinematic and kinetic profiles of bipedalism during hominin evolution (Lovejoy et al., 2009; DeSilva et al., 2013; McNutt et al., 2018). The skeleton is a key biomechanical component of the movement system in all vertebrates, providing a ridged structure upon which muscles, ligaments, and tendons act, and is also frequently the only biological system that can be assessed in extinct taxa. However, muscle architectural properties are equally important in determining movement profiles, and are therefore of great importance when evaluating gait mechanics.
The force production profile of skeletal muscle is dictated by its architectural properties. Muscles with greater mass and physiological cross-sectional area (PCSA) produce higher forces, while fascicle length is associated with range of motion and muscle shortening velocity (Wickiewicz et al., 1984; Fukunaga et al., 2001). These characteristics have consequences for locomotor mode, metabolic demand, and ecology across organisms. Interpretations of differences in muscle properties must account for the effect of body size in both interspecific and intraspecific comparisons across animals. When anthropometric variables increase in direct proportion to body mass, this results in geometric similarity in animals of different sizes, referred to as isometry (Alexander et al., 1981; Biewener, 2003). Isometry predicts that linear variables increase as mass1/3, areas as mass2/3, and masses and volumes as mass1. These relationships can be expressed as the allometric equation:
where y is the independent variable, a and b are constants, and x is body mass (Biewener, 2003).
This equation can be linearized by taking the natural log (ln) of the independent and dependent variables resulting in the following equation:
The regression has a slope (b) equivalent to the scaling factor between the variable of interest and body mass. If the slope exceeds that expected for geometric similarity, the dependent variable scales with positive allometry, and if the slope is less than would be expected, the dependent variable scales with negative allometry. Allometric scaling may be the result of functional adaptation, phylogeny, or structural demands (Alexander et al., 1981).
Relative muscle mass and architectural properties show considerable differences between mammalian taxonomic groups that engage in varying forms of locomotion. Generally, primates are characterized by lower total muscle mass than other mammals related to the number of arboreal species within the order, but among primates, terrestrial species have significantly greater relative muscle mass than arboreal taxa (Muchlinski et al., 2012). By comparison, terrestrial mammals have higher proportions of muscle mass relative to body mass, particularly in the hindlimb, which is associated with the ability to produce larger forces at faster speeds on a stable substrate (Muchlinski et al., 2012). Locomotor demand is also represented in muscle architectural properties across taxonomic groups. In cursorial mammals, distal muscles are generally smaller, but have shorter muscle fiber lengths enabling high force production while maintaining a lighter distal limb which is advantageous for the swing phase of stride (Alexander et al., 1981; Lieberman et al., 2015). By comparison, primates have relatively larger distal fore and hindlimb muscle mass with long fiber lengths in association with the importance of manual and pedal dexterity in arboreal environments (Alexander et al., 1981). Muscle mass is also a key driver of basal metabolic rate when accounting for differences in body mass and phylogeny in mammals (Raichlen et al., 2010). Furthermore, the association between relative muscle mass and climate variables strongly suggests that muscle mass phenotype has been under selection for thermoregulation across the mammalian order (Raichlen et al., 2010). These examples highlight the importance of investigating variation in muscle mass and architecture to understand morphology, locomotor function, and behavior in a wide range of taxa.
In the hindlimb specifically, muscle cross-sectional area (generally measured as physiological cross-sectional area PCSA) has been investigated across mammals as a means of assessing the force generating capacity of specific functional muscle groups. Among terrestrial mammals, total hindlimb PCSA scales as mass0.88 and among primates as an order as mass0.8 (Alexander et al., 1981; Myatt et al., 2011). However, in great apes (Pan, Gorilla, and Pongo) specifically, hindlimb PCSA has a somewhat lower scaling exponent (mass0.7) but still exceeds that predicted by isometry (Myatt et al., 2011). Musculoskeletal modeling has demonstrated the close relationship between PCSA and locomotor function in some apes. In chimpanzees, the gluteus maximus has the largest PCSA of the lower limb muscles, corresponding with the large hip extensor moments generated during quadrupedal locomotion (O’Neill et al., 2013). Furthermore, the large PCSA of the tibialis posterior reflects its role in foot inversion during climbing (O’Neill et al., 2013). Overall, the macro-muscle architectural properties of apes are functionally tied to the ability to generate forces over a wide range of limb positions related to greater degrees of arboreal locomotor behavior (Myatt et al., 2011).
In humans, the adoption of habitual bipedal locomotion has substantially changed the functional demands of hindlimb muscles, which are recruited to produce much larger forces over smaller ranges of motion. During human running, ground reaction forces (GRF) may exceed three-times body mass (Lieberman et al., 2010), demonstrating the high forces that must be repetitively generated by lower limb muscles. Vertical, braking, and propulsive GRFs all scale with positive allometry in humans (Stickley et al., 2018), therefore, we might expect lower limb functional muscle groups, most associated with vertical and fore-aft GRF production, like the hip and knee extensors, and plantarflexors, to also scale with positive allometry. Muscles associated with these functions, the soleus, gluteus medius, gluteus maximus and vastus lateralis, have the largest PCSA of the muscles in the human lower limb (O’Neill et al., 2013). Sylvester et al. (2021) simulated muscle force production during walking using a forward dynamic approach. Their results showed the highest muscle forces occurring in the hip abductors, knee extensors, and ankle plantarflexors, with reduced intersubject variability in the force profiles of these muscles during the stance phase of walking (Sylvester et al., 2021). These findings support the notion that bipedality generates substantial force production requirements for specific functional muscle groups associated with vertical support and acceleration of the body center of mass. Additionally, because of dimorphism between males and females in body composition, where on average females have ∼10% greater fat mass than males (Wells, 2012), differences in the scaling exponents relating body mass and muscle size may exist between the sexes.
Investigating the evolution of muscle properties in the hominin lineage is obviously complicated by the lack of any preserved soft tissue for extinct species. However, recent computational advances have allowed the first representations of complete musculoskeletal models of the pelvis and lower-limb of an extinct hominin. Wiseman (2023) reconstructed 36 muscles of the Australopithecus afarensis specimen AL 288–1 using polygonal modelling. This approach creates three-dimensional muscle models, accounting for the entirety of each muscle attachment site, and wraps muscle bellies around adjacent musculature to generate realistic muscle placement within the limb. While PCSA was not reported for this model, muscle mass and moment arm calculations were used to address functionally relevant locomotor aspects of australopith lower limb anatomy. The largest differences in relative lower limb segment muscle masses between the australopith model and humans were found in the foot and the thigh, with australopiths having a substantially greater percentage of both segment masses comprised of muscle (52.5% versus 15.5% in the foot, 73.7% versus 49.6% in the thigh) (Wiseman, 2023). In the pelvis, muscles were more transversely oriented in the australopith but maintained muscle moment arms comparable with humans throughout much of hip joint range of motion (Wiseman, 2023).
O’Neill et al. (2023) have also recently developed a three-dimensional musculoskeletal model of Australopithecus afarensis, allowing estimations of pelvis and lower limb muscle moment arms, PCSA, and isometric joint moments for comparison with human and chimpanzee models. Muscle moment arms throughout joint ranges of motion were similar between species with some key exceptions. The hamstrings had smaller moment arms compared to chimpanzees throughout the flexion/extension range of motion, but were larger than those predicted for humans (O’Neill et al., 2023). Knee extensor moments arms were lower in A. afarensis than humans, while superficial ankle plantarflexors were intermediate in A. afarensis relative to the modern taxa. Hip abductor moment arms were strongly similar in pattern between humans and A. afarensis, although humans showed a slightly higher magnitude, but strikingly dissimilar to chimpanzees (O’Neill et al., 2023). These differences are in accordance with expectations for locomotor and osteometric distinctions between the species, namely, continued reliance on climbing (ischial and calcaneal tuber lengths) coupled with developed bipedal locomotion (pelvic shape and hip abductor function) (Prang, 2015; O’Neill et al., 2023). PCSA and muscle mass estimates were sensitive to the modeling parameters (human-like versus chimp-like fiber lengths and pinnation angles), but O’Neill et al. (2023) argue a chimp-like reconstruction is more likely given the importance of longer muscle fibers for force production over a wide range of motion during climbing. Muscle mass estimated from these parameters yields strong agreement between this study and that of Wiseman (2023), with the unilateral pelvis and single lower limb accounting for ∼10% of body mass.
Data obtained from these reconstructions provide additional evidence of competent bipedal locomotion coupled with retained capabilities for arboreal climbing in Australopithecus (O’Neill et al., 2023; Wiseman, 2023). However, differences in the relative masses and moment arms of muscles in some lower limb segments suggest an evolutionary transition in muscle architectural scaling in concordance with skeletal indicators associated with the changing functional demands of walking and running in the genus Homo. These finding are supported by previous inverse dynamics models utilizing skeletal parameters of AL 288–1 (Australopithecus afarensis) and KNM-WT 15000 (Homo erectus) that suggested higher mass and distance specific muscle power requirements in australopiths than Homo during walking (Wang et al., 2004). Therefore, a transition in body proportions (skeletal and muscular) may have been required for the enhancement of long distance or high speed bipedal locomotion in the hominin lineage (Wang et al., 2004).
The purpose of this study is to provide additional insight into the evolution of human lower limb muscle architecture specifically through the investigation of the allometric relationship between body mass and muscle cross-sectional area of the lower limb. Muscle cross-sectional area is an important variable for determining the force production capacity of muscles and is more easily obtainable in living subjects from imaging than muscle volume. Individual muscles and muscle group allometry is assessed in a cohort of young, active female and male participants with the goal of comparing scaling factors between humans and apes reported in the literature, as well as assessing the role of variation in body composition by sex on resulting allometric equations in humans. The following hypotheses were tested:
1) Individual muscle cross-sectional areas within a functional muscle group will have the same slope relative to body mass.
2) Total muscle cross-sectional area of a functional muscle group scales isometrically with body mass.
3) Slopes of muscle cross-sectional area functional muscle groups relative to body mass will be the same in apes and humas. Alternatively, given the increased force production demands of human hindlimb muscles for bipedalism, slopes are expected to be greater for human regressions than those of apes.
4) Slopes for muscle cross-sectional area functional muscle groups relative to body mass will be the same in human females and males. Alternatively, greater average fat mass in females may produce lower slope values or correlations with body mass for functional muscle groups than in males.
2 Methods
2.1 Subjects
Twenty-eight volunteers (14 self-identified males, 14 self-identified females) signed informed consent to participate in this study, which was approved by the Washington University in St. Louis Internal Review Board (#09–0216). All participants were physically active recreational runners between 18–40 years of age. Participants completed an MRI screening form and were paid $25 for participation in the study.
2.2 Imaging
Magnetic resonance imaging (MRI) of the participants was obtained on a Siemens Avanto 1.5T scanner at the Center for Clinical Imaging Research, Mallinckrodt Institute of Radiology. Four overlapping sections from the pelvis (approximate L4 level) to the foot (mid metatarsal) were scanned in coronal orientation with 1.7 mm isotropic voxel resolution. During scanning, participants were supine and a leg board, foot board, and divider maintained the participants’ lower limbs in anatomical position. Scans lasted approximately 45 min. Analyze 14.0 software (Analyze Direct, KS, USA) was used to reconstruct and visually inspect the images. Axial coordinates of each scan field were used to assess the length of overlap between the images which were then cropped and appended to create a single anatomical image of the entire lower limb.
2.3 Muscle cross-sectional area measurements
A muscle’s ability to generate force is frequently determined by its PCSA which requires knowledge of muscle volume, pinnation angle, and fascicle length (Biewener, 2003). These are difficult parameters to determine in living humans without multiple imaging modalities or estimations from cadaveric specimens. However, studies have documented strong correlations between maximum anatomical cross-sectional area (ACSAmax), PCSA, and force production capacity (Fukunaga et al., 2001; Albracht et al., 2008), and because pinnation angle in the muscles of the lower limb are less than 30°, ACSAmax should closely approximate PCSA (Myatt et al., 2011). Therefore, ACSAmax was used for analysis in this study.
ACSAmax was measured in 20 muscles of the right pelvis and lower limb of each participant using the spline trace and object mask tools in Analyze 14.0 (Figure 1). Estimated ACSAmax for each muscle was first visually identified, the contours of the muscle were manually traced and the resulting area was recorded. This procedure was repeated for no fewer than three axial slices superior to and inferior to the original measurement. If a slice area was greater than the original measurement, the procedure was repeated around the new ACSAmax slice until the largest cross-section was identified. To assess measurement repeatability, the procedure was repeated for four muscles (gluteus maximus, rectus femoris, adductor longus, soleus) on four participants. Average ACSAmax pooled error across participants was 1.6%. All measurements were performed by the author.
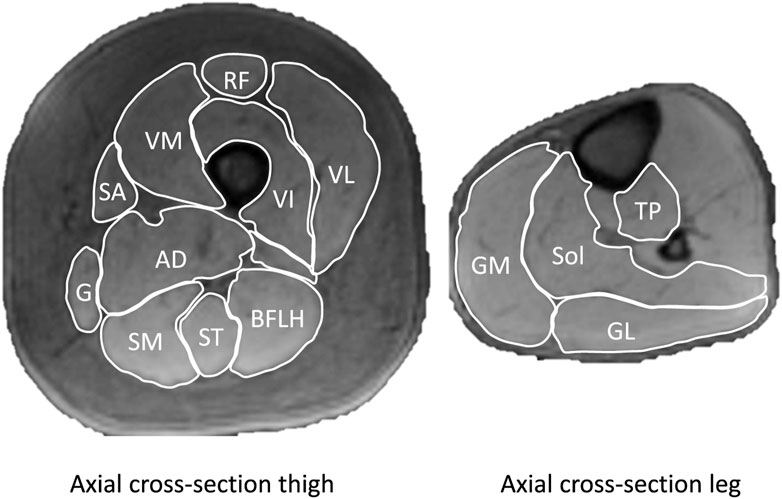
FIGURE 1. Example of axial images of the thigh and leg with individual muscles outlined. Vastus lateralis (VL), vastus intermedius (VI), vastus medialis (VM) rectus femoris (RF) semimembranousus (SM), semitendinosus (ST), biceps femoris long head (BFLH), adductor magnus (AD), gracilis (G), sartorious (S), gastrocnemius medialis (GM), gastrocnemius lateralis (GL), soleus (Sol), tibialis posterior (TP). Not shown are biceps femoris short head, adductor longus, tensor fasciae latae, and gluteal muscles.
The comparative ape sample consists of 12 individuals of both sexes (4 chimpanzees, 2 bonobos, 4 gorillas, and 2 orangutans) reported in Myatt et al. (2011). Functional muscle groups were defined following Myatt et al. (2011) where possible to facilitate comparison with their published ape data (Table 1). Differentiation between adductor brevis, adductor longus, and pectineus in the superior thigh was insufficient in several participants to reliably measure ACSAmax of adductor brevis and pectineus, so those muscles are excluded from analysis of the adductor compartment and no comparison between humans and apes is made. ACSAmax of adductor longus and adductor magnus occurs inferior to the insertion of adductor brevis and pectineus, so they could be reliably measured. Participant specific data for all muscles can be found in the Supplementary Table S1).
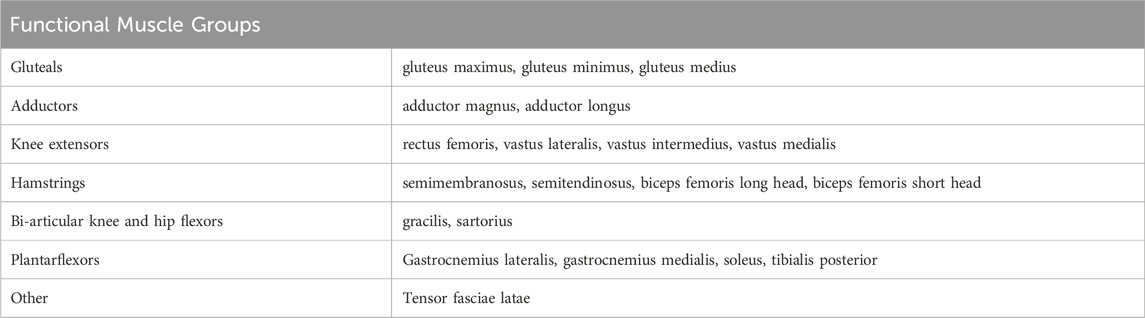
TABLE 1. Muscles measured for this study grouped by function.
2.4 Statistics
Statistics were performed using SPSS 29.0 software. Anthropometrics were compared between males and females using independent sample t-tests. Variables were then converted to natural log (ln) and ordinary least squares regression was used to assess the scaling relationship between body mass and individual muscle ACSAmax, functional muscle group ACSAmax, and sex specific functional muscle group ACSAmax as well as total lower limb ACSAmax. Significant differences between regression slopes for individual muscles within a functional group, and for muscle groups and summed muscle ACSAmax differences between males and females were determined by t-test using the following formula:
where b is the slope and s is the standard error of the slope, and the degrees of freedom are equal to (n1 + n2)—4 (Currell, 2015). Multiple regressions were also performed with body mass and sex as independent variables to determine the influence of each factor on natural log transformed ACSAmax independently. To determine the magnitude of difference in ACSAmax controlling for body mass between the sexes, standardized residuals of ACSAmax on body mass were calculated for each muscle group and for summed muscle ACSAmax. The average difference in z-scores between the sexes is reported as a measure of effect size. Results were considered statistically significant at α = 0.05.
3 Results
Mean height for all participants was 1.71 ± 0.08 m (range 1.58–1.87 m). Mean body mass was 65.4 ± 9.1 kg (range 47–91.4 kg) (Table 2).
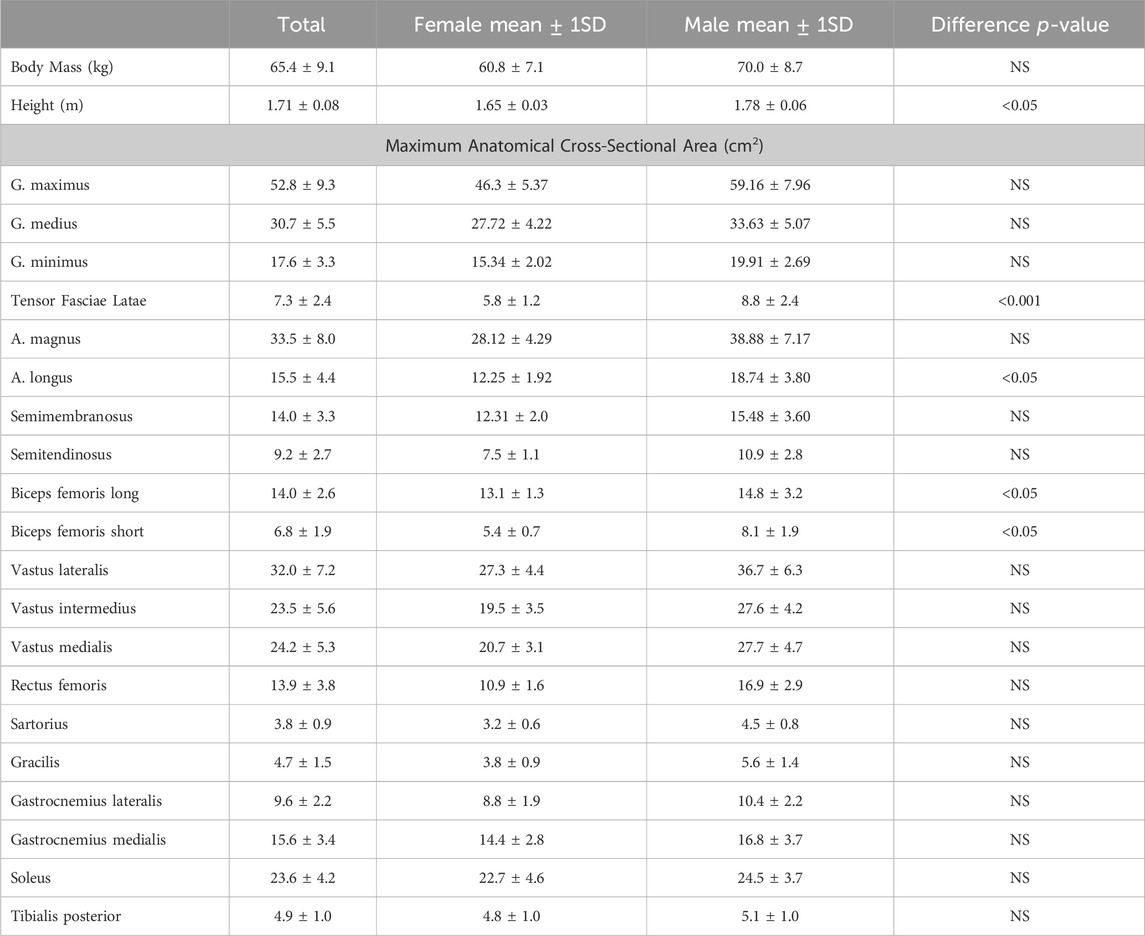
TABLE 2. Anthropometrics. p-values are for mean differences between males and females.
3.1 Combined sample individual ACSAmax scaling with body mass
Figure 2 shows scatterplots for all individual muscles regressed on body mass for the combined sample, and Table 3 shows regression coefficients for individual and function muscle groups. All regressions of individual muscle ACSAmax on body mass are significant at p < 0.001. Body mass explains between 35%–52% of the variation in individual gluteal muscle (maximus, medius, and minimus) ACSAmax, and all regressions have slopes greater than predicted by isometry, but the 95% confidence intervals overlap 0.67, so isometric scaling cannot be precluded. There are no significant differences between individual gluteal muscle ACSAmax regression slopes relative to body mass. Body mass explains 63% and 64% of adductor magnus and adductor longus ACSAmax respectively, both individual muscles scale with positive allometry, and there is no significant difference between the slopes of the two individual muscle ACSAmax relative to body mass.
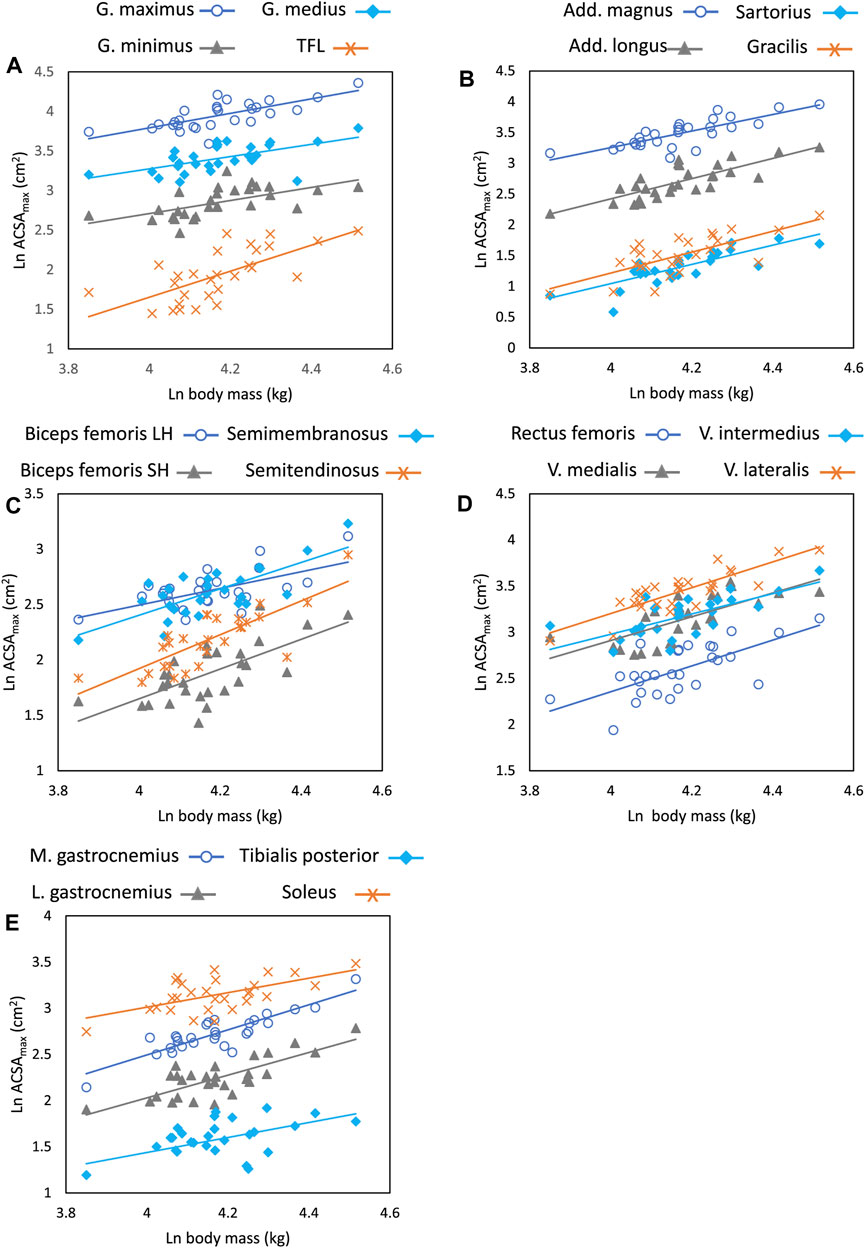
FIGURE 2. Regression plots of natural log transformed body mass (kg) versus ACSAmax (cm2) for individual muscles within functional muscle groups. All regressions are significant at the p < 0.001 level. (A) gluteals and tensor fasciae latae, (B) adductors and bi-articulate hip-knee flexors, (C) hamstrings, (D) knee extensors, (E) plantarflexors. There are no significant differences in the slope of the regression lines for individual muscles within a functional group except for the biceps femoris long head and the soleus. Regression parameters are listed in Table 3.
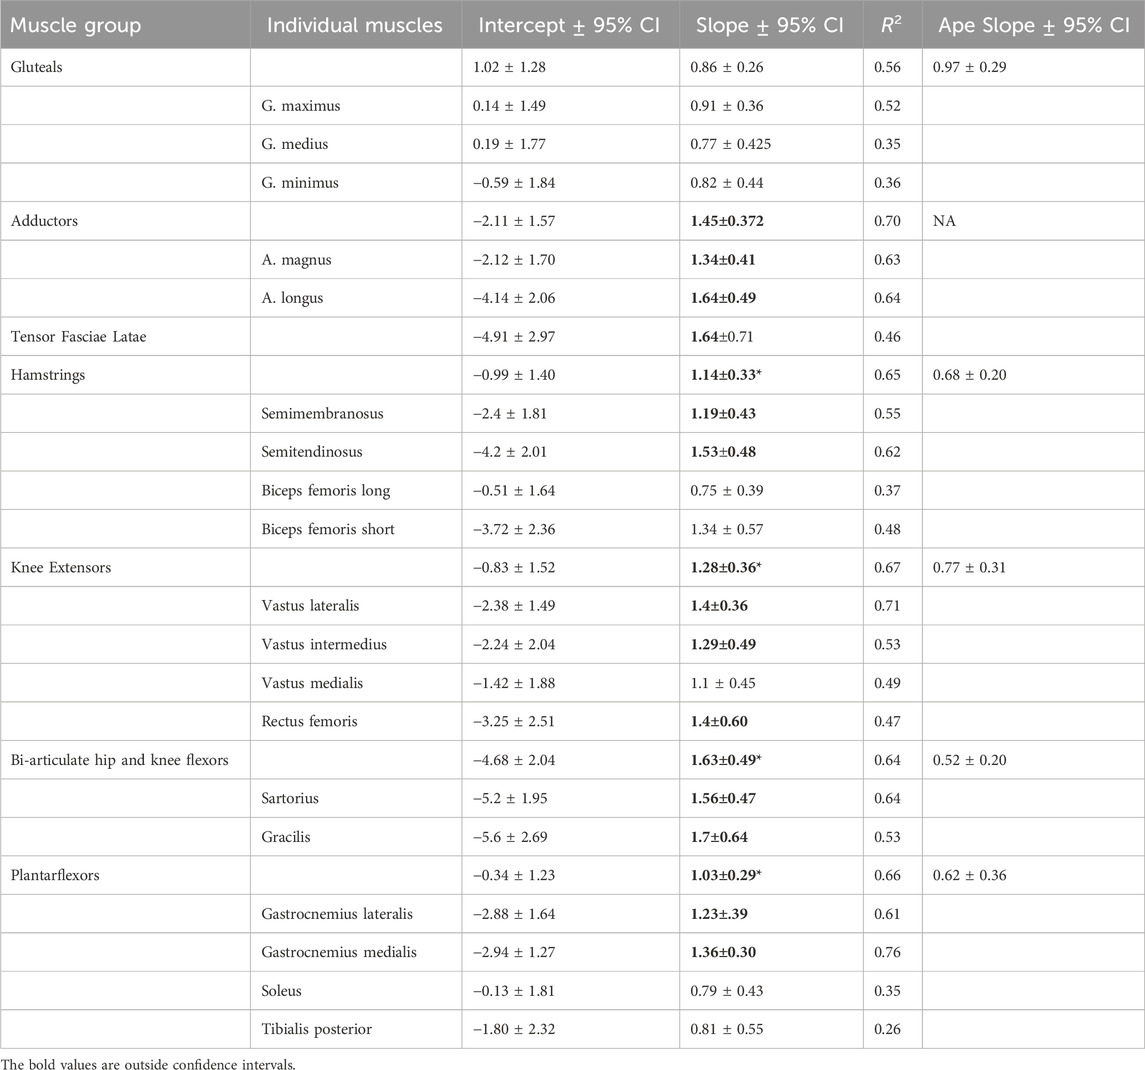
TABLE 3. Intercept, slope, and 95% CI for allometric equations relating natural log transformed body mass and ACSAmax. All regressions are significant at the p < 0.001 level. Slopes and 95% CI for ape regressions provided by Myatt et al. (2011). Slopes in bold indicate that the 95% CI does not overlap the isometric expectation of 0.67. * indicates the human slope for a functional muscle group does not overlap the 95% CI for the ape regression.
In the hamstrings, all muscles scale with positive allometry and the 95% CI does not include 0.67, except for the biceps femoris long head (b = 0.75), and body mass explains between 37%–62% of the variation in individual muscle ACSAmax in this functional group. The biceps femoris long head has a significantly lower regression slope value than the regression slope for semitendinosus (p < 0.05) and approaches significance for the semimembranosus and biceps femoris short head (p = 0.08 and p = 0.12 respectively), but no other slope comparisons within the muscle group are significantly different. Among the knee extensors, the vasti muscles and the rectus femoris all scale with positive allometry, but the rectus femoris 95% CI includes 0.67. R2 values for this muscle group are higher in the vastus lateralis, where 71% of variation in ACSAmax is explained by body mass and lowest in the rectus femoris (R2 = 0.47), and there are no significant differences in regression slopes between any pair of muscles in the functional group.
Both biarticulate flexors crossing the hip and knee scale with positive allometry. Sixty-four percent and 53% of the variation in the sartorius and gracilis respectively is explained by body mass with no significant difference in the regression slope of these muscles. Among the plantarflexors, gastrocnemius medialis and lateralis scale with positive allometry (b = 1.36 and 1.23 respectively), while soleus and tibialis posterior have lower slope values, but the only statistically significant difference is between the soleus and gastrocnemius medialis (p <0.05). Body mass explains 76% and 61% of the variance in ACSAmax in the medial and lateral gastrocnemius respectively, but a much lower percentage in the soleus (35%) and tibialis posterior (26%). Finally, body mass explains 46% of the variation tensor fasciae latae ACSAmax with an allometrically positive slope of 1.64.
3.2 Combined sample functional group ACSAmax scaling
All regressions of functional muscle group ACSAmax on body mass are significant at p < 0.001. Except for the gluteal muscle group, all functional group ACSAmax values scale with positive allometry and the 95% confidence intervals for the slopes of each group exclude 0.67. The slope value for gluteal ACSAmax is also greater than 0.67 (b = 0.86), but the confidence intervals include the isometric slope. Body mass explains between 56%–70% of the variation in muscle group ACSAmax with the gluteals having the lowest correlation coefficient and the adductors the highest. All functional muscle group ACSAmax values, except the gluteals, have slope values greater than the 95% confidence intervals for comparable muscle groups in great apes as reported by Myatt et al. (2011) (Figure 3; Table 3).
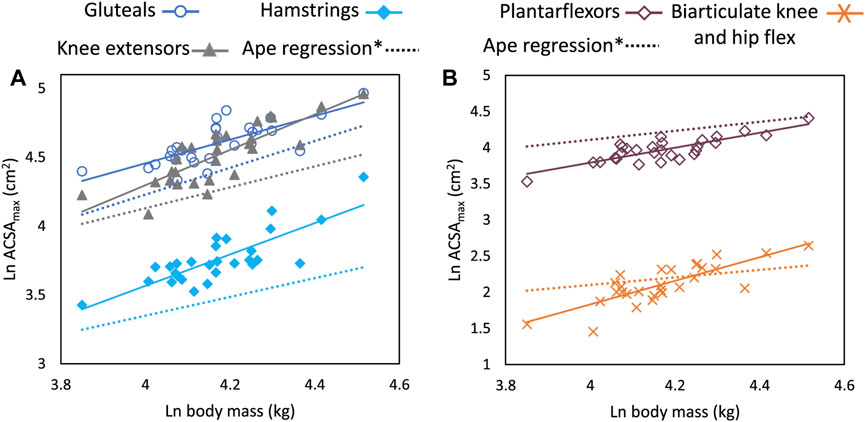
FIGURE 3. Regression plots of natural log transformed body mass (kg) versus ACSAmax (cm2) for functional muscle groups (A) gluteals, hamstrings, and knee extensors, and (B) plantarflexors and biarticulate knee and hip flexors. All regressions are significant at the p < 0.001 level. Solid lines are for human data. Dashed lines of the same color as functional muscle groups are regression lines based on slope and intercept values from Myatt et al. (2011)*. All slope values for humans fall outside the 95% CI for ape regression lines except for the gluteal muscles. Regression parameters are listed in Table 3.
3.3 Functional group ACSAmax scaling by sex
Males and females in the sample differed statistically in height (p < 0.05) but not body mass (Table 2). The only muscle ACSAmax that were statistically significantly different between the sexes were the tensor fasciae latae, biceps femoris long head, short head, and the grouped knee flexors (Table 2). All regressions of group muscle ACSAmax and summed lower limb ACSAmax on body mass were significant at the p < 0.05 level in both sexes, except for the tensor fasciae latae and the gluteals in females (Table 4, Figure 4). Regression slopes are universally higher in males than females, but the only statistically significant slope differences are for the tensor fasciae latae and the hamstrings. Body mass also explains a greater percentage of muscle ACSAmax variance in each functional group and for summed muscle ACSAmax in male regressions compared to females, indicating a stronger correlation between body mass and muscle ACSAmax generally in males. Including sex as an independent variable with body mass in a multiple regression model increases explained variance in functional ACSAmax across all muscle groups except in the plantarflexors where there is not a significant relationship between sex and group ACSAmax (Table 5). When controlling for body mass, muscle ACSAmax values were larger in males (0.6 < 1.1 standard deviations) than in females in all muscle groups except the ankle plantarflexors where females where 0.3 standard deviations greater than males, and the tensor fascia latae where there was no average difference in size between the sexes (Table 5).
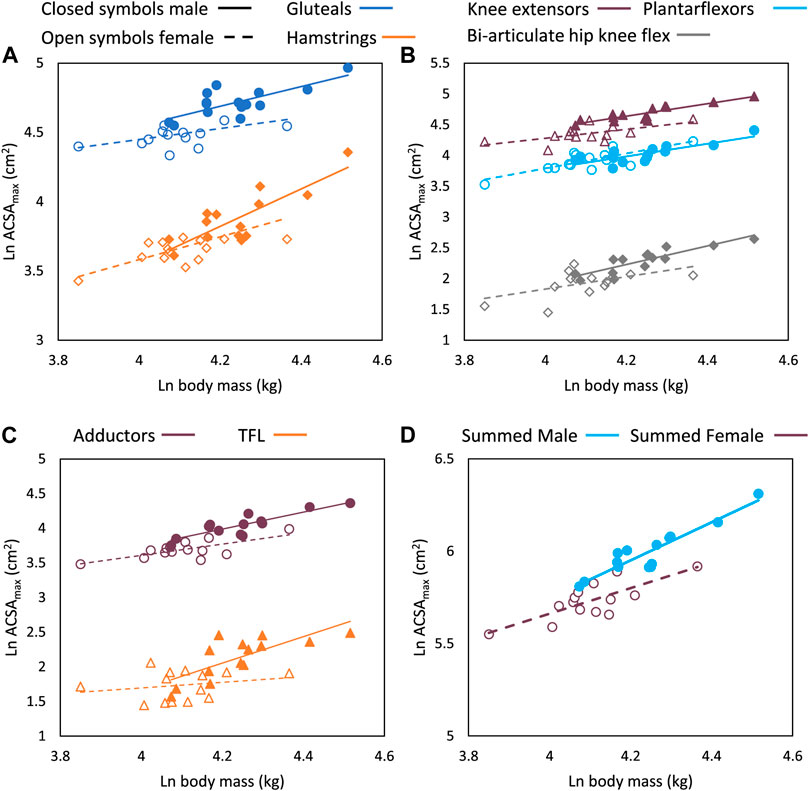
FIGURE 4. Regression plots of natural log transformed body mass (kg) versus ACSAmax (cm2) for functional muscle groups (A) gluteals and hamstrings, (B) knee extensors, plantarflexors, and biarticulate hip and knee flexors, (C) adductors and tensor fasciae latae and (D) summed total ACSAmax by sex. Closed symbols and solid lines are male data points and regression lines, and open symbols and dotted lines are female data points and regression lines. All regressions are significant at the p < 0.05 level except for the tensor fasciae latae and the gluteals in females. Males and females have significantly different regression slopes for the tensor fasciae latae and hamstrings. Regression parameters are listed in Table 4.
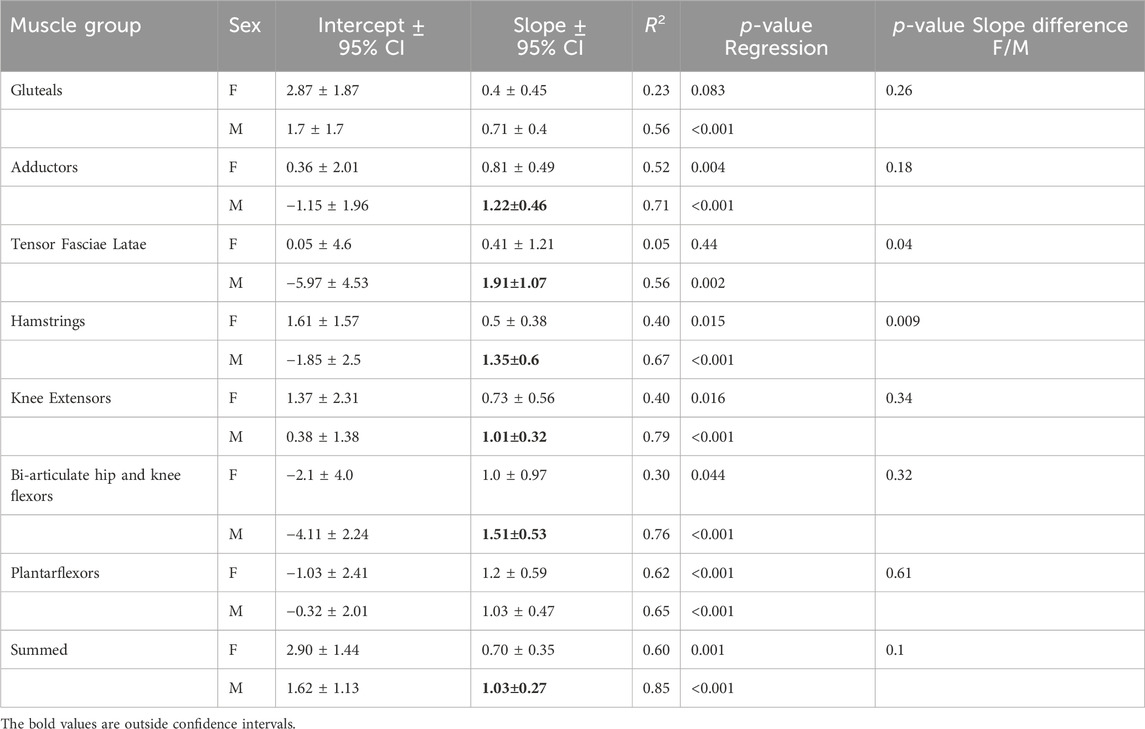
TABLE 4. Intercept, slope, and 95% CI for allometric equations relating log transformed body mass and ACSAmax by sex. Slopes in bold indicate that the 95% CI does not overlap the isometric expectation of 0.67.
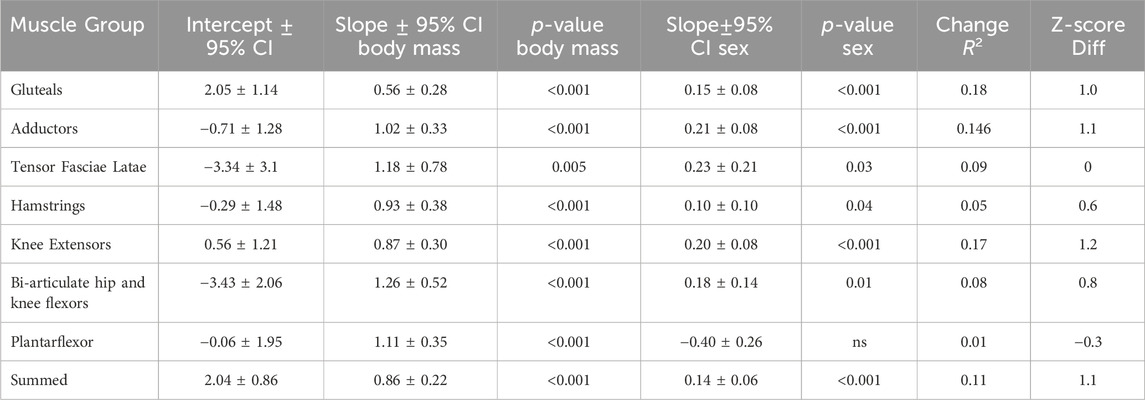
TABLE 5. Results of multiple regression analysis with body mass and sex as independent variables and muscle group ACSAmax as the dependent variable. p-values are for the slopes of the independent variables and change R2 shows the increase in explained variance of the dependent variable when sex is added to the regression model. Z-score difference measures the average difference in ACSAmax controlling for body mass measured in units of standard deviations. Positive values indicate males are larger than females.
4 Discussion
Hypothesis 1 and 2:. Individual muscle cross-sectional areas within a functional muscle group will have the same slope relative to body mass, and total muscle cross-sectional area of a functional muscle group scales isometrically with body mass.
Individual muscles within a functional group generally showed the same scaling relationship to body mass except for biceps femoris long head and the soleus. This supports the first hypothesis and suggests scaling analysis of muscles in functional groups is appropriate and does not mask scaling differences of muscles within the group. Each functional group scaled with positive allometry and, except for the gluteals, 95% confidence intervals did not overlap the isometric slope of 0.67, rejecting the second hypothesis.
Hypothesis 3:. Slopes of muscle cross-sectional area functional muscle groups relative to body mass will be the same in apes and humas. Alternatively, given the increased force production demands of human hindlimb muscles, slopes are expected to be greater for human regressions than those of apes.
In support of the third hypothesis alternative, the hamstrings, knee extensors, bi-articulate hip and knee flexors, and plantarflexors regression slopes for the combined human sample all exceeded those reported for apes and were outside the ape regression 95% confidence intervals (Myatt et al., 2011). The greater slope values of the functional muscle groups analyzed here indicate substantial deviation away from an ape-like pattern of muscle scaling in our evolutionary history. Demand on lower limb muscle force production is increased in humans due to the redistribution of body mass exclusively to the lower limbs during bipedalism. Muscle activation, and presumably force demand, is also influenced by gait, incline, and speed (Wall-Scheffler et al., 2010; Franz and Kram, 2012). Studies have documented consistent and substantial increases in electromyographic (EMG) amplitude in muscles of the hamstrings, quadriceps, adductors, abductors, and plantarflexors during stance phase of inclined walking and running or as speed increases in either gait (Wall-Scheffler et al., 2010; Franz and Kram, 2012). In some muscles, stance phase peak activation amplitudes during faster walking speeds may exceed those during slower running suggesting optimization of muscle performance may initiate gait transition (Cappellini et al., 2006). Interestingly, despite the major differences in kinematics and kinetics between the two gaits, muscle activation patterns are largely similar during both stance and swing phase across the gaits with the major distinction being a shift in timing of the activation of ankle plantarflexion to earlier in the support phase during running (Cappellini et al., 2006). There has been particular focus on the activation of the human gluteus maximus during bipedal locomotion given the substantially larger size of this muscle in humans compared to apes. Lieberman et al. (2006) argue that the gluteus maximus is significantly more active during stance and swing phase of running than walking, suggesting increases in muscle size occurred with the development of endurance running capabilities in the genus Homo (although they do not rule out the evolutionary importance of inclined walking on gluteus maximus size). However, Wall-Scheffler et al. (2010) suggest that the reduction in variability in gluteus maximus activation during higher speed or incline walking compared to running is more compatible with a model of optimization of a walking gait (at varying intensities) being a primary driver of increased gluteus maximus size in humans. More recent data suggests that the gluteus maximus is recruited for fast and powerful movements in a variety of locomotor contexts from sprinting to climbing (Bartlett et al., 2014). While both human and ape gluteals scale with positive allometry (albeit with CI overlapping 0.67) in the current study, the higher regression intercept in humans (1.05 vs. 0.35) supports a grade shift in gluteal size in our evolutionary history, even if the rate of increase relative to body mass within species is relatively similar across all apes. The shared activation patterns of the two gaits, and similar demands for increased force with speed or incline makes it difficult to argue that either walking or running has exclusively driven adaptive responses in muscle architecture.
Hypothesis 4:. Slopes for muscle cross-sectional area functional muscle groups relative to body mass will be the same in human females and males. Alternatively, greater average fat mass in females may produce lower slope values or correlations with body mass for functional muscle groups than in males.
The fourth hypothesis is supported by the current data and suggests similarity in relative force production demands across muscle groups in both males and females. However, males universally had higher slope values than females but they did not reach statistical significance (except for tensor fascia latae and hamstrings). The current data, suggest that in both sexes muscle ACSAmax increases at a faster rate than body mass, giving larger individuals greater ability to produce force relative to body mass. These results are in partial agreement with previous studies of allometric scaling of thigh and leg girth, used as a proxy for muscle cross-sectional area (Nevill et al., 2004). For both proximal and distal limb segments, Nevill et al. (2004) found girth scaled with positive allometry in both athletes and non-athletes. The scaling factors did not differ between males and females at the thigh, but leg girth scaling was affected by sex (Nevill et al., 2004). Lower R2 values for all female regressions in this study also indicate more variability in muscle mass relative to body mass compared to males. This is supported by the multiple regression analyses, where including sex as a covariate with body mass increased explained variance across muscle groups by 1%–18%, and demonstrates a significant independent effect of sex on ACSAmax for all muscle groups except the plantarflexors. Furthermore, controlling for body mass, males had greater muscle ACSAmax values in most muscle groups. These differences could be attributed to sex alone, or could be a combination of effects from training, sex, and other variables not measured in this study. The impact of greater average fat mass relative to body mass in females (∼10%) (Wells, 2012) has implications for sports performance. Difference in performance times for elite male and female athletes in both running and swimming events corresponds closely with differences in BMI, implicating relative muscle mass as the key explanatory variable in race time disparities (Gagnon et al., 2018). Future studies that assess the scaling relationship between lean body mass and muscle mass, with larger samples of both males and females, will be needed to confirm the current findings.
The relative contributions of lean and fat mass in relation to muscle ACSAmax, and the evolutionary history of sexual dimorphism in the hominin lineage, both have implications for interpreting muscle architecture in the fossil record. Human life-history is characterized by an energetic paradox with substantial energy demands required for encephalization, large offspring, shortened interbirth intervals, high activity rates, and longevity (Pontzer et al., 2016). To fuel these demands, human total energy expenditure (TEE) is accelerated compared to other apes, and humans (particularly females) also possess an increased capacity to store energy as fat (Wells, 2007; Pontzer et al., 2016). This metabolic strategy likely arose with the evolution of hunting and gathering early in the genus Homo (Pontzer, 2012), and modern dimorphism in relative fat mass is a likely consequence of the greater metabolic burden of reproduction on human females. The fossil record also suggests that some early hominins such as Australopithecus had a more ape-like pattern of body size sexual dimorphism compared to modern humans (Gordon, 2013). Unfortunately, current data for apes are insufficient to directly address the allometric relationship between body mass and ACSAmax in highly dimorphic primate taxa given the rarity of cadaveric specimens of these species (Myatt et al., 2011). Future research exploring sex specific scaling relationships between body mass and muscle size in primates generally are needed to determine the role of selection, allometry, growth duration, and growth rate in muscle dimorphism in our evolutionary lineage.
5 Limitations
One limitation of this study is the comparison of ACSAmax from the human sample with PCSA measured in apes by Myatt et al. (2011). Theoretically, in non-pinnate muscles, measurements of ACSA pass perpendicular to parallel muscle fibers and these two measures should be the same (Gadeberg et al., 1999; Akagi et al., 2009). However, discrepancies in PCSA and ACSAmax measured on the same individuals and in reported muscle force production capacity relative to different measures of area has created uncertainty about the best measurement for predicting muscle force (Fukunaga et al., 1992; Jones et al., 2008). This should be considered when evaluating the results of the current study. Additionally, varying levels of sexual dimorphism and different locomotor behaviors in the ape taxa analyzed by Myatt et al. (2011) may impact the relationship between body mass and PCSA reported in the ape regressions. For example, orangutans engage in more cautious climbing and are rarely terrestrial in the wild, while gorillas transition from mixed arboreal/terrestrial locomotion as juveniles to strictly terrestrial behavior in adulthood. However, given the scarcity of ape cadaveric specimens, sample sizes are currently insufficient to provide species, or sex, specific allometric relationships. The human sample size may also be insufficient in cases where the 95% confidence intervals for regression slopes overlapped with isometric expectations. Larger sample sizes may ultimately show isometric scaling in these cases, however obtaining MRI or CT muscle data on a large mixed-sex sample of young, healthy adults is difficult. Finally, due to limitations on software and personnel access, all measurements of ACSAmax were performed solely by the author, so no estimates of inter-observer error are available for these data.
6 Conclusion
This research addresses the relationship between lower-limb muscle cross-sectional area and body mass to enhance understanding of the role of bipedalism in shaping muscle architecture in human evolution. Across functional muscle groups, human cross-sectional area scales with positive allometry, reflecting the force production demands of bipedal walking and running. In all functional groups but the gluteal muscles, human scaling factors are outside the 95% confidence intervals for comparable muscle groups in apes reported in the literature. Despite differences in average fat mass between males and females, this study did not find statistically different scaling factors for most lower-limb muscles between the sexes. However, the overall lower slopes and R2 values for female regressions, as well as the independent effect of sex in multiple regression analysis, suggest that additional data that explicitly account for fat mass are needed to confirm these findings.
Data availability statement
The original contributions presented in the study are included in the article/Supplementary Material, further inquiries can be directed to the corresponding author.
Ethics statement
The studies involving humans were approved by the Washington University in St. Louis Internal Review Board (#09-0216). The studies were conducted in accordance with the local legislation and institutional requirements. The participants provided their written informed consent to participate in this study.
Author contributions
AW: Conceptualization, Data curation, Formal Analysis, Funding acquisition, Investigation, Methodology, Software, Visualization, Writing–original draft, Writing–review and editing.
Funding
The author(s) declare financial support was received for the research, authorship, and/or publication of this article. Funding for this project was provided by the National Science Foundation grant NSF#0850841, The L.S.B. Leakey Foundation, Wenner-Gren Foundation for Anthropological Research, and the University of Colorado Denver.
Acknowledgments
Thank you to Glenn Foster and Scott Love at the Center for Clinical Imaging for running MRIs for all participants and to two reviewers for comments that improved this manuscript.
Conflict of interest
The author declares that the research was conducted in the absence of any commercial or financial relationships that could be construed as a potential conflict of interest.
Publisher’s note
All claims expressed in this article are solely those of the authors and do not necessarily represent those of their affiliated organizations, or those of the publisher, the editors and the reviewers. Any product that may be evaluated in this article, or claim that may be made by its manufacturer, is not guaranteed or endorsed by the publisher.
Supplementary material
The Supplementary Material for this article can be found online at: https://www.frontiersin.org/articles/10.3389/feart.2023.1301411/full#supplementary-material
References
Akagi, R., Takai, Y., Ohta, M., Kanehisa, H., Kawakami, Y., and Fukunaga, T. (2009). Muscle volume compared to cross-sectional area is more appropriate for evaluating muscle strength in young and elderly individuals. Age Ageing 38, 564–569. doi:10.1093/ageing/afp122
Albracht, K., Arampatzis, A., and Baltzopoulos, V. (2008). Assessment of muscle volume and physiological cross-sectional area of the human triceps surae muscle in vivo. J. Biomechanics 41, 2211–2218. doi:10.1016/j.jbiomech.2008.04.020
Alexander, R. M. N., Jayes, A. S., Maloiy, G. M. O., and Wathuta, E. M. (1981). Allometry of the leg muscles of mammals. J. Zoology 194, 539–552. doi:10.1111/j.1469-7998.1981.tb04600.x
Bartlett, J. L., Sumner, B., Ellis, R. G., and Kram, R. (2014). Activity and functions of the human gluteal muscles in walking, running, sprinting, and climbing. Am. J. Phys. Anthropol. 153, 124–131. doi:10.1002/ajpa.22419
Cappellini, G., Ivanenko, Y. P., Poppele, R. E., and Lacquaniti, F. (2006). Motor patterns in human walking and running. J. Neurophysiology 95, 3426–3437. doi:10.1152/jn.00081.2006
DeSilva, J. M., Holt, K. G., Churchill, S. E., Carlson, K. J., Walker, C. S., Zipfel, B., et al. (2013). The lower limb and mechanics of walking in Australopithecus sediba. Science 340, 1232999. doi:10.1126/science.1232999
Franz, J. R., and Kram, R. (2012). The effects of grade and speed on leg muscle activations during walking. Gait Posture 35, 143–147. doi:10.1016/j.gaitpost.2011.08.025
Fukunaga, T., Miyatani, M., Tachi, M., Kouzaki, M., Kawakami, Y., and Kanehisa, H. (2001). Muscle volume is a major determinant of joint torque in humans: muscle volume and joint torque. Acta Physiol. Scand. 172, 249–255. doi:10.1046/j.1365-201x.2001.00867.x
Fukunaga, T., Roy, R. R., Shellock, F. G., Hodgson, J. A., Day, M. K., Lee, P. L., et al. (1992). Physiological cross-sectional area of human leg muscles based on magnetic resonance imaging. J. Orthop. Res. 10, 926–934. doi:10.1002/jor.1100100623
Gadeberg, P., Andersen, H., and Jakobsen, J. (1999). Volume of ankle dorsiflexors and plantar flexors determined with stereological techniques. J. Appl. Physiology 86, 1670–1675. doi:10.1152/jappl.1999.86.5.1670
Gagnon, C. M., Steiper, M. E., and Pontzer, H. (2018). Elite swimmers do not exhibit a body mass index trade-off across a wide range of event distances. Proc. R. Soc. B Biol. Sci. 285, 20180684. doi:10.1098/rspb.2018.0684
Gordon, A. D. (2013). “Sexual size dimorphism in Australopithecus: current understanding and new directions,” in The Paleobiology of Australopithecus vertebrate paleobiology and paleoanthropology. Editors K. E. Reed, J. G. Fleagle, and R. E. Leakey (Dordrecht: Springer Netherlands), 195–212. doi:10.1007/978-94-007-5919-0_13
Jones, E. J., Bishop, P. A., Woods, A. K., and Green, J. M. (2008). Cross-sectional area and muscular strength. Sports Med. 38, 987–994. doi:10.2165/00007256-200838120-00003
Lieberman, D. E., Raichlen, D. A., Pontzer, H., Bramble, D. M., and Cutright-Smith, E. (2006). The human gluteus maximus and its role in running. J. Exp. Biol. 209, 2143–2155. doi:10.1242/jeb.02255
Lieberman, D. E., Venkadesan, M., Werbel, W. A., Daoud, A. I., D’Andrea, S., Davis, I. S., et al. (2010). Foot strike patterns and collision forces in habitually barefoot versus shod runners. Nature 463, 531–535. doi:10.1038/nature08723
Lieberman, D. E., Warrener, A. G., Wang, J., and Castillo, E. R. (2015). Effects of stride frequency and foot position at landing on braking force, hip torque, impact peak force and the metabolic cost of running in humans. J. Exp. Biol. 218, 3406–3414. doi:10.1242/jeb.125500
Lovejoy, C. O., Suwa, G., Spurlock, L., Asfaw, B., and White, T. D. (2009). The pelvis and femur of Ardipithecus ramidus: the emergence of upright walking. Science 326, 71–71e6. doi:10.1126/science.1175831
McNutt, E. J., Zipfel, B., and DeSilva, J. M. (2018). The evolution of the human foot. Evol. Anthropol. 27, 197–217. doi:10.1002/evan.21713
Muchlinski, M. N., Snodgrass, J. J., and Terranova, C. J. (2012). Muscle mass scaling in primates: an energetic and ecological perspective. Am. J. Primatology 74, 395–407. doi:10.1002/ajp.21990
Myatt, J. P., Crompton, R. H., and Thorpe, S. K. S. (2011). Hindlimb muscle architecture in non-human great apes and a comparison of methods for analysing inter-species variation: comparing hindlimb muscle architecture in non-human great apes. J. Anat. 219, 150–166. doi:10.1111/j.1469-7580.2011.01383.x
Nevill, A. M., Stewart, A. D., Olds, T., and Holder, R. (2004). Are adult physiques geometrically similar? The dangers of allometric scaling using body mass power laws. Am. J. Phys. Anthropol. 124, 177–182. doi:10.1002/ajpa.10351
O’Neill, M. C., Lee, L.-F., Larson, S. G., Demes, B., Stern, J. T., and Umberger, B. R. (2013). A three-dimensional musculoskeletal model of the chimpanzee (Pan troglodytes) pelvis and hind limb. J. Exp. Biol. 216, 3709–3723. doi:10.1242/jeb.079665
O’Neill, M. C., Nagano, A., and Umberger, B. R. (2023). A three-dimensional musculoskeletal model of the pelvis and lower limb of Australopithecus afarensis. Am. J. Biol. Anthropol., 1. –22. doi:10.1002/ajpa.24845
Pontzer, H. (2012). Ecological energetics in early Homo. Curr. Anthropol. 53, S346–S358. doi:10.1086/667402
Pontzer, H., Brown, M. H., Raichlen, D. A., Dunsworth, H., Hare, B., Walker, K., et al. (2016). Metabolic acceleration and the evolution of human brain size and life history. Nature 533, 390–392. doi:10.1038/nature17654
Prang, T. C. (2015). Calcaneal robusticity in Plio-Pleistocene hominins: implications for locomotor diversity and phylogeny. J. Hum. Evol. 80, 135–146. doi:10.1016/j.jhevol.2014.09.001
Raichlen, D. A., Gordon, A. D., Muchlinski, M. N., and Snodgrass, J. J. (2010). Causes and significance of variation in mammalian basal metabolism. J. Comp. Physiol. B 180, 301–311. doi:10.1007/s00360-009-0399-4
Stamos, P. A., and Alemseged, Z. (2023). Hominin locomotion and evolution in the late miocene to late pliocene. J. Hum. Evol. 178, 103332. doi:10.1016/j.jhevol.2023.103332
Stickley, C. D., Andrews, S. N., Parke, E. A., and Hetzler, R. K. (2018). The effectiveness of scaling procedures for comparing ground reaction forces. J. Biomechanics 77, 55–61. doi:10.1016/j.jbiomech.2018.06.021
Sylvester, A. D., Lautzenheiser, S. G., and Kramer, P. A. (2021). Muscle forces and the demands of human walking. Biol. Open 10, bio058595. doi:10.1242/bio.058595
Wall-Scheffler, C. M., Chumanov, E., Steudel-Numbers, K., and Heiderscheit, B. (2010). Electromyography activity across gait and incline: the impact of muscular activity on human morphology. Am. J. Phys. Anthropol. 143, 601–611. doi:10.1002/ajpa.21356
Wang, W., Crompton, R. H., Carey, T. S., Günther, M. M., Li, Y., Savage, R., et al. (2004). Comparison of inverse-dynamics musculo-skeletal models of AL 288-1 Australopithecus afarensis and KNM-WT 15000 Homo ergaster to modern humans, with implications for the evolution of bipedalism. J. Hum. Evol. 47, 453–478. doi:10.1016/j.jhevol.2004.08.007
Wells, J. C. K. (2007). Sexual dimorphism of body composition. Best Pract. Res. Clin. Endocrinol. Metabolism 21, 415–430. doi:10.1016/j.beem.2007.04.007
Wells, J. C. K. (2012). Sexual dimorphism in body composition across human populations: associations with climate and proxies for short- and long-term energy supply. Am. J. Hum. Biol. 24, 411–419. doi:10.1002/ajhb.22223
Wickiewicz, T. L., Roy, R. R., Powell, P. L., Perrine, J. J., and Edgerton, V. R. (1984). Muscle architecture and force-velocity relationships in humans. J. Appl. Physiology 57, 435–443. doi:10.1152/jappl.1984.57.2.435
Keywords: bipedalism, sexual dimorphism, muscle scaling, geometric similarity, muscle crosssectional area
Citation: Warrener A (2024) Human lower limb muscle cross sectional area scales with positive allometry reflecting bipedal evolutionary history. Front. Earth Sci. 11:1301411. doi: 10.3389/feart.2023.1301411
Received: 24 September 2023; Accepted: 20 December 2023;
Published: 15 January 2024.
Edited by:
Nicholas Baird Holowka, University at Buffalo, United StatesReviewed by:
Steven Lautzenheiser, The University of Tennessee, Knoxville, United StatesMarta Pina, London South Bank University, United Kingdom
Copyright © 2024 Warrener. This is an open-access article distributed under the terms of the Creative Commons Attribution License (CC BY). The use, distribution or reproduction in other forums is permitted, provided the original author(s) and the copyright owner(s) are credited and that the original publication in this journal is cited, in accordance with accepted academic practice. No use, distribution or reproduction is permitted which does not comply with these terms.
*Correspondence: Anna Warrener, YW5uYS53YXJyZW5lckB1Y2RlbnZlci5lZHU=