 Chenhui Su
 Yuhang Zhang1
94% of researchers rate our articles as excellent or good
Learn more about the work of our research integrity team to safeguard the quality of each article we publish.
Find out more
ORIGINAL RESEARCH article
Front. Earth Sci., 27 December 2023
Sec. Geohazards and Georisks
Volume 11 - 2023 | https://doi.org/10.3389/feart.2023.1298758
This article is part of the Research TopicEvolution Mechanism and Control Method of Engineering Disasters Under Complex EnvironmentView all 30 articles
Concrete is widely used in bridges, tunnels, nuclear power plants and other buildings, the damage of concrete will bring significant safety hazards for the building, therefore, detecting concrete damage is of great significance. In this paper, the propagation characteristics of guided waves in concrete plates are investigated, and finite element simulation is used to analyze the sensitivity of guided waves to the damage of concrete materials under different excitation frequencies. Simulation experiments on guided wave propagation are performed on concrete materials containing damage in the excitation frequency range from 25 to 100 kHz. The signals received by the sensors are analyzed in the time domain, while the reflected wave signals resulting from the contact of the signals with the damage are analyzed in the frequency domain. The results show that the excitation frequencies of 25 and 60 kHz are more sensitive to damage, and the quantitative identification of damage without reference can be realized by using the peak signals in the frequency domain at different excitation frequencies.
Concrete has excellent compression resistance (Liao et al., 2023) and durability, it is the main material for construction engineering, and has a wide range of applications in the field of railroad tunnels, bridge works (Zhang et al., 2022a), nuclear power plants (Nasir Ayaz Khan et al., 2022) and so on. China produces more than 3 billion cubic meters of commercial concrete annually, and China is the world’s largest cement manufacturing country. The extensive use of concrete also brings with it a series of problems. Concrete is prone to structural damage under the influence of the external environment and load. The common damage defects include steel corrosion, cavity, crack, honeycomb and so on. Concrete is made by pouring method, which is easy to produce holes under the influence of internal gas and external environment. At the same time, due to the dense reinforcement inside, it is easy to have small diameter holes after a long time of use. These damages can affect material properties to different degrees. If defects can be discovered and maintained early, catastrophic incidents can be avoided, which is important for the protection of people’s property safety and maintenance of social stability, so the damage detection of concrete is particularly important.
The development of modern architecture has put forward higher requirements for the performance of concrete materials, which has triggered people’s research on concrete materials. For example, reinforcement fibers such as steel fiber (Cucuzza et al., 2023), basalt, and polyformaldehyde fiber (Yan et al., 2023) are added to improve the ability of concrete to resist cracking. Albidah et al. (2023) studied the effects of different coarse aggregate types on the properties of concrete materials. It is concluded that the increase of aggregate size reduces the number of cracks in the beam under four-point bending test and improves the shear strength of the beam. Xiao et al. (2023) analyzed the effect of pore structure on the performance of concrete.
Non-destructive testing (NDT) (Mićić et al., 2023) can detect the material without affecting the tested object. Common non-destructive testing methods include ultrasonic testing (Mousavi and Gandomi, 2021; Zhang et al., 2022b), acoustic emission method, infrared thermography, eddy current testing (Bao et al., 2021; Meng et al., 2021) and so on. Wang et al. (2023) used the acoustic emission method to observe the failure process of cemented asphalt filling mixes under different loads. Berthe et al. (2023) used high-speed infrared thermal imaging technology to observe materials under low-velocity impact and estimate the degree of damage. Every method has its advantages and limitations. Compared with these methods, ultrasonic guided wave method has the advantages of low cost, slow attenuation (Mei et al., 2020), sensitivity to small defects (Hu et al., 2022), and long propagation distance (Mitra et al., 2023). Over the years, a lot of achievements have been made in the directions of propagation mechanism, damage location (Feng et al., 2019), and healthy structure monitoring (Rautela et al., 2022; Mesnil et al., 2023). Therefore, the ultrasonic guided wave method can be used as an effective way to detect concrete damage detection.
Guided wave is a kind of elastic wave composed of transverse and longitudinal waves, and the propagation state is constrained by the geometry of the propagation medium. The interaction between guided wave and structural damage will produce phenomena such as reflection, scattering, and waveform conversion. The use of signal processing technology and damage discrimination methods to process the damage signal can be used to determine the type and location of the damage. Common materials include aluminum plates, composite plates, stiffened plates and so on. Lamb wave is a kind of guided wave transmitted in plate structure, which has the advantages of slow attenuation and long propagation distance and is suitable for damage monitoring of plate structures. Dr. Yongqing Yang used Lamb waves to analyze the dispersion curves of concrete plates under different conditions and the effect of the surrounding soil on the dispersion phenomenon. Hua et al. (2022) proposed an improved lamb-wave minimum variance imaging method to detect aluminum and composite laminates, which effectively identifies the damage location and reduces the imaging error. Some scholars have proposed a damage location algorithm (Pineda Allen and Ng, 2023) based on the contact non-linear combined frequency waves generated by the interaction between guided waves and damage, which can determine the layering damage location of composite laminates. Sikdar et al. (2023) proposed a structure monitoring method based on deep learning, it uses wavelet transform (Wu et al., 2021) to convert the high harmonics generated by the guided wave in contact with the damage into an image, and the damage of the stiffened plate can be obtained by analyzing and processing the image using deep learning. Feng et al. (2023) carried out low-speed impact experiments on carbon fiber composites, extracted time-frequency characteristics of signals, and used neural networks (Feng et al., 2022) to accurately detect impact locations.
Based on the research of guided wave properties, NDT technology have also been used in the field of construction. Some scholars have used stress waves to test concrete covered with soft coatings for judging the material properties of modified concrete (Xu et al., 2022). Yu et al. proposed a theoretical method (Yu et al., 2021) for the location of concrete surface cracks based on the attenuation of Rayleigh wave propagation energy and conducted numerical verification. Liu et al. (2022) studied the effects of steel bar type, water-cement ratio, and concrete thickness on the corrosion process through ultrasonic guided wave amplitude. Aseem and Ng (2021) analyzed the de-bonding of reinforced concrete structures by using the nonlinear characteristics of ultrasonic guided wave in de-bonding detection. Lead zirconate titanate (PZT) sensor is one of the commonly used equipment when using guided wave to inspect concrete. Lim et al. (2016) monitored the material properties of concrete beams during the forming process by attaching PZT sensors to the surface. Yu et al. (2020) measured the material properties of concrete blocks using an embedded PZT sensor.
The above scholars have imaged and localized the damage and analyzed the material properties of concrete based on guided wave characteristics, which promotes the development of nondestructive testing technology. However, the selection of guided wave frequency was not described in detail, and the quantitative identification (Feng et al., 2020) of damage was not carried out. Selecting the excitation frequency sensitive to damage is helpful to improve the accuracy of damage identification and location. Therefore, based on the propagation characteristics of guided waves in concrete, this paper analyzes the concrete under damage conditions in the excitation frequency range of 25–100k Hz, and obtains the guided wave frequency sensitive to damage. Meanwhile, the concrete cavity type damage is quantitatively identified according to the amplitude value under different damage conditions.
Lamb wave is a kind of elastic stress wave propagating in a thin plate. Lamb waves (Lamb, 1917) were obtained by H. Lamb in England in 1917 when solving the fluctuation equations by the flat plate free boundary condition. Lamb waves have dispersion characteristics and multimodal characteristics (Li et al., 2022). The dispersion characteristic refers to the different propagation speed of the waves with different frequencies. The propagation speed of Lamb waves at different frequencies can be obtained by calculating the dispersion curve. The multimodal characteristic means that the mode of the wave will change after the wave is transferred to the upper and lower boundary. The wave modes in a thin plate can be divided into two kinds according to the different vibration directions of the particles in the plate: symmetric mode and antisymmetric mode. The two modes can be described by the Rayleigh-lamb equation:
Symmetry mode:
Antisymmetric model:
Where,
Substituting Eq. 3 gives the following result:
The resulting waveform can be regarded as a combination of low frequency and high frequency terms. The phase velocity
In practical engineering, the damage of concrete is complicated. In order to find out the excitation frequency sensitive to structural damage, this experiment selects the hole-type damage as a common damage for simulation. ABAQUS finite element software was used for simulation, and the size of concrete slab was set as 600 mm*600 mm*20 mm. As shown in Figure 1, the model is equipped with a total of 9 sensors, ranging from S1 to S9. Which S1 (180, 300) as the exciter, S2∼S9 as the sensors to receive the signal, the coordinates of sensor S2 are (300, 300), and A (510, 300) as the damage center, the schematic diagram is shown in Figure 1.
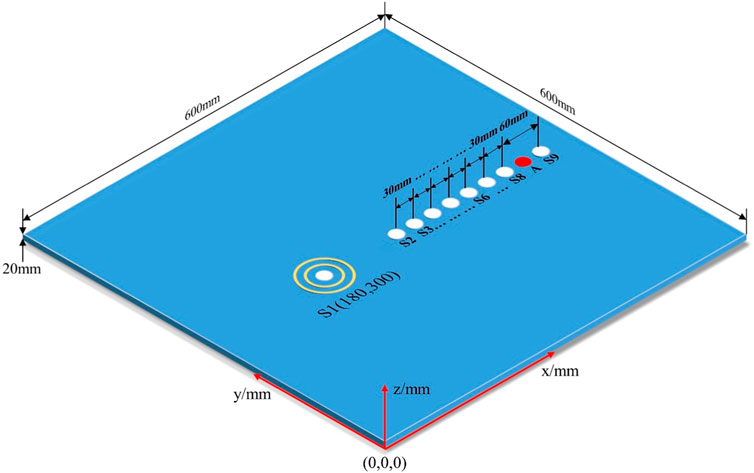
FIGURE 1. Simulation diagram.
The concrete parameters of model C60 were used for simulation in the experiment, and the specific material parameters are shown in Table 1.
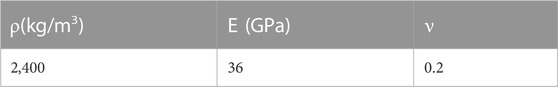
TABLE 1. C60 concrete material parameters.
The parameters in Table 1 were used for calculation. In order to ensure the accuracy of numerical simulation, at least 10 grids should be included in a wavelength range. The shear modulus is as follows:
The minimum phase velocity
The higher the frequency, the smaller the corresponding wavelength, and the higher the corresponding grid requirements. Select 100 kHz for calculation:
The raw materials of C60 concrete material are cement, mineral powder, fly ash, medium sand, 5–25 mm crushed stone and water. The wavelength of the 100 kHz excitation signal is about 25 mm, which is larger than the diameter of the coarse aggregate, so the scattering and diffraction attenuation of the coarse aggregate is ignored, and the concrete material is simplified to a uniform and isotropic medium (Lim et al., 2018). Lead zirconate titanate (PZT) sensor is often used to transmit and receive stress waves when testing concrete materials with guided waves. In the simulation process, the sensor is simplified as the excitation point, and the loading direction of the excitation signal is set as the vertical incidence excitation.
The signal propagates in the concrete plate, and is reflected and transmitted after contact with the hole type damage, and the reflected wave generated is received by the sensor. Because of the different excitation frequency and damage diameter, the amplitude and phase of the reflected wave will change.
The concrete plate model is established, and the material parameters are set according to Table 1. The center frequency is scanned from 25 to 100 kHz in steps of 10 and 15 kHz. The formula for the excitation frequency is as follows:
Where A represents the amplitude,
After contacting the damage, Lamb wave will produce more obvious reflected wave signal, which can be used to distinguish the damage of concrete. Taking the ex-citation frequency of 60 kHz as an example, the propagation cloud image of the simulation model before and after damage at the same time is shown in Figures 2, 3.
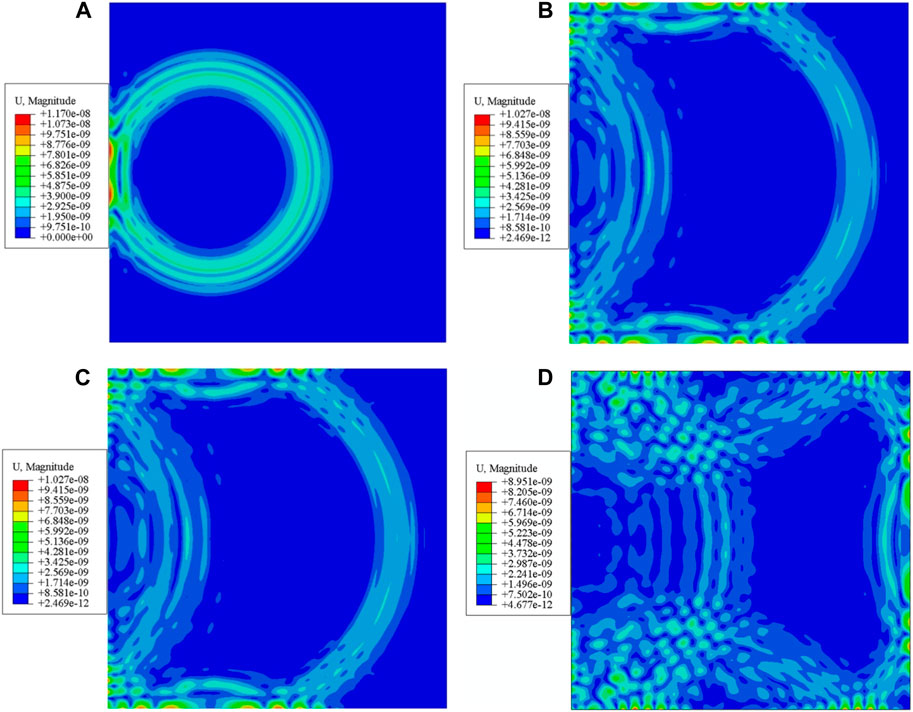
FIGURE 2. Cloud image of guided wave propagation under undamaged concrete at different time. (A) 0.103 ms; (B) 0.166 ms; (C) 0.195 ms; (D) 0.219 ms.
FIGURE 3. Cloud image of guided wave propagation under damaged concrete at different time. (A) 0.103 ms; (B) 0.166 ms; (C) 0.195 ms; (D) 0.219 ms.
As can be seen from Figure 2, the guided wave propagates around from the excitation point and generates an obvious reflected wave after contacting the boundary. In Figure 3, in addition to the boundary reflected wave, the guided wave also produces obvious reflected wave signal after contact with the concrete damage. Next, excitation signals of different frequencies are used for simulation. Sensor S6 in Figure 1 is used to collect signals. The Lamb wave signals collected are shown in Figure 4. The boxed portion of Figure 4 contains the echo signal generated by the reflection of the signal after contact with the damage.
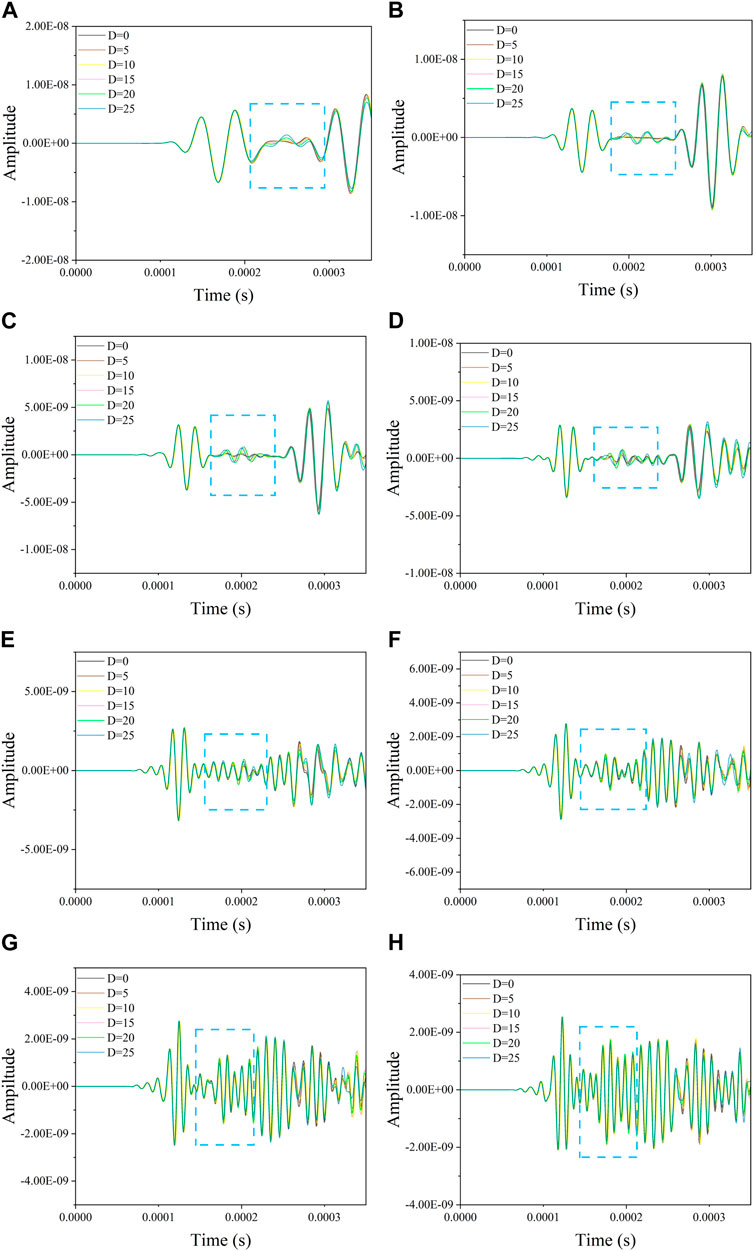
FIGURE 4. Time domain signal diagram of 25–100 kHz excitation frequency under different damage. (A) 25 kHz; (B) 40 kHz; (C) 50 kHz; (D) 60 kHz; (E) 70 kHz; (F) 80 kHz; (G) 90 kHz; (H) 100 kHz.
As can be seen from Figure 4, the first point is that as the frequency of the excitation signal increases, the obtained time-domain signal becomes intensive, and the amplitude gradually decreases. The second point is that with the change of the damage diameter, the peak size of the reflected signal wave packet fluctuates. At 25 and 40 kHz, it changes regularly: with the increase of the damage diameter, the amplitude of the reflected signal decreases. As the excitation frequency increases, the waveform becomes more complex. In order to obtain a more intuitive signal difference, the reflected signals in the boxed section are observed below by converting them from time-domain signals to frequency-domain signals.
The reflected wave part of Lamb wave time domain signal collected by sensor S6 in Figure 1 is converted into frequency domain signal, as shown in Figure 5:
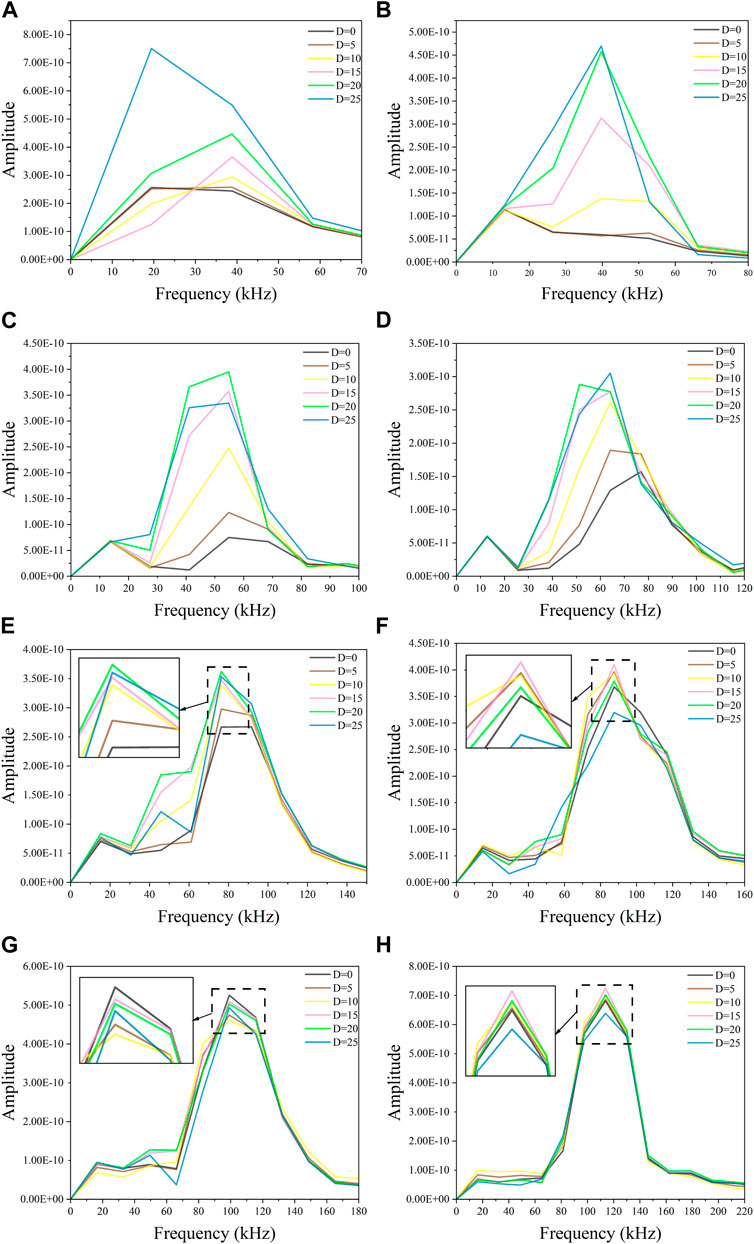
FIGURE 5. The frequency domain signal diagram of 25–100 kHz reflected wave signal under different damage. (A) 25 kHz; (B) 40 kHz; (C) 50 kHz; (D) 60 kHz; (E) 70 kHz; (F) 80 kHz; (G) 90 kHz; (H) 100 kHz.
From the frequency domain signal plot in Figure 5, the first is that the frequency corresponding to the peak value of the frequency domain signal is close to the frequency of the excitation signal. The second is that the peak value of the frequency domain changes at different damage diameters. Among them, the peak signals in the frequency domain with excitation frequencies of 50, 70, 80, 90, and 100 kHz did not make regular changes with damage changes. They do not have an advantage when selecting the excitation signal sensitive to damage, while the frequency domain amplitude of excitation frequency of 25, 40, and 60 kHz increases with the increase of damage diameter, and the frequency domain peak value is consistent with the damage size arrangement.
From the perspective of amplitude and signal variation, 25, 40, and 60 kHz excitation signals are more conducive to signal acquisition and identification and are more sensitive to damage.
In order to study the variation of the signal frequency domain amplitude with the propagation distance, seven sensors were set up on the model, and the sensor spacing is 30 mm, as shown in S2∼S8 in Schematic Figure 1. The excitation signals sent by the sensor S1 pass through the sensors S2∼S8, and the direct wave signals received by the sensor are selected for frequency domain analysis. As shown in Figure 6.
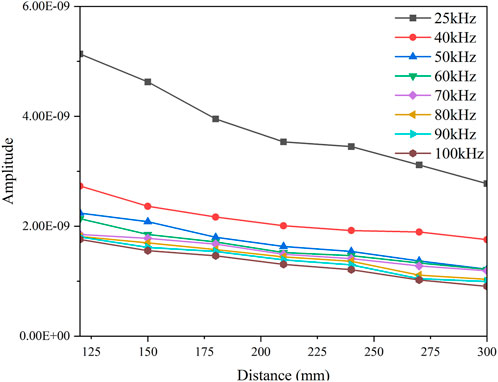
FIGURE 6. Frequency domain amplitude variation with propagation distance.
The direct wave signal received by the evenly spaced sensor s2∼s8 is converted into the frequency domain signal, and the change of the peak signal and the propagation distance in the frequency domain is plotted. As can be seen from Figure 6, with the increase of the propagation distance, the peak value of the signal in the frequency domain decreases continuously, indicating that concrete is the attenuation medium of sound wave. Meanwhile, with the increase of frequency, the peak value of the signal in the frequency domain decreases continuously, proving that the amplitude of the low-frequency wave is large.
From Figure 6, the frequency domain amplitude decreases with increasing propagation distance and shows a clear linear variation. It can be concluded that the amplitude of the excitation signal decreases with the increase of the propagation distance. The transmissive wave at S9 was analysed, and the results show that the signal shows a regular arrangement only at 80–100 kHz: with the increase of the damage diameter, the amplitude of the transmissive wave frequency domain decreases.
To better analyze the amplitude changes before and after the damage, the direct and reflected waves at the sensor S6 in schematic Figure 1 were analyzed, and the diameter of the reflected wave damage was selected to be 5 mm, as shown in Figure 7.
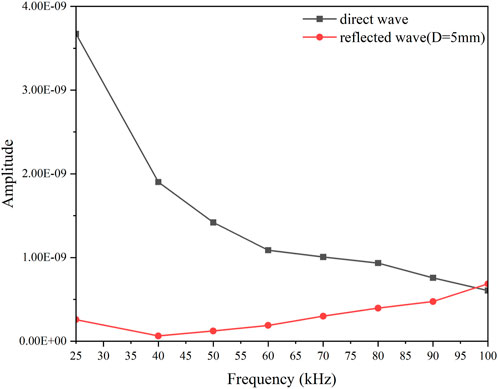
FIGURE 7. Direct wave and reflected wave comparison diagram.
From Figure 7, under the no damage condition, the amplitude in the frequency domain decreases with increasing frequency, and the overall reflected wave increases with increasing frequency, while a larger amplitude facilitates damage detection, so it is more appropriate to choose a lower excitation frequency. 25–70 kHz direct wave and reflected wave have obvious amplitude difference, but 40 kHz reflected wave frequency domain amplitude is small, so it is difficult to be used as a judgment condition.
The variation of the frequency domain amplitude of the reflected wave with the size of the damage diameter at different frequencies is plotted, and it is concluded that the frequency domain amplitude of the reflected wave changes regularly with the increase of the damage diameter at the excitation frequencies of 25, 40, and 60 kHz, as shown in Figure 8.
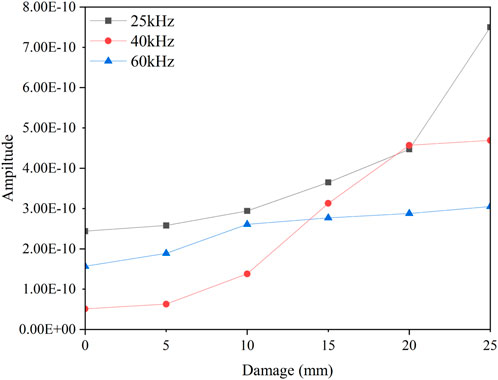
FIGURE 8. Reflection amplitude variation with damage diameter in frequency domain.
From Figure 8, the frequency domain amplitudes at all three frequencies become larger with the increase of damage diameter, and the regularly changing amplitudes are more favorable for damage discrimination. The three curves were linearly fitted using Origin software, and the corresponding fits for 25, 40, and 60 kHz were 0.79, 0.93, and 0.9, respectively. It can be concluded that the changes of reflected wave with damage diameter are more linear and regular under the excitation frequency of 40 and 60 kHz.
In Section 3 of the article, the frequency domain amplitude of the reflected wave increases with the increase of the damage diameter under the excitation frequency of 25, 40, and 60 kHz. Then, through the linear analysis of the reflected wave signal at 25, 40 and 60 kHz, and the comparison of the amplitude of the reflected wave and the direct wave, it is concluded that the excitation frequency of 60 kHz is the most suitable for damage detection. However, in Figure 8, the correlation coefficient R square of the peak signal in the frequency domain corresponding to 60 kHz after fitting is 0.9, which indicates that it has a good fitting effect, and further indicates that the relationship between the damage diameter and the peak value in the frequency domain is approximately linear. Therefore, based on this linear relationship, damage can be quantitatively identified without reference by measuring the peak value of a specific frequency in the frequency domain, and the magnitude of damage can be determined by comparing the detected data with the experimental data.
In this paper, the propagation characteristics of Lamb waves in concrete slabs are analyzed according to the relevant theories of ultrasound. Based on simulation, the damage detection of concrete plate is carried out, and the sensitivity of different excitation frequency to material damage is analyzed. Finally, quantitative identification without reference is carried out. The main conclusions are as follows:
(1) According to the simulation results, the increase of excitation frequency or propagation distance will reduce the signal amplitude, so the selection of lower frequency excitation signal is conducive to signal acquisition and damage discrimination.
(2) The Lamb wave produces a reflected wave signal upon contact with the damage. The peak value of the reflected wave signal generated by 25, 40, and 60 kHz is consistent with the damage size in the frequency domain and is more sensitive to the damage size. There is a suitable difference between the direct wave and the reflected wave amplitude of 25 and 60 kHz signals, and 60 kHz has better sensitivity, so it is more suitable as the excitation frequency for damage detection.
(3) The simulation results can be used for quantitative damage identification of signals at 25 and 60 kHz excitation frequencies without reference. The material is tested under the set excitation frequency, and the damage diameter can be obtained by comparing the detection result with the frequency domain peak value in the simulation result.
The raw data supporting the conclusion of this article will be made available by the authors, without undue reservation.
CS: Writing–review and editing. YZ: Formal Analysis, Project administration, Supervision, Writing–review and editing. LT: Conceptualization, Data curation, Methodology, Writing–original draft. WZ: Funding acquisition, Resources, Validation, Visualization, Writing–review and editing.
The authors declare financial support was received for the research, authorship, and/or publication of this article. This research was funded by the Doctoral Research Fund Project of Shandong Jianzhu University under Grant X21037Z, Shandong Province Natural Science Foundation, China, ZR2021QF118.
The authors would like to thank the editors and reviewers for their valuable suggestions for this paper.
The authors declare that the research was conducted in the absence of any commercial or financial relationships that could be construed as a potential conflict of interest.
All claims expressed in this article are solely those of the authors and do not necessarily represent those of their affiliated organizations, or those of the publisher, the editors and the reviewers. Any product that may be evaluated in this article, or claim that may be made by its manufacturer, is not guaranteed or endorsed by the publisher.
Albidah, A. S., Alqarni, A. S., Wasim, M., and Abadel, A. A. (2023). Influence of aggregate source and size on the shear behavior of high strength reinforced concrete deep beams. Case Stud. Constr. Mater. 19, e02260. doi:10.1016/j.cscm.2023.e02260
Aseem, A., and Ng, C. T. (2021). Debonding detection in rebar-reinforced concrete structures using second harmonic generation of longitudinal guided wave. NDT E Int. 122, 102496. doi:10.1016/j.ndteint.2021.102496
Bao, Y., Wan, T., Liu, Z., Bowler, J. R., and Song, J. (2021). Integral equation fast solver with truncated and degenerated kernel for computing flaw signals in eddy current non-destructive testing. NDT E Int. 124, 102544. doi:10.1016/j.ndteint.2021.102544
Berthe, J., Chaibi, S., Portemont, G., Paulmier, P., Laurin, F., and Bouvet, C. (2023). High-speed infrared thermography for in-situ damage monitoring during impact test. Compos. Struct. 314, 116934. doi:10.1016/j.compstruct.2023.116934
Cucuzza, R., Aloisio, A., Accornero, F., Marinelli, A., Bassoli, E., and Marano, G. C. (2023). Size-scale effects and modelling issues of fibre-reinforced concrete beams. Constr. Build. Mater. 392, 131727. doi:10.1016/j.conbuildmat.2023.131727
Feng, B., Pasadas, D. J., Ribeiro, A. L., and Ramos, H. G. (2019). Locating defects in anisotropic CFRP plates using ToF-based probability matrix and neural networks. IEEE Trans. Instrum. Meas. 68 (5), 1252–1260. doi:10.1109/tim.2019.2893701
Feng, B., Chen, W., Ito, S., Yusa, N., Hashizume, H., Ribeiro, A. L., et al. (2020). Quantitative evaluation of the delamination length in mechanical lap joints of high-temperature superconducting tapes using Lamb waves. Measurement 156, 107606. doi:10.1016/j.measurement.2020.107606
Feng, B., Ribeiro, A. L., Pasadas, D. J., and Ramos, H. G. (2022). Locating low velocity impacts on a composite plate using multi-frequency image fusion and artificial neural network. J. Nondestruct. Eval. 41 (2), 34. doi:10.1007/s10921-022-00865-2
Feng, B., Cheng, S., Deng, K., and Kang, Y. (2023). Localization of low-velocity impact in CFRP plate using time–frequency features of guided wave and convolutional neural network. Wave Motion 119, 103127. doi:10.1016/j.wavemoti.2023.103127
Hu, X., Ng, C.-T., and Kotousov, A. (2022). Early damage detection of metallic plates with one side exposed to water using the second harmonic generation of ultrasonic guided waves. Thin-Walled Struct. 176, 109284. doi:10.1016/j.tws.2022.109284
Hua, J., Zhang, H., Miao, Y., and Lin, J. (2022). Modified minimum variance imaging of Lamb waves for damage localization in aluminum plates and composite laminates. NDT E Int. 125, 102574. doi:10.1016/j.ndteint.2021.102574
Lamb, H. (1917). On waves in an elastic plate. Proc. R. Soc. Lond. Ser. A, Contain. Pap. a Math. Phys. character 93 (648), 114–128. doi:10.1098/rspa.1917.0008
Li, Y., Wang, K., Feng, W., Wu, H., Su, Z., and Guo, S. (2022). Insight into excitation and acquisition mechanism and mode control of Lamb waves with piezopolymer coating-based array transducers: analytical and experimental analysis. Mech. Syst. Signal Process. 178, 109330. doi:10.1016/j.ymssp.2022.109330
Liao, L., Wu, S., Hao, R., Zhou, Y., and Xie, P. (2023). The compressive strength and damage mechanisms of pervious concrete based on 2D mesoscale pore characteristics. Constr. Build. Mater. 386, 131561. doi:10.1016/j.conbuildmat.2023.131561
Lim, Y. Y., Kwong, K. Z., Liew, W. Y. H., and Soh, C. K. (2016). Non-destructive concrete strength evaluation using smart piezoelectric transducer—a comparative study. Smart Mater. Struct. 25 (8), 085021. doi:10.1088/0964-1726/25/8/085021
Lim, Y. Y., Kwong, K. Z., Liew, W. Y. H., Padilla, R. V., and Soh, C. K. (2018). Parametric study and modeling of PZT based wave propagation technique related to practical issues in monitoring of concrete curing. Constr. Build. Mater. 176, 519–530. doi:10.1016/j.conbuildmat.2018.05.074
Liu, Y., Ding, W., Zhao, P., Qin, L., and Shiotani, T. (2022). Research on in-situ corrosion process monitoring and evaluation of reinforced concrete via ultrasonic guided waves. Constr. Build. Mater. 321, 126317. doi:10.1016/j.conbuildmat.2022.126317
Mei, H., James, R., Haider, M. F., and Giurgiutiu, V. (2020). Multimode guided wave detection for various composite damage types. Appl. Sci. 10 (2), 484. doi:10.3390/app10020484
Meng, X., Feng, J., Pai, N., Zequan, H., Kaiyuan, L., Cheng, Z., et al. (2021). Effects of filler type and aging on self-sensing capacity of cement paste using eddy current-based nondestructive detection. Measurement 182, 109708. doi:10.1016/j.measurement.2021.109708
Mesnil, O., Recoquillay, A., Fisher, C., Serey, V., Sharma, S., and d’Almeida, O. (2023). Self-referenced robust guided wave based defect detection: application to woven composite parts of complex shape. Mech. Syst. Signal Process. 188, 109948. doi:10.1016/j.ymssp.2022.109948
Mićić, M., Brajović, L., Lazarević, L., and Popović, Z. (2023). Inspection of RCF rail defects – review of NDT methods. Mech. Syst. Signal Process. 182, 109568. doi:10.1016/j.ymssp.2022.109568
Mitra, A. K., Aradhye, A. A., and Joglekar, D. M. (2023). Low frequency ultrasonic guided wave propagation through honeycomb sandwich structures with non-uniform core thickness. Mech. Syst. Signal Process. 191, 110155. doi:10.1016/j.ymssp.2023.110155
Mousavi, M., and Gandomi, A. H. (2021). Wood hole-damage detection and classification via contact ultrasonic testing. Constr. Build. Mater. 307, 124999. doi:10.1016/j.conbuildmat.2021.124999
Nasir Ayaz Khan, M., Yaqub, M., and Malik, A. H. (2022). High density concrete incorporating grit scale aggregates for 4th generation nuclear power plants. Constr. Build. Mater. 337, 127578. doi:10.1016/j.conbuildmat.2022.127578
Pineda Allen, J. C., and Ng, C. T. (2023). Damage detection in composite laminates using nonlinear guided wave mixing. Compos. Struct. 311, 116805. doi:10.1016/j.compstruct.2023.116805
Rautela, M., Senthilnath, J., Monaco, E., and Gopalakrishnan, S. (2022). Delamination prediction in composite panels using unsupervised-feature learning methods with wavelet-enhanced guided wave representations. Compos. Struct. 291, 115579. doi:10.1016/j.compstruct.2022.115579
Sikdar, S., Ostachowicz, W., and Kundu, A. (2023). Deep learning for automatic assessment of breathing-debonds in stiffened composite panels using non-linear guided wave signals. Compos. Struct. 312, 116876. doi:10.1016/j.compstruct.2023.116876
Wang, S., Fu, L., Chen, X., Gong, M., Xiong, Z., and Hong, J. (2023). Characteristic analysis of cement grouted asphalt mixture cracking based on acoustic emission. Constr. Build. Mater. 375, 130927. doi:10.1016/j.conbuildmat.2023.130927
Wu, J., Xu, X., Liu, C., Deng, C., and Shao, X. (2021). Lamb wave-based damage detection of composite structures using deep convolutional neural network and continuous wavelet transform. Compos. Struct. 276, 114590. doi:10.1016/j.compstruct.2021.114590
Xiao, J., Lv, Z., Duan, Z., and Zhang, C. (2023). Pore structure characteristics, modulation and its effect on concrete properties: a review. Constr. Build. Mater. 397, 132430. doi:10.1016/j.conbuildmat.2023.132430
Xu, C., Chen, W., Hao, H., Pham, T. M., and Bi, K. (2022). Static mechanical properties and stress wave attenuation of metaconcrete subjected to impulsive loading. Eng. Struct. 263, 114382. doi:10.1016/j.engstruct.2022.114382
Yan, Y., Guo, R., Wei, Y., Pan, T., Li, X., and Tan, L. (2023). Strain-rate sensitivity analysis of the fracture behaviour of polyoxymethylene-fibre-reinforced airport-pavement concrete. Constr. Build. Mater. 402, 133048. doi:10.1016/j.conbuildmat.2023.133048
Yu, H., Lu, L., and Qiao, P. (2020). Assessment of wave modulus of elasticity of concrete with surface-bonded piezoelectric transducers. Constr. Build. Mater. 242, 118033. doi:10.1016/j.conbuildmat.2020.118033
Yu, H., Lu, L., and Qiao, P. (2021). Localization and size quantification of surface crack of concrete based on Rayleigh wave attenuation model. Constr. Build. Mater. 280, 122437. doi:10.1016/j.conbuildmat.2021.122437
Zhang, L., Cheng, X., Wu, G., and Wang, T. (2022a). Reference-free damage identification method for highway continuous girder bridges based on long-gauge fibre Bragg grating strain sensors. Measurement 195, 111064. doi:10.1016/j.measurement.2022.111064
Keywords: concrete, guided wave, Abaqus, finite element analysis, quantitative recognition
Citation: Su C, Zhang Y, Tang L and Zhang W (2023) Analysis and quantitative identification of guided wave propagation mechanism in concrete. Front. Earth Sci. 11:1298758. doi: 10.3389/feart.2023.1298758
Received: 22 September 2023; Accepted: 06 November 2023;
Published: 27 December 2023.
Edited by:
Xiaoyu Bai, Qingdao University of Technology, ChinaReviewed by:
Yaozhang Sai, Ludong University, ChinaCopyright © 2023 Su, Zhang, Tang and Zhang. This is an open-access article distributed under the terms of the Creative Commons Attribution License (CC BY). The use, distribution or reproduction in other forums is permitted, provided the original author(s) and the copyright owner(s) are credited and that the original publication in this journal is cited, in accordance with accepted academic practice. No use, distribution or reproduction is permitted which does not comply with these terms.
*Correspondence: Lin Tang, dGFuZ2xpbjIwMjRAMTYzLmNvbQ==
Disclaimer: All claims expressed in this article are solely those of the authors and do not necessarily represent those of their affiliated organizations, or those of the publisher, the editors and the reviewers. Any product that may be evaluated in this article or claim that may be made by its manufacturer is not guaranteed or endorsed by the publisher.
Research integrity at Frontiers
Learn more about the work of our research integrity team to safeguard the quality of each article we publish.