 Lei Zhang
 Hongxia Qiao1*
94% of researchers rate our articles as excellent or good
Learn more about the work of our research integrity team to safeguard the quality of each article we publish.
Find out more
ORIGINAL RESEARCH article
Front. Earth Sci., 29 December 2023
Sec. Geohazards and Georisks
Volume 11 - 2023 | https://doi.org/10.3389/feart.2023.1296842
On the basis of the highway subgrade construction of North Hobson Salt Lake mining area in Qinghai Province, the soil samples of high saline saturated sand adjacent to the salt lake were remolded, and four types of saturated sand containing 0%, 10%, 20%, and 30% salt were configured respectively, so as to explore the liquefaction effect of saline saturated sand under seismic load. After the indoor geotechnical test, the soil samples were reshaped, The liquefaction test of saline saturated sand was carried out by using the GDS dynamic triaxial device to simulate seismic load to investigate the liquefaction mechanism of saturated sand under different salt contents and verify the liquefaction discrimination standard, then based on the data of dynamic elastic modulus, dynamic shear modulus, damping ratio coefficient, and soil density obtained from previous soil tests and dynamic triaxial tests, four subgrade models with different salt contents were constructed using ANSYS simulation software according to actual engineering, and the settlement and deformation of the subgrade were analyzed by inputting EL-concrete seismic waves. The results show that the maximum value of axial stress of saturated sand decreases with the increase of salt content; the load vibration times of saline saturated sand reaching the initial liquefaction state are more than that of common saturated sand; the higher the salt content, the weaker the liquefaction resistance of saturated sand; when the pore pressure ratio coefficient reaches 1, the axial double amplitude strain εd of the soil also reaches 5%, and the soil reaches the initial liquefaction state; the area of shear stress and strain hysteresis curve increases with vibration load, and the elastic modulus decreases gradually; the shear dilation and compaction effects occur in each hysteresis cycle, and the former is greater than the latter, the research results have guiding significance for similar studies in highly saline saturated sand areas.
Saline soil is distributed throughout the world, with a total area of approximately 8.97 million km2, while the area of saline soil in China is approximately 0.2 million km2 (Ren et al., 2016; Zhang et al., 2018), which is relatively large in Asia. The geological and geomorphological conditions of saline soil regions with high salt content are relatively complex. Generally, the elevation is high, the land surface is suffused with salt all year round, the groundwater is abundant and accumulates to form lakes or salt lakes, resulting in the perennial saturated state of high-salt sand near the salt lakes (Li et al., 2020). When it exists in an active zone with high seismic intensity, the saturated sand is prone to liquefaction due to the reciprocating motion of seismic loads (Mele, 2022). Moreover, with the increase of major traffic engineering projects in salt lake or mining areas in various countries along the “the Belt and Road” in recent years, vehicle loads will also lead to the liquefaction of salt saturated sand under the reciprocating action (Rollins et al., 2022; Ni et al., 2022; Wakamatsu et al., 2017), causing serious engineering disasters such as subgrade cracking, settlement and slope collapse (Cook et al., 2021). Therefore, it is urgent to study the liquefaction characteristics of saline saturated sand. Based on the newly-built G3011 Liuyuan-Golmud Expressway, this article focuses on the construction of highway subgrades in the saline soil area of the North Hulsan Lake lacustrine plain in Qinghai Province. Samples of saturated sand with high salt content were collected and reshaped through indoor geotechnical tests, and indoor liquefaction tests and subgrade stability simulation studies were conducted on the samples. The design speed of this highway is 80 km/h, and the main line of the project is 117 km long. Some sections of the highway are adjacent to lakes, and there is a large amount of high salt saturated sand and a certain thickness of salt crust and rock salt layer underneath the subgrade. The salt content mass fraction can reach up to 35%, as shown in Figure 1. Furthermore, the region is located in a seismic intensity zone of 8°, making it an ideal area for high salt saturated sand to produce liquefaction effects. Hence, exploring the liquefaction characteristics of high salt saturated sand in this region can provide scientific guidance for railway and highway subgrade construction and underground pipeline laying in salt saturated sand regions around the world, and offer theoretical support for subsequent research on liquefaction collapse mechanisms and disaster prevention and control.
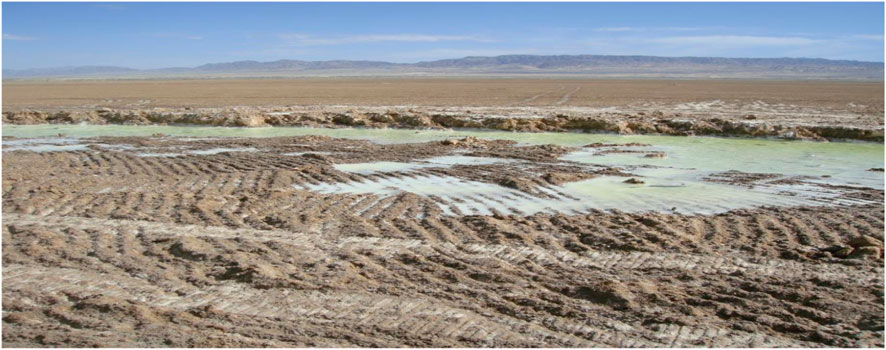
FIGURE 1. Profile of saline saturated sand area.
Back in 1968, scholar Casagrade (Casagrande, 1935) observed the shear compaction and shear dilation effects of saturated sand based on indoor shear tests of cohesionless soil. In order to explain the phenomenon of sand liquefaction, he proposed using the time-history change curve of porosity to determine the various stages of sand liquefaction. Later Seed (1979); Lirer and Mele (2019); Wang et al. (2020) pioneeringly adopted indoor dynamic triaxial tests to simulate earthquake so as to better study the liquefaction characteristics of sand, and achieved satisfying results. With the development of triaxial testing and the maturity of testing instruments, numerous scholars (Seed and Lee, 1966; Castro, 1975; Kramer and Bolton, 1988) used dynamic triaxial instruments to further study the liquefaction characteristics of saturated sand based on the research of Seed. Maslov (1959) in Balkan proposed the “dynamic failure permeability theory of saturated sand stability” and the concept of critical acceleration of sand vibration after conducting indoor sand vibration compaction experiments. Huang (1959) also pointed out through dynamic triaxial indoor tests that the actual stress conditions measured by Moslov liquefaction theory cannot reach the actual stress values. Chen et al. (2016) used a new type of conductive material and conducted experiments on saturated sand foundation based on the electrolytic desaturation method, improving the liquefaction resistance of saturated sand. Fu Haiqing and Yuan (2018) exploited a self-developed dynamic system to study the liquefaction law of saturated sand in Harbin under different load directions after sampling and reshaping. Wei et al. (2019) adopted two-dimensional discrete element numerical simulation software to investigate the influence of different factors on the macroscopic deformation law of saturated sand, and confirmed the correlation between shear deformation of saturated sand after liquefaction and sand material. Xu et al. (2019) carried out large-scale shaking table model tests to study the changes of various mechanical properties of sand liquefaction in clay layers, saturated sand layers, and dense sand layers under seismic excitation, and found that under small seismic excitation, the growth rate of excess pore pressure ratio was slow, and the closer it was to the upper layer of the soil, the more significant the dissipation of pore water pressure was.
The existing research on liquefaction tests is based on ordinary sand, silty soil, loess, and other nonspecific soil masses, while the liquefaction effect of saline saturated sand is rarely studied. Due to the particularity and complexity of saline sand, studies in recent years mainly focus on its salt expansion and settlement characteristics, while ignoring its liquefaction characteristics. Therefore, based on previous liquefaction tests and research results of various types of sand, this paper starts from different saline conditions, employs dynamic triaxial apparatus to simulate dynamic load to design indoor tests to study the liquefaction and mechanical properties of saturated sand with different salt contents.
Saturated sand usually has high water content and small pore volume. When an earthquake occurs, the tiny particles of sand in saturated soil move with the load and gradually lose the original cohesion among soil particles, resulting in the development of dense soil particles and resistance between the pore water pressure and the soil particles. The sand particles transfer the energy generated by vibration to the pore water, making the pore water pressure gradually rise. However, due to the influence of the engineering characteristics of sand, the pore water in the soil cannot be discharged quickly and timely. The pore water pressure increases gradually, which restricts the effective stress of soil movement, resulting in the gradual decrease of the effective stress among soil particles. Even when the accumulated pore water pressure is the same as the initial effective consolidation stress, the particles in the soil cannot move freely, thus the effective stress gradually approaches zero. At this time, the particles in the sand are suspended and have no capacity to bear any stress; the soil structure is destroyed, gradually transforming from elastic state to elastic-plastic state, and then losing its original bearing capacity and shear strength (Liu et al., 1993), eventually entering a liquefaction state.
According to the current Specification of Seismic Design for Highway Engineering (JTG B02-2013), the determination of whether saturated sand can be liquefied is roughly based on four aspects: geological conditions, clay content, groundwater, and upper soil layer thickness. However, when judging the liquefaction of sand, these specifications do not consider the soil layer state and the characteristics of special soils, so the liquefaction problem cannot be discussed in a reasonable and comprehensive way. For the undrained test of saline saturated sand, the liquefaction criteria are not clearly defined due to the particularity of its soil mass. Therefore, in order to accurately judge the liquefaction characteristics of saline saturated sand, the liquefaction criteria are proposed based on the liquefaction criteria of ordinary saturated sand, and the applicability and accuracy of the criteria are verified according to the dynamic triaxial test.
When the lateral pressure of soil is equal to the excess pore water pressure (that is, the standard ratio of excess pore water pressure ud/σ3=1), initial liquefaction of saline saturated sand occurs.
According to the previous criteria for strain liquefaction of saturated sand, it is specified that when two-way amplitude εd of the round-trip shear strain reaches 5%, the soil begins to liquefy.
Based on the above criteria, the initial pore pressure ud of saline saturated sand is equal to the applied confining pressure is called the initial liquefaction of saline saturated sand, but it is only one of the necessary conditions indicating the instability of the structure. Whether the soil is actually liquefied or not depends on the overall deformation degree of the soil. Therefore, two determination criteria are simultaneously used: the saline saturated sand begins to liquefy when excess pore pressure ratio ud/σ3 = 1 and the bidirectional strain amplitude (εd) reaches 5%.
According to the geological survey report and preliminary soluble salt detection test, the salt content of section DK35+820∼DK36+860 is super chlorine saline soil, with a groundwater depth of 2.1 m. The engineering geological characteristics of the test section are obvious. Hence, samples were taken from the saturated fine sand below the soil layer in this section, the salt crust layer on the surface was removed, and cutting-ring method was adopted to carry out on-site sampling with a close spacing arrangement during the rainy season in summer. From the surface downwards, samples were taken layer by layer from 0 to 0.05, 0.05–0.25, 0.25–0.5, 0.5–0.75, 0.75–1.0, 1.0–1.5, and 1.5–2.0 m. The average salt content is calculated based on depth percentages (2.5%, 10%, 12.5%, 12.5%, 12.5%, 25%, and 25%). When encountering deep saline soil, it is necessary to increase the sampling depth, and sampling was performed every 0.5 m below 1 m. The sampling depth should be controlled above the groundwater level. Indoor soil tests were conductd on the samples, and the measured soluble salt content of the soil samples is between 14.03% and 30.43%, with an optimal moisture content of 13.7%, a saturated moisture content of 24%, and a maximum dry density of 2.274 g/cm3. Particle screening tests were carried out on soil samples, and the non-uniformity coefficient Cu of undisturbed soil is 4.33.
In order to better investigate the correlation between the increase in salt content and the liquefaction effect of saturated sand, non-saline saturated sand, 10%, 20%, and 30% high-saline saturated sand were configured according to the range of soluble salt content measured by sampling. The preparation step is mainly reshaping the soil sample: removing the original soil sample from the sealed bag and conducting natural air drying for 1–2 days; grinding the air dried soil sample, passing it through a 1 mm sieve, and dividing it into two parts, each weighing 2 kg; washing one part with pure water for salt treatment, and measuring its salt content after repeated cleaning until it reaches the non-saline state (the salt content error is within 0.2%); The other part was salted according to the mass fraction of 10%, 20%, and 30% soluble salt content. As the soil sample mainly contains chloride salts, anhydrous water NaCl was added to the undisturbed soil with insufficient salt content. Finally, the soil sample was saturated to a moisture content of about 24%. After wetting for 24 h, a dynamic triaxial sample with a diameter of 39.1 mm and a height of 80 mm was made to study its liquefaction law, as shown in Figure 2.
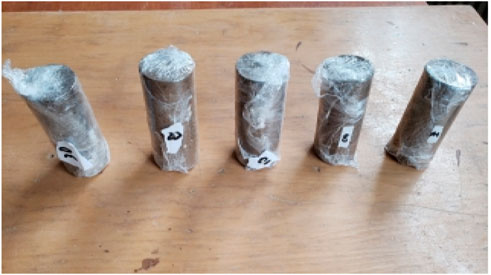
FIGURE 2. Soil samples for dynamic triaxial test.
The dynamic triaxial test instrument is mainly composed of three axes, confining chamber and data acquisition system (Lee and Albaisa, 1974; Li and Huang, 2017), as shown in Table 1. The prepared soil samples were installed on the vibration table according to the test steps, as shown in Figures 3, 4. Since the reshaped undisturbed soil sample did not reach consolidation saturation, to keep the saturation consistent with the undisturbed soil sample, the soil samples were first consolidated and saturated, so that the pore pressure coefficient B value was greater than 0.95. Then, the instrument applied confining pressure and vibration load to the soil samples according to the specified parameters, and obtained data through the computer acquisition system for processing. The principle of data processing is as follows:

TABLE 1. Parameter specifications of dynamic triaxial instrument.
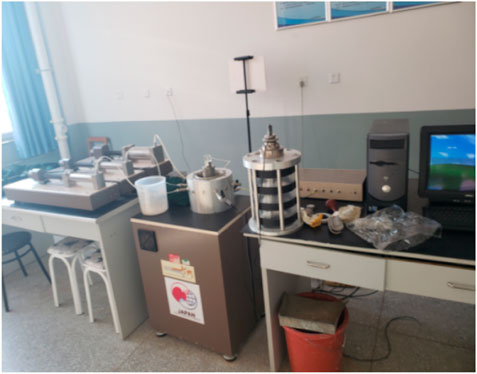
FIGURE 3. GDS dynamic triaxial apparatus.
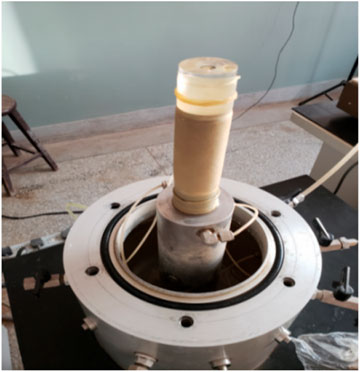
FIGURE 4. Sample installation diagram.
The back pressure index in the test refers to the change of pore water volume, and the axial stress of saturated sand is:
The effective axial stress
Axial strain
Radial strain
Where H0 represents the initial height, A denotes the current area, D0 symbolizes the current diameter, σr is the confining pressure value, µw means the pore water pressure, σa is the axial stress, σ∆ is the effective axial stress; εa is the axial strain; εr is the radial strain.
In order to better simulate the actual engineering diseases, the consolidated undrained condition is adopted in this dynamic triaxial test. Because the particles in the sand move back and forth with the vibration load, the movement among particles will generate force which is transferred to the water in the void. The undrained condition will make the water in the soil unable to be discharged in time, resulting in the accumulation of pore water pressure and the reduction of effective stress in the soil, and the energy stored in the sand is consequently released by elastic deformation. Thus, the relationship between volume strain and pore water pressure can be expressed by the volume compatibility condition, namely, the net volume change of sand structure is equal to the change of pore volume:
Where kw is the bulk modulus of pore water, Ne represents the porosity, △u denotes the increase of pore water pressure, △εvd stands for the sand soil strain,
If the volume change of pore water is ignored:
For partial drainage process, the dissipation of pore water pressure caused by pore water flow should also be considered, and the pore water pressure is:
Where kx, ky, kZ are permeability coefficients, γw is the unit weight of water,
The four groups of soil samples prepared in the early stage were set at room temperature to make the water fully integrated, and then the non-saline saturated sand and three groups of saturated sand with different salt contents were subjected to triaxial loading test. The dynamic load was based on the axial cyclic load, the Geocontrol Waveform sine wave was used to load from 0.3 kN, and the damage load of each soil sample is gradually increased by 0.2 kN each time until reaching the failure load. The final failure load and other parameters are shown in Table 2:
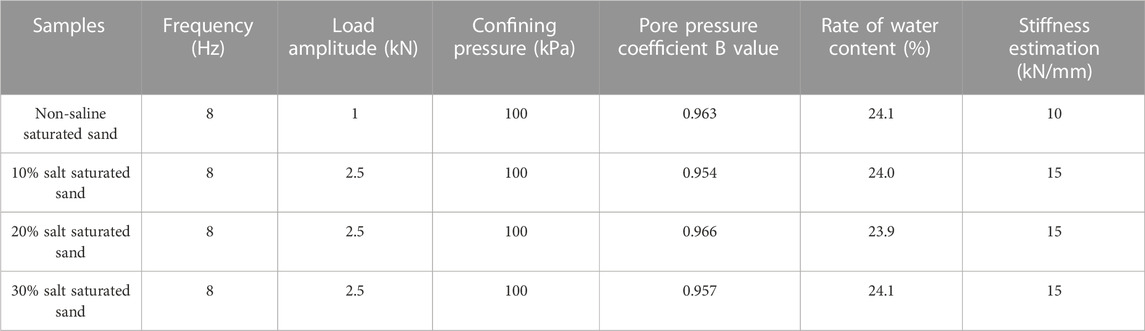
TABLE 2. Calibration of dynamic triaxial parameters of different soil samples.
It can be seen from Table 2 that the stiffness estimation and failure load of saline saturated sand are different from those of non-saline saturated sand. The stiffness estimation of non-saline saturated sand is approximately 10 kN/mm, while that of saline saturated sand with salt content ranging from 10% to 30% is greater than non-saline saturated sand. The failure load amplitude of saline saturated sand reaches 2.5 kN, 2.5 times that of non-saline saturated sand. The reason is that the strength and stiffness of the saline saturated sand have been greatly improved by the high-strength saline crystal particles formed by the combination of water and salt driven by chlorine salt in the saline saturated sand, so the liquefaction load amplitude is increased to 2.5 times of the original value.
To study the liquefaction effect of saturated sand with different salt contents, the test data were processed and analyzed. In each small deformation range, the point with the largest deformation was selected to draw the curve, and the stress-strain characteristics of saturated sand with different salt contents were analyzed and plotted in Figure 5.
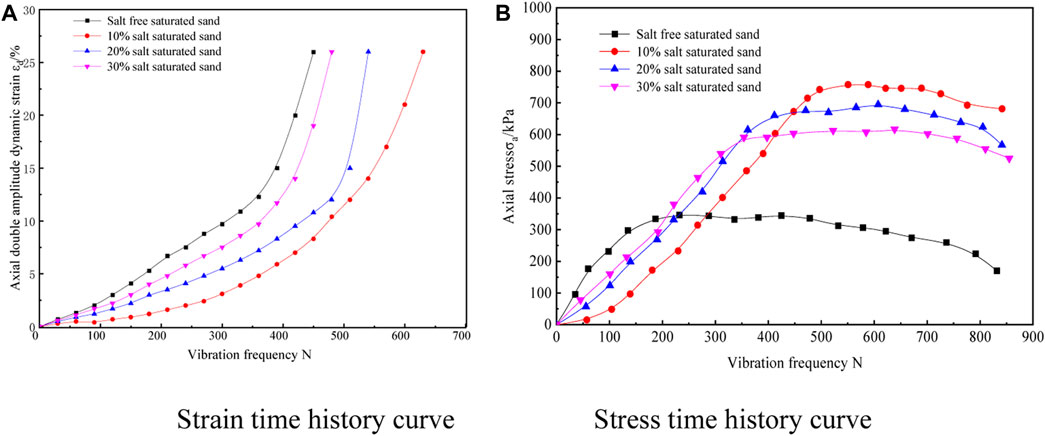
FIGURE 5. Variation curves of axial double amplitude stress and strain with load vibration times of saturated sand with different salt contents. (A) Strain time history curve. (B) Stress time history curve.
Figure 5A shows that the axial strain of the four types of sand increases with the number of times of dynamic load vibration. According to the liquefaction criteria of saturated sand, when the double-amplitude axial strain εd of the sample reaches 5%, the load vibration times of the four types of saturated sand are 200 times, 450 times, 350 times, and 300 times, respectively, while saline saturated sand requires more vibration times to achieve liquefaction. Comparing the influence of salt content, it is revealed that saturated sand with 10% salt content requires the most load vibration times to reach liquefaction, while saturated sand with 30% salt content demands the least vibration times, proving that the liquefaction resistance of the sand decreases with the increase of salt content. The reason is that the axial stress of ordinary non-saline saturated sand is relatively small when reaching liquefaction, while the combination of salt and water inside the saline saturated sand with high salt content will form salt crystals, greatly improving the strength and stiffness of the sample, thus enhancing its liquefaction resistance.
It can be observed from Figure 5B that as the number of cycles under dynamic load increases, the axial stress curve of the sample is divided into an ascending stage, a stable stage, and a failure stage. The initial stress change during the application of dynamic loads is similar to the rising stage of elasticity. Saline saturated sand with 10% salt content exhibits the longest ascending stage, and its axial stress enters a stable stage when the number of vibration reaches around 450 times, with a maximum axial stress of about 800 kPa. Whereas, the stress growth rate of non-saline saturated sand is the fastest, with a maximum axial stress of about 300 kPa. As the salt content increases, the maximum axial stress borne by the sample actually decreases, implying that the liquefaction resistance decreases with the increase of salt content. The reason is that with the increase of salt content, both liquefaction and settlement occur under the dynamic load. The degree of settlement increases with salt content, so the increase of salt content in saturated sand leads to a decrease in liquefaction resistance.
Pore pressure ratio refers to the ratio of lateral pressure of soil to excess pore water pressure (Zhang et al., 2006; Gao et al., 2010; Pan and Yang, 2018). The liquefaction criterion of ordinary saturated sand is that when the pore pressure ratio reaches 1.0, the soil reaches liquefaction. In the dynamic triaxial test, pore water pressure is an index reflecting the vibration strength and deformation law of the soil under dynamic load. According to the formula obtained in the previous stage, the ratio of the excess static pore pressure obtained from the test to the lateral pressure (confining pressure) of the soil is plotted in Figure 6 to show the relationship between the excess static pore pressure ratio and the vibration times of saturated sand with different salt contents.
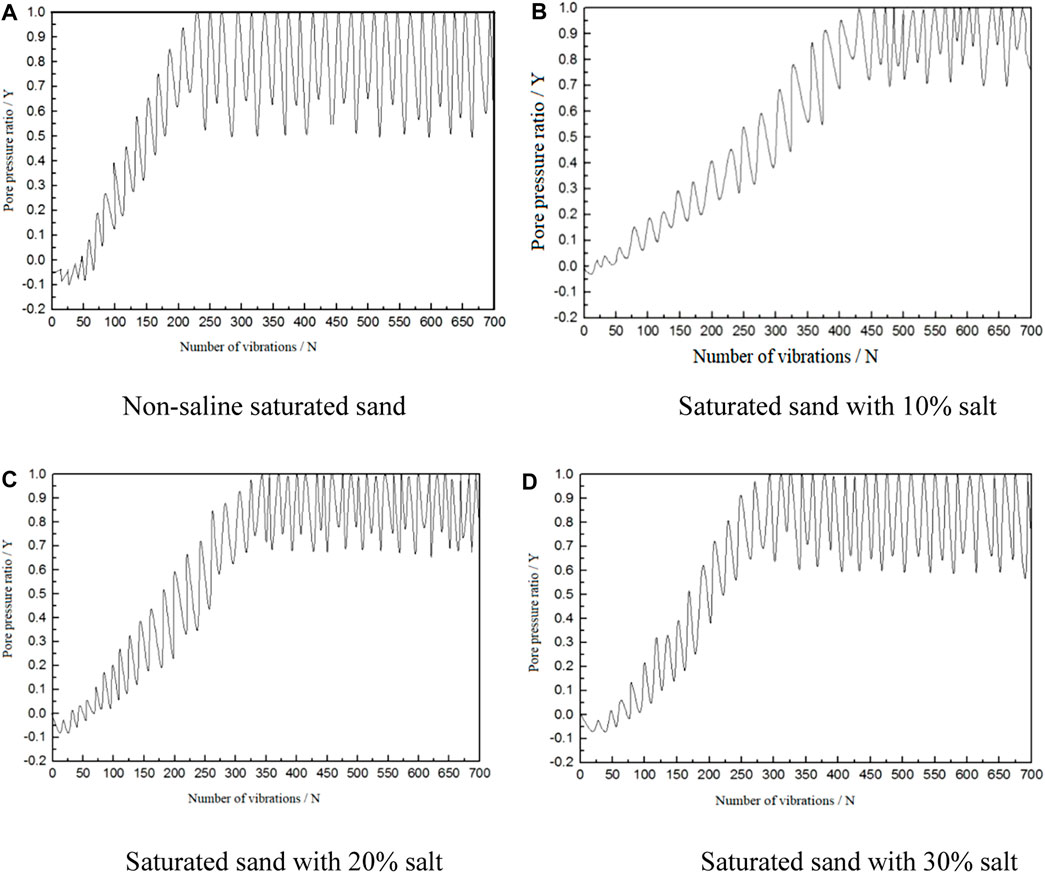
FIGURE 6. Relationship between excess pore pressure ratio and vibration times of saturated sand with different salt contents. (A) Non-saline saturated sand. (B) Saturated sand with 10% salt. (C) Saturated sand with 20% salt. (D) Saturated sand with 30% salt.
Analysis of Figures 6A–D reveals that the excess pore pressure ratio of the four samples rises with the increase of vibration times, and the variation law of pore pressure ratio in each vibration cycle is manifested as a point floating up and down, which is the result of the reciprocating action of the shaking table. The reciprocating vibration of the load causes the shear dilation and compaction effects of saturated sand, and the pore pressure in the sand will increase and dissipate with the expansion and compaction of the soil.
Analysis of four soil samples shows that the pore pressure ratio changes slightly at the initial stage of vibration. When it reaches 1, its change rate increases significantly. Compared with Figure 5, it is found that the axial double-amplitude deformation of soil mass εd also reaches 5%, proving that the saturated sand has reached the initial liquefaction. Under the reciprocating action of the vibration load, the energy generated by the soil particles in the sand and the water pressure in the pores continuously accumulates until it equals the lateral pressure of the soil, that is, when the excess pore pressure ratio y is equal to 1 for the first time, the soil particles are suspended and lose their original bearing capacity, and when the effective stress in the soil first becomes zero, the sample has reached the initial liquefaction state. The maximum number of vibrations required for 10% saline saturated sand to reach liquefaction is 450 times, while that for non-saline saturated sand is the least, which is consistent with the conclusion drawn from Figure 5, testifying that 10% saline saturated sand has stronger liquefaction resistance. However, when the salt content exceeds 10%, its liquefaction resistance gradually decreases with the increase of salt content.
According to the principle of soil mechanics, the law curves of dynamic shear stress τ and dynamic shear strain γd of soil are cumulative, hysteretic and nonlinear. Through dynamic triaxial test, the shear stress-strain hysteresis curves of the four groups of samples are shown in Figure 7:
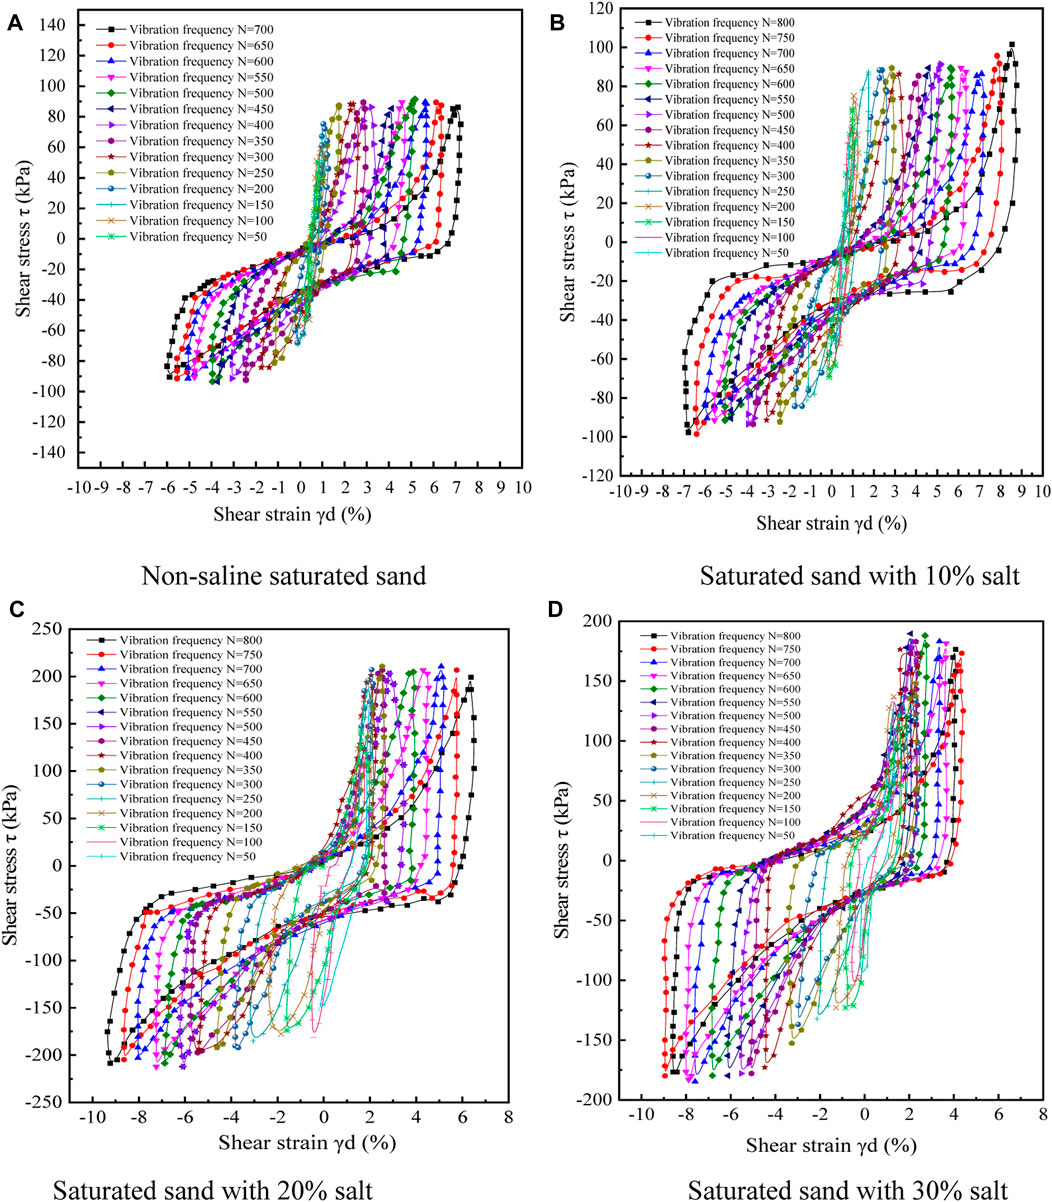
FIGURE 7. Shear stress-strain hysteresis curves of saturated sand with different salt contents. (A) Non-saline saturated sand. (B) Saturated sand with 10% salt. (C) Saturated sand with 20% salt. (D) Saturated sand with 30% salt.
It is illustrated by Figures 7A–D that at the initial stage of load vibration, the shear stress and strain vary within a small range, and the shape of hysteresis loop is tight. With the reciprocating action of dynamic load, the area of hysteresis curve gradually increases, and the shear stress-strain of soil mass also increases. Moreover, the hysteresis curve shows periodic changes in the positive and negative ranges, which is due to the shear dilation and compaction effects after the liquefaction of soil under the reciprocating vibration load. The two alternating effects makes the shear strain value γd of the sample fluctuate within the positive and negative ranges. According to the definition of elastic modulus, the slope of the line at the reverse point represents the magnitude of the shear elastic modulus. Before the soil liquefaction, the slope of the line is very large, close to 1, proving that the elastic modulus of the soil is the maximum at this time, and the deformation is still in the elastic stage. With the reduction of loading frequency, the slope of the line becomes smaller, and the elastic modulus also decreases, thus the sample cannot bear the impact of the load and starts to liquefy, during which the dynamic shear elastic modulus of the soil changes significantly, and the soil mass also transforms from elastic deformation to elastic-plastic deformation. When the soil mass reaches the initial liquefaction, plastic deformation begins and the hysteresis curve is no longer symmetrical, the shear dilation effect surpasses the shear compaction effect, the soil mass deformation increases and the strain is cumulative. This is because after the initial liquefaction, the soil mass develops towards complete liquefaction, and part of the soil mass becomes plastic, which cannot be restored under the reciprocating vibration load, resulting in a rule that the shear dilation is greater than the shear compaction in each vibration period.
Currently, the hyperbolic model proposed by Hardin and Drnevich, among others, is widely applied to express the nonlinear stress-strain relationship of soil.
(1) Hyperbolic model (H-D model)
The nonlinear stress-strain backbone curve of soil can be approximated by a hyperbolic function. Hardin and Drnevich proposed a formula for predicting the nonlinear stress-strain backbone curve of soil based on the results of cyclic simple shear tests and resonant column tests:
The attenuation curve of dynamic shear modulus of soil can be given by the following equation (H-D model):
Where λ is the damping ratio, G means the shear modulus, λmax represents the maximum damping ratio of soil, λ = λmax when G=0,
Based on the above formula, the hyperbolic model (H-D model) was selected to analyze the stress-strain hysteresis loop curve, and the curves reflecting the dynamic shear modulus Gd and damping ratio D changing with the shear strain γd are shown in Figures 8, 9.
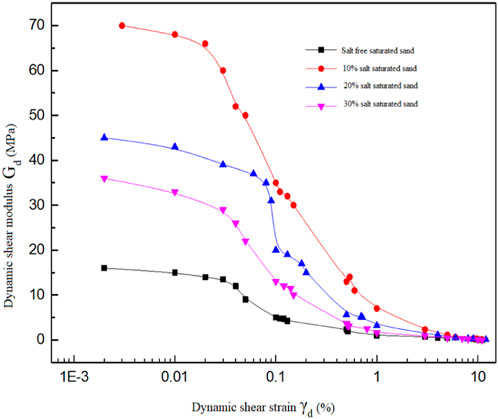
FIGURE 8. Relationship between dynamic shear modulus and dynamic shear strain of saturated sand with different salt contents.
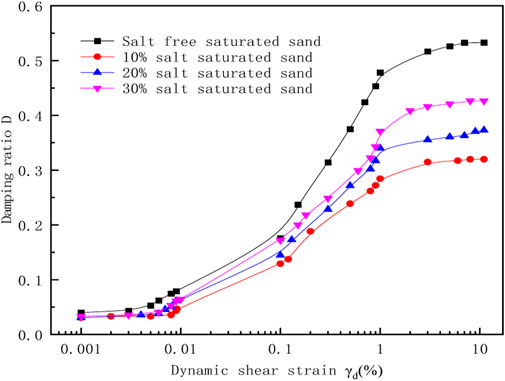
FIGURE 9. Relationship between damping ratio and dynamic shear strain of saturated sand with different salt contents.
It can be seen from Figures 8, 9 that the dynamic shear modulus of saturated sand with different salt contents decreases with the increase of the shear strain, whereas the damping ratio increases. For four types of saturated sand samples, when the dynamic shear strain is less than 0.01%, the dynamic shear modulus slowly decreases with the shear strain, and the four types of samples are basically in the elastic deformation stage. This is because the salt crystals formed by water and salt combine more fully after back pressure saturation, leading to the greater density of saline saturated sand than that of non-saline saturated sand, while the magnitude of density determines the magnitude of dynamic shear modulus. Therefore, the initial dynamic shear modulus of saline saturated sand is relatively large. When the dynamic shear strain is 0.01%–0.1%, the change of dynamic shear modulus enters a rapid attenuation zone. When the dynamic shear strain value is greater than 5%, the change trend of dynamic shear modulus gradually flattens, and its value approaches 0.
Comparing four types of soil samples, the initial value of dynamic shear modulus for saturated sand with 10% salt content reaches a maximum of 70 MPa, with a minimum damping ratio of 0.3. The initial value of shear modulus for non-saline saturated sand reaches a minimum of 15 MPa, with a maximum damping ratio of 0.55; Under the same strain, the damping ratio of non-saline saturated sand >30% salt saturated sand>20% salt saturated soil>10% salt saturated sand. This is due to the high strength of saline saturated sand and its maximum shear resistance. But as the salt content in saturated sand increases, the initial value of shear elastic modulus begins to decrease, indicating that the shear modulus of saline saturated sand is inversely proportional to the salt content. This is because the higher the salt content in the soil, the more its settlement characteristics begin to take effect under the action of moisture and vibration loads. Settlement causes the volume of the soil to increase, the density to reduce, and the shear modulus and stiffness to decrease, making it easier for stress in the soil to propagate. When the dynamic shear modulus value approaches 0, it indicates that the saturated sand has reached liquefaction, and the soil sample begins to undergo alternating shear dilation and compaction, even resulting in flow-slip deformation. The shear modulus value at this time is very small, and the soil has almost no bearing capacity. In practical engineering, it will cause inestimable severe consequences to large buildings, railway subgrades and other structures.
According to the actual construction situation of the subgrade project in the lacustrine plain area of North Hulsan Lake, the corresponding three-dimensional model is established with the aid of ANSYS. The width, slope and height of the subgrade is 8 m, 1:1.5 and 3 m, respectively. The 0.3 m salt crust layer on the ground surface is removed, and the whole project is constructed with non-saline sand. The width of the bottom layer of the subgrade bed is calculated as 17 m according to the slope ratio. The filling material below the subgrade is compacted and treated with saline saturated sand with different salt contents, with a thickness of 10 m. The subgrade slope extends 11 m to both sides, which means the calculated width of the entire subgrade model is 34 m, and the length along the longitudinal direction of the subgrade is 50 m. The structure is divided into two parts. The upper structure is a non-saline saturated sand subgrade, and the lower structure is a saline saturated sand foundation. A comparative analysis was conducted on the four types of subgrades constructed with saline saturated sand with 0%, 10%, 20% and 30% salt content.
The stress-strain curves obtained from the previous indoor soil tests and dynamic triaxial tests were used to acquire various test parameters for different soil masses, as shown in Table 3, and input them into the subgrade model. The subgrade base was constrained and applied with dynamic loads, and structural time-history dynamic response analysis was conducted. The EL-concrete three-dimensional wave was selected as the seismic load input. As the area is located in a seismic intensity zone of 8°, thus the duration of earthquake is 15 s, the time step is 0.02 s, the time loading step is 750, and the sine wave acceleration of the subgrade is input as 0.2 g. During seismic liquefaction, the maximum seismic shear wave value is considered in the dynamic calculation, and the vertical displacement of the subgrade is the key factor affecting the track regularity. Therefore, the main analysis is to simulate the lateral stress changes and vertical settlement of the subgrade under dynamic loads. (Liu et al., 2007; Sun et al., 2013; Liu et al., 2020). Assuming that the material in the model is uniform, an ideal elastic model is used for simulation, and the yield criterion satisfies the Mohr Coulomb criterion (Chan et al., 1990). It is worth noting that this simulation has its limitations, while the subgrade material cannot be uniform and ideally elastic in practical engineering, thus the relevant simulation data can only be used as a reference to analyze the stress distribution under seismic loads.
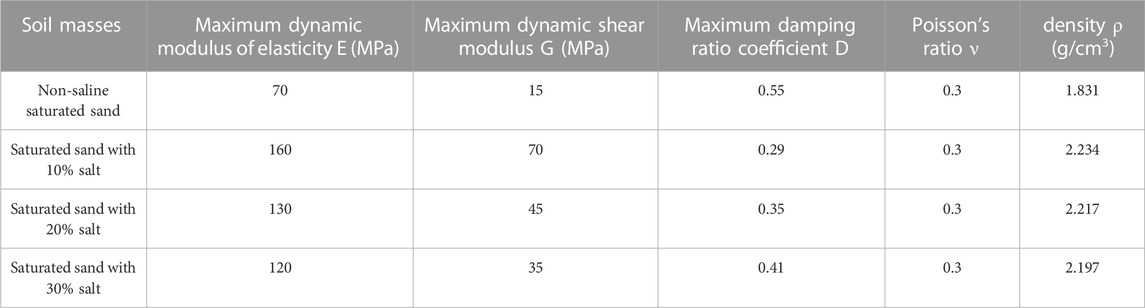
TABLE 3. Basic parameters of different soil masses.
By analyzing the vertical displacement of the subgrade under seismic loading, it is found that the maximum displacement of the subgrade is located at the contact point between the bottom layer of the subgrade and the surface layer of saturated sand. Four different subgrade models were analyzed, and the maximum vertical displacement distribution under seismic load was compared, as shown in Figure 10.
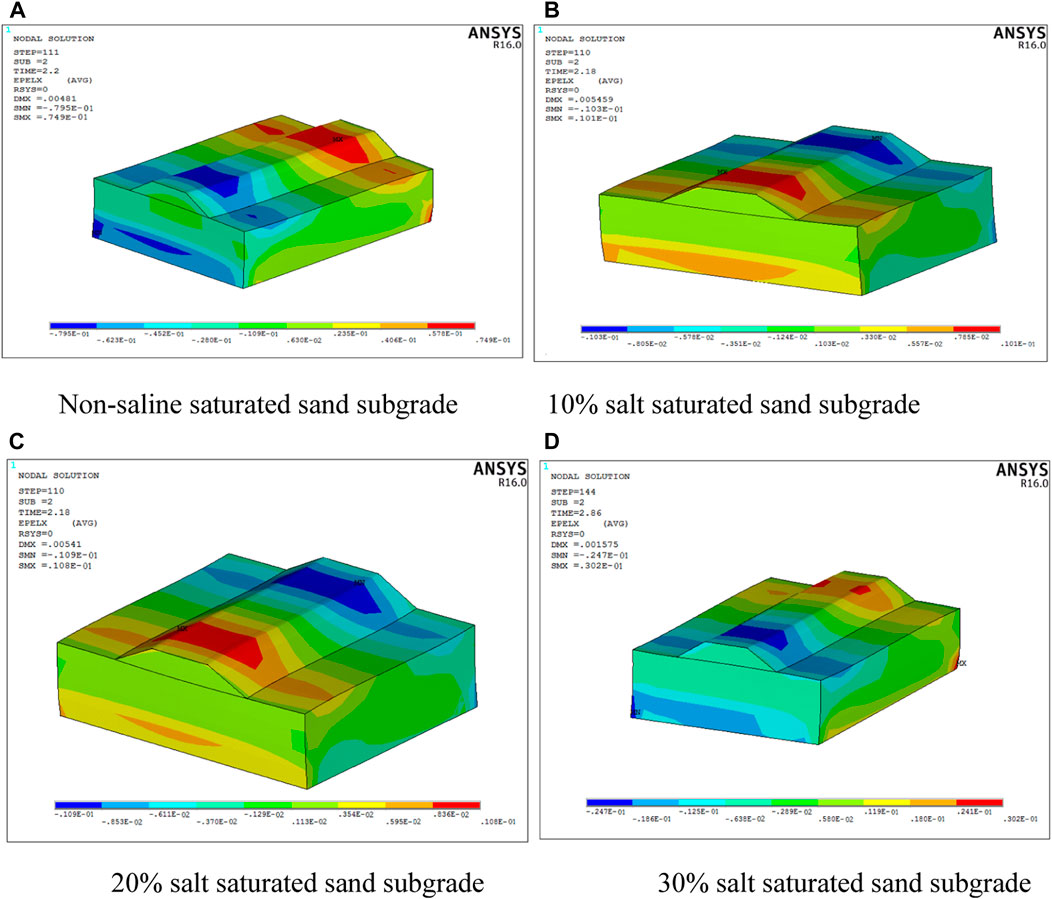
FIGURE 10. Vertical displacement distribution of saturated sand with different salt contents. (A) Non-saline saturated sand subgrade. (B) 10% salt saturated sand subgrade. (C) 20% salt saturated sand subgrade. (D) 30% salt saturated sand subgrade.
Based on the analysis of the four different subgrade models in Figures 10A–D, it is found that the maximum vertical settlement value of the non-saline saturated sand subgrade is 74.9 mm, that of the 10% salt saturated sand subgrade is 10.1 mm, 10.8 mm for 20% salt saturated sand subgrade and 30.2 mm for 30% salt saturated sand subgrade. By comparison, it is obvious that the displacement settlement of the saline saturated sand subgrade is much smaller than that of the ordinary saturated sand subgrade, indicating that saline saturated sand subgrade has better anti-seismic capacity and stronger liquefaction resistance than ordinary saturated sand. Furthermore, the post-earthquake settlement value of the subgrade gradually increases with the increase of salt content in saturated sand, indicating that the increase in salt content leads to a larger post-earthquake settlement of the subgrade, which proves that the liquefaction resistance is optimal when the salt content in sand is within a certain range, as the salt content increases, the liquefaction resistance gradually weakens.
Since the liquefaction of saturated sand mainly involves the shear dilation and compaction effects, whether the shear stress in the subgrade reaches the shear stress threshold during soil liquefaction determines whether the soil reaches liquefaction. Therefore, the X-direction stress of four subgrade models was analyzed and compared, and the point with the greatest stress variation was selected. The maximum stress change data calculated in ANSYS software is output and plotted in Figure 11.
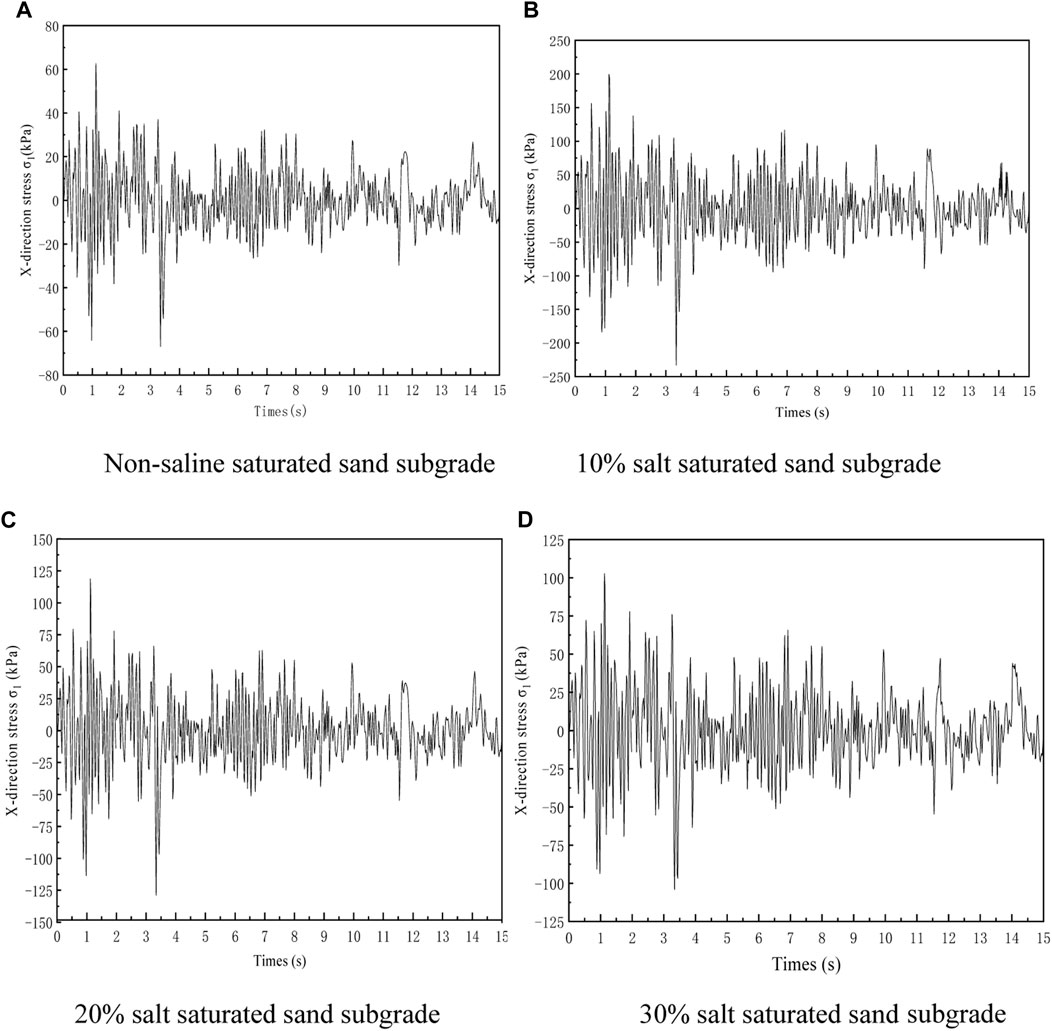
FIGURE 11. Lateral stress variation of saturated sand subgrade with different salt contents. (A) Non-saline saturated sand subgrade. (B) 10% salt saturated sand subgrade. (C) 20% salt saturated sand subgrade. (D) 30% salt saturated sand subgrade.
It can be seen from Figure 11 that the stress distribution in the X direction is a fluctuating curve, which is the result of the cyclic action of seismic loads. The maximum stress under the four subgrades is 70, 220, 130, and 110 kPa, respectively. As the duration of seismic load vibration increases, the stress and amplitude of the four curves gradually decrease, and finally approach zero. Meanwhile, as the salt content increases, the stress of the saline saturated sand subgrades gradually decreases, but is higher than that of the non-saline saturated sand subgrade. This is because the salt in saline saturated sand combines with water to form salt crystals, enhancing the stiffness of the subgrade and weakening the liquefaction effect. However, as the salt content in saline saturated sand increases, the joint effect of too much water and seismic load will lead to saline sand settlement, thus the effective stress of the subgrade gradually decreases with the increase of salt content.
Currently, there is little research considering the impact of different salt contents on the liquefaction characteristics of saline saturated sand under seismic action. Through dynamic triaxial tests, the following conclusions are drawn:
(1) By analyzing the liquefaction criteria of ordinary saturated sand, a dual criterion for the liquefaction of saline saturated sand is proposed, namely, when the standard ratio of excess pore water pressure ud/σ3=1 and bidirectional strain amplitude (εd) reaches 5%, saline saturated sand begins to liquefy.
(2) The liquefaction resistance of four types of saturated sand is 10% saline saturated sand>20% saline saturated sand>30% saline saturated sand>non-saline saturated sand, indicating that saline saturated sand has stronger liquefaction resistance, but gradually decreases as the salt content increases.
(3) When the dynamic shear strain is less than 0.01%, the dynamic shear modulus slowly decreases with the shear strain. Due to the salt crystals formed by water and salt under back pressure saturation, the four types of samples are basically in elastic deformation. When the dynamic shear strain level is 0.01%–0.1%, the change in dynamic shear modulus enters a rapid attenuation zone.
(4) As the salt content in saturated sand increases, the initial value of shear elastic modulus begins to decrease. Under the action of moisture and vibration loads, the settlement characteristics of saturated sand begin to take effect, and the stress in it is more easily propagated. The shear modulus is inversely proportional to the salt content in saturated sand.
(5) Numerical simulation analysis reveals that the displacement and settlement of saline saturated sand subgrade are much smaller than that of ordinary saturated sand subgrade, indicating that saline saturated sand subgrade has better seismic resistance. The maximum stress in the four types of subgrades cannot reach the shear stress during liquefaction, proving that after replacing soil for the subgrade, the seismic liquefaction effect is effectively reduced.
The samples used in this article are super-strong saline saturated sand from Qinghai region, China, thus the research results have guiding significance for similar studies in highly saline saturated sand areas. However, saturated sand with low and medium salt contents has not been comprehensively analyzed, thus it is hoped that in the future, scholars can start from this aspect and conduct indoor dynamic triaxial tests on weakly and moderately saline saturated soils to study their liquefaction characteristics. Meanwhile, it is suggested that in future practical engineering construction, a certain amount of insoluble salt should be added into saturated sand to increase its density and dynamic shear modulus, which can reduce engineering diseases such as foundation collapse, subgrade settlement, and slope slump caused by seismic liquefaction.
The raw data supporting the conclusion of this article will be made available by the authors, without undue reservation.
LZ: Data curation, Formal Analysis, Methodology, Resources, Writing–original draft.
The author(s) declare financial support was received for the research, authorship, and/or publication of this article. This research was supported by the National Natural Science Foundation of China (52208417) and project of Gansu Provincial Department of Transportation (No.2022-24). The experimental data are obtained by the author himself.
Authors WM and HW were employed by Gansu Provincial Highway Development Group Co., Ltd.
The remaining authors declare that the research was conducted in the absence of any commercial or financial relationships that could be construed as a potential conflict of interest.
All claims expressed in this article are solely those of the authors and do not necessarily represent those of their affiliated organizations, or those of the publisher, the editors and the reviewers. Any product that may be evaluated in this article, or claim that may be made by its manufacturer, is not guaranteed or endorsed by the publisher.
Casagrande, A., “Characteristics of cohesionless soils affecting the stability of slope and J. Bost. Soc. Eng. vol., 23, no.1, pp. 257–276. 1935.
Castro, G. (1975). Liquefaction and cyclic mobility of saturated sands. J. Geotechnical Eng. Div. 101 (6), 551–569. doi:10.1061/ajgeb6.0000173
Chan, H. C. M., Li, V., and Einstein, H. H. (1990). A hybridized displacement discontinuity and indirect boundary element method to model fracture propagation. Int. J. Fract. 45 (4), 263–282. doi:10.1007/bf00036271
Chen, Y. M., he, S., and Wu, H. Q. J. X. (2016). Shaking table test of liquefiable foundation treated by electrolytic desaturation method. Acta geotech. Eng. 38 (4), 726–733. doi:10.11779/CJGE201604018
Cook, K. L., Rekapalli, R., Dietze, M., Pilz Cesca, S., Rao, N. P., et al. (2021). Detection and potential early warning of catastrophic flow events with regional seismic networks. Science 374 (87–92), 87–92. doi:10.1126/science.abj1227
Fu Haiqing, H. Q., and Yuan, X. M. (2018). In situ liquefaction test of remolded saturated sand. J. Appl. Found. Eng. Sci. 26 (2), 403–412. doi:10.16058/j.issn.1005-0930.2018.02.017
Gao, Y. F., Zhang, J., and Shen, Y. (2010). Characteristics of pore water pressure of saturated silt under wave loading. China Ocean. Eng. 24 (1), 161–172. doi:10.1007/s13131-010-0083-2
Huang, W. X. (1959). Analysis of the structure action of multiplearch dam under lateral earthquakes. Sci. China, Ser,A. 8, 873–896+872.
Kramer, S. L., and Bolton, H. (1988). Seed, “Initiation of soil liquefaction under static loading conditions”. J. Geotechnical Eng. 114 (4), 412–413. doi:10.1061/(ASCE)0733-9410(1988)114:4(412)
Lee, K. L., and Albaisa, A. (1974). Earthquake induced settlements in saturated sands. J. Geotechnical Eng. Div. 100 (4), 387–406. doi:10.1061/ajgeb6.0000034
Li, B., and Huang, M. (2017). Dynamic triaxial experimental study on liquefaction characteristics of sand mixed with rubber powder. Rock Soil Mech. 38 (5), 1343–1348. in Chinese. doi:10.16285/j.rsm.2017.05.015
Li, R., Liu, C, Jiao, P., Liu, W., and Wang, S. (2020). The present situation, existing problems, and countermeasures for exploitation and utilization oflow-grade potash minerals in Qarhan Salt Lake, Qinghai Province, China. Carbonates Evaporites 35 (2), 34–11. doi:10.1007/s13146-020-00562-z
Lirer, S., and Mele, L. 2019, On the apparent viscosity of granular soils during liquefaction tests[J].Bull. Earthq. Eng. vol.17, no.11, pp.5809–5824. doi:10.1007/s10518-019-00706-0
Liu, G., Peng, J., Zhang, Z., Wang, Z., and Yang, Y. (2020). Numerical investigation of fluid-driven crack propagation and coalescence in granite specimen with two preexisting flaws. J. Nat. Gas Sci. Eng. 75, 103132. article 103132. doi:10.1016/j.jngse.2019.103132
Liu, X. S., Zhao, D., and Wang, W. S. (1993). Experimental study on the influence of intact structure on dynamic deformation characteristics of saturated sand. J. Hydraulic Eng. 24 (2), 32–42. doi:10.13243/j.cnki.slxb.1993.02.004
Liu, Z. Q., Lai, Y. M., Zhang, M. Y., and Zhang, X. F. (2007). Numerical analysis for random temperature fields of embankment in cold regions. Sci. China D Earth Sci. 50 (3), 404–410. doi:10.1007/s11430-007-2043-z
Mele, L. 2022, An experimental study on the apparent viscosity of sandy soils: from liquefaction triggering to pseudo-plastic behaviour of liquefied sands[J]. Acta Geotech. vol.17, no.2, pp. 463–481. doi:10.1007/s11440-021-01261-2
Ni, S. T., Chen, Y. M., Chen, R. Z., Liu, H. L., Li, C. C., and Hu, S. B. (2022). Blast liquefaction test of saturated sand foundations disposed by a drainage rigid pile. Shock Vib. 2022, 1–18. Article ID:3465290,2022. doi:10.1155/2022/3465290
Pan, K., and Yang, Z. X. (2018). Effects of initial static shear on cyclicresistance and pore pressure generation of saturated sand. Acta Geotech. 13 (2), 473–487. doi:10.1007/s11440-017-0614-5
Ren, X. L., Zhang, W., Liu, X., et al. (2016). The research development and thinking about the expansibility property of saline soil in Northwest Region. Chin. J. Soil Sci. 47 (1), 246–252. doi:10.19336/j.cnki.trtb.2016.01.038
Rollins, K. M., Hales, L. J., and Ashford, S. A. “2022, Camp, III, W.M.P-Y curves for large diameter shafts in liquefied sand from blast liquefaction tests,” in Proceedings of the seismic performance and simulation of pile foundations in liquefied and laterally spreading ground (California, United States, March2005, 11–23.
Seed, H. B. (1979). Soil Liquefaction and cyclic mobility evaluation for level ground during earthquakes. JGED 105 (2), 201–255. doi:10.1061/ajgeb6.0000768
Seed, H. B., and Lee, K. L. (1966). Liquefaction of saturated sands during cyclic loading. J. Soil Mech. Found. Div. 92 (3), 105–134. doi:10.1061/jsfeaq.0000913
Sun, Z. Z., Ma, W., Dang, H. M., et al. (2013). Characteristics and causes of embankment deformation for Qinghai-Tibet Railway in permafrost regions. Rock Soil Mech. 34 (9), 2667—2671. doi:10.16285/j.rsm.2013.09.036
Wakamatsu, K., Senna, S., and Ozawa, K. (2017). Liquefaction and its Characteristics during the 2016 Kumamoto Earthquake. J. Jaee 17 (4), 81–100. doi:10.5610/jaee.17.4_81
Wang, Z., Ma, J., Gao, H., Stuedlein, A. W., He, J., and Wang, B. (2020). Unified thixotropic fluid model for soil liquefaction. J. Geotech. 70 (10), 849–862. doi:10.1680/jgeot.17.p.300
Wei, X., Zhao, Z., Gang, G., and Zhang, J. M. (2019). Discrete element analysis of large deformation mechanism of saturated sand after liquefaction. Geotech. Mech. 40 (4), 1596–1602. + 1625. doi:10.16285/j.rsm.2017.2323
Xu, C. S., Doui, P. F., Du, X. L., Chen, S., and Han, J. Y. (2019). Large scale shaking table model test analysis of seismic response of liquefaction free field. Geotech. Mech. 40 (10), 3767–3777. doi:10.16285/j.rsm.2018.1339
Zhang, J., Cui, S. Y., Feng, Z. X., et al. (2018). Climate factors and mulching affect soil salinity dynamics in coastal areas L. Chin. J. Eco-Agriculture 26 (2), 294–302. doi:10.13930/j.cnki.cjea.170572
Keywords: salt content, saturated sand, seismic liquefaction, dynamic triaxial, roadbed simulation
Citation: Zhang L, Qiao H, Shi H, Ma W, Song S and Wang H (2023) Liquefaction test and seismic load simulation of saturated sand subgrade with different salt contents. Front. Earth Sci. 11:1296842. doi: 10.3389/feart.2023.1296842
Received: 19 September 2023; Accepted: 02 November 2023;
Published: 29 December 2023.
Edited by:
Manoj Khandelwal, Federation University Australia, AustraliaReviewed by:
Kun Fang, China University of Geosciences Wuhan, ChinaCopyright © 2023 Zhang, Qiao, Shi, Ma, Song and Wang. This is an open-access article distributed under the terms of the Creative Commons Attribution License (CC BY). The use, distribution or reproduction in other forums is permitted, provided the original author(s) and the copyright owner(s) are credited and that the original publication in this journal is cited, in accordance with accepted academic practice. No use, distribution or reproduction is permitted which does not comply with these terms.
*Correspondence: Hongxia Qiao, emwxODIxNTE1OTQ5MUAxNjMuY29t
Disclaimer: All claims expressed in this article are solely those of the authors and do not necessarily represent those of their affiliated organizations, or those of the publisher, the editors and the reviewers. Any product that may be evaluated in this article or claim that may be made by its manufacturer is not guaranteed or endorsed by the publisher.
Research integrity at Frontiers
Learn more about the work of our research integrity team to safeguard the quality of each article we publish.