
95% of researchers rate our articles as excellent or good
Learn more about the work of our research integrity team to safeguard the quality of each article we publish.
Find out more
ORIGINAL RESEARCH article
Front. Earth Sci. , 12 January 2024
Sec. Solid Earth Geophysics
Volume 11 - 2023 | https://doi.org/10.3389/feart.2023.1295213
This article is part of the Research Topic Advanced Methods for Interpreting Geological and Geophysical Data View all 36 articles
 Musaab A. A. Mohammed1,2*
 Ahmed Mohamed3*Norbert P. Szabó1,4Saad S. Alarifi5Ahmed Abdelrady6*Joseph Omeiza Alao7Péter Szűcs1,4
The recent research aims to investigate the petrophysical and hydrogeological parameters of the Nubian aquifer system (NAS) in Northern Khartoum State, Sudan, using integrated geophysical methods, including surface electrical resistivity and geophysical well-logging. The Nubian aquifer is a transboundary regional aquifer that covers vast areas in Sudan, Egypt, Libya and Chad. The well-logs, including self-potential (SP), natural gamma ray (GR), and long normal resistivity (RS), are integrated with Vertical Electrical Sounding (VES) measurements to delineate the hydrostratigraphical units. As a result, two aquifers are detected. An upper aquifer comprises coarse sand with an average thickness of 50 m and a lower aquifer of sandstone with more than 200 m thickness. For a thorough evaluation of the aquifers, in the first stage, the petrophysical and hydrogeological parameters, including formation factor, total and effective porosity, shale volume, hydraulic conductivity, and transmissivity, are measured solely from geophysical well-logs. In the second step, the results of geophysical well logs are combined with VES and pumping test data to detect the spatial variation of the measured parameters over the study area. As a result, the hydraulic conductivity of the Nubian aquifers ranged from 1.9 to 7.8 m/day, while the transmissivity varied between 120 and 733 m2/day. These results indicated that the potentiality of the Nubian formation is high; however, in some regions, due to the sediment heterogeneity, the aquifers have intermediate to high potential. According to the obtained results, it can be concluded that the Nubian Aquifer in Khartoum state is ideal for groundwater development. This research discovered that geophysical approaches can be used to characterize moderately heterogeneous groundwater systems by comparing the Nubian aquifer with similar aquifer systems that have similar hydrogeological settings. This study emphasized the application of universal principles in extrapolating hydraulic parameters in hydrogeophysical surveys. This approach aims to reduce the costs and efforts associated with traditional hydrogeological approaches.
The escalation of water investigation research is attributed to its growing significance in shaping developmental strategies across various domains, including industry and agriculture (Aliou et al., 2022; Zhou et al., 2022; Liu et al., 2023). The rapid population growth has led to the evolution of groundwater exploration methodologies for the characterization of local and regional aquifer systems (Adagunodo et al., 2018; Rabeh et al., 2019). Characterizing transboundary regional aquifers is a complex task in hydrogeological research to comprehend and effectively manage shared groundwater resources (Puri and Aureli, 2005; Sindico et al., 2018; Yin H. et al., 2023; Yuan et al., 2023). This distinctive problem requires extensive cross-border investigations to identify subsurface structures, lithological variations (Tie et al., 2023), and hydrogeological features (Nijsten et al., 2018). The Nubian Aquifer System (NAS) is a significant transboundary aquifer that serves as a crucial groundwater reservoir. It covers the dry areas of Egypt, Libya, Chad, and Sudan, making it one of the largest in the world (Sultan Araffa et al., 2009; Mohamed et al., 2017; Mohamed, 2019; Mohammed et al., 2023c). The aquifers in question are of great importance in maintaining water resources and supporting the lifestyles of people in the nations mentioned (Voss and Soliman, 2014). The significance of the NAS resides in its transboundary nature, highlighting the necessity for accurate evaluation of its attributes to ensure the sustainable exploitation of groundwater.
Petrophysical and hydraulic parameters of groundwater aquifers are crucial elements that must be considered for managing groundwater extraction (Yusuf and Abiye, 2019; Ugbaja et al., 2021; Abbas et al., 2022; Römhild et al., 2022; Yin L. et al., 2023). The evaluation of these parameters is essential for enhancing the accuracy of hydraulic stress prediction (Szűcs et al., 2013; Amiri et al., 2022; Zhu et al., 2022). Furthermore, it gives dependable data inputs for simulating groundwater flow and contaminant transport (Mathon et al., 2008; Khadri and Pande, 2016; Amiri et al., 2022). The ideal manner for estimating the hydraulic and petrophysical parameters is by taking core samples from groundwater aquifers during well drilling (Szabó et al., 2015; Khalil et al., 2022; Li et al., 2023; Sang et al., 2023; Yuan et al., 2023). Another approach is pumping tests, which depend on a series of assumptions that occasionally may not be valid (De Clercq et al., 2020; Römhild et al., 2022). It assumes that the aquifer is homogenous, isotropic, and has an infinite extent and neglects groundwater storage during the test (Misstear, 2001). Moreover, in heterogeneous aquifer systems, the estimation of these parameters is restricted to the measurement point; therefore, error is inevitable during the generalization of the results (Avci et al., 2010; Mohammed et al., 2023c; Flores et al., 2023; Yang et al., 2023). To address these drawbacks, geophysical methods are widely applied for groundwater exploration and aquifer characterization since they provide a continuous estimate of hydrogeological and petrophysical parameters (Szabó et al., 2015; Fejes et al., 2021; Mohammed et al., 2023e). The primary purpose of open-hole wireline logging is to identify variations in petrophysical and hydrogeological parameters along groundwater wells and correlate them with the surrounding wellbores (Szabó, 2018; Gouasmia et al., 2022; Mohammed et al., 2023a). Non-focused resistivity tools are often suited for hydrogeological problems (Szabó, 2015). (Ebong et al., 2014; Madun et al., 2018; Oudeika et al., 2021; Alao et al., 2022; Mohamed et al., 2022; Mohamed et al., 2023a; Taha et al., 2021). These methods are typically implemented in exploratory studies to install groundwater wells (Hezzi et al., 2021). VES is the most popular resistivity technique for defining potential groundwater zones and calculating hydraulic parameters such as transmissivity and hydraulic conductivity (Arétouyap et al., 2019; Mohammed et al., 2023e; Omeiza et al., 2023). This technique was efficiently used to quickly and affordably determine the depth of the water table, aquifer thickness, and vertical and horizontal geological variation (Szűcs et al., 2021).
Due to urbanization and population growth in Khartoum State, a severe freshwater supply shortage has been faced. As a result, the Water resources agencies are currently focusing on improving groundwater reserves to cover the water supply deficit (Li et al., 2023; Wu et al., 2023; Yin et al., 2023). Several works have been conducted to evaluate the hydraulic parameters of the Nubian aquifer (Elkrail et al., 2004; Abdalla, 2009; Algafar et al., 2011; Mohamed et al., 2023a); nevertheless, these studies rely solely on pumping test analysis. The main objective of the present study is to investigate the potentiality of the transboundary Nubian Aquifer System (NAS) and ascertain its petrophysical and hydrogeological characteristics through the integration of surface and subsurface geophysical techniques. The NAS can be used as a framework for comprehending the hydrogeological dynamics of aquifers that span across multiple borders. The recent study aims to examine the characteristics of the NAS and establish general guidelines that may be utilized to evaluate shared aquifer systems globally. The implemented approach will function as a valuable tool for assessing analogous aquifers with similar hydrogeological conditions.
The study area is part of the Khartoum sub-basin, which is located in the Northern periphery of the Nile rift basin and covers more than 288 km2 (Figure 1B). The region has a semi-arid to arid climate, with temperatures exceeding 40°C from May to September (Mohammed et al., 2023b). The rainy season, however, is limited to the remaining few weeks of summer. Khartoum state is a component of the Pan-African series that supervised the genesis of various rock units and geological structures. The Pan-African Basement Complex limits the Khartoum sub-basin to the Northeast and Southwest and confines its bottom boundary at a depth of more than 500 m (Köhnke et al., 2017). Figure 1C shows the geological map of the study area. The Northern Khartoum state is in a transition zone between the basement igneous complex to the North and the sedimentary basin to the South (Zeinelabdein and Elsheikh, 2014). The main geological units in the study area are the Precambrian basement rocks, Cretaceous Nubian Formation, and recent deposits. The basement complex consists of gneisses, schists, and granites, and the depth varies between zero, mainly to the North and Eastern sides of the area, and reaches up to 500 m in the Southern parts (Hussein and Awad, 2006). The Cretaceous Nubian formation consists of conglomerates, sandstone, and mudstone intruded by basaltic volcanic rocks that overlie the Precambrian basement rocks (Schrank and Awad, 1990). The recent deposits in the study area include windblown and alluvium wadi deposits, and the lithology comprises sand, gravel, and silt of depths ranging from 3 up to 15 m (Haggaz and Kheirallah, 1988).
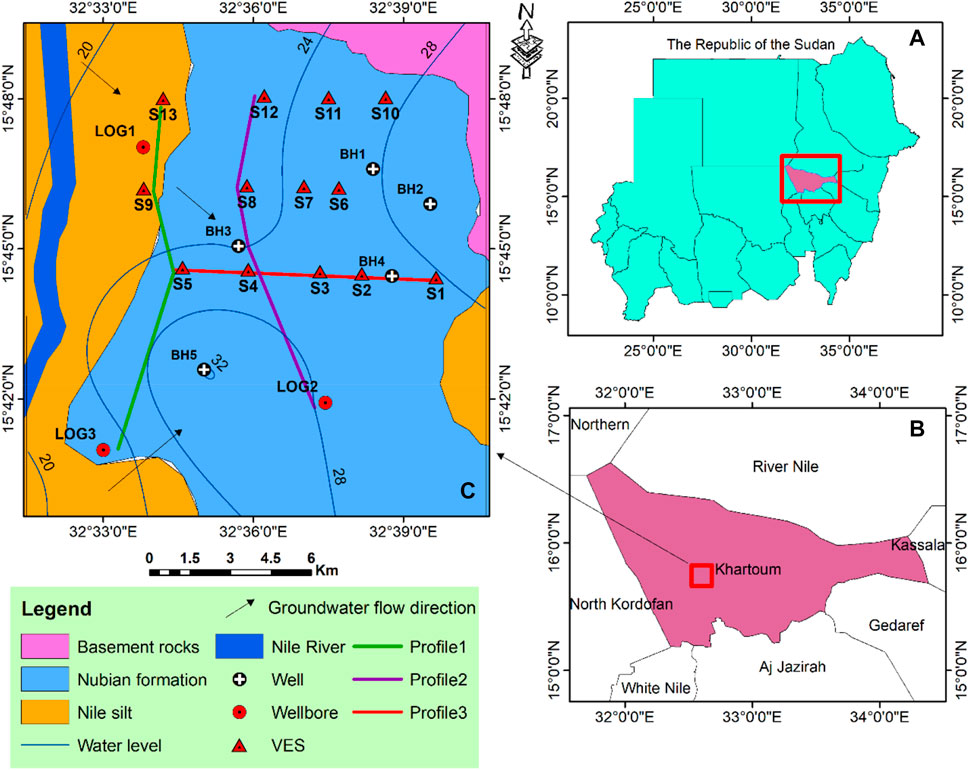
FIGURE 1. (A) Geography of the Republic of the Sudan. (B) Map of the Khartoum state showing the location of the study area. (C) The lithological (Hussein and Awad, 2006) and piezometric map of the study area.
The Nubian aquifer is a transboundary system that covers 2.2*106 km2 distributed in Sudan, Libya, Tchad, and Egypt (Mohamed et al., 2023). The Nubian aquifer is the primary groundwater supply source in the Khartoum basin that covers more than 30% of the landmass of Sudan. Groundwater occurs in the unconsolidated sand and weakly cemented sandstone beds of the Nubian formation under leaky confined to non-leaky confined conditions (Mohammed et al., 2023f). This condition is due to thin to relatively thick aquitards and aquicludes composed of silts and clays (Abdelsalam et al., 2016). The thickness of the Nubian aquifer varied between 10 m to more than 450 m (Algafar et al., 2011). The groundwater levels in the Nubian aquifer vary between 19 and 32 m. The water table is close to the surface in the Western part near the Nile River, and the depth of the water level reaches its maximum in the Eastern regions. Consequently, the general direction of groundwater flow is from the Eastern to the Western part of the study area (Figure 1C). Nilotic and meteoric waters are the two primary types of recharged water that can be distinguished in the study region (Farah et al., 2000). Nilotic groundwater leaked from the Nile River to the groundwater aquifer (Mohamed et al., 2023), and meteoric groundwater in areas outside the influence of the Nile River due to the water infiltration from wadies and ephemeral streams (Farah et al., 2000; Mohammed et al., 2023d).
In this research, an innovative approach that integrates surface geophysics, well logging, and hydrogeological data is followed to explore the geometry, petrophysical, and hydrogeological parameters of the Nubian aquifer system. The workflow of the study is illustrated in Figure 2, and the description of the applied methods is indicated in the following subsections.
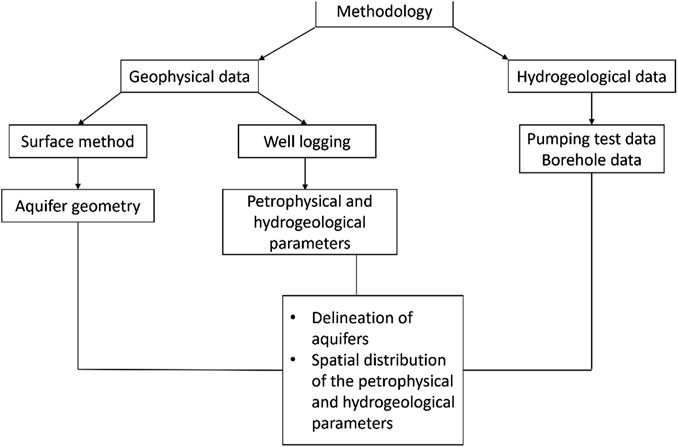
FIGURE 2. The workflow of the study that involves the integration of geophysical and hydrogeological data.
Electrical resistivity method employing vertical electrical sounding (VES) using Schlumberger array. The measurements were taken using SAS 100 resistivity meter. The electrical (ΔV) is measured using potential electrodes (MN) because of current (I) injection into the subsurface using current electrodes (AB). This potential difference measurement provides information about the apparent electrical resistivity with depth. In the Schlumberger configuration, the current and potential electrode are placed close together with the measurement point at the center of the array. These electrodes are symmetrically arranged along a profile, with outward increasing distances of electrode spacing from the central point (Omeiza et al., 2023). This arrangement allows for a wide range of electrode spacings. In this study, the maximum current electrode spacing reached 750 m and 200 m for the potential electrodes. Schlumberger protocol offers flexibility in electrode spacing, making it suitable for a wide range of subsurface investigations as it allows for better coverage and depth penetration compared to the other configurations, such as Wenner and dipole-dipole.
The apparent resistivity (ρa) is acquired by multiplying the resistance of geological formation (R) by the Schlumberger configuration factor (K). Eqs 1, 2 are frequently used to measure ρa as
IPI2WIN software is used to analyze the apparent resistivity to determine the layer properties, including resistivity and thickness (Bobachev, 2002). The actual curve of the recorded apparent resistivities is matched to the synthesized curves, and the model performance criteria determined the resulting model’s validity. Like other potential field methods, the electrical method is deterred by the problem of ambiguity. To address this issue and ensure a realistic evaluation of the geophysical model, priori information about the studied area must be gathered. This study uses parametric wells to validate the resulting geoelectrical models. Eight lithological logs obtained from boreholes drilled for groundwater exploitation at a depth range from 100 to 270 m are employed. The geological samples were taken in these logs at a depth interval of 1 m.
The geophysical well-logging data employed in this investigation has been sourced from the Khartoum State Water Corporation (KSWC) and was initially acquired in physical, hard-copy format. Subsequently, the data was digitized to conform to the requisite standard format using Didger software (Geosoft). The data was collected in October 2018 as part of the Zero Thirsty project. The Sudanese government supervised this project to sustain the water supply in Sudan. In this research, spontaneous potential (SP), natural gamma ray (GR), and long normal resistivity (RS) logs were used.
The petrophysical and hydrogeological parameters are estimated based on the geophysical logging data, namely, GR and RS logs. The estimated parameters are the formation factor, total and effective porosity, shale volume, and hydraulic conductivity. The concept of formation factor (F) has been demonstrated through empirical tests (Archie, 1942). It is defined as the ratio between the resistivity of the clean and saturated aquifer (R0) and the resistivity of the pore water (Rw) (Eq. 3). In this study, Rw is obtained from hydrochemical analysis of the groundwater samples.
The higher the porosity (φ) of a formation, the smaller its resistivity and formation factor for a particular aquifer saturated with brine. As a result, porosity and the formation factor are mutually contradictory. Additionally, it depends on the distribution of pore sizes and pore structure. Archie (1942) suggested a formula between porosity and formation factor (Eq. 4). The main disadvantage of this formula is that it is highly sensitive to the presence of shale; as a result, it gives an overestimated value of porosity. However, it is useful in sandy formations with low shale content.
Formation porosity is the percentage of the pores volume to the total volume of rocks. Geological formations may exhibit a wide range of porosities. Porosity can range from almost zero in hard rocks to 60% or more in shales and clays. For accurate estimation of porosity, zone parameters, including cementation exponent (m) and tortuosity factor (a), are evaluated. Total porosity (φt) includes all the pores, while effective porosity (φe) is the proportion of the interconnected pores to the total volume of rock, excluding the shale volume (Vsh). In this study, the effective porosity is calculated using (Eq. 5) proposed by Schlumberger (1991).
Estimation of shale volume is necessary as it affects most of the petrophysical parameters, such as total and effective porosity. In this research, Vsh is estimated following a non-linear relationship proposed by Larionov (1969) (Eq. 6). It is an empirical formula suggested to reduce the over-estimation of Vsh based on gamma-ray index (Iγ) of the geological formation.
The Iγ is calculated following a linear formulation (Eq. 7) proposed by Schlumberger (1984) between the natural gamma-ray reading of the point of measurement (GRlog), gamma-ray reading for clean sand (GRmin), and shaly layers (GRmax).
The hydraulic conductivity is estimated to evaluate groundwater aquifer productivity. In this study, hydraulic conductivity (K) is measured based on an empirical relationship using the resistivity of the water-bearing formation (Raq) (Eq. 8) suggested by Heigold et al. (1979).
Pumping tests are regulated field investigations intended to gather data on groundwater yield and hydraulic parameters. Pumping test data for five groundwater wells is evaluated to determine the hydraulic parameters of the aquifers, including transmissivity (T), storativity (S), and hydraulic conductivity (K). In this study, the measured hydraulic parameters obtained from geophysical Well logging are validated with those of the pumping test to ensure the uniqueness of the geophysics-based method. The test duration varied between 100 and 300 min, and T, S, and K are estimated using Cooper Jr and Jacob (1946), and it is designed for leaky confined aquifers under transient flow conditions. This method operates by fitting a straight line in a time plot since the pumping started against its corresponding drawdown in a semi-logarithmic paper. The slope of the line in one logarithmic cycle is measured to give the average drawdown (∆s) and transmissivity (Eq. 9).
Since hydraulic conductivity describes the rate of flow in the unit width of the aquifer and transmissivity defines the rate of flow in the full width (b) of the aquifer, Eq. 10 is used for the determination of K.
The estimated T, the well radius (r), and the intercept of the Cooper-Jacob straight line (t0) are then used to measure the storativity (S) of the aquifer. It is defined as a volume of water that can be released for storage per unit surface area of the aquifer per unit change in hydraulic gradient (Pongmanda and Suprapti, 2020). The S is dimensionless, and by using Cooper Jr and Jacob (1946) assumptions, it can be calculated using Eq. 11
The results of well-logging are shown in Figures 3–5. LOG 1 (Figure 3) of a total depth of 133 m combined with the lithology description of the borehole shows that the top of the study area is made up of superficial deposits of a thickness of 10 m. The second layer is indicated by GR and RS logs since it shows low resistivity and high gamma radiation. This layer of 25 m thickness is described as a clay layer. The clay layer is followed by a saturated sand layer of 35 m thickness. The sand layer is likely to be the upper aquifer of the study area. A mudstone layer is observed from a 70–95 m depth. This layer is followed by a relatively high resistivity saturated sandstone layer of thickness range from 95 to 133 m. This layer is probably the primary aquifer in the study area.

FIGURE 3. Borehole logs of LOG 1 location and its correspondent lithology. SP is the spontaneous potential, GR is the natural gamma ray, and RS is the deep resistivity log.
LOG 2 is located in the southern part of the study area and is connected to a total depth of 220 m (Figure 4). According to this log, the topsoil of 10 m thickness is followed by a low resistivity layer with thickness of 25 m. This layer is described as a clay layer. The third layer is made up of sand and extends from 30 to 55 m. This layer is separated from the sandstone aquifer with a mudstone layer of 20 m thickness. The primary sandstone aquifer lies over a highly resistive layer of silicified sandstone.
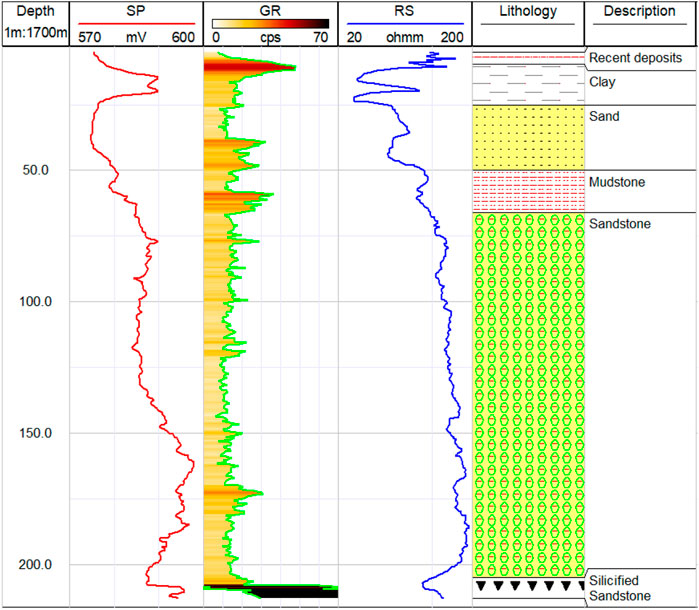
FIGURE 4. Borehole logs of LOG 2 location and its correspondent lithology. SP is the spontaneous potential, GR is the natural gamma ray, and RS is the deep resistivity log.
LOG 3, with a total depth of 270 m, is situated in the southeastern part of the study area and is illustrated in Figure 5. It revealed that the superficial deposits composed of sand and silt of thickness of 7 m are the region’s top layer, followed by a clay layer of 35 m thickness. The sand layer, with a thickness of 40 m, lies below the clay layer. As suggested by GR and RS logs, the sand layer is likely to be a secondary aquifer in the study area. This layer is followed by a mudstone layer of 10 m thickness. In LOG 3, an exchange between mudstone and sandstone is observed from a depth of 60–170 m. All these layers rest over a relatively high resistivity layer of thickness of more than 100 m. This layer is interpreted as saturated sandstone and described as the primary groundwater aquifer in the study area.
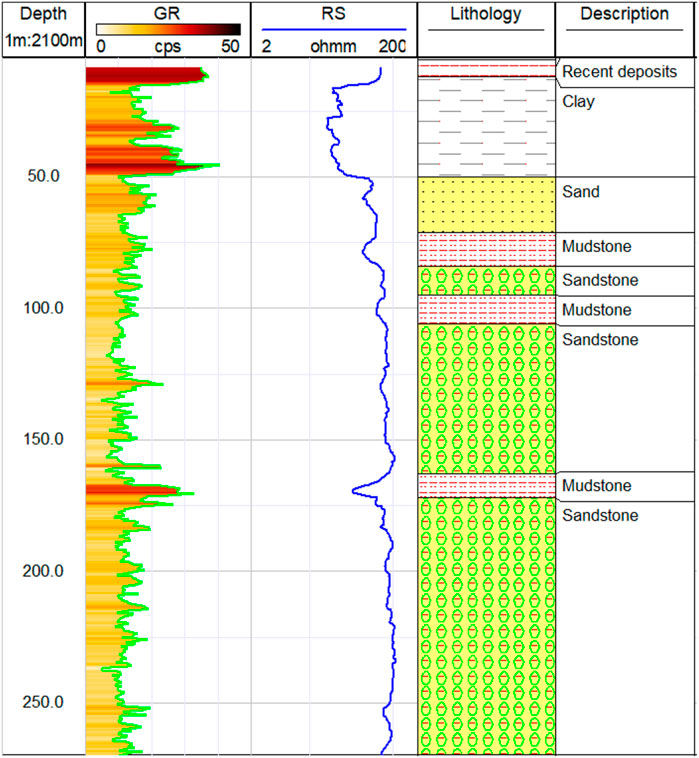
FIGURE 5. Borehole logs of LOG 3 location and its correspondent lithology. GR is the natural gamma ray, and RS is the deep resistivity log.
The vertical electrical sounding (VES) technique is employed to extrapolate the result obtained from geophysical well-logging. The resulting electrical curves obtained from the 1D least damped square inversion of the VES measurement are illustrated in Figure 6. Most VES stations revealed that the area mainly comprises 4 to 5 geoelectrical layers. The top layer of average resistivity (ρ) and thickness of 160 Ωm and 6 m, respectively, are correlated to the superficial deposits indicated by well-logging methods. The second layer is associated with resistivity ranging between 8.5 and 28 Ωm and thickness range between 14.7 and 48.3 m. This layer is interpreted as clay. The third layer of average resistivity of 120 Ωm is indicated as saturated sand of average thickness of 60 m. The fourth layer, which correlated to mudstone of an average thickness of 30 m, disappeared in some VES stations, such as S11 and S12. The bottom layer of resistivity ranges from 120 to 292 Ωm is interpreted as saturated sandstone. From the high resistivity values of this aquifer, it can be deduced that the pore water is of low salinity.
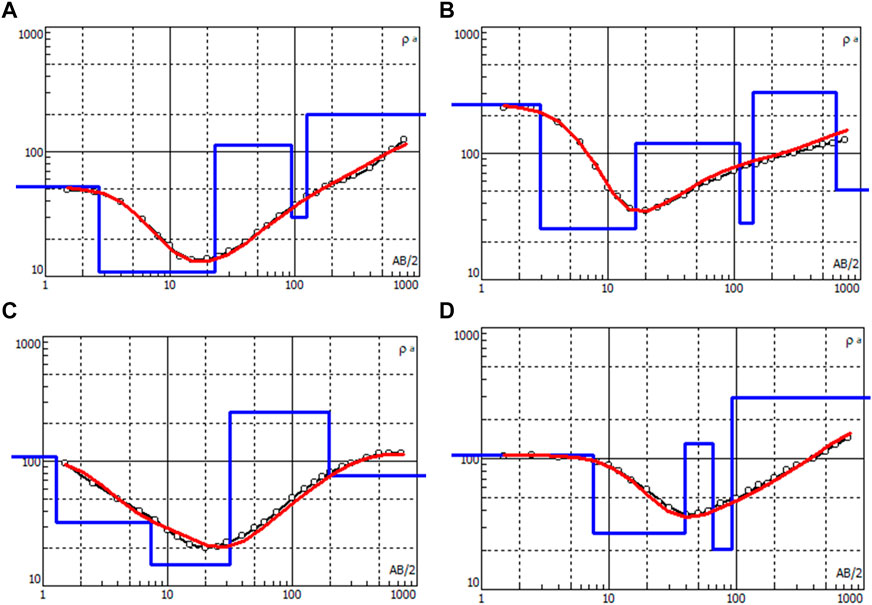
FIGURE 6. Examples of the 1D least damped square inversion of the VES data for (A) S4, (B) S5, (C) S8, and (D) S9.
For the delineation of groundwater aquifers, two hydrogeological profiles are constructed based on the data obtained from geophysical well logs, VES measurements, and lithological logs. The integrated approach results revealed that the study area consists of two aquifers (Figure 7 a, b, and c). An upper aquifer comprises sand with a thickness range from 20 to 50 m, and a lower aquifer with a thickness of more than 200 m is composed of sandstone. The lower aquifer is non-leaky confined due to the presence of a relatively thick mudstone layer with an average thickness of 25 m. Vertical flow components hydraulically connect the upper and lower aquifers. Furthermore, combining the wells logging and VES measurement aided in detecting the spatial variation in the depth to the upper and lower aquifers. The minimal depth to the upper aquifer is 20 m, which is recorded in S5 in the central part of the study area. The depth increases to the Northern and Southern parts to reach its maximum (55 m) in the S13 location. The depth to the lower aquifer varies between 66 and 165 m, which was recorded in S12 and S1, respectively. The thickness of the upper aquifer ranged from 20 to 95 m. The highest thickness is observed in S5 in the Eastern part, while the lowest thickness is in S12 in the North.
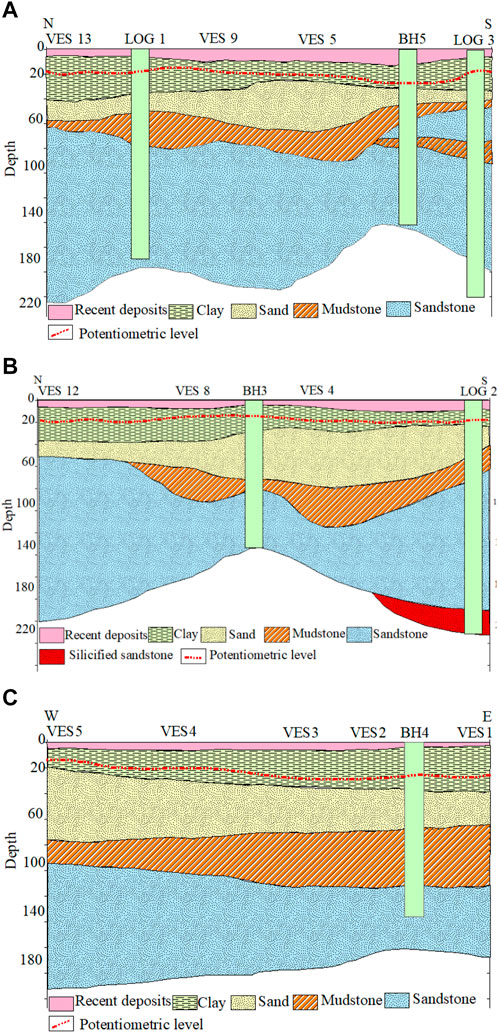
FIGURE 7. Hydrogeological cross sections obtained from the interpretation of (A) profile 1, (B) profile 2, and (C) profile 3.
The results of the estimated petrophysical and hydrogeological parameters are summarized in Table 1. For LOG 1, the average formation resistivity of the upper and lower aquifer is 83 and 120 Ωm, and pore water resistivity is 20 and 25 Ωm. Thus, for the upper aquifer, the average formation factor is 4.3, while for the lower aquifer is 4.8. Since the formation factor is inversely proportional to porosity, the upper aquifer is associated with higher porosity (33%) than the lower aquifer (27%). This is likely due to the high pore-water resistivity. The average shale volume of shallow and deep aquifers is 22% and 19%. As a result, the effective porosities are 24% and 22%. The average hydraulic conductivity of the deep aquifer is 4.9 m/day, while for the shallow aquifer, the hydraulic conductivity is 5.8 m/day. However, the transmissivity of the deep aquifer (490 m2/day) is much higher than that of the shallow aquifer (120 m2/day). This is due to the high thickness of the deep aquifer compared to the shallow.
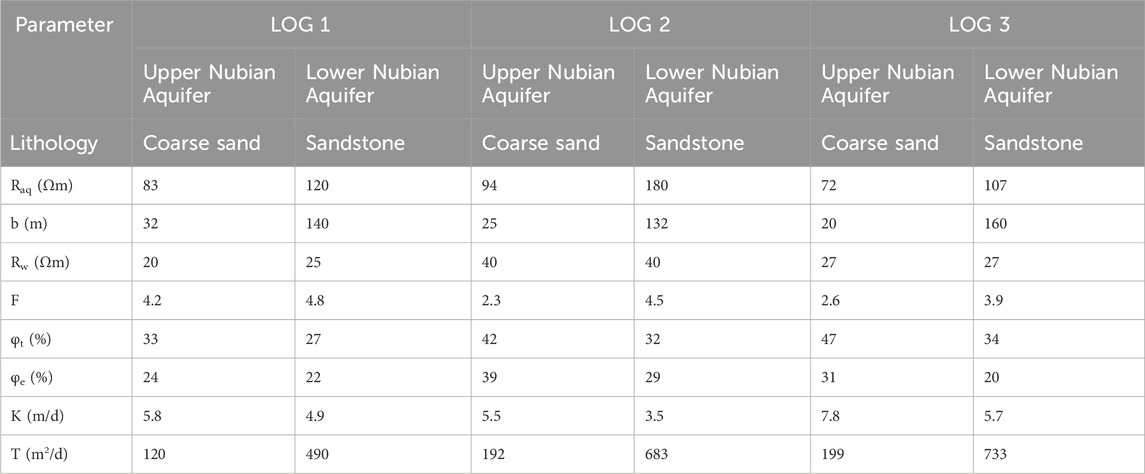
TABLE 1. The average estimated petrophysical and hydrogeological parameters for the Nubian aquifers were obtained from geophysical well logs.
The average formation resistivity of the upper and lower aquifers for LOG 2 is 94 and 180 Ωm, while the pore water resistivity is 40 Ωm. Due to this, the average formation factor for the upper aquifer is 2.3 and 4.5 for the lower aquifer. The upper aquifer is associated with 42% porosity, while the porosity of the lower aquifer is 32%. In shallow and deep aquifers, there are 6% and 10% of shale volume. It follows that the effective porosities are 39% and 29%. The hydraulic conductivity and transmissivity for the shallow and deep aquifers are 5.5 and 3.5 m/day and 192 and 683 m2/day.
For LOG 3, the pore water resistivity is 27 Ωm, while the average formation resistivity of the above and lower aquifers is 72 and 107 Ωm. As a result, the lower aquifer’s average formation factor is 3.9, and the upper aquifer’s average formation factor is 2.6. The lower aquifer has a porosity of 34%, whereas the higher aquifer has a porosity of 47%. Shale volume is present in shallow and deep aquifers at 6% and 10%. The effective porosities are therefore 31% and 20%. The shallow and deep aquifers’ respective hydraulic conductivity is 7.8 and 5.7 m/day, while the transmissivity values are 199 and 733 m2/day.
Vertical electrical sounding (VES) employed the geophysical well logging results to reveal the geographic variation of electrical resistivity, formation factor, porosity, hydraulic conductivity, and transmissivity. In this study, the areal distribution of the resistivity of aquifers is detected. The maximum resistivity for the upper aquifer, 195 Ωm, is recorded in S1, and the minimum 72 Ωm is observed in LOG 3 (Figure 8A). For the lower aquifer, the lowest resistivity of 120 Ωm is detected in LOG 1, and the highest of 292 Ωm is recorded in S9 in the central part of the study area (Figure 8B).
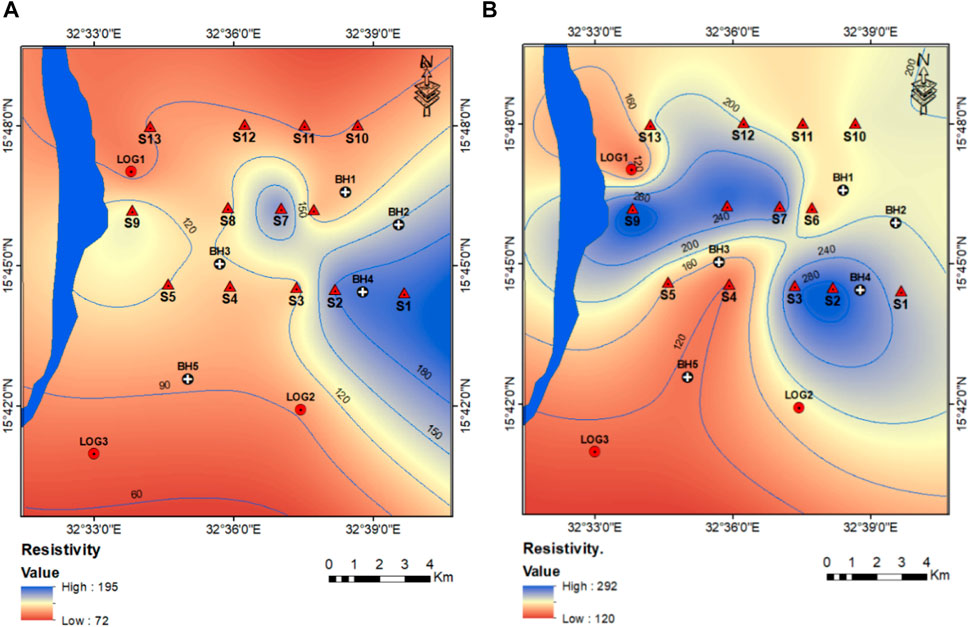
FIGURE 8. The spatial variation of the electrical resistivity for the (A) upper and (B) lower aquifers.
Accordingly, the spatial variation of formation factor in the shallow and deep aquifers is illustrated in Figures 9A, B, respectively. The formation factor for the upper aquifer ranges from 2.3 in the southern part of the study area to 8 in the eastern part of the study area. For the lower aquifer, the formation factor varies between 3.9 and 8.9. The highest value is observed in the S1 location in the eastern part of the study, while the lowest is detected in the LOG3 location in the western part. Consequently, the areal variation of total porosity is revealed. The geographic distribution is shown in Figures 9C, D for the shallow and deep aquifers, respectively. The range of porosity for the upper aquifer is between 20% and 47%, while the lower aquifer is between 17% and 34%. The upper aquifer has a higher porosity than the lower aquifer because it is made up of coarse sand, which is less compact than the sandstone that makes up the deep aquifer.
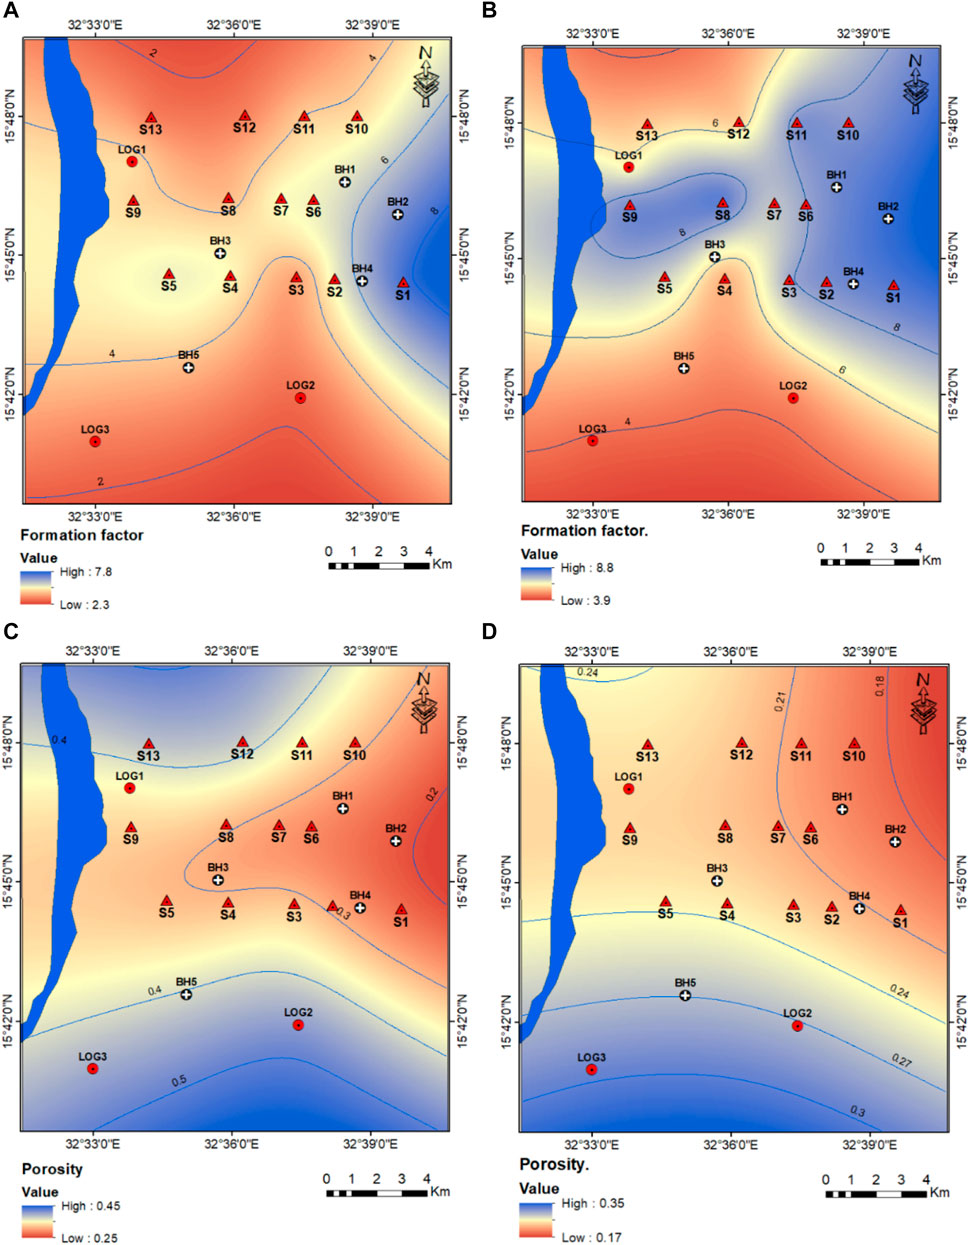
FIGURE 9. Contour maps showing the spatial variation in the formation factor of the (A) upper and (B) lower aquifers and the porosity of (C) upper and (D) lower Nubian aquifers (Contours are shown in blue lines while the Nile River in blue polygons).
The interpolation of hydrogeological parameters of hydraulic conductivity and transmissivity is performed with geophysical and pumping test methods. Figure 10 shows an example of the pumping data analysis using Cooper Jr and Jacob (1946) method. The hydraulic conductivity of the upper aquifer is between 2.8 and 7.8 m/day. The highest conductivity is observed in the LOG3 location and the lowest in S1 location in the eastern part of the study area. Figure 11A shows the variation of the hydraulic conductivity of the shallow aquifer over the study area. Generally, the values increase in the Southeastern part of the study area. For the lower aquifer, the hydraulic conductivity ranges from 1.93 m/day in S9 to 5.7 m/day in LOG3. The geographic distribution in Figure 11B shows an almost similar trend to that of the upper aquifer.
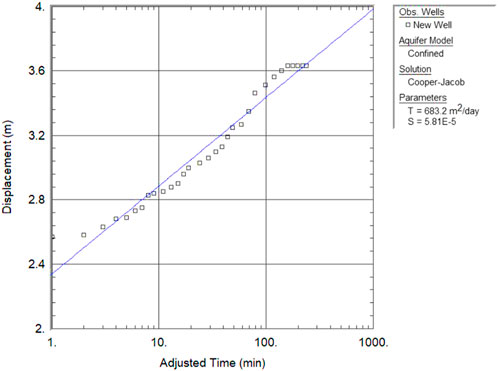
FIGURE 10. The result of pumping test analysis for LOG3 groundwater well using Cooper-Jacob method.
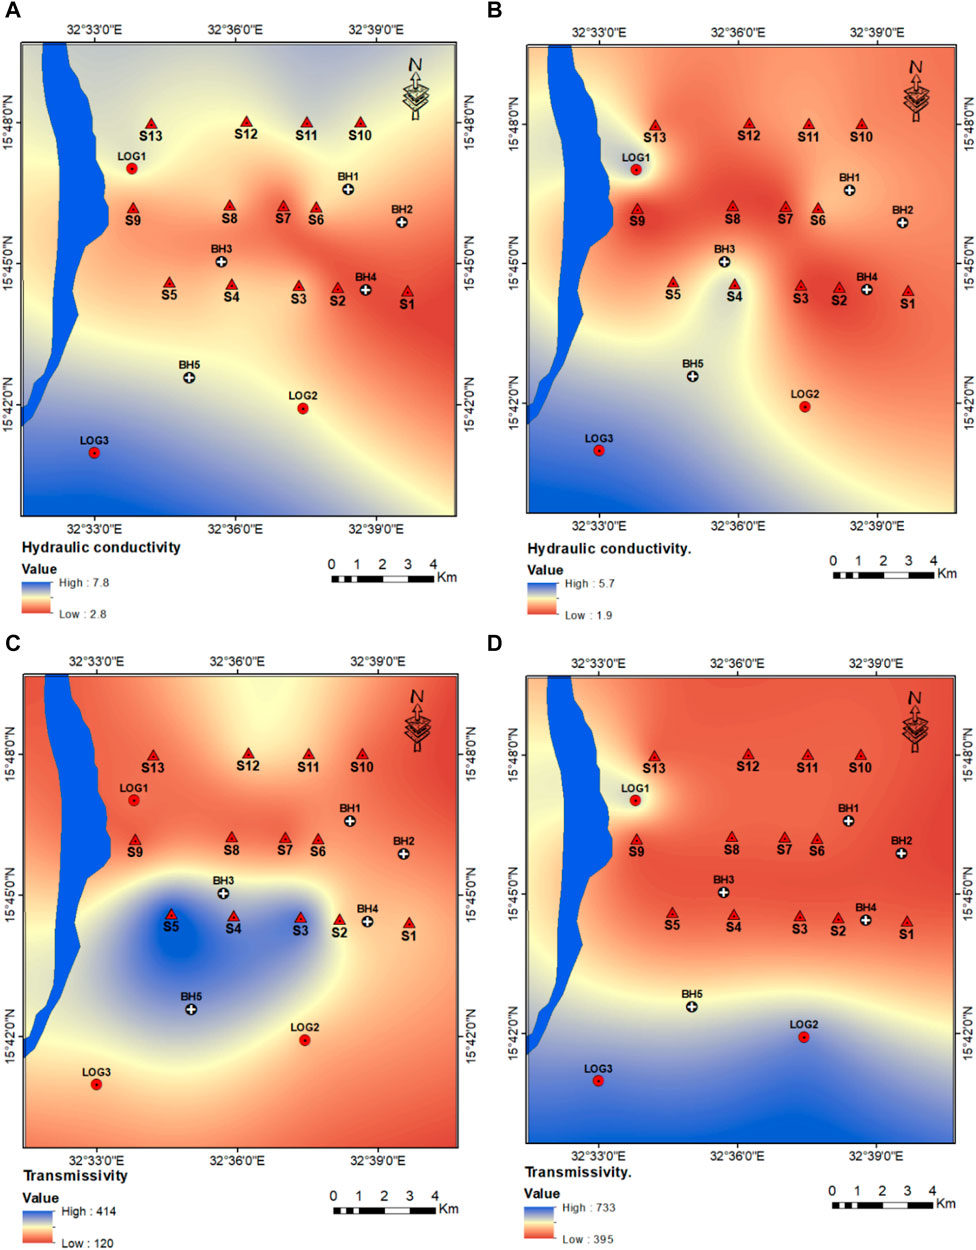
FIGURE 11. The spatial variation in hydraulic conductivity of (A) upper and (B) lower aquifers and the transmissivity of (C) upper and (D) lower Nubian aquifers (The Nile River is shown in blue polygons).
The transmissivity for the upper aquifer ranges from 120 in LOG1 to 220 in S12. The spatial variation shown in Figure 11C revealed the central part of the area is of high transmissivity, and the values decrease toward the North, South, and Eastern parts of the research area. For the lower aquifer, the transmissivity is measured by analyzing pumping test data using Cooper Jr and Jacob (1946) method. Figure 8 shows an example of pumping data analysis for LOG3 locations. The estimated transmissivity for the lower aquifer varies between 370 in the Northern part and 733 in LOG3 in the Southwestern part. The areal distribution is illustrated in Figure 11D. The Southern parts of the area are associated with high transmissivity compared to the. Furthermore, the storativity (S) of the leaky confined aquifer is estimated, and it ranged between 5.8e-5 to 2.09e-6. The lowest value of S is likely due to the low compressibility of the Nubian formation in the study area in response to the pressure change. This is also supported by the slight change in drawdown during groundwater pumping.
The integration of the geophysical well logging with VES data has provided a comprehensive understanding of the geological and hydrogeological frameworks within the study area, enabling the delineation of distinct hydrostratigraphical units. Across the study area, the consistent identification of superficial deposits highlights the uniformity of the uppermost layers (Haggaz and Kheirallah, 1988). This uniformity is important for evaluating recharge mechanisms (Farah et al., 2000). On the other hand, aquitards identified at varying depths serve as geological barriers influencing vertical groundwater flow (Zeinelabdein and Elsheikh, 2014). The delineated aquifers are affected by these aquitards, which impact their connectivity and facilitate direct groundwater infiltration due to hydraulic gradient differences (Hussein and Awad, 2006). Furthermore, the spatial disparities in the distribution of aquifer depth and thickness underscore the subsurface heterogeneity, indicating varying groundwater potential throughout the study area (Abdelsalam et al., 2016). However, limitations in the exploration depth, especially for identifying the thickness of the lower aquifer, highlight the necessity for more extensive investigations using more profound exploration techniques like deep resistivity sounding or gravity surveys (Mohamed, 2020).
The petrophysical and hydrogeological parameters derived from the well logs provide crucial insights into the characteristics and potential productivity of the identified aquifers within the study area. The variation in formation resistivity and pore water resistivity among the upper and lower aquifers across different logs contributes to the differences in porosity and storativity (Farrag et al., 2019). Accordingly, the differences in the distribution of hydraulic conductivity and transmissivity values between the upper and lower aquifers reflect varying permeabilities and thicknesses, with the deeper aquifers exhibiting higher transmissivity due to their substantial thicknesses (Zeinelabdein and Elsheikh, 2014). In general, the obtained values showed a close agreement with the results of (Elkrail and Adlan, 2019). According to (Krásný, 1993) classification, the upper and lower aquifers are defined as high transmissivity aquifers that can be ideal for groundwater development to fulfill the water supply. However, optimizing the pumping rate to suit the measured parameters is advisable for the sustainable management of groundwater resources.
The investigation of the NAS has uncovered crucial patterns of petrophysical and hydrogeological parameters. This complete assessment provides a dataset that may be used as a basis for creating precise hydrogeological conceptual models to simulate the movement of groundwater and the spread of contaminants within the systems (Geng et al., 2020). The NAS acts as a model for interpreting comparable aquifer systems globally, allowing the extension of current findings to other analogous hydrogeological environments. An example of an aquifer system with comparable hydrogeological characteristics is the Taoudeni Basin Aquifer System (TAS), which extends across Algeria, Mali, and Mauritania (Nijsten et al., 2018). Our study promotes a wider viewpoint in comprehending and handling crucial groundwater resources by acknowledging the similarities between the NAS and other aquifers.
The integrated approach using geophysical well-logging, vertical electrical sounding, and pumping test data is employed to delineate and characterize the Cretaceous Nubian Aquifer System in Khartoum state, Sudan. The research area encompasses two hydraulically connected aquifers. These aquifers comprise shallow and deep aquifers that transition from being leaky confined to non-leaky confined due to intercalated clayey and mudstone layers. These layers restrict the vertical movement of groundwater and establish a high hydrostatic pressure that exceeds atmospheric pressure. The actual thickness of the deep aquifer was not determined in the recent investigation since the depth of the sounding cannot detect the top of the Precambrian basement rocks.
The petrophysical analysis of the aquifer materials revealed distinct differences between the shallow and deep aquifers. The deep aquifer exhibits a greater degree of cementation and consolidation. Conversely, the shallow aquifer is characterized by a higher shale volume, resulting in reduced hydraulic conductivity. The estimation of hydraulic parameters, including hydraulic conductivity and transmissivity, demonstrated the considerable groundwater potential within the study area. Consequently, the aquifers can serve as a reliable source of groundwater supply in Khartoum State. Nonetheless, the study highlights the necessity of optimizing groundwater extraction to align with the hydraulic properties of the aquifers.
The integrated approach successfully delineated and characterized the Nubian Aquifer System in Khartoum State; however, this study recommended applying deep electrical methods to determine the thickness of the deep aquifer for the accurate estimation of petrophysical and hydrogeological parameters. The most recent study of the NAS greatly enhances our comprehension of transboundary aquifer systems. In addition to the specific qualities emphasized in the NAS, the findings of this study have prospective implications that can be extrapolated and implemented in aquifer systems that have a heterogeneous lithological and hydrogeological nature.
The original contributions presented in the study are included in the article/Supplementary material, further inquiries can be directed to the corresponding authors.
MM: Conceptualization, Data curation, Formal Analysis, Methodology, Project administration, Resources, Writing–original draft, Writing–review and editing. AM: Data curation, Funding acquisition, Investigation, Methodology, Project administration, Resources, Writing–original draft, Writing–review and editing. NS: Conceptualization, Resources, Supervision, Validation, Writing–original draft. SA: Conceptualization, Data curation, Formal Analysis, Funding acquisition, Writing–original draft. AA: Investigation, Resources, Supervision, Writing–original draft. JA: Investigation, Resources, Methodology, Writing–original draft. PS: Data curation, Formal Analysis, Investigation, Resources, Writing–original draft.
The authors declare financial support was received for the research, authorship, and/or publication of this article.
This research was funded by Researchers Supporting Project number (RSP2024R496), King Saud University, Riyadh, Saudi Arabia.
The authors declare that the research was conducted in the absence of any commercial or financial relationships that could be construed as a potential conflict of interest.
All claims expressed in this article are solely those of the authors and do not necessarily represent those of their affiliated organizations, or those of the publisher, the editors and the reviewers. Any product that may be evaluated in this article, or claim that may be made by its manufacturer, is not guaranteed or endorsed by the publisher.
Abbas, M., Deparis, J., Isch, A., Mallet, C., Jodry, C., Azaroual, M., et al. (2022). Hydrogeophysical characterization and determination of petrophysical parameters by integrating geophysical and hydrogeological data at the limestone vadose zone of the Beauce aquifer. J. Hydrology 615, 128725. doi:10.1016/j.jhydrol.2022.128725
Abdalla, O. A. E. (2009). Groundwater modeling in semiarid Central Sudan: adequacy and long-term abstraction. Arabian J. Geosciences 2, 321–335. doi:10.1007/s12517-009-0042-4
Abdelsalam, Y. E., Ea, E. M., and Elhadi, H.El (2016). “Problems and factors which retard the development and the utilization of groundwater for drinking purposes in the Khartoum state-Sudan”. in 7th International Conference on Environment and Engineering Geophysics \& Summit Forum of Chinese Academy of Engineering on Engineering Science and Technology (Dordrecht), 449–451.
Adagunodo, T. A., Akinloye, M. K., Sunmonu, L. A., Aizebeokhai, A. P., Oyeyemi, K. D., and Abodunrin, F. O. (2018). Groundwater exploration in aaba residential area of Akure, Nigeria. Front. Earth Sci. 6, 1–12. doi:10.3389/feart.2018.00066
Alao, J. O., Ahmad, M. S., Danjumo, T. T., Ango, A., and Jaiyeoba, E. (2022). Assessment of aquifer protective capacity, against the surface contamination. A case study of kaduna industrial village, Nigeria. Phys. Sci. Int. J., 43–51. doi:10.9734/psij/2022/v26i130306
Algafar, M. A., Abdou, G., and Abdelsalam, Y. (2011). Groundwater flow model for the Nubian aquifer in the Khartoum area, Sudan. Bull. Eng. Geol. Environ. 70, 619–623. doi:10.1007/s10064-011-0366-7
Aliou, A. S., Dzikunoo, E. A., Yidana, S. M., Loh, Y., and Chegbeleh, L. P. (2022). Investigation of geophysical signatures for successful exploration of groundwater in highly indurated sedimentary basins: a look at the nasia basin, ne Ghana. Nat. Resour. Res. 31, 3223–3251. doi:10.1007/s11053-022-10125-9
Amiri, V., Sohrabi, N., Li, P., and Shukla, S. (2022). Estimation of hydraulic conductivity and porosity of a heterogeneous porous aquifer by combining transition probability geostatistical simulation, geophysical survey, and pumping test data. Environ. Dev. Sustain. 25, 7713–7736. doi:10.1007/s10668-022-02368-6
Archie, G. E. (1942). The electrical resistivity log as an aid in determining some reservoir characteristics. Trans. AIME 146, 54–62. doi:10.2118/942054-g
Arétouyap, Z., Bisso, D., Njandjock Nouck, P., Amougou Menkpa, L. E., and Asfahani, J. (2019). Hydrogeophysical characteristics of pan-african aquifer specified through an alternative approach based on the interpretation of vertical electrical sounding data in the adamawa region, central africa. Nat. Resour. Res. 28, 63–77. doi:10.1007/s11053-018-9373-8
Avci, C. B., Ciftci, E., and Sahin, A. U. (2010). Identification of aquifer and well parameters from step-drawdown tests. Hydrogeology J. 18, 1591–1601. doi:10.1007/s10040-010-0620-2
Bobachev, C. (2002). IPI2Win: a windows software for an automatic interpretation of resistivity sounding data. Russia: Moscow State University, 320.
Cooper, H. H., and Jacob, C. E. (1946). A generalized graphical method for evaluating formation constants and summarizing well-field history. Eos, Trans. Am. Geophys. Union 27, 526–534.
De Clercq, T., Jardani, A., Fischer, P., Thanberger, L., Vu, T. M., Pitaval, D., et al. (2020). The use of electrical resistivity tomograms as a parameterization for the hydraulic characterization of a contaminated aquifer. J. Hydrology 587, 124986. doi:10.1016/j.jhydrol.2020.124986
Ebong, E. D., Akpan, A. E., and Onwuegbuche, A. A. (2014). Estimation of geohydraulic parameters from fractured shales and sandstone aquifers of Abi (Nigeria) using electrical resistivity and hydrogeologic measurements. J. Afr. Earth Sci. 96, 99–109. doi:10.1016/j.jafrearsci.2014.03.026
Elkrail, A., Kheir, O., Shu, L., and Zhenchun, H. (2004). Hydrogeology of the northern Gezira area, central Sudan. J. Spatial Hydrology 4.
Elkrail, A. B., and Adlan, M. (2019). Groundwater flow assessment based on numerical simulation at omdurman area, Khartoum state, Sudan. Afr. J. Geosciences 2, 59–65.
Farah, E. A., Mustafa, E. M. A., and Kumai, H. (2000). Sources of groundwater recharge at the confluence of the Niles, Sudan. Environ. Geol. 39, 667–672. doi:10.1007/s002540050479
Farrag, A. A., Ebraheem, M. O., Sawires, R., Ibrahim, H. A., and Khalil, A. L. (2019). Petrophysical and aquifer parameters estimation using geophysical well logging and hydrogeological data, Wadi El-Assiuoti, Eastern Desert, Egypt. J. Afr. Earth Sci. 149, 42–54. doi:10.1016/j.jafrearsci.2018.07.023
Fejes, Z., Szűcs, P., Turai, E., Zákányi, B., and Szabó, N. P. (2021). Regional hydrogeology of the tokaj mountains world heritage site, north-east Hungary. Acta Montan. Slovaca 26, 18–34. doi:10.46544/AMS.v26i1.02
Flores, Y. G., Eid, M. H., Szűcs, P., Szőcs, T., Fancsik, T., Szanyi, J., et al. (2023). Integration of geological, geochemical modelling and hydrodynamic condition for understanding the geometry and flow pattern of the aquifer system, southern nyírség–hajdúság, Hungary. South. Nyírség–Hajdúság, Hung. Water 15, 2888. doi:10.3390/w15162888
Geng, X., Boufadel, M. C., Rajaram, H., Cui, F., Lee, K., and An, C. (2020). Numerical study of solute transport in heterogeneous beach aquifers subjected to tides. Water Resour. Res. 56. doi:10.1029/2019WR026430
Gouasmia, M., Mhamdi, A., Dhahri, F., Moumni, L., and Soussi, M. (2022). Geophysical and hydrogeological investigation to study the aquifer potential of northern Gafsa basin (central Tunisia). Arabian J. Geosciences 15, 433–510. doi:10.1007/s12517-022-09666-3
Haggaz, Y. A. S., and Kheirallah, K. M. (1988). Paleohydrology of the nubian aquifer northeast of the blue nile, near Khartoum, Sudan. J. Hydrology 99, 117–125. doi:10.1016/0022-1694(88)90082-0
Heigold, P. C., Gilkeson, R. H., Cartwright, K., and Reed, P. C. (1979). Aquifer transmissivity from surficial electrical methods. Groundwater 17, 338–345. doi:10.1111/j.1745-6584.1979.tb03326.x
Hezzi, M. F., Guellala, R., Hamed Ferjani, A., Ferchichi, Y., Merzoughi, A., and Inoubli, M. H. (2021). Interpretation of geometric elements of the fahs aquifer system, northeast Tunisia: joint use of vertical electrical sounding data, well logs and satellite imagery. Nat. Resour. Res. 30, 321–337. doi:10.1007/s11053-020-09737-w
Hussein, M. T., and Awad, H. S. (2006). Delineation of groundwater zones using lithology and electric tomography in the Khartoum basin, central Sudan. Comptes Rendus - Geosci. 338, 1213–1218. doi:10.1016/j.crte.2006.09.007
Khadri, S. F. R., and Pande, C. (2016). Ground water flow modeling for calibrating steady state using MODFLOW software: a case study of Mahesh River basin, India. Model. Earth Syst. Environ. 2, 39–17. doi:10.1007/s40808-015-0049-7
Khalil, M. A., Temraz, M. G., Joeckel, R. M., Elnaggar, O. M., and Abuseda, H. H. (2022). Estimating hydraulic conductivity from reservoir resistivity logs, northern western desert, Egypt. Pure Appl. Geophys. 179, 4489–4501. doi:10.1007/s00024-022-03178-7
Köhnke, M., Skala, W., and Erpenstein, K. (2017). “Nile groundwater interaction modeling in the northern Gezira plain for drought risk assessment,” in Geoscientific research in Northeast africa (CRC Press). London, 705–711.
Krásný, J. (1993). Classification of transmissivity magnitude and variation. Groundwater 31, 230–236. doi:10.1111/j.1745-6584.1993.tb01815.x
Li, J., Zhang, Y., Lin, L., and Zhou, Y. (2023). Study on the shear mechanics of gas hydrate-bearing sand-well interface with different roughness and dissociation. Bull. Eng. Geol. Environ. 82 (11), 404. doi:10.1007/s10064-023-03432-9
Liu, Z., Xu, J., Liu, M., Yin, Z., Liu, X., Yin, L., et al. (2023). Remote sensing and geostatistics in urban water-resource monitoring: a review. Mar. Freshw. Res. 74 (10), 747–765. doi:10.1071/MF22167
Madun, A., Tajudin, S. A. A., Sahdan, M. Z., Md Dan Azlan, M. F., and Abu Talib, M. K. (2018). Electrical resistivity and induced polarization techniques for groundwater exploration. Int. J. Integr. Eng. 10, 56–60. doi:10.30880/ijie.2018.10.08.005
Mathon, B. R., Ozbek, M. M., and Pinder, G. F. (2008). Transmissivity and storage coefficient estimation by coupling the Cooper-Jacob method and modified fuzzy least-squares regression. J. Hydrology 353, 267–274. doi:10.1016/j.jhydrol.2008.02.004
Misstear, B. D. R. (2001). The value of simple equilibrium approximations for analysing pumping test data. Hydrogeology J. 9, 125–126. doi:10.1007/s100400100133
Mohamed, A. (2019). Hydro-geophysical study of the groundwater storage variations over the Libyan area and its connection to the dakhla basin in Egypt. J. Afr. Earth Sci. 157, 103508. doi:10.1016/j.jafrearsci.2019.05.016
Mohamed, A. (2020). Gravity applications in estimating the mass variations in the Middle East: a case study from Iran. Arabian J. Geosciences 13, 364. doi:10.1007/s12517-020-05317-7
Mohamed, A., Al Deep, M., Othman, A., Taha, A. L., Alshehri, F., Abdelrady, A., et al. (2022). Integrated geophysical assessment of groundwater potential in southwestern Saudi Arabia. Front. Earth Sci. 10, 937402.
Mohamed, A., Ahmed, E., Alshehri, F., and Abdelrady, A. (2022). The groundwater flow behavior and the recharge in the Nubian Sandstone Aquifer System during the wet and arid periods. Sustainability 14, 6823.
Mohamed, A., Alarifi, S. S., and Abdelrady, A. (2023). Sedimentary cover and structural trends affecting the groundwater flow in the Nubian Sandstone Aquifer System: inferences from geophysical, field and geochemical data. Front. Earth Sci. 11, 1173569. doi:10.3389/feart.2023.1173569
Mohamed, A., Othman, A., Galal, W. F., and Abdelrady, A. (2023a). Integrated geophysical approach of groundwater potential in Wadi Ranyah, Saudi Arabia, using gravity, electrical resistivity, and remote-sensing techniques. Remote Sens. 15, 1808. doi:10.3390/rs15071808
Mohamed, A., Sultan, M., Ahmed, M., Yan, E., and Ahmed, E. (2017). Aquifer recharge, depletion, and connectivity: inferences from GRACE, land surface models, and geochemical and geophysical data. Geol. Soc. Am. Bull. 129, 534–546. doi:10.1130/B31460.1
Mohammed, M. A. A., Abdelrahman, M. M. G., Szabó, N. P., and Szűcs, P. (2023a). Innovative hydrogeophysical approach for detecting the spatial distribution of hydraulic conductivity in Bahri city, Sudan: a comparative study of Csókás and Heigold methods. Sustain. Water Resour. Manag. 9, 107–116. doi:10.1007/s40899-023-00885-4
Mohammed, M. A. A., Kaya, F., Mohamed, A., Alari, S. S., Abdelrady, A., Keshavarzi, A., et al. (2023b). Application of GIS-based machine learning algorithms for prediction of irrigational groundwater quality indices. Front. Earth Sci. 11, 1–19. doi:10.3389/feart.2023.1274142
Mohammed, M. A. A., Szabó, N. P., and Szűcs, P. (2023c). Assessment of the Nubian aquifer characteristics by combining geoelectrical and pumping test methods in the Omdurman area, Sudan. Model. Earth Syst. Environ. 9, 4363–4381. doi:10.1007/s40808-023-01767-6
Mohammed, M. A. A., Szabó, N. P., and Szűcs, P. (2023d). Characterization of groundwater aquifers using hydrogeophysical and hydrogeochemical methods in the eastern Nile River area, Khartoum State, Sudan. Environ. Earth Sci. 82, 219. doi:10.1007/s12665-023-10915-1
Mohammed, M. A. A., Szabó, N. P., and Szűcs, P. (2023e). Delineation of groundwater potential zones in northern Omdurman area using electrical resistivity method. IOP Conf. Ser. Earth Environ. Sci. 1189, 012012. doi:10.1088/1755-1315/1189/1/012012
Mohammed, M. A. A., Szabó, N. P., and Szűcs, P. (2023f). Exploring hydrogeological parameters by integration of geophysical and hydrogeological methods in northern Khartoum state, Sudan. Groundw. Sustain. Dev. 20, 100891. doi:10.1016/j.gsd.2022.100891
Nijsten, G.-J., Christelis, G., Villholth, K. G., Braune, E., and Gaye, C. B. (2018). Transboundary aquifers of Africa: review of the current state of knowledge and progress towards sustainable development and management. J. Hydrology Regional Stud. 20, 21–34. doi:10.1016/j.ejrh.2018.03.004
Omeiza, J., Ghassan, H., Ayejoto, D. A., Mohammed, M. A. A., Danladi, E., Saqr, A. M., et al. (2023). Evaluation of groundwater contamination and the health risk due to landfills using integrated geophysical methods and physiochemical water analysis. Case Stud. Chem. Environ. Eng. 8, 100523. doi:10.1016/j.cscee.2023.100523
Oudeika, M. S., Taşdelen, S., Güngör, M., and Aydin, A. (2021). Integrated vertical electrical sounding and hydrogeological approach for detailed groundwater pathways investigation: Gökpınar Dam Lake, Denizli, Turkey. J. Afr. Earth Sci. 182, 104273. doi:10.1016/j.jafrearsci.2021.104273
Pongmanda, S., and Suprapti, A. (2020). Performing application of cooper-jacob method for identification of storativity. IOP Conf. Ser. Earth Environ. Sci. 419, 012128. doi:10.1088/1755-1315/419/1/012128
Puri, S., and Aureli, A. (2005). Transboundary aquifers: a global program to assess, evaluate, and develop policy. Groundwater 43, 661–668. doi:10.1111/j.1745-6584.2005.00100.x
Rabeh, T., Ali, K., Bedair, S., Sadik, M. A., and Ismail, A. (2019). Exploration and evaluation of potential groundwater aquifers and subsurface structures at Beni Suef area in southern Egypt. J. Afr. Earth Sci. 151, 9–17. doi:10.1016/j.jafrearsci.2018.11.025
Römhild, L., Fiandaca, G., Hu, L., Meyer, L., and Bayer, P. (2022). Imaging hydraulic conductivity in near-surface aquifers by complementing cross-borehole induced polarization with hydraulic experiments. Adv. Water Resour. 170, 104322. doi:10.1016/j.advwatres.2022.104322
Sang, L., Zhu, G., Xu, Y., Sun, Z., Zhang, Z., and Tong, H. (2023). Effects of agricultural large-and medium-sized reservoirs on hydrologic processes in the arid shiyang river basin, northwest China. Water Resour. Res. 59 (2). doi:10.1029/2022WR033519
Schlumberger (1984). Schlumberger log interpretation charts. Houston: Schlumberger Well Services, 1–21.
Schlumberger (1991). Log interpretation principles/applications. Schlumberger Educational Services. Houston, Tex, 112.
Schrank, E., and Awad, M. Z. (1990). Palynological evidence for the age and depositional environment of the Cretaceous Omdurman Formation in the Khartoum area, Sudan. Berl. Geowiss. Abh. Reihe A 120, 169–182.
Sindico, F., Hirata, R., and Manganelli, A. (2018). The Guarani Aquifer System: from a Beacon of hope to a question mark in the governance of transboundary aquifers. J. Hydrology Regional Stud. 20, 49–59. doi:10.1016/j.ejrh.2018.04.008
Sultan Araffa, S. A., Mekhemer, H. M., Santos, F. A. M., and Abd Alla, M. (2009). Geophysical measurements for subsurface mapping and groundwater exploration at the central part of the Sinai Peninsula, Egypt. Arabian J. Sci. Eng. 34, 103–119. doi:10.112/J.2191-4281
Szabó, N. P. (2015). Hydraulic conductivity explored by factor analysis of borehole geophysical data. Hydrogeology J. 23, 869–882. doi:10.1007/s10040-015-1235-4
Szabó, N. P. (2018). A genetic meta-algorithm-assisted inversion approach: hydrogeological study for the determination of volumetric rock properties and matrix and fluid parameters in unsaturated formations. Hydrogeology J. 26, 1935–1946. doi:10.1007/s10040-018-1749-7
Szabó, N. P., Kiss, A., and Halmágyi, A. (2015). Hydrogeophysical characterization of groundwater formations based on well logs: case study on cenozoic clastic aquifers in East Hungary. Geosciences Eng. 4, 45–71.
Szűcs, P., Szabó, N. P., Zubair, M., and Szalai, S. (2021). Innovative hydrogeophysical approaches as aids to assess Hungarian groundwater bodies. Appl. Sci. 11, 2099. doi:10.3390/app11052099
Szűcs, P., Zakanyi, B., and Szekely, F. (2013). Comparison of analytical and numerical approaches for simulating groundwater flow to multi screen wells. Carpathian J. Earth Environ. Sci. 8, 69–76.
Taha, A. I., Al Deep, M., and Mohamed, A. (2021). Investigation of groundwater occurrence using gravity and electrical resistivity methods: a case study fromWadi Sar, Hijaz Mountains, Saudi Arabia. Arab. J. Geosci. 14, 334.
Tie, Y., Rui, X., Shi-Hui, S., Zhao-Kai, H., and Jin-Yu, F. (2023). A real-time intelligent lithology identification method based on a dynamic felling strategy weighted random forest algorithm. Petroleum Sci. doi:10.1016/j.petsci.2023.09.011
Ugbaja, A. A., William, G. A., and Ugbaja, U. A. (2021). Evaluation of groundwater potential using aquifer characteristics on parts of Boki Area, South- Eastern Nigeria. Glob. J. Geol. Sci. 19, 93–104. doi:10.4314/gjgs.v19i1.8
Voss, C. I., and Soliman, S. M. (2014). The transboundary non-renewable Nubian Aquifer System of Chad, Egypt, Libya and Sudan: classical groundwater questions and parsimonious hydrogeologic analysis and modeling. Hydrogeology J. 22, 441–468. doi:10.1007/s10040-013-1039-3
Wu, B., Quan, Q., Yang, S., and Dong, Y. (2023). A social-ecological coupling model for evaluating the human-water relationship in basins within the Budyko framework. J. Hydrology 619, 129361. doi:10.1016/j.jhydrol.2023.129361
Yang, L., Wang, H., Xu, H., Guo, D., and Li, M. (2023). Experimental study on characteristics of water imbibition and ion diffusion in shale reservoirs. Geoenergy Sci. Eng. 229, 212167. doi:10.1016/j.geoen.2023.212167
Yin, H., Zhang, G., Wu, Q., Yin, S., Soltanian, M. R., Thanh, H. V., et al. (2023). A deep learning-based data-driven approach for predicting mining water inrush from coal seam floor using microseismic monitoring data. IEEE Trans. Geoscience Remote Sens. 61, 1–15. doi:10.1109/TGRS.2023.3300012
Yin, L., Wang, L., Li, T., Lu, S., Yin, Z., Liu, X., et al. (2023). U-Net-STN: a novel end-to-end lake boundary prediction model. Land 12 (8), 1602. doi:10.3390/land12081602
Yin, L., Wang, L., Li, J., Lu, S., Tian, J., Yin, Z., et al. (2023a). YOLOV4_CSPBi: enhanced land target detection model. Land 12 (9), 1813. doi:10.3390/land12091813
Yuan, C., Li, Q., Nie, W., and Ye, C. (2023). A depth information-based method to enhance rainfall-induced landslide deformation area identification. Measurement 219, 113288. doi:10.1016/j.measurement.2023.113288
Yusuf, M. A., and Abiye, T. A. (2019). Risks of groundwater pollution in the coastal areas of Lagos, southwestern Nigeria. Groundw. Sustain. Dev. 9, 100222. doi:10.1016/j.gsd.2019.100222
Zeinelabdein, K. A. E., Elsheikh, A. E. M., and Bireir, F. (2014). Hydro-geophysical study in Al-Khogalab basement-sedimentary basin transition area using Vertical Electrical Sounding method, Khartoum State, Central Sudan. Open Transaction Geosciences 1, 1, 10. doi:10.15764/geos.2014.02001
Zhou, J., Wang, L., Zhong, X., Yao, T., Qi, J., Wang, Y., et al. (2022). Quantifying the major drivers for the expanding lakes in the interior Tibetan Plateau. Sci. Bull. 67 (5), 474–478. doi:10.1016/j.scib.2021.11.010
Keywords: well logs, vertical electrical sounding, pumping test, hydraulic conductivity, transmissivity
Citation: Mohammed MAA, Mohamed A, Szabó NP, Alarifi SS, Abdelrady A, Alao JO and Szűcs P (2024) Investigation of petrophysical and hydrogeological parameters of the transboundary Nubian Aquifer system using geophysical methods. Front. Earth Sci. 11:1295213. doi: 10.3389/feart.2023.1295213
Received: 15 September 2023; Accepted: 21 December 2023;
Published: 12 January 2024.
Edited by:
Ahmed M. Eldosouky, Suez University, EgyptReviewed by:
Cyrille Njiteu, University of Douala, CameroonCopyright © 2024 Mohammed, Mohamed, Szabó, Alarifi, Abdelrady, Alao and Szűcs. This is an open-access article distributed under the terms of the Creative Commons Attribution License (CC BY). The use, distribution or reproduction in other forums is permitted, provided the original author(s) and the copyright owner(s) are credited and that the original publication in this journal is cited, in accordance with accepted academic practice. No use, distribution or reproduction is permitted which does not comply with these terms.
*Correspondence: Musaab A. A. Mohammed, bXVzYWIyMDUwMUBnbWFpbC5jb20=; Ahmed Mohamed, YWhtZWRtb2hhbWVkQGF1bi5lZHUuZWc=; Ahmed Abdelrady, QS5SLkEuTWFobW91ZEB0dWRlbGZ0Lm5s
Disclaimer: All claims expressed in this article are solely those of the authors and do not necessarily represent those of their affiliated organizations, or those of the publisher, the editors and the reviewers. Any product that may be evaluated in this article or claim that may be made by its manufacturer is not guaranteed or endorsed by the publisher.
Research integrity at Frontiers
Learn more about the work of our research integrity team to safeguard the quality of each article we publish.