 Liwei Zhang
 Weiguo Zhang
94% of researchers rate our articles as excellent or good
Learn more about the work of our research integrity team to safeguard the quality of each article we publish.
Find out more
ORIGINAL RESEARCH article
Front. Earth Sci., 16 October 2023
Sec. Geohazards and Georisks
Volume 11 - 2023 | https://doi.org/10.3389/feart.2023.1293258
This article is part of the Research TopicRisk Assessment, Stability Monitoring, and Safe Design for Deep Rock EngineeringView all 20 articles
The tunnel collapse occurred during the construction of the Qingdao Metro Line Ⅰ, resulting in a pit measuring approximately 10 m in diameter and 7 m in depth on the ground surface. The collapse inflicted substantial economic losses, casualties, and subsequent disruptions to ongoing construction activities. To clarify the causes of this collapse and investigate the underlying factors, a comprehensive approach combining field surveys and numerical simulations was undertaken. The results show that the collapse was primarily attributed to inadequate support when facing the challenging geological conditions, poor surrounding rocks (Grade VI) and a high volume of groundwater. The combination of abundant water and sand seeped into the tunnel, culminating in a catastrophic ground collapse. Notably, the arch roof experienced extensive deformation and damage due to the significant seepage pressure, which was exacerbated by the absence of timely support. Then, ground grouting was promptly conducted to repair the affected area and reinforce the tunnel structure. Subsequent monitoring of surface deformations following the resumption of tunneling operations indicated the effectiveness of the disaster treatment approach. These achievements constitute a reliable theoretical foundation for similar projects, particularly in terms of environmental protection and ensuring safe construction practices.
The construction of metro systems not only significantly alleviates the ever-growing burden of urban traffic but also optimizes the preferred mode of transportation for the public. According to the latest data from the National Bureau of Statistics, as of the end of 2021, a remarkable 51 cities in China had successfully launched metro lines, covering an impressive total operating distance of 8,736 km. However, it is important to acknowledge that collapse accidents continue to pose challenges during metro tunnel construction, primarily due to the complex geological and groundwater conditions involved in the process (Alija et al., 2014; Kitchah et al., 2021; Sousa and Einstein, 2021; Sarna et al., 2022). For instance, a couple of incidents highlight the challenges faced during metro construction. On 7 February 2018, during the construction of the Foshan Metro Line Ⅱ, the shield tail seal of the tunneling machine was damaged due to the high-water pressure encountered while crossing a water-rich sand layer. This unfortunate event led to a water inrush, resulting in a collapse of the tunnel and the surface above it. Similarly, on 27 May 2019, an incident occurred during the construction of the Qingdao Metro Line Ⅳ, where water and mud inrush during tunneling eventually led to surface collapse. Moreover, it is essential to recognize that collapse accidents can have far-reaching consequences (Font-Capó et al., 2011; Bayati and Hamidi, 2017; Fraldi et al., 2019). They can cause damage to the surrounding environment, affecting the distribution of groundwater and even resulting in surface subsidence. Particularly in urban areas, such accidents can significantly impact nearby buildings, leading to severe adverse effects (Inokuma and Inano, 1996; Prendes-Gero et al., 2013; Gattinoni et al., 2019; Hencher, 2019). The subsequent backfilling of collapsed areas might also inflict unrecoverable damage to the geological formations. Given these risks, it becomes paramount to prioritize environmental protection and green construction measures. By minimizing the occurrence of collapse accidents during construction and implementing effective treatment measures, we can ensure the safety of both the metro construction process and the surrounding environment. This approach holds immense significance in promoting sustainable and responsible practices in urban development and infrastructure projects.
Many researchers have investigated the collapse mechanism of metro tunnels through various methodologies, including theoretical analysis, numerical simulation, and on-site monitoring. The limit analysis method is a commonly used theoretical method for estimating the stability of surrounding rock (Leca and Dormieux, 1990; Senent and Jimenez, 2015; Fernández et al., 2021). For instance, Fraldi and Guarracino (2009) obtained the critical pressure of roof collapse of deep-buried rectangular cavity based on the Hoek-Brown criterion and limit analysis method, based on which Liang et al. (2022) proposed the expression of incomplete collapse curve of shallow rectangular tunnel by using the limit analysis considering the problem with variable endpoint. Park and Michalowski (2020) applied the limit analysis method to extend the two-dimensional (2D) tunnel collapse model to the three-dimensional (3D) circular tunnel model by adopting the parameter form of Hoek-Brown criterion and put forward three quantitative safety evaluation measures. Simultaneously, some researchers have also studied the accident mechanism using numerical models (Liang et al., 2015; Wang et al., 2022a; Wang et al., 2022b; Gong et al., 2022). Li S. et al. (2020) discussed the influence of support on tunnel deformation by numerical simulation. Liang et al. (2019) investigated the effect of intermediate principal stress and lateral pressure coefficient on the failure behavior of deep tunnels. Jiang et al. (2022) analyzed the deformation and pressure arch characteristics of roadway face in water-rich sandy dolomite stratum by fluid-solid coupling model and proposed the limit equilibrium theory considering seepage effects and pressure arch characteristics. Yan et al. (2021) studied the mechanism of the collapse of funnel-shaped stratum through numerical simulation and found that the essence of the collapse is the process of converting potential energy into kinetic energy. Besides, on-site monitoring can well reflect the dynamic changes in excavation engineering and the working state of surrounding rock and support (Kavvadas, 2005; Masini et al., 2021). Therefore, researchers have also strived to explain the accident mechanism based on on-site monitoring data such as surface deformation (Liu F. et al., 2022; Wang et al., 2022c), lining stress (Chen B. et al., 2022), water inflow (Liu et al., 2021; Liu J. et al., 2022), and microseismic signal (Cheng et al., 2018; Liu et al., 2019). Previous studies have provided valuable insights into the correlation between disasters and factors such as strata, groundwater, and support, particularly concerning deformation, stress, and strain (Liang et al., 2014; Chen L. et al., 2022; Feng et al., 2022; Li et al., 2023). These investigations have proven instrumental in mitigating the environmental damage arising from excavation activities.
Effective measures are needed to deal with disasters after occurring. Grouting is a widely used method for ground improvement and disaster control (Li et al., 2016) because it can enhance the mechanical strength of formations and reduce the permeability of rock masses by filling the surrounding rock fissures with grouting slurry (Zheng et al., 2021). At the same time, grouted curtains prevent the inrush of water and mud by water channels be plugged (Xue et al., 2021), and effective grouting is very important for ensuring the construction safety. Nevertheless, the grouting effect is influenced by many factors, such as water cement ratio, permeability coefficient, grouting pressure and grouting time (Yang et al., 2008). Zheng et al (2020) analyzed the flowing regularity of grout spreading against flowing groundwater and fluid pressure distribution in a grouting work, and proposed a criterion for risk assessment on overburden stratum uplifting. Li et al (2020b) proposed a method to analyze the slurry diffusion process under hydrodynamic conditions and further summarized the effect of flow rate on slurry diffusion behavior. Li et al (2020c) studied the influence of gypsum on the workability and mechanical properties of grouting material and concluded that gypsum can improve the compressive strength of grouting samples. In practice, the treatment of collapse disaster by grouting has achieved valuable results (Liang et al., 2020; Liu et al., 2020; Zhang et al., 2021; Kang et al., 2022; Zhang et al., 2023). Actually, grouting has played an important role in disaster treatment.
The aim of this study is to elucidate the collapse mechanism of tunnels within composite strata, specifically in situations where upper layers are soft and lower layers are hard, and to assess the efficacy of the grouting scheme. While many previous studies on collapse have employed the simplified uniform stratum model, such models are not directly applicable to the complexities presented by composite strata with distinct soft and hard layers. Consequently, treatment plans must be tailored to address the collapse characteristics specific to such composite formations, ensuring satisfactory outcomes. To achieve this goal, our study first introduces the collapse accident and then conducts a comprehensive analysis of the factors contributing to the disaster. We thoroughly investigate the collapse mechanism in conjunction with a numerical model. Additionally, we evaluate the effectiveness of the grouting scheme at the collapsed area, relying on on-site monitoring data. The findings of this study will serve as a valuable reference for similar projects, offering insights into environmental protection and promoting safe construction practices. Simultaneously, by shedding light on the collapse mechanisms and proposing effective treatment strategies for tunnels in composite strata, the overall understanding and management of construction projects in such geological conditions can be enhanced.
The Kai-sheng section of Qingdao Metro Line Ⅰ connects the Kaifeng Road Station and the Shengli Bridge Station as marked with a red line in Figure 1A. The tunnel section comprises two separate and parallel tunnels with a spacing of 9.8 m. The mileage of the right line of the station-to-station tunnel is YSK45+083.822∼YSK45+915.150, with a total length of 831.328 m. Meanwhile, the left line is ZSK45+083.822∼ZSK45+913.855, with a total length of 830.033 m.
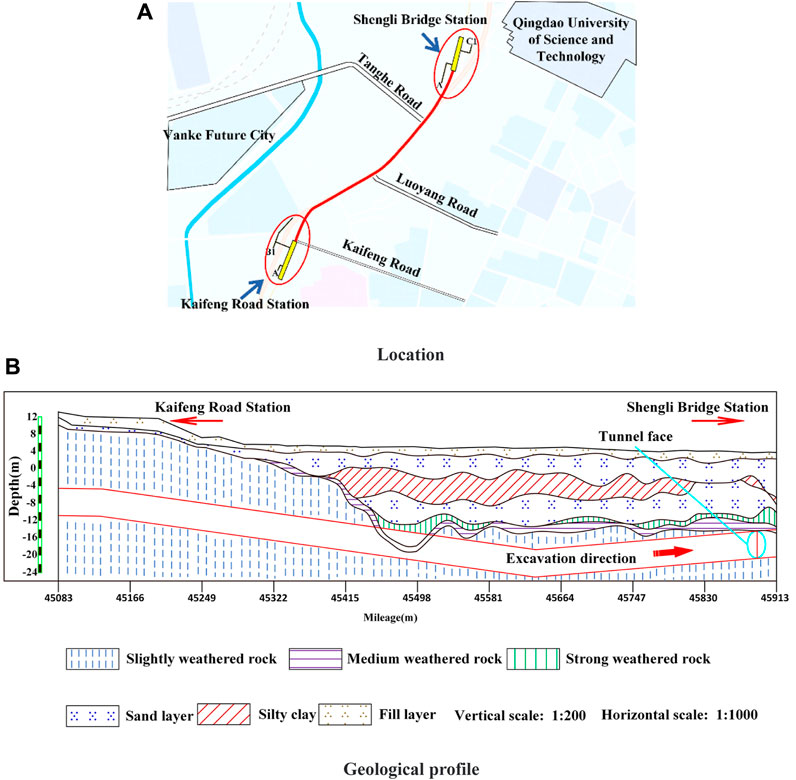
FIGURE 1. The location and geological profile of the Kai-sheng section. (A) Location. (B) Geological profile.
Figure 1B shows the geological profile of Kai-sheng section from mileage ZSK45+083.822 to ZSK45+913.855. With undulating terrain, the ground elevation ranges from 3.7 to 4.3 m, and the buried depth of groundwater level in this tunnel is 1.10–2.10 m. The major strata in the section contains plain fill, silty clay, sand layer with cohesive particles, strong-weathered rock, moderately weathered rock, and relatively complete slightly weathered rock. The granite with lamprophyre and tuff intrusion was the dominant lithology. Simultaneously, the dominant lithology near the Shengli Bridge Station was tuff. In addition, the thickness of sand layer in the section ranges from 1.6 to 12.6 m. Most of the tunnel is located at the slightly weathered rock, while some parts are located at the medium-coarse sand layer and strong-medium weathered rock, with the buried depth of the tunnel is 15.3–22 m. The grade of tunnel surrounding rock is shown in Table 1.
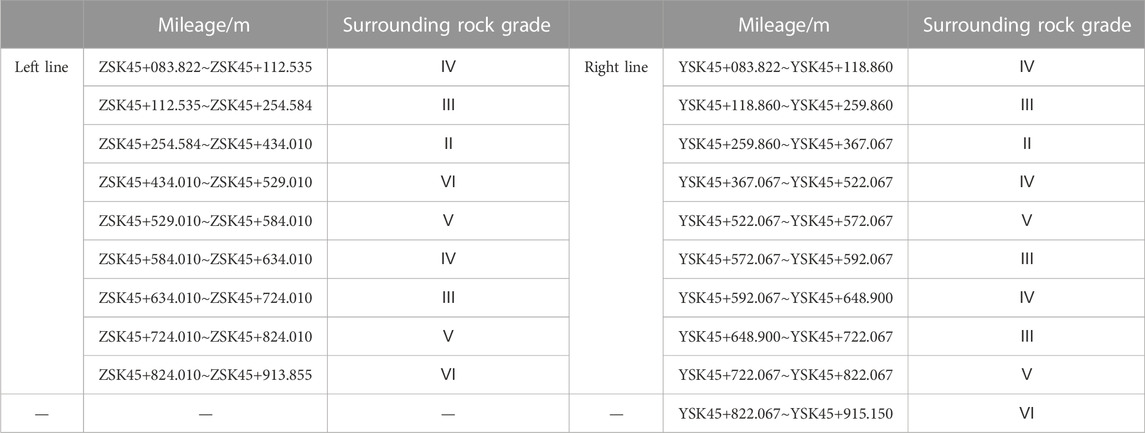
TABLE 1. Classification of tunnel surrounding rock.
The mainly tunnelling method in Kai-sheng section is the benching method, as shown in Figure 2A. It is about 3.2 m high for upper bench, 3.4 m high for lower bench, and 4–5 m long for each bench. The circular excavation footage is adjusted according to different surrounding rock grades, which is 0.5 m in the areas with V and VI surrounding rocks, 0.75 m in the areas with IV surrounding rocks and 1.0–1.5 m in the areas with II and III surrounding rocks. The excavation section was approximately 6.2 m wide and 6.6 m high. The parameters of the tunnel support are shown in Figure 2B. The initial support of the tunnel is composed of grid arches with a vertical spacing of 0.5 m and shotcrete of 300 mm thick C25. The advanced support was performed in such a way that 42 mm leading conduits with a length of 3.0 m and inclination of 15°, were mounted into the rock in the 120° range around the extrados of the tunnel. The secondary lining is the reinforced concrete lining composed of C45 waterproof concrete and steel bars. In the areas with Ⅵ surrounding rocks, the length of the leading conduit was changed to 3.5 m, and the layout scope was expanded to 150° of the tunnel vault.
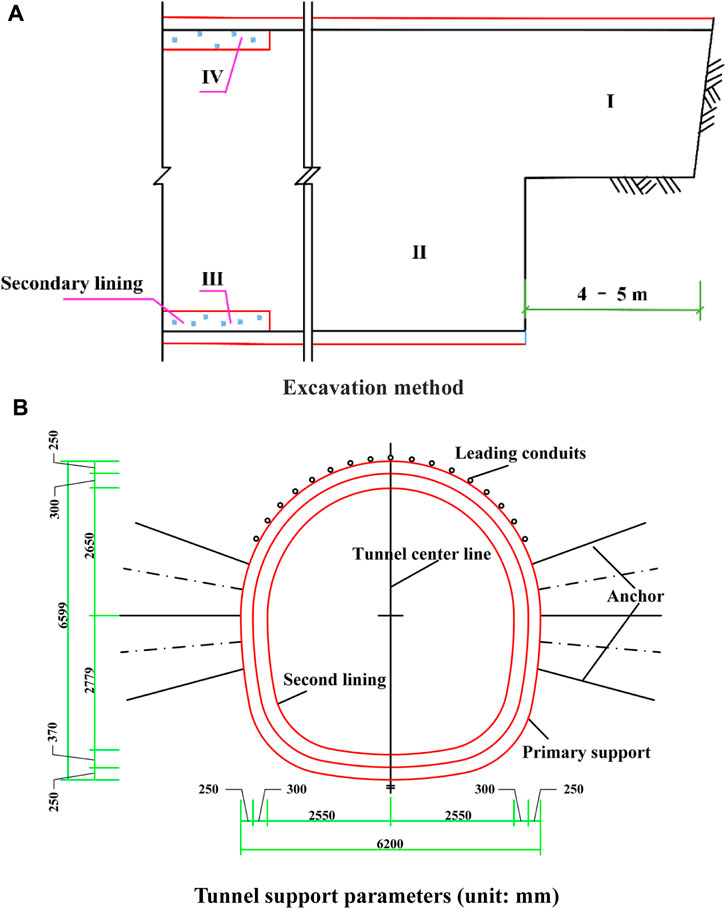
FIGURE 2. The excavation method and tunnel support. (A) Excavation method. (B) Tunnel support parameters (unit: mm).
When the tunnel vault encounters the strong-weathered rock layer and sand layer, the semi-section advanced deep hole grouting, as illustrated in Figure 3, was conducted. A total of 15 boreholes are drilled in the tunnel face, including 7 boreholes I, 5 boreholes II and 3 boreholes III (Figure 3B). Figure 3A shows the single-hole depth and inclination of three different boreholes with a diameter of 89 mm, i.e., the borehole I has a single-hole depth of 7.1 m and inclination of 31.7°, the borehole II has a single-hole depth of 10.9 m and inclination of 23.7°, the borehole III has a single-hole depth of 10.2 m and inclination of 11.9°. Cement-water glass slurry is used as grouting material. The grouting reinforcement was conducted in an area within 3 m of the initial support of the tunnel contour line (Figure 3B). Before the first cycle of construction, C25 shotcrete with a thickness of 300 mm was sprayed on the working face to serve as a pulp wall, and then grouting is performed (Figure 3A). In the subsequent construction of 10 m per cycle, 7 m will be excavated and 3 m will be reserved as sealing batholite (Figure 3A).
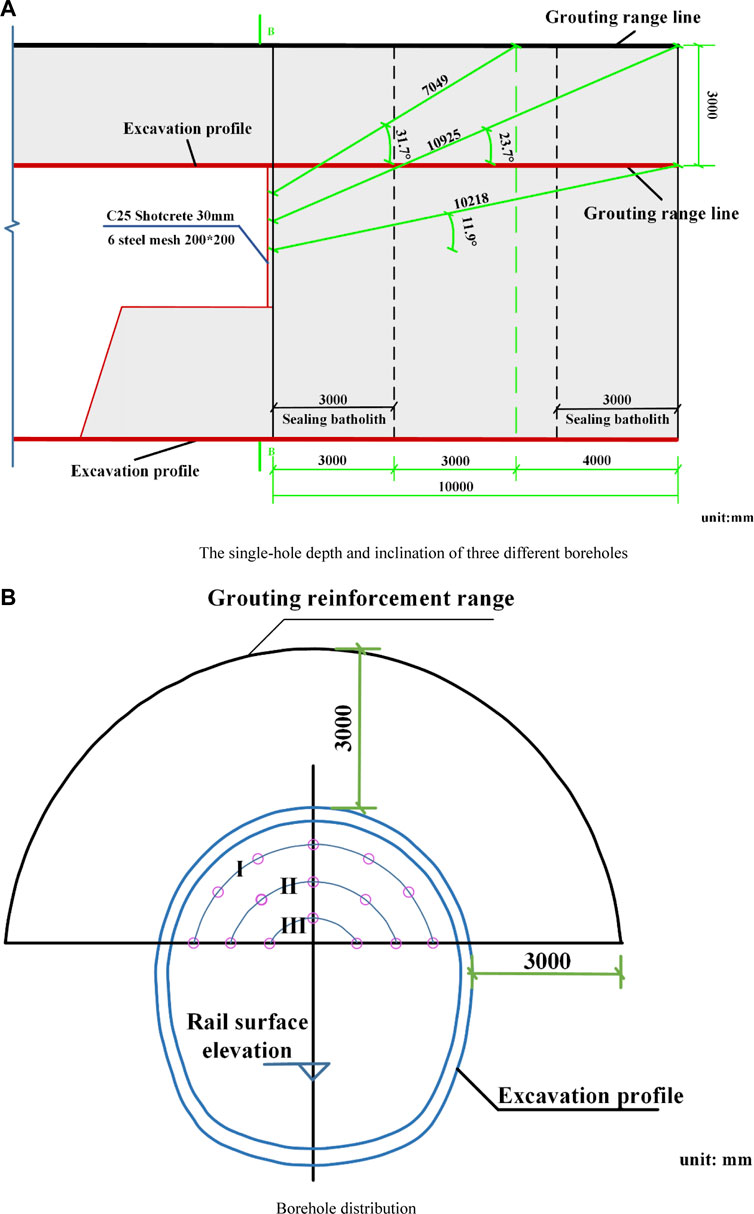
FIGURE 3. Schematic diagram of semi-section advanced deep hole grouting. (A) The single-hole depth and inclination of three different boreholes. (B) Borehole distribution.
On 4 July 2019, the section with a mileage of ZSK45+891.5 on the left line collapsed at a distance of 16.5 m from the end of the Shengli Bridge Station, as shown in Figure 4A. This disaster evolved from partial water seepage on the tunnel face into water and sand inrush, and eventually formed ground collapse. After the disaster, an obvious pit with the diameter and depth of about 10 m and 7 m was formed on the ground, as shown in Figure 4B. It can be seen from the picture that the underground pipelines and surrounding buildings were destroyed, and the observed cave after the collapse is shown in Figure 4C. Furthermore, after the collapse, a large amount of sediment was accumulated in the tunnel, and it flowed as far as the second transverse channel about 206 m away from the tunnel face, where the sediment accumulation depth was about 1.3 m (Figure 4C). Figure 4C shows that the surrounding rocks of the working face were in good condition, the collapse cavity in the tunnel did not extend to the front of the working face, and the completed grid steel frame of the upper bench of the tunnel only partially sunk, and no grid steel frame collapse occurred. The volume of mud was approximately 1,888.945 m3 estimated from the sections of secondary lining and primary lining of the tunnel. The evolution of the disaster is shown in Figure 4D, and it takes only 1 minute from the discovery of water and sand inrush on the face to the ground collapse. In addition, in this disaster, one people death and direct economic losses of 2.69 million RMB.
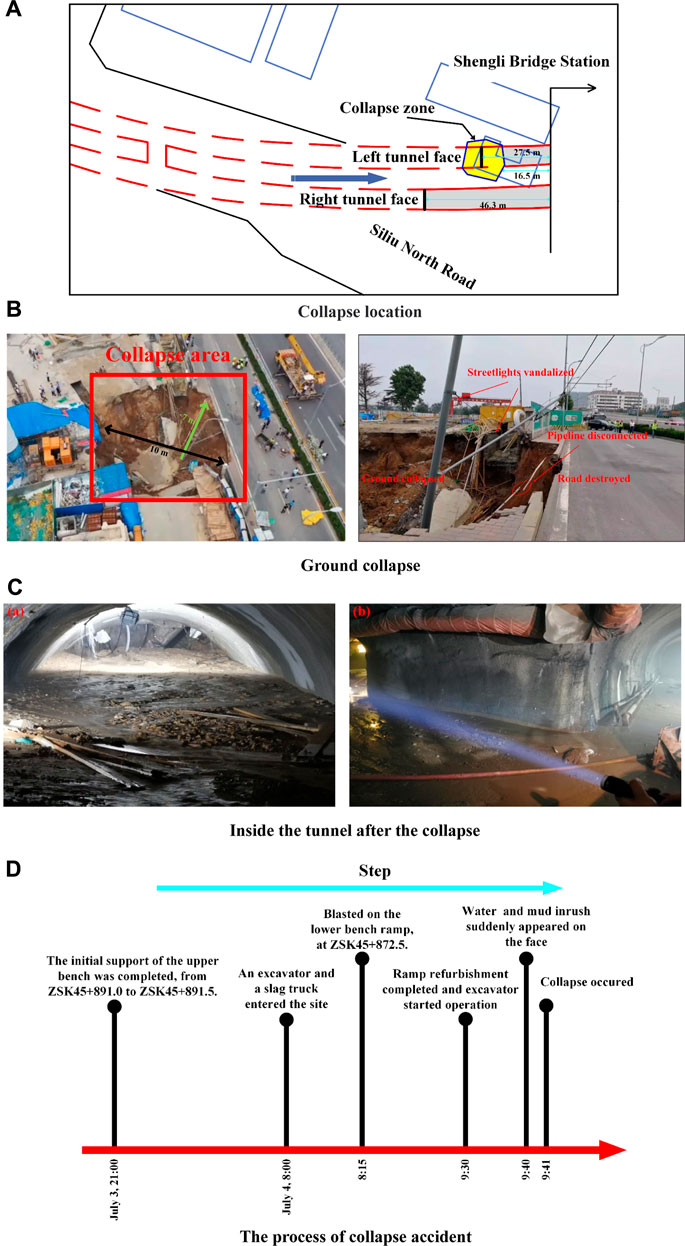
FIGURE 4. The observed collapse accident. (A) Collapse location. (B) Ground collapse. (C) Inside the tunnel after the collapse. (D) The process of collapse accident.
In order to understand the impact of the construction on the surrounding environment and ensure the construction safety, many monitoring points were placed on the surface to record the ground settlement, as shown in Figure 5. The interval between two adjacent monitoring points for ground surface settlement, e.g., DC22 and DC23, is about 20 m. Figure 6 shows the variations of ground settlement from 4 June to 3 July 2019. It can be observed that the settlement increased rapidly at DC21, DC22 and DC24 from 9 June to 13 June During this period, the average settlement rate at DC21-2 was the largest, i.e., 0.57 mm/d. After 13 June, the deformation at the three points fluctuated slightly. But on 25 June, the sudden changes of settlement occurred again at DC21, DC22 and DC24. At this time, the settlement rate at DC21-4 was the largest, reaching 0.72 mm/d. After 27 June, the monitor values of three points fluctuated slightly. In particular, the surface deformation fluctuation of DC23 was relatively obvious, changing from heave to subsidence on 7 June, and from subsidence to heave on 12 June From 17 June to 30 June, the surface deformation at DC23 exhibited continuous subsidence at other times except for slight fluctuation around June 23. Furthermore, from June 28 to 30, the settlement of this point showed a slight acceleration, with an average settlement rate of 0.18 mm/d, which was higher than the previous 5 days of 0.06 mm/d. Besides, the largest monitor value is 2.81 mm at DC21-2.
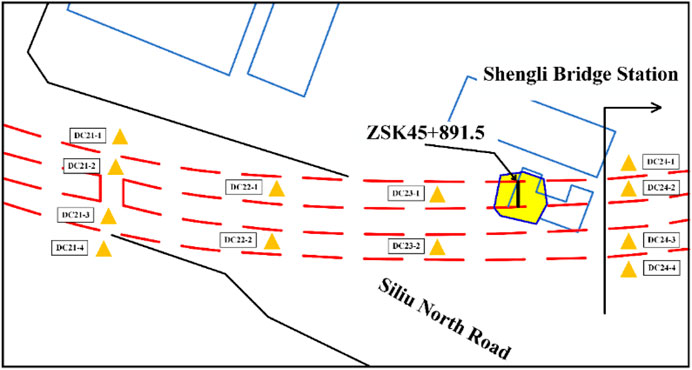
FIGURE 5. Distribution of monitoring points.
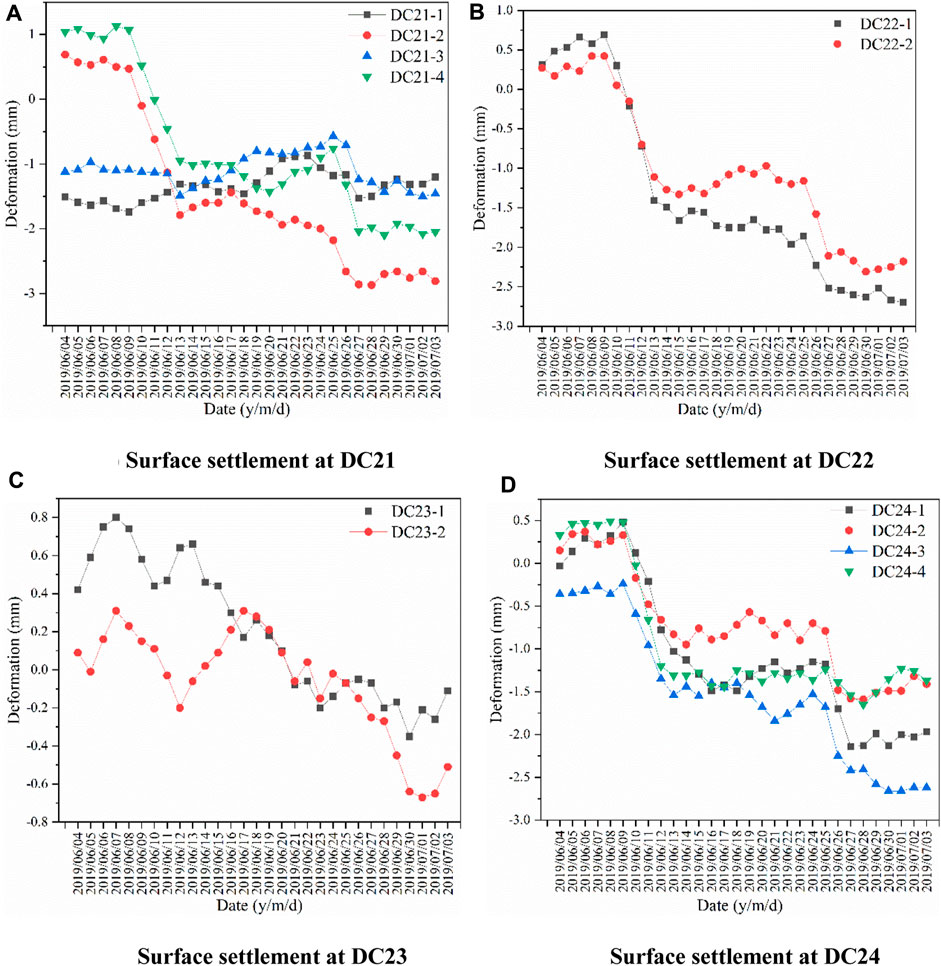
FIGURE 6. Surface settlement before collapse. (A)Surface settlement at DC21 (B) Surface settlement at DC22. (C) Surface settlement at DC23 (D) Surface settlement at DC24.
According to the Code for monitoring measurement of urban rail transit engineering (Ministry of Housing and Urban-Rural Development of the People’s Republic of China, 2013), the critical warning value for ground surface settlement of tunnel in this study is 30 mm, and the average deformation rate and maximum deformation rate are 2 and 5 mm/d. Actually, the monitor values of all monitoring points did not reach the critical warning value. The maximum settlement value and settlement rate were 2.81 mm and 0.72 mm/d, respectively, which were much smaller than the settlement warning value. In this respect, this collapse occurred abruptly without obvious portent. But the sudden changes of deformation rates that occurred several times were abnormal. These neglected abnormal phenomena should be paid enough attention, which may avoid the disaster.
The collapse occurring at ZSK45+891.5 was located at the area with VI surrounding rocks, where the rock mass was relatively soft and extremely fractured, with developed joint fissures and high permeability. The buried depth of the tunnel in collapse zone was about 18.5 m. The strata comprise a 2 m plain fill layer, a 13 m medium-coarse sand layer, a 2 m strong and moderately weathered layer, and the slightly weathered rock layer. The tunnel was located entirely in the slightly weathered rock layer. The rock mass of strongly and moderately weathered rock was broken, with developed joints and fissures and low bearing capacity. Meanwhile, the sand particles with little cementation were prone to loss under the groundwater. The accident occurred in July, i.e., the rainy season in the Qingdao, when rainfall accounted for 68.3% of the annual rainfall. In the month before the collapse, there were seven rainfalls, and the last rainfall was on 2 July, 2 days before the accident. The accumulated rainfall in June was 44.7 mm. Numerous rainfalls caused the groundwater level to rise.
In terms of construction, the tunnel was excavated by blasting method. The blasting vibration will cause the tensile failure and crack expansion of the rock masses (Liu N. et al., 2022), and crack will reduce the bearing capacity of surrounding rock and provide seepage paths. At around 8:15 a.m. on 4 July, blasting operations were performed at ZSK45+872.5 approximately 86 min before the collapse (Figure 4). Simultaneously, the field investigation revealed that there was a large gap between the initial support of the tunnel vault and the excavation face, causing the surrounding rocks to be exposed without adequate support for a long time.
In this section, the numerical model was performed to study the surface deformation, and to analyze the evolution of collapse. Based on the practical geological of the tunnel from ZSK 45+816.5 to ZSK 45+937.00, the 3D finite element numerical model was established by Midas GTX NX, as shown in Figure 7. The model size was 100 m×120.5 m×56 m, and the buried depth of tunnel was 18.5 m. In the model, the mechanical properties of strata are shown in Table 2. Meanwhile, considering the deterioration of surrounding rock caused by seepage, blasting and other factors, the values of c and
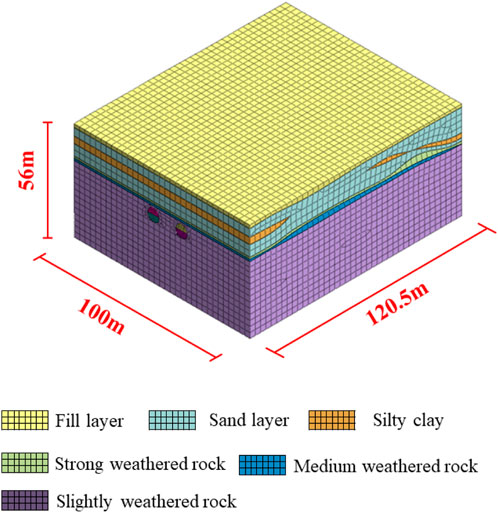
FIGURE 7. The numerical model.
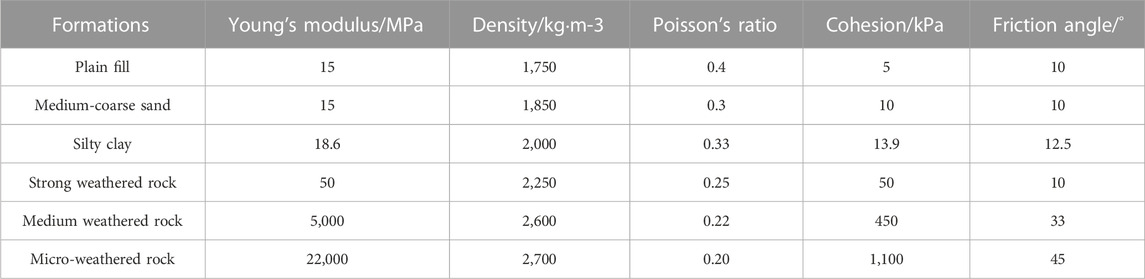
TABLE 2. Physical and mechanical parameters of rock and soil mass.
Figure 8 shows the ground settlement during the excavation process. The settlement occurred above the tunnel after the excavation of the first bench, and the maximum settlement was −2.525 mm. The surface deformation gradually increased with the advancement of the tunnel face. When the left line was excavated to ZSK45+886.5, the maximum settlement was −6.325 mm, and the point with the maximum settlement during this process was always above the first bench. When the left line was excavated to ZSK45+891.5, i.e., the collapse mileage, the maximum settlement point appeared above the working face, and the maximum settlement at this time was −7.788 mm.
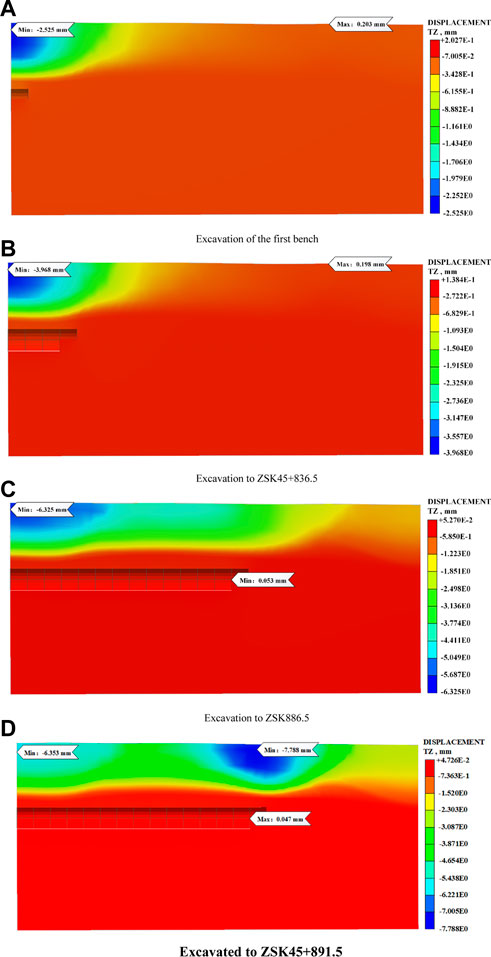
FIGURE 8. Settlement cloud of simulated excavation. (A) Excavation of the first bench. (B) Excavation to ZSK45+836.5. (C) Excavation to ZSK886.5. (D) Excavated to ZSK45+891.5.
After the simulated excavations, an annular settlement pit appeared on the model surface, which agrees with the actual situation, as shown in Figure 9. As the settlement value of the center point of the settlement pit was the largest, the deformation data of this point during the excavation was extracted, and the deformation curve is shown in Figure 10. At the early stage of tunnel excavation, this point was far away from the heading face, and was slightly affected by tunnel excavation. With the advancement of the tunnel face, the deformation rate at this point was gradually accelerated. When the tunnel face was excavated to 5 m in front of the collapse tunnel face, the maximum deformation rate was 0.587 mm/(excavation step). Then, the deformation suddenly changed when the tunnel face was excavated to the collapse zone. The point deformation increased sharply from −3.212 mm to −7.788 mm with a deformation rate of 4.576 mm/(excavation step), which is 8 times the deformation rate of the previous excavation step.
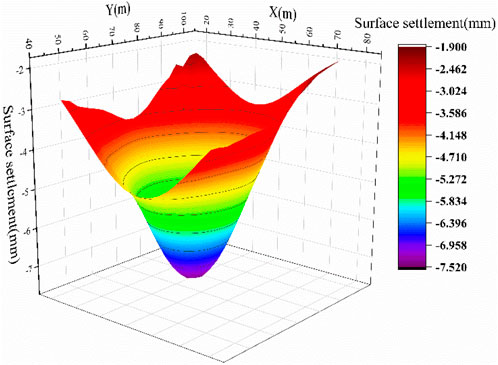
FIGURE 9. The settlement pit on the model surface.
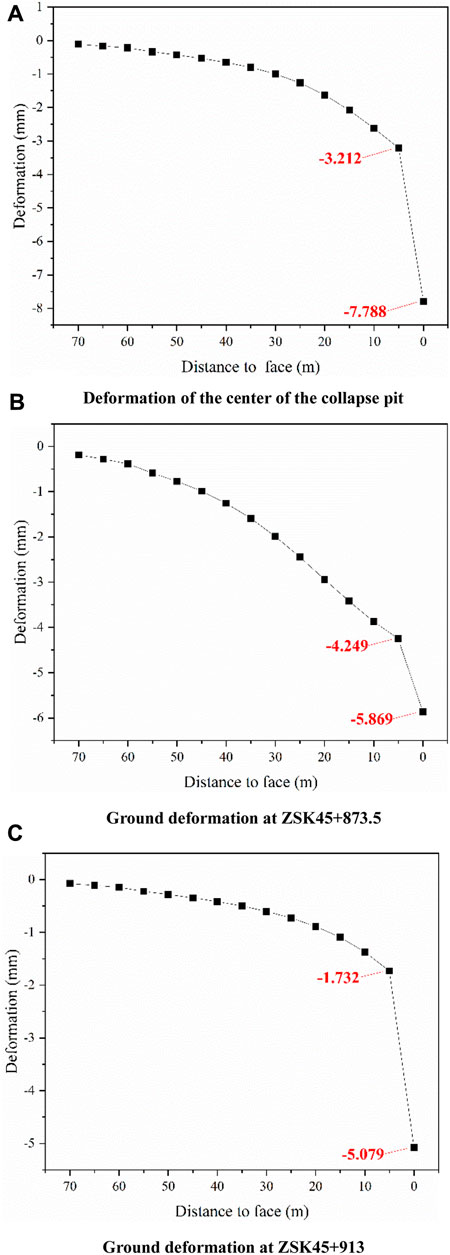
FIGURE 10. Deformation at different locations. (A) Deformation of the center of the collapse pit. (B) Ground deformation at ZSK45+873.5. (C) Ground deformation at ZSK45+913.
Figure 6 shows that there was a sudden change of the deformation rate at the monitoring points before and after the accident face. Thus, the deformation data of about 20 m before and after the accident face in the model was extracted, and the date are shown in Figures 10B, C. As shown in the two figures, the deformation rate of the two places changed sharply when the excavation reached the collapse zone. At mileage ZSK45+873.5, the deformation caused by the last excavation step was 1.620 mm, which is 4.3 times of the previous step. At mileage ZSK45+913, the deformation caused by the last excavation step was 3.347 mm, which is 9.3 times of the previous step.
By comprehensively analyzing the on-site monitoring data and simulation date, the sudden change of deformation rate during tunnel excavation can be treated as an effective precursor information for the accident.
To further clarity the causes of the collapse, the influence of groundwater and supporting conditions on the surface settlement was analyzed in this section. The influence of groundwater on surface settlement should be considered due to the large content of groundwater at the Kai-sheng section and abundant underground seepage recharge. In Section 3.2.1, the initial water level of the model was set below the plain fill at the interface with the sand layer, which is -2 m. This water level was taken as the case 1, and four control cases of case 2 (−4 m), case 3 (-8 m), case 4 (−12 m), and case 5 (−16 m) were presented under the same construction conditions. The deformation of the center point of the settlement pit after the excavation of different cases were compared, and the results are shown in Figure 11. As the water table decreases, the settlement in case 2, case 3, case 4 and case 5 decreased from −7.788 mm to −7.729, −5.657, −4.885, and −4.127 mm, respectively. In case 2, the settlement at this point caused by last step was 4.517 mm, which was 7.7 times of the previous step. In other cases, the settlement at this point caused by last step were 4.2 times, 2.9 times and 1.6 times of the previous step.
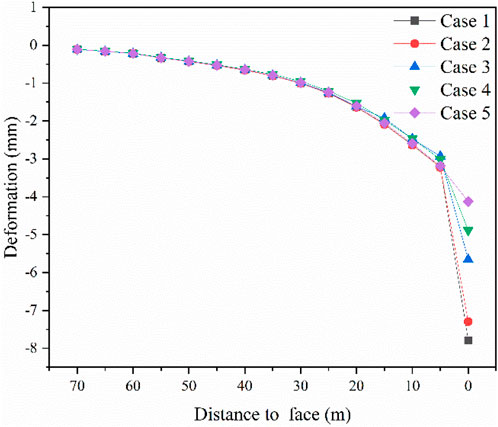
FIGURE 11. Surface settlement at different groundwater levels.
The influence of supporting conditions on deformation was analyzed in this section. In the above-mentioned model, only 3 m was supported after the last excavation step, and 2 m suspended gap was set between the initial support and the tunnel face. The other construction parameters remained unchanged. With the variation of the suspension space between the support and the working face, two control groups with the suspension space of 1 and 0 m (complete support) were presented to compare the deformation of the center point of settlement pit in the excavation process. The results are shown in Figure 12.
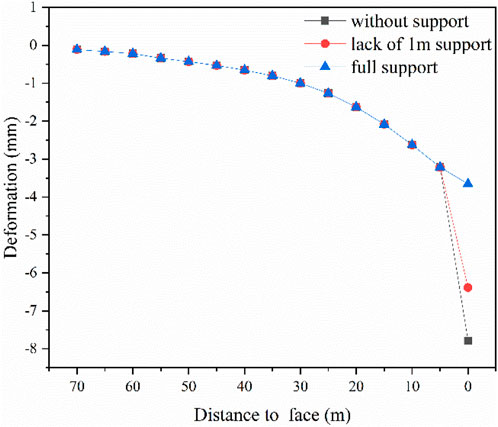
FIGURE 12. Surface settlement under different support conditions.
From Figure 12, it can be seen that the deformation curves of the three groups of models basically coincided when the excavation face advance to 5 m away from the accident face. The deformation at this point was −6.387 mm as excavated to the accident zone with a 1 m wide suspension gap, which was 1.401 mm less than that when there was a 2 m wide suspension gap. Under this condition, there was still a sudden change, and the deformation caused by the last excavation step was 3.175 mm and 5.4 times larger than the previous excavation step. However, when fully supported, the deformation at this point was −3.654 mm as excavated to the accident zone, which was 4.134 mm less than that when there was a 2 m wide suspension gap. At this time, the deformation of the last excavation step was 0.442 mm, which was 0.72 times of the previous step. Indicating that the appropriate supporting system can effectively reduce the deformation caused by excavation.
According to the above analysis, this collapse accident was essentially a partial failure caused by the incomplete support and the groundwater under poor surrounding rock (Grade VI).
The groundwater is rich in collapsed zone, with a historical groundwater level of 1.10–2.10 m. However, the tunnel excavation broke the original equilibrium state, making the groundwater flow towards the tunnel, and the seepage pressure increased the deformation of surrounding rock. Besides, the exposed surrounding rock bore the upper water and soil pressure alone in the absence of support. Hence, the deformation of surrounding rock at this area was larger than that in the case of joint support. Under the seepage pressure, the exposed surrounding rock mass constantly deformed and eventually lost its stability. Furthermore, a large amount of groundwater and sediment flowed into the tunnel along the water inrush channel, resulting in water and sand inrush in the tunnel. Driven by the water flow, the sand particles with poor cohesion gradually lost, leading to the destruction of the sand layer and its development to upper layer. The plain fill began to destroy as the sand below flowed away and lost its capacity.
After collapse occurred, a set of remedy measures were conducted. To prevent the expansion of the ground collapse, first the clayey soil and concrete were used to backfill the cave-in. And then the grouting reinforcement was applied to the cave-in. In this section, the grouting reinforcement plan of ground after the collapse was introduced. The grouting reinforcement plan includes filling grouting and systematic grouting. First, fill and grout the lower part of the concrete plate to ensure the stability of the concrete plate and construction safety. And then, under the concrete plate and near the tunnel face, the systematic grouting was conducted on the surrounding rock to achieve the purpose of reinforcement and water plugging, which ensures the safety of the tunnel. The layout of the filling grouting boreholes is shown in Figure 13. In total, five grouting boreholes with a spacing of 3 m and depth of 7 m, were set in the ground surface above the working face.
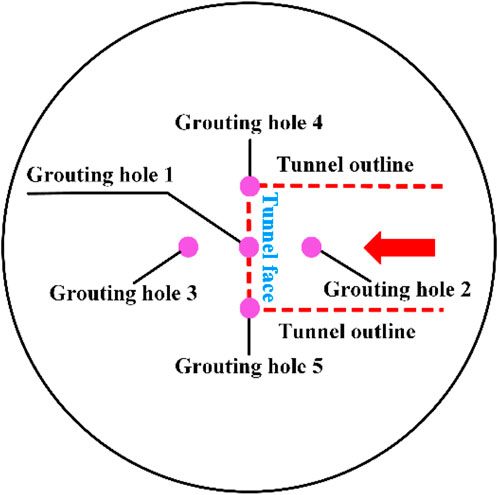
FIGURE 13. Distribution of filling grouting holes.
The grouting range and boreholes arrangement of the systematic grouting are shown in Figure 14. Five rows of boreholes were staggered at 4 m in front of and behind the tunnel face, and 4.5 m outside the tunnel contour line with a spacing of 2 and 3 m. The depth of the boreholes in the middle was 15 m, and was 18 m (reaching the bedrock) in both sides. An expandable device was used to plug the gap between the steel casing and the borehole wall, and apply horizontal pressure to the surrounding formation to form an artificial sealing batholite above the target reinforcement area. The progressive segmental grouting process was used to reinforce the targeted area with the reinforcement depth is 7 m (concrete plate) below to the tunnel vault.
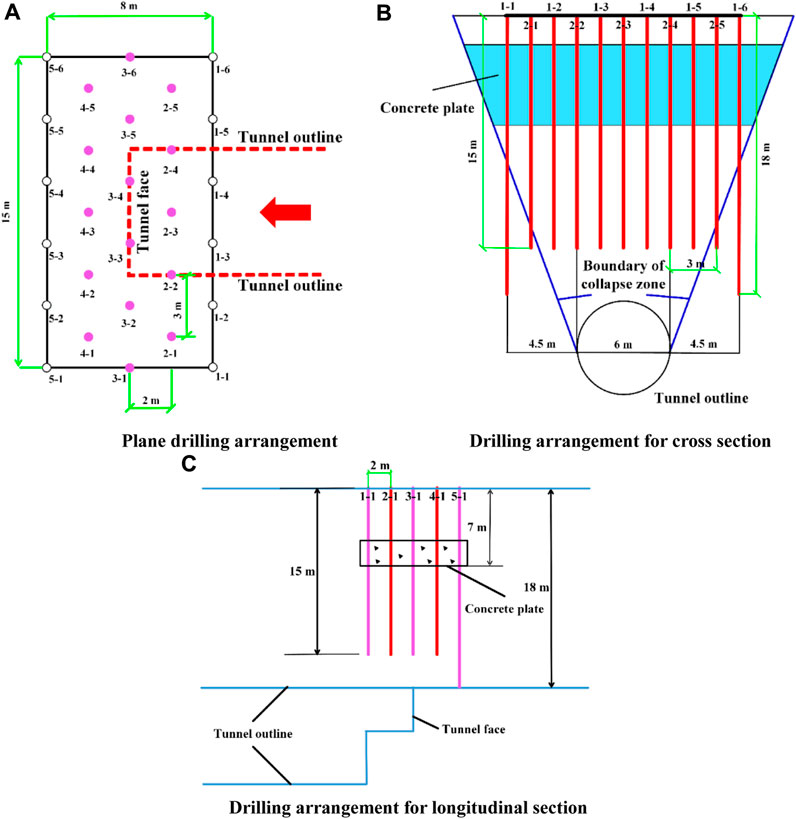
FIGURE 14. Drilling arrangement for systematic grouting. (A) Plane drilling arrangement. (B) Drilling arrangement for cross section. (C) Drilling arrangement for longitudinal section.
The groundwater can cause the dispersion of single-liquid cement slurry during grouting, which makes it difficult to achieve the expected reinforcement effect. Considering that cement-water glass slurry owned shorter setting time and higher stone strength under water-rich conditions than single-liquid cement slurry, it was selected as grouting material for grouting reinforcement and the gel time of slurry was adjusted within 20s. Because large grouting pressure is likely to cause ground heave during the grouting of shallow tunnel in sandy soil stratum (Dong et al., 2022), the grouting pressure was 0.1–0.2 MPa during on-site grouting.
After the accident, the tunnel was filled with concrete, and the area was re-excavated after grouting. Meanwhile, the ground surface deformation after tunnel advance resumed was monitored. Figure 15 shows the monitor values during the subsequent excavation of the tunnel, from 8 August to 29 September 2019. Figure 15A shows the variations of ground settlement at DC22 from 8 August to 29 September The largest settlement value, approximately −3.89 mm occurred at DC22-1. The variation at point DC22-1 can be divided into three stages, including continuous decrease stage (before 22 August), continuous increase stage (22 August—8 September) and stable stage (after 8 September). From 8 August to 22 August, the settlement value at this point increased from −2.99 mm to −3.89 mm with an average deformation rate of 0.06 mm/d. From 22 August to 8 September, the ground heave value at this point was 1.43 mm with an average deformation rate of 0.08 mm/d. After 8 September, the monitor values at this point were −2.65, −2.35, −2.31 mm, respectively, indicating that the deformation tended to be stable. On the other hand, the deformation at DC22-2 fluctuated slightly. The monitor values at this point were −2.31, −2.33 mm, −2.35 and −2.32 mm, respectively during the period from 8 August to 8 September After 8 September, the ground surface began to heave. The ground heave value at this point was 0.55 mm with an average deformation rate of 0.03 mm/d, from 8 September to 29 September.
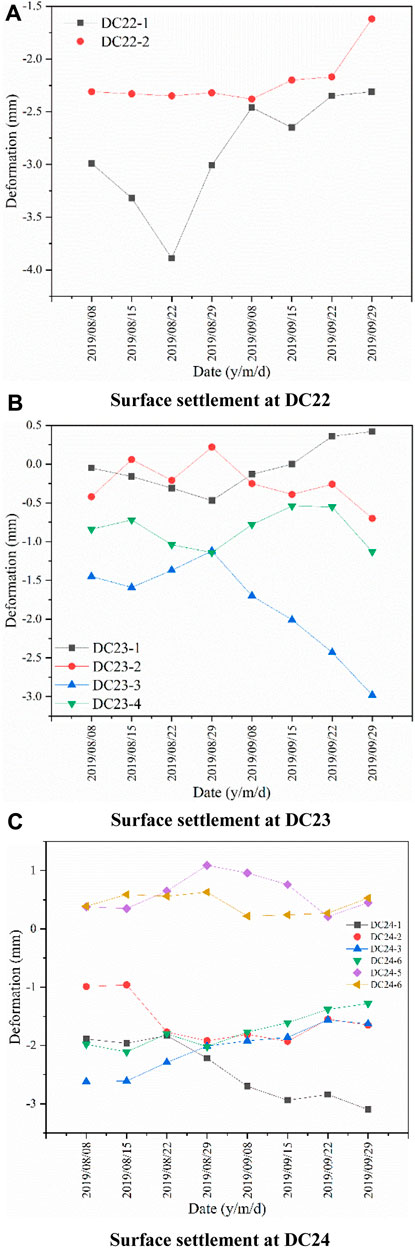
FIGURE 15. Surface settlement after re-excavation. (A) Surface settlement at DC22. (B) Surface settlement at DC23. (C) Surface settlement at DC24.
Figure 15B shows the variations of ground settlement at DC23 from 8 August to 29 September The variation at point DC23 can be divided into two stages, i.e., Stage 1 from 8 August to 29 August, and Stage 2 from 29 August to 29 September In Stage 1, the ground surface at DC23-1 and DC23-4 settled slowly while the ground surface at DC23-2 and DC23-3 heaved. The deformation value at DC23-2 was 0.64mm, which is the largest of these points. The average deformation rates of DC23-1, DC23-2, DC23-3 and DC23-4 were 0.02, 0.03, 0.02 and 0.01 mm/d, respectively. In Stage 2, the ground surface at DC23-1 and DC23-4 heaved while the ground surface at DC23-2 and DC23-3 settled. The deformation value at DC23-3 was 1.86 mm, which is the largest of these points. The average deformation rates of DC23-1, DC23-2 and DC23-3 were 0.03, 0.03, and 0.06 mm/d, respectively. In particular, the ground surface at DC23-4 settled after 22 September, and the settlement value was 0.58 mm.
Figure 15C shows the variations of ground settlement at DC24 from 8 August to 29 September DC24-5 and DC24-6 were two monitoring points added after the collapse. From this picture, we can see that, the fluctuation of DC24 is slightly. The largest settlement value, approximately −3.10 mm occurred at DC24-1. The average deformation rates of DC24-1, DC24-2, DC24-3, and DC24-4 were 0.02, 0.01, 0.02 and 0.01 mm/d, respectively. The average deformation rate at DC24-5 was 0.03 mm/d, from 8 to 29 August, and was 0.02 mm/d from 29 August to 29 September The monitor value at DC24-6 was stable. In particular, the largest average deformation rate, approximately 0.1 mm/d occurred at DC24-2 from 15 to 22 August.
Following the implementation of the support measures, the surface deformation remained well below the critical warning level throughout the re-construction period. Moreover, there were no sudden changes or subsequent collapses observed until the completion of the entire tunnel project. This unequivocally indicates that the grouting scheme employed was highly successful in achieving its intended objectives.
To elucidate the collapse mechanism of tunnels within composite strata, specifically in situations where upper layers are soft and lower layers are hard, and to assess the efficacy of the grouting scheme, our study first introduced the collapse accident of the Qingdao Metro Line Ⅰ and then conducted a comprehensive analysis of the factors contributing to the disaster. Furthermore, the effectiveness of the grouting scheme at the collapsed area was evaluated. The main conclusions can be drawn as follows:
1) The monitoring data from all observation points did not reach the critical warning threshold. However, there were several instances of abrupt changes in deformation rates. Notably, during the simulation, when the tunnel excavation reached the collapse zone, there was a sharp increase in surface deformation. As a result, these sudden deformations observed during tunnel excavation can be considered as valuable precursor information for potential accidents.
2) Drawing upon the field survey and numerical simulation, it was determined that the collapse accident was primarily a result of partial failure, triggered by inadequate support measures and the presence of groundwater in the context of poor surrounding rock conditions (Grade VI). The failure of the surrounding rocks in the tunnel vault occurred under the influence of high seepage pressure, leading to the influx of water and sand into the tunnel, ultimately culminating in ground collapse.
3) Following the collapse incident, the central area of the collapsed structure underwent reinforcement through a combination of filling grouting and systematic grouting techniques. Subsequently, upon resuming tunnel advancement, the surface deformation remained below the critical warning threshold, affirming the success and effectiveness of the collapse treatment measures implemented.
The original contributions presented in the study are included in the article/supplementary material, further inquiries can be directed to the corresponding author.
LZ: Data curation, Formal Analysis, Investigation, Validation, Writing–original draft. ZW: Formal Analysis, Investigation, Validation, Visualization, Writing–review and editing. WZ: Conceptualization, Methodology, Supervision, Writing–review and editing, Resources. SL: Validation, Visualization, Writing–review and editing.
The authors declare financial support was received for the research, authorship, and/or publication of this article. This work is supported by the Demonstration Project of Benefiting People with Science and Technology of Qingdao, China (Grant No. 23-2-8-cspz-13-nsh), the Shandong Provincial Natural Science Foundation, China (Grant No. ZR2022QD102), the National Natural Science Foundation of China, China (Grant No. 42272334), and the Open Project Program of Engineering Research Center of Concrete Technology under Marine Environment, Ministry of Education, China (Grant No. TMduracon2022029).
The authors declare that the research was conducted in the absence of any commercial or financial relationships that could be construed as a potential conflict of interest.
All claims expressed in this article are solely those of the authors and do not necessarily represent those of their affiliated organizations, or those of the publisher, the editors and the reviewers. Any product that may be evaluated in this article, or claim that may be made by its manufacturer, is not guaranteed or endorsed by the publisher.
Alija, S., Torrijo, F. J., and Quinta-Ferreira, M. (2014). Study of the unexpected collapse of the Ampurdán tunnel (Spain) using a finite elements model. Bull. Eng. Geol. Environ. 73, 451–463. doi:10.1007/s10064-013-0534-z
Bayati, M., and Hamidi, J. K. (2017). A case study on TBM tunnelling in fault zones and lessons learned from ground improvement. Tunn. Undergr. Space Technol. 63, 162–170. doi:10.1016/j.tust.2016.12.006
Chen, B., Gong, B., Wang, S., and Tang, C. (2022a). Research on zonal disintegration characteristics and failure mechanisms of deep tunnel in jointed rock mass with strength reduction method. Mathematics 10, 922. doi:10.3390/math10060922
Chen, L., Wang, Z., Wang, Y., Bai, X., and Lai, J. (2022b). Characteristics and failure analysis of a railway tunnel collapse influenced by cavity in phyllite strata. Eng. Fail. Anal. 142, 106794. doi:10.1016/j.engfailanal.2022.106794
Cheng, S., Li, S., Li, L., Shi, S., Zhou, Z., and Wang, J. (2018). Study on energy band characteristic of microseismic signals in water inrush channel. J. Geophys. Eng. 15 (5), 1826–1834. doi:10.1088/1742-2140/aaba28
Dong, Z., Zhang, X., Tong, C., Chen, X., Feng, H., and Zhang, S. (2022). Grouting-induced ground heave and building damage in tunnel construction: a case study of Shenzhen metro. Undergr. Space 7 (6), 1175–1191. doi:10.1016/j.undsp.2022.04.002
Feng, X., Gong, B., Cheng, X., Zhang, H., and Tang, C. (2022). Anisotropy and microcrack-induced failure precursor of shales under dynamic splitting. Geomatics, Nat. Hazards Risk 13, 2864–2889. doi:10.1080/19475705.2022.2137440
Fernández, F., Rojas, J. E., Vargas, E. A., Velloso, R. Q., and Dias, D. (2021). Three-dimensional face stability analysis of shallow tunnels using numerical limit analysis and material point method. Tunn. Undergr. Space Technol. 112, 103904. doi:10.1016/j.tust.2021.103904
Font-Capó, J., Vázquez-Suñé, E., Carrera, J., Martí, D., Carbonell, R., and Pérez-Estaun, A. (2011). Groundwater inflow prediction in urban tunneling with a tunnel boring machine (TBM). Eng. Geol. 121 (1-2), 46–54. doi:10.1016/j.enggeo.2011.04.012
Fraldi, M., and Guarracino, F. (2009). Limit analysis of collapse mechanisms in cavities and tunnels according to the Hoek-Brown failure criterion. Int. J. Rock Mech. Min. Sci. 46 (4), 665–673. doi:10.1016/j.ijrmms.2008.09.014
Fraldi, M., Cavuoto, R., Cutolo, A., and Guarracin, F. (2019). Stability of tunnels according to depth and variability of rock mass parameters. Int. J. Rock Mech. Min. Sci. 119, 222–229. doi:10.1016/j.ijrmms.2019.05.001
Gattinoni, P., Consonni, M., Francani, V., Leonelli, G., and Lorenzo, C. (2019). Tunnelling in landslide areas connected to deep seated gravitational deformations: an example in Central Alps (northern Italy). Tunn. Undergr. Space Technol. 93, 103100. doi:10.1016/j.tust.2019.103100
Gong, B., Liang, Z., and Liu, X. (2022). Nonlinear deformation and failure characteristics of horseshoe-shaped tunnel under varying principal stress direction. Arabian J. Geosciences 15, 475. doi:10.1007/s12517-022-09678-z
Hencher, S. R. (2019). The Glendoe tunnel collapse in Scotland. Rock Mech. Rock Eng. 52, 4033–4055. doi:10.1007/s00603-019-01812-w
Inokuma, A., and Inano, S. (1996). Road tunnels in Japan: deterioration and countermeasures. Tunn. Undergr. Space Technol. 11 (3), 305–309. doi:10.1016/0886-7798(96)00026-0
Jiang, Y., Zhou, P., Zhou, F., Lin, J., Li, J., Lin, M., et al. (2022). Failure analysis and control measures for tunnel faces in water-rich sandy dolomite formations. Eng. Fail. Anal. 138, 106350. doi:10.1016/j.engfailanal.2022.106350
Kang, H., Li, W., Gao, F., and Yang, J. (2022). Grouting theories and technologies for the reinforcement of fractured rocks surrounding deep roadways. Deep Undergr. Sci. Eng. 2 (1), 2–19. doi:10.1002/dug2.12026
Kavvadas, M. J. (2005). Monitoring ground deformation in tunnelling: current practice in transportation tunnels. Eng. Geol. 79 (1-2), 93–113. doi:10.1016/j.enggeo.2004.10.011
Kitchah, F., Benmebarek, S., and Djabri, M. (2021). Numerical assessment of tunnel collapse: a case study of a tunnel at the East-West Algerian highway. Bull. Eng. Geol. Environ. 80, 6161–6176. doi:10.1007/s10064-021-02318-y
Leca, E., and Dormieux, L. (1990). Upper and lower bound solutions for the face stability of shallow circular tunnels in frictional material. Geotechnique 40 (4), 581–606. doi:10.1680/geot.1990.40.4.581
Li, S., Liu, R., Zhang, Q., and Zhang, X. (2016). Protection against water or mud inrush in tunnels by grouting: a review. J. Rock Mech. Geotechnical Eng. 8 (5), 753–766. doi:10.1016/j.jrmge.2016.05.002
Li, S., Pan, D., Xu, Z., Lin, P., and Zhang, Y. (2020a). Numerical simulation of dynamic water grouting using quick-setting slurry in rock fracture: the Sequential Diffusion and Solidification (SDS) method. Comput. Geotechnics 122, 103497. doi:10.1016/j.compgeo.2020.103497
Li, Z., Wang, L., Feng, B., Xiao, J., Zhang, Q., Li, L., et al. (2020b). Comprehensive collapse investigation and treatment: an engineering case from qingdao expressway tunnel. J. Clean. Prod. 270, 121879. doi:10.1016/j.jclepro.2020.121879
Li, Z., Zhang, J., Li, S., Gao, Y., Liu, C., and Qi, Y. (2020c). Effect of different gypsums on the workability and mechanical properties of red mud-slag based grouting materials. J. Clean. Prod. 245, 118759. doi:10.1016/j.jclepro.2019.118759
Li, Y., Zhou, G., Li, T., Tang, C., Gong, B., and Wang, K. (2023). Influence of tunnel excavation on the deformation of a frame building. Buildings 13, 810. doi:10.3390/buildings13030810
Liang, Z., Xiao, D., Li, C., Wu, X., and Gong, B. (2014). Numerical study on strength and failure modes of rock mass with discontinuous joints. Chin. J. Geotechnical Eng. 36 (11), 2086–2095.
Liang, Z., Gong, B., Wu, X. K., Zhang, Y. B., and Tang, C. A. (2015). Influence of principal stresses on failure behavior of underground openings. Chin. J. Rock Mech. Eng. 34, 3176–3187.
Liang, Z., Gong, B., and Li, W. (2019). Instability analysis of a deep tunnel under triaxial loads using a three-dimensional numerical method with strength reduction method. Tunn. Undergr. Space Technol. 86, 51–62. doi:10.1016/j.tust.2018.11.015
Liang, Y., Chen, X., Yang, J., Zhang, J., and Huang, L. (2020). Analysis of ground collapse caused by shield tunnelling and the evaluation of the reinforcement effect on a sand stratum. Eng. Fail. Anal. 115, 104616. doi:10.1016/j.engfailanal.2020.104616
Liang, J., Cui, J., Lu, Y., Li, Y., and Shan, Y. (2022). Limit analysis of shallow tunnels collapse problem with optimized solution. Appl. Math. Model. 109, 98–116. doi:10.1016/j.apm.2022.03.044
Liu, F., Ma, T., Tang, C., Liu, X., and Chen, F. (2019). A case study of collapses at the yangshan tunnel of the coal transportation channel from the western inner Mongolia to the Central China. Tunn. Undergr. Space Technol. 92, 103063. doi:10.1016/j.tust.2019.103063
Liu, J., Yuen, K., Chen, W., Zhou, X., and Wei, W. (2020). Grouting for water and mud inrush control in weathered granite tunnel: a case study. Eng. Geol. 279, 105896. doi:10.1016/j.enggeo.2020.105896
Liu, J., Li, Z., Zhang, X., and Weng, X. (2021). Analysis of water and mud inrush in tunnel fault fracture zone-A case study of yonglian tunnel. Sustainability-basel 13 (17), 9585. doi:10.3390/su13179585
Liu, F., Zhang, Y., Ma, T., and Tang, C. (2022a). Observed performance of a deep excavation of qingdao metro line 4 in China. Tunn. Undergr. Space Technol. 123, 104445. doi:10.1016/j.tust.2022.104445
Liu, J., Sun, Y., Li, C., Yuan, H., Chen, W., Liu, X., et al. (2022b). Field monitoring and numerical analysis of tunnel water inrush and the environmental changes. Tunn. Undergr. Space Technol. 122, 104360. doi:10.1016/j.tust.2021.104360
Liu, N., Pei, J., Cao, C., Liu, X., Huang, Y., and Mei, G. (2022c). Geological investigation and treatment measures against water inrush hazard in karst tunnels: a case study in Guiyang, southwest China. Tunn. Undergr. Space Technol. 124, 104491. doi:10.1016/j.tust.2022.104491
Masini, L., Gaudio, D., Rampello, S., and Romani, E. (2021). Observed performance of a deep excavation in the historical center of Rome. J. Geotechnical Geoenvironmental Eng. 147 (2), 05020015. doi:10.1061/(asce)gt.1943-5606.0002465
Ministry of Housing and Urban-Rural Development of the People’s Repulic of China (2013). Code for monitoring measurement of urban rail transit engineering (GB 50911-2013). Beijing, China: China Architecture & Building Press.
Park, D., and Michalowski, R. L. (2020). Three-dimensional roof collapse analysis in circular tunnels in rock. Int. J. Rock Mech. Min. Sci. 128, 104275. doi:10.1016/j.ijrmms.2020.104275
Prendes-Gero, M. B., Lopez-Gayarre, F., Menendez-Fernandez, C., and Rodriguez-Avial Llardent, M. (2013). Forensic analysis of the failure of the foundations of a tunnel built to channel the course of a river. Eng. Fail. Anal. 32, 152–166. doi:10.1016/j.engfailanal.2013.01.004
Qiu, W., Huang, H., Yan, F., and Sun, K. (2021). A disaster with water inrush based on energy theorem in tunnels under saturated sandy stratum. Hazard Control Tunn. Undergr. Eng. 3 (1), 1–11.
Sarna, S., Gutierrez, M., Mooney, M., and Zhu, M. (2022). Predicting upcoming collapse incidents during tunneling in rocks with continuation length based on influence zone. Rock Mech. Rock Eng. 55, 5905–5931. doi:10.1007/s00603-022-02971-z
Senent, S., and Jimenez, R. (2015). A tunnel face failure mechanism for layered ground, considering the possibility of partial collapse. Tunn. Undergr. Space Technol. 47, 182–192. doi:10.1016/j.tust.2014.12.014
Sousa, R. L., and Einstein, H. H. (2021). Lessons from accidents during tunnel construction. Tunn. Undergr. Space Technol. 113, 103916. doi:10.1016/j.tust.2021.103916
Wang, Y., Gong, B., Zhang, Y., Yang, X., and Tang, C. (2022a). Progressive fracture behavior and acoustic emission release of CJBs affected by joint distance ratio. Mathematics 10, 4149. doi:10.3390/math10214149
Wang, Y., Gong, B., and Tang, C. (2022b). Numerical investigation on anisotropy and shape effect of mechanical properties of columnar jointed basalts containing transverse joints. Rock Mech. Rock Eng. 55, 7191–7222. doi:10.1007/s00603-022-03018-z
Wang, Y., Li, J., Wang, Z. F., and Chang, H. (2022c). Structural failures and geohazards caused by mountain tunnel construction in fault zone and its treatment measures: a case study in Shaanxi. Eng. Fail. Anal. 138, 106386. doi:10.1016/j.engfailanal.2022.106386
Xue, Y., Kong, F., Li, S., Qiu, D., Su, M., Li, Z., et al. (2021). Water and mud inrush hazard in underground engineering: genesis, evolution and prevention. Tunn. Undergr. Space Technol. 114, 103987. doi:10.1016/j.tust.2021.103987
Yan, F., Qiu, W., Sun, K., Jiang, S., Huang, H., Hong, Y., et al. (2021). Investigation of a large ground collapse, water inrush and mud outburst, and countermeasures during subway excavation in Qingdao: a case study. Tunn. Undergr. Space Technol. 117, 104127. doi:10.1016/j.tust.2021.104127
Yang, P., Peng, Z., Tang, Y., Peng, W., and He, Z. (2008). Penetration grouting reinforcement of sandy gravel. J. Central South Univ. Technol. 15 (2), 280–284. doi:10.1007/s11771-008-0052-5
Zhang, D., Xie, X., Zhou, M., Huang, Z., and Zhang, D. (2021). An incident of water and soil gushing in a metro tunnel due to high water pressure in sandy silt. Eng. Fail. Anal. 121, 105196. doi:10.1016/j.engfailanal.2020.105196
Zhang, Y., Zhang, W., Xia, H., Gong, B., Liu, F., Zhang, J., et al. (2023). Case study and risk assessment of water inrush disaster in Qingdao Metro Line 4. Appl. Sci. 13, 3384. doi:10.3390/app13063384
Zheng, Z., Liu, R., Li, S., and Yang, H. (2020). Control of ground uplift based on flow-field regularity during grouting in fracture with flowing groundwater. Int. J. Geomechanics 20 (3), 04020014. doi:10.1061/(asce)gm.1943-5622.0001610
Keywords: metro tunnel, water inrush, collapse mechanism, grouting reinforcement, surface settlement
Citation: Zhang L, Wang Z, Zhang W and Liu S (2023) Sandy aquifer collapse mechanism and accident treatment of the Qingdao metro tunnel. Front. Earth Sci. 11:1293258. doi: 10.3389/feart.2023.1293258
Received: 12 September 2023; Accepted: 04 October 2023;
Published: 16 October 2023.
Edited by:
Bin Gong, Brunel University London, United KingdomCopyright © 2023 Zhang, Wang, Zhang and Liu. This is an open-access article distributed under the terms of the Creative Commons Attribution License (CC BY). The use, distribution or reproduction in other forums is permitted, provided the original author(s) and the copyright owner(s) are credited and that the original publication in this journal is cited, in accordance with accepted academic practice. No use, distribution or reproduction is permitted which does not comply with these terms.
*Correspondence: Weiguo Zhang, endncXV0QDE2My5jb20=
Disclaimer: All claims expressed in this article are solely those of the authors and do not necessarily represent those of their affiliated organizations, or those of the publisher, the editors and the reviewers. Any product that may be evaluated in this article or claim that may be made by its manufacturer is not guaranteed or endorsed by the publisher.
Research integrity at Frontiers
Learn more about the work of our research integrity team to safeguard the quality of each article we publish.