 Qianzheng Sun1
 Longhui Zhao
94% of researchers rate our articles as excellent or good
Learn more about the work of our research integrity team to safeguard the quality of each article we publish.
Find out more
ORIGINAL RESEARCH article
Front. Earth Sci., 28 December 2023
Sec. Geohazards and Georisks
Volume 11 - 2023 | https://doi.org/10.3389/feart.2023.1291592
Rainfall plays a pivotal role in triggering the failure of loose accumulation landslides. To understand their stability, it is essential to explore the deformation, failure patterns, fine particle migration, and infiltration behavior of such landslides under rainy conditions. Employing the Yuqiupo landslide as a case study, this research dissects the fundamental attributes of the Yuqiupo landslide through geological examinations. Moreover, the study replicates the failure of the loose accumulation landslide via artificial rainfall experiments. By employing acquired data on soil volumetric water content and matrix suction from these experiments and observing measurable shifts in the landslide’s failure progression and rainfall circumstances, the water-hydraulic conditions of the accumulation landslide are meticulously dissected. The conducted experiments disclose that the failure of the loose accumulation landslide emanates from the combined effects of preferential flow and matrix flow within unsaturated conditions. Rainfall triggers an elevation in soil moisture content and a concurrent decrease in matrix suction, compromising the slope’s stability and ultimately causing the landslide. Furthermore, our research includes a quantitative analysis of changes in particle size distribution before and after the landslide’s failure. This endeavor underscores the influence of distinct failure modes on the migration of fine particles, with these migration patterns distinctly shaped by prevailing rainfall conditions.
Accumulation bodies primarily consist of a mixture of soil with smaller particle sizes and gravel or rocks with relatively larger particle sizes (Li et al., 2017; Zhang et al., 2021; Zhou et al., 2021). They possess a loose structure, uneven grain distribution, and large pores (He et al., 2020; Yang et al., 2023). Consequently, landslides triggered by accumulation bodies exhibit high frequency and high risk (Dahal et al., 2008; Yang, 2018). The loose structure of accumulation bodies contributes to their high permeability, making them prone to instability and failure under prolonged and intense rainfall conditions (Gan and Zhang, 2020; Zhang et al., 2020; Yang et al., 2021). Rainfall infiltration alters the water distribution within the slope’s accumulated soil, leading to a decrease in soil strength (Ran et al., 2018; Van Tien et al., 2021; Yi et al., 2021; Zhang et al., 2022). This phenomenon makes rainfall become one of the key triggering factors for accumulation landslides (Yang et al., 2020; Bai et al., 2021). Rainfall-induced landslides are a type of recurrent geological hazard, resulting in substantial economic losses and potential casualties (Vasu et al., 2016; Wang et al., 2019a; Xing et al., 2021). Investigating the deformation and failure patterns of loose accumulation landslides under rainfall conditions holds significant engineering significance for landslide prediction and forecasting (Chen et al., 2019; Yang et al., 2020; Abeykoon and Jayakody, 2022).
The process of loose accumulation landslides occurs in unsaturated soil conditions (Wu et al., 2018; Yamaguchi et al., 2023). As research on the stability of unsaturated soil landslides progresses, there is a growing need for quantitative analysis of rainfall infiltration patterns and the processes of deformation and failure under unsaturated conditions (Chen and Lee, 2003; Ding et al., 2006; Ma et al., 2017; Zhao et al., 2022; Paswan and Shrivastava, 2023; Wen et al., 2023). Lin et al. (2009) delved into the intricate interplay between rainfall characteristics and slope instability through meticulous artificial rainfall model tests. Their study meticulously identified pertinent parameters for effective rainfall warnings. Building on this foundation, Xu et al. (2006) embarked on a comprehensive exploration of short-term and long-term rainwater infiltration effects. Their findings affirmed that rainwater infiltration markedly attenuated the structural integrity of expansive excavated slopes, thereby casting ripples across slope stability. In a parallel vein, Wang et al (2019b) undertook a series of large-scale indoor simulated artificial rainfall landslide model experiments. The crux of their research centered on the intricate nexus between rainfall intensity and the evolving pore water pressure and stress dynamics within the landslide mass. This nuanced investigation brought to light the intricate deformation-failure mechanisms that underpin the onset of rainfall-induced landslides. Dovetailing into the broader discourse, Zuo (2015) meticulously probed the profound implications of particle gradations on the stability of accumulation slopes within identical rainfall conditions. Their comprehensive model tests shed light on the delicate equilibrium that particle gradations orchestrate within the backdrop of rain-induced stress. Concurrently, Liang et al. (2020) conducted indoor experiments using sands with different particle size distributions as their research subjects. They found that soils with well-distributed particle size had lower water content and permeability coefficients, which in turn can affect the stability of the accumulated soil. This, in turn, furnished critical insights into the intricate web of factors steering accumulation soil stability. Further expanding this horizon, Yang et al. (2019) engineered an artificial rainfall model framework to dissect the failure dynamics of gravelly soil landslides. Their simulations unveiled the orchestration of preferential flow and matrix flow in tandem, casting the failure process within an integrative framework. While these diverse studies have unraveled multifaceted dimensions of the interplay between rainfall infiltration and accumulation slope deformations, there remains a notable gap in comprehending the intricate orchestration of landslide failure modes and the migration patterns of constituent particles.
On 23 May 2016, a sudden and devastating landslide catastrophe struck the Yuqiupo Group in Kaiyang County, Guizhou Province, China. Tragically, this event claimed the lives of two residents, demolished five houses, ravaged over 10 acres of farmland, and inflicted a direct economic loss of 9,00,000 Chinese Yuan (Figure 1). The Yuqiupo landslide stemmed from the inherent instability of accumulated layers, emblematic of a quintessential sudden disaster characteristic of Guizhou Province. The presence of accumulated deposits is a common geological feature across Guizhou and the western mountainous landscapes of China. These areas are particularly susceptible to geological hazards, a vulnerability driven by a confluence of natural and anthropogenic forces. Thus, delving into the intricacies of Yuqiupo landslide formation mechanics and underlying conditions holds profound theoretical and practical significance.
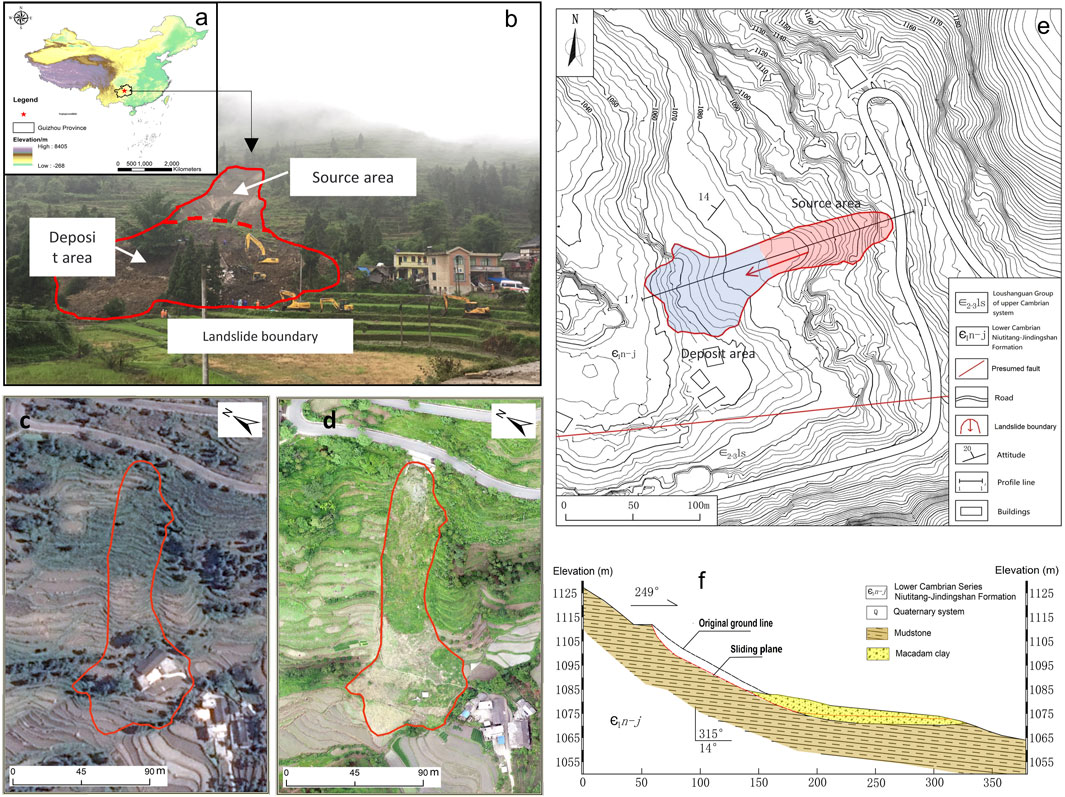
FIGURE 1. (A) Landslide location map; (B) Comprehensive view of the Landslide; (C) Image map before the landslide occurrence on 27 August 2013 (Sourced from Google Earth); (D) Aerial image map after the landslide occurrence in October 2018 (Captured by UAV); (E) Plan view of the Yuqiupo landslide; (F) Cross-sectional profile of the landslide, with sectional line placement as illustrated in Figure 1E.
Building upon the research methods used in the aforementioned studies, this study will use a physical modeling approach. Taking the loose accumulation landslide in Yuqiupo landslide, Guizhou Province, as a prototype, the study will simulate the failure process of loose accumulation landslides under different rainfall conditions. It aims to explore the hydro-mechanical processes of loose accumulation soil landslides, elucidate the relationship between preferential flow and matrix flow in accumulation soil landslides, and analyze the migration patterns of soil particles under rainfall conditions. The outcomes of this study will provide valuable references for predicting the impact range, monitoring and early warning of such loose accumulation landslide, as well as formulating engineering measures.
The Yuqiupo landslide is situated in the Yuqiupo Formation, Kaiyang County, Guizhou Province, China (Figure 1A). Its geographical coordinates are approximately 107°01′37.20″E and 26°52′53.60″N. The research area experiences a subtropical monsoon climate characterized by dry and cold winters with minimal rainfall, and warm and wet summers influenced by monsoons. The annual average precipitation from 2013 to 2017 was 1337.7 mm, with a maximum daily rainfall of up to 188.2 mm. Rainfall distribution is uneven throughout the four seasons, with a significant concentration during the flood season from April to September, accounting for approximately 75.8% of the annual rainfall. The cumulative rainfall in the 10 days prior to the occurrence of the landslide reached 70 mm.
The landslide area features a sloping landform with an overall terrain inclination from northeast to southwest, resulting in a relative elevation difference of around 210 m. The average topographic slope is approximately 25°, and there are significant variations in topographic relief. The predominant lithology in the study area consists of Quaternary residual slope deposits (Qel+dl) comprising gravel clay, as well as Lower Cambrian Jindingshan Formation (∈1j) consisting of siltstone and mudstone. The Yuqiupo landslide is situated on the southeastern wing of the Da Wenglin anticline, near its core. The front edge of the landslide is close to a northwest-southeast strike-slip fault, while the left margin is adjacent to a northeast-southwest normal fault (Figure 1E).
Groundwater in the area is categorized into clastic rock fracture water and loose layer pore water. Available data suggests that groundwater is predominantly found in the loose accumulation layers of the Quaternary deposits, displaying good permeability and water content. Groundwater primarily derives its replenishment from atmospheric precipitation, followed by surface water sources.
Field investigations reveal that the Yuqiupo landslide features a tower-like shape in its plan projection, characterized by a smaller upper portion and a larger lower portion. The cross-sectional profile of the landslide appears approximately linear, with the main sliding direction oriented at 244°. The landslide’s diagonal length is about 140 m, while the average width is approximately 60 m (Figures 1C,D). The average thickness of the landslide is around 4 m, contributing to a total volume of approximately 40,000 m3 (Figures 1E,F). The landslide mass consists of remnant slope deposits that have been modified by human activities. The upper layer contains fewer gravel particles with small grain sizes, distributed on the surface unevenly with a thickness ranging from 0.5 to 1 m. The lower layer comprises residual slope deposits derived from weathered bedrock. These deposits exhibit colors ranging from yellow-green to yellow-brown and contain around 70% gravel particles with sizes ranging from 2 to 40 mm. These gravel particles originate from the silty claystone and sandy shale layers of the Niuhutiang-Jindingshan Formation. The lower layer possesses a loose structure and uniform texture, with relatively consistent thickness between 3 and 5 m.
Through testing of the physical-mechanical parameters of the soil and rainfall experiments, a particle size distribution curve was obtained using particle sieving tests (Figure 2B). According to the particle size distribution curve, particles larger than 2 mm contribute to 71% of the total mass. The particle size metrics are as follows: d10 = 0.4, d30 = 2, d60 = 6, 10 < Cu = 15, 1 < Cc = 1.67 < 5. These values indicate a well-graded soil composition.
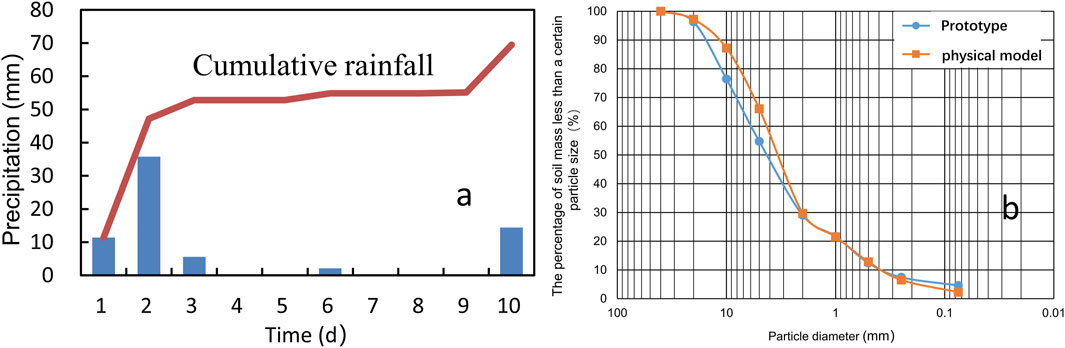
FIGURE 2. (A) Rainfall patterns in 10 days before the occurrence of the landslide; (B) Soil particle gradation curves of prototype and model soil.
On 23 May 2016, at 23:00, the accumulated rainfall within 12 h prior to the landslide was recorded as 14.7 mm, with a rainfall intensity of 45–50 mm/h, as shown in Figure 2A (Provided by Guizhou Province Kaiyang Meteorological Bureau). Categorized by rainfall intensity, this event was classified as moderate to heavy rain. In the 10 days leading up to the landslide, the cumulative rainfall reached 70 m. Infiltration of the rainfall increased the bulk density of the landslide mass, intensifying the downward force along the potential sliding plane. This process simultaneously led to an increase in pore water pressure and a reduction in effective normal stress on the sliding surface, thereby decreasing the shear strength. On the day of the landslide, irrigation ditches along the upper edge of the slope overflowed into a gully in the central region of the landslide. This continuous erosion of the gully bed led to the erosion of the soil along the landslide’s edges, causing a substantial amount of soil to slide into the gully from both sides. Influenced by the force of the flowing water, the landslide underwent widespread sliding.
In order to investigate the deformation characteristics, matrix suction, and relationship between volumetric water content variations in the process of accumulation landslide under different rainfall intensities, a series of simulated rainfall model experiments were conducted. These experiments were based on the simplification of the on-site landslide prototype. To maintain experimental controllability and simulate real-world conditions, particles smaller than 4 cm (rather than 2 cm) were chosen during sieving of the loose gravel soil from the landslide area, ensuring better replication of real-world conditions, including the separation of the upper loose accumulation layer from the highly compacted underlying bedrock. The percentage mass of particles larger than 2 mm in the test soil samples was 70.3%. Particle size metrics were measured with d10 = 0.4, d30 = 2, d60 = 4.4, Cu = 11, and Cc = 2.27. Specific parameters and particle size distribution are detailed in Table 1 and Figure 3.

TABLE 1. Results of direct shear test and calculation parameters of landslide model stability.
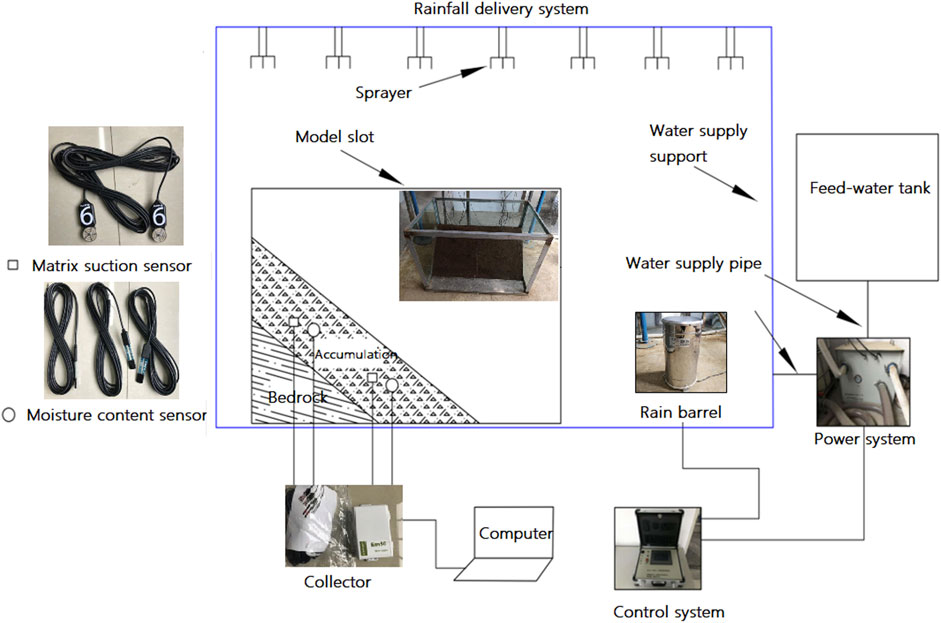
FIGURE 3. Layout of rainfall model test.
The experiment was conducted at a scale of 1:100. Rainfall tests were conducted with variations in rainfall intensity, slope angle, and soil depth. Soil volumetric water content and matrix suction sensors were deployed to record data. The weight of the model in the test experiments was adjusted to match the real-world landslide conditions. Samples were taken after compacting the model soil, and compaction continued until the bulk density resembled that of the landslide. The design plan is as follows:
Rainfall intensity experiments were systematically carried out at varying rates: 60 mm/h, 90 mm/h, 110 mm/h, 150 mm/h, and 170 mm/h, while maintaining a consistent slope angle of 30°. Considering the dimensions of the model, a total of four soil water potential sensors and four soil volumetric water content sensors were carefully chosen and integrated into the system. These sensors were meticulously positioned along two perpendicular cross-sectional profiles, with each profile encompassing sensors strategically embedded both at the bottom and the crest of the slope.
As a result of changing slope angles, variations in internal soil parameters, pore water pressure, seepage patterns, and particle movement are observed within the slope during rainfall. Consequently, the model adopted four slope angles—10°, 20°, 30°, and 40°—with a consistent rainfall intensity of 90 mm/h. Following a similar approach to the initial experiment, two cross-sectional profiles for each slope angle were equipped with four soil water potential sensors and four soil volumetric water content sensors, strategically positioned at the slope foot and top. The experiment was conducted under consistent rainfall intensity conditions, mirroring those of the preceding study.
In order to comprehensively investigate the variations in pertinent factors such as water content, matrix suction, stability coefficient, and slope stability at various depths during rainfall, a range of soil water potential sensors and soil volumetric water content sensors were strategically placed at different levels within the slope. With the slope’s overall thickness set at 30 cm, the sensors were strategically situated at depths of 10 cm, 20 cm, and 30 cm. The rainfall experiments were carried out on a 30° slope inclination with a rainfall intensity of 90 mm/h. These nine distinct test configurations were labeled as S1 to S9, and their corresponding relationships are outlined in Table 2.
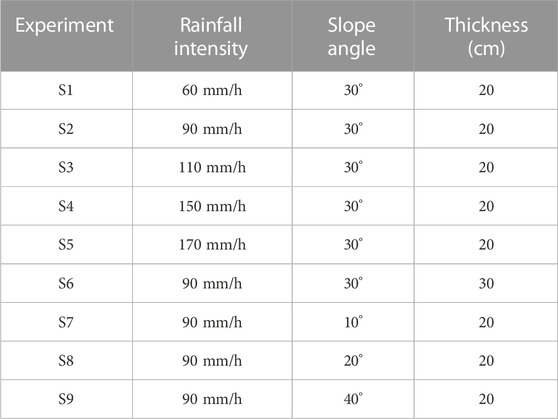
TABLE 2. Experimental setup.
The experimental setup mainly consists of three components: artificial rainfall simulation equipment, landslide model trough, and parameter measurement system. The rainfall model test apparatus is illustrated in Figure 3. 1) Artificial Rainfall Simulation Equipment: It primarily includes four parts: rainfall intensity control system, rainfall dynamic system, rainfall conveyance system, and data output system. The equipment is capable of producing rainfall intensities ranging from 20 to 200 mm/h, covering an effective area of 30 m2, with a coefficient of rainfall uniformity exceeding 86%. 2) Landslide Model Trough: The model trough has dimensions of 1.2 m (length) × 1.0 m (width) × 1.0 m (height). The bottom surface is made of stainless steel to bear load, while the top and one side face are left open for observation purposes. The other three sides are constrained by toughened glass. 3) Parameter Measurement System: The measurement system primarily includes three devices: data logger (Em50), volumetric water content sensor (EC-5), and soil matrix suction sensor (MPS-6). This measurement system collects data every 1 min using the ECH2O Utility software.
According to previous research findings, it is well-established that the VanGenuchten (VG) model exhibits a broader range of applicability in the field of unsaturated soils (Raoof and Pilpayeh, 2011; Etminan et al., 2021). Moreover, it demonstrates superior capability in accurately capturing the shape of actual soil-water characteristic curves. In light of these advantages, this study aims to utilize the VG model to reconstruct the soil-water characteristic curve in the experimental investigation by incorporating the relationship between matrix suction and volumetric water content. The expression of the VG model employed is presented below (Bohne et al., 2000; Herbst and Diekkruger, 2002; Weihnacht and Boerner, 2014; Ma et al., 2019):
In Formula (1), θr represents the residual water content, θs denotes the saturated water content, α, n, and m are fitting parameters, with m=1–1/n. The parameter α is approximately equal to the inverse of the intake pressure value and is expressed in units of kPa-1. Moreover, Se represents the effective saturation, while ψ represents the matric suction.
In order to explore the occurrences of preferential flow and matrix flow in soil during heavy rainfall, this study utilizes data acquired from soil volumetric water content sensors and soil water potential sensors to characterize these processes in unsaturated soil. The influence of rainfall infiltration on landslide stability is analyzed. Prior to this analysis, it is essential to establish a soil-water characteristic curve that captures the preferential flow behavior. Experimental data of matric suction and volumetric water content for unsaturated soil are collected. A selected set of matric suction and volumetric water content data is then used to reconstruct and fit the soil-water characteristic curve. The fitting data and parameters are presented in Tables 3, 4. The soil-water characteristic curve under the VG model is depicted in Figure 4. The curve fitting demonstrates a good degree of correlation, with a coefficient of determination (R2) of 0.9442, indicating a satisfactory fit. Additionally, the matric suction of the gravel soil is relatively low. It should be noted that the reciprocal value of the parameter α (intake pressure value) used in fitting the soil-water characteristic curve under the VG model is approximately 4 kPa. This discrepancy is attributed to the relatively low proportion of fine particles in the soil sample used, which accounts for approximately 29%.

TABLE 3. Measured matrix suction and volumetric water content data.

TABLE 4. Fitting parameters used.
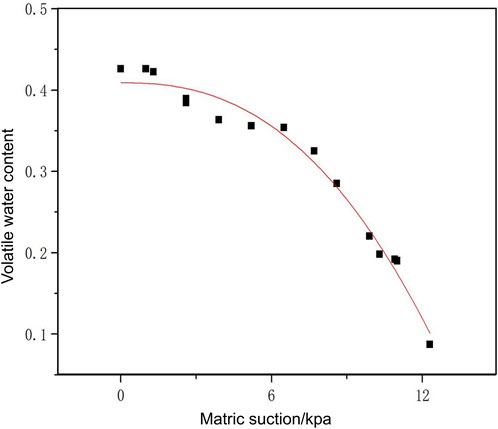
FIGURE 4. Soil-water characteristic curve under VG model.
(1) Geometric Similarity: Based on the principle of similarity, the ratio of the dimensions of the landslide prototype to the model trough is referred to as the geometric similarity ratio (Liu et al., 2011; Fang et al., 2023). Before conducting the rainfall test, it is crucial to choose an appropriate geometric similarity ratio. In this study, the landslide prototype has a length of approximately 140 m and a maximum width of about 100 m, while the dimensions of the model trough are 1.2 m (length) × 1 m (width). Therefore, the geometric similarity ratio is approximately 100.
(2) Material Similarity Ratio: To ensure the applicability of the results, material similarity must be satisfied when preparing the model material (Liu et al., 2011; Wang et al., 2022; Zhan et al., 2022). The model material is obtained from the landslide deposits, with particles larger than 4 cm being removed. The grain size distribution of both the model and the prototype is shown in Figure 2B.
(3) Rainfall Similarity: Besides geometric and material similarity, rainfall similarity should also be considered (Li et al., 2016; Wu et al., 2018). Currently, there are limited studies on rainfall similarity. In this study, Sun and Zhang (2012) (Sun and Zhang, 2012) provided insights into rainfall and slope runoff simulation experiments. Based on comprehensive seepage and runoff analysis, the Weber criterion is adopted as the rainfall similarity criterion for the rainfall-induced landslide model tests.
The Weber number (We) is defined as:
where We is the Weber number, ρ is the density of water, u is the characteristic flow velocity, l is the characteristic length, and σ is the surface tension coefficient of water.
Assuming equal density, surface tension coefficient, and Weber number for water in the prototype and model, this relationship streamlines experimental complexity and ensures reproducibility in rainfall-induced landslide model tests, crucial for simulating landslide occurrence and progression. The following relationship can be established:
where up and lp represent the characteristic flow velocity and length of the prototype, and um and lm represent the characteristic flow velocity and length of the model.
Therefore, the relationship between the rainfall intensity scale λu and the geometric scale λl can be simplified as:
Similarly, the rainfall time scale λt and the rainfall volume scale λp can be obtained using the following formulas:
Thus, if the geometric scale λl is 100, the rain intensity scale λu is 0.1, the rainfall time scale λt is 1000, and the rainfall volume scale λp is 100. The similarity between the prototype and the model of the loose accumulation slope is summarized in Table 5.
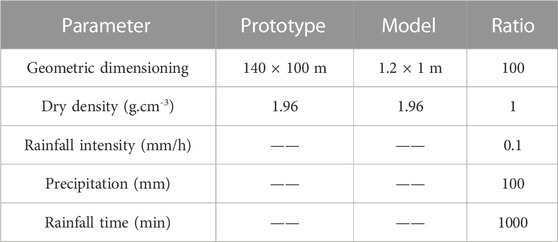
TABLE 5. Similarity relationship between prototype and model.
Experiment S1 involved rainfall at an intensity of 60 mm/h for a duration of 39 min (Figures 5A–D). During the initial phase of precipitation, there were no significant changes in soil conditions (Figure 5A). However, the soil’s color gradually darkened over time. At the 14-min mark, runoff from the slope carried turbid water downstream, resulting in fine particle accumulation at the slope’s base, though no visible damage was evident (Figure 5B). By the 27th minute, localized damage was observed at the slope’s foot (Figure 5C). Subsequently, at the 29-min poin, a swift occurrence of substantial slope damage transpired, characterized by turbid rainwater and an increased accumulation of fine particles (Figure 5D). Rainfall persisted until the 39-min mark, with no notable alterations to the slope’s condition.
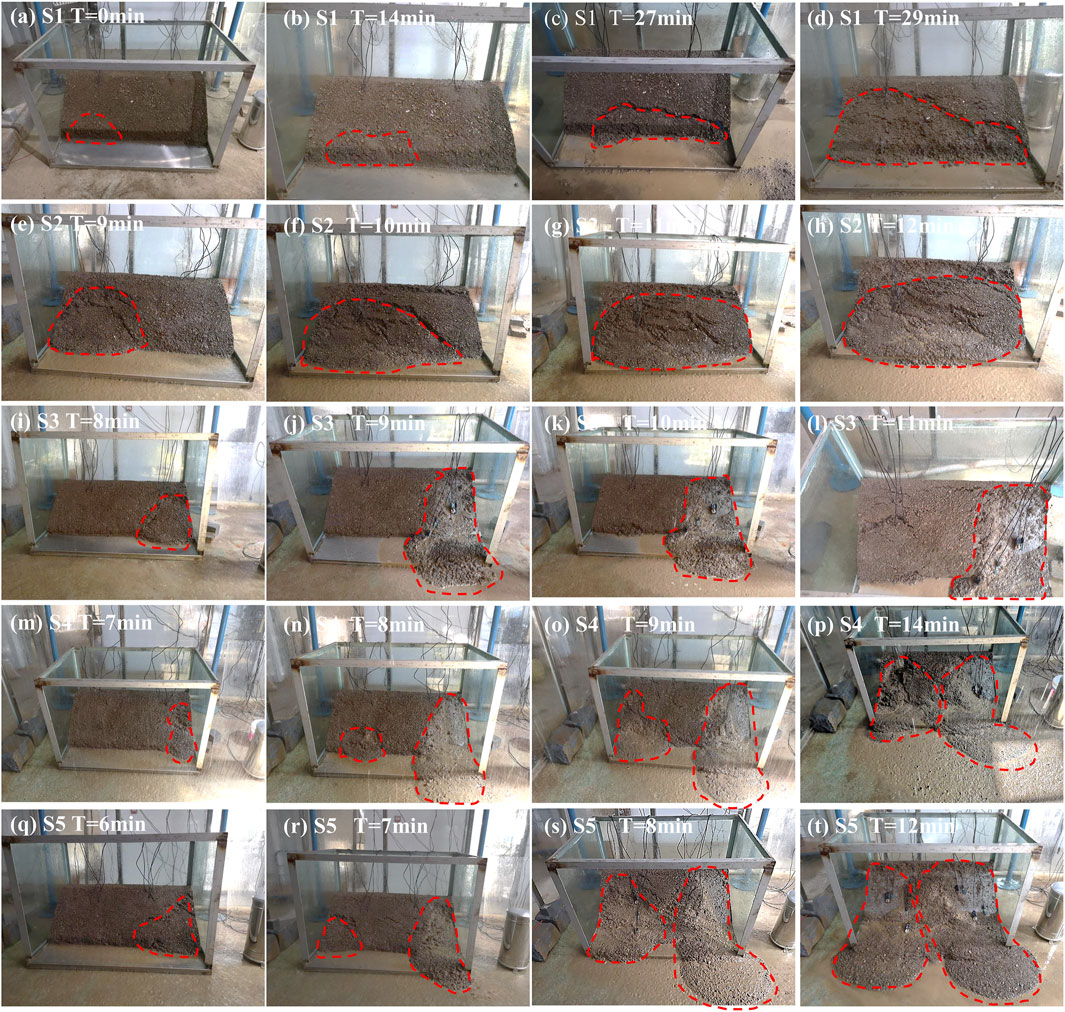
FIGURE 5. The deformation and failure process of experimental models S1 to 1S5.
In Experiment S2, a rainfall intensity of 90 mm/h endured for a span of 14 min (Figures 5E–H). During the initial stages of precipitation, the soil exhibited no significant alterations, albeit the gradual deepening of its color. At 9 min, there was a localized withdrawal of the right slope foot, coupled with the emergence of multiple cracks and the presence of turbid runoff water (Figure 5E). Between the 10th and 11th minutes, damage escalated, evidenced by permeable cracks proliferating across the slope’s surface (Figures 5F,G). By the 12th minute, extensive slope damage became apparent, leading to runoff and nearly saturating the accumulation layer (Figure 5H).
Experiment S3 encompassed a rainfall intensity of 110 mm/h lasting for 13 min (Figure 5I–L-l). Throughout the initial stages of rainfall, the soil’s appearance underwent no notable transformations, although its color grew more intense. After 8 min, cracks manifested at the left slope foot, culminating in rearward damage (Figure 5I). By the 9-min juncture, extensive harm was inflicted upon the left slope foot, resulting in turbid runoff water (Figure 5J). Within 10 min, substantial damage was inflicted on the left slope foot, accompanied by localized collapse at the right slope foot (Figure 5K). Multiple cracks surfaced at the upper right portion at the 11-min mark (Figure 5L). The right slope foot experienced rearward damage and soil accumulation by the 12-min point. Notably, significant slope damage materialized by the 13th minute, subsequently concluding the rainfall.
For Experiment S4, rain of intensity 110 mm/h persisted for 14 min (Figure 5M–P). In the initial stages of this rainfall, the soil underwent minimal changes; however, its color gradually darkened. At 7 min, there was a retreat of the left slope foot (Figure 5M). By the 8th minute, extensive damage befell the left slope foot, leading to sensor exposure and localized collapse at the right slope foot (Figure 5N). At 9 min, the left slope foot was entirely compromised, followed by intensified damage at the right slope foot (Figure 5O). Continuous damage transpired, culminating in surface gullies, by the 14-min juncture (Figure 5P).
Experiment S5 comprised rainfall at an intensity of 170 mm/h over 8 min (Figure 5Q–T). Within 6 min of the rainfall onset, turbid runoff water emerged at the left slope foot, accompanied by the development of multiple cracks (Figure 5Q). At 7 min, damage manifested in both the left and right slope feet, rapidly eroding the slope’s surface into a muddy accumulation (Figure 5R). The rainfall ceased by the 8-min mark, although the accumulation layer retained its saturation (Figures 5S,T).
Experiment S6 featured rainfall with an intensity of 90 mm/h for a duration of 34 min (Figures 6A–D). In the initial stages of rainfall, the soil displayed no significant changes while its color progressively deepened. By the 6-minute point, turbid runoff water emerged, along with the accumulation of fine particles. At the left slope foot, localized collapse was observed, accompanied by rearward cracks (Figure 6A). Extensive damage ensued by the 17-minute mark, impacting the slope foot and leading to rearward cracks (Figure 6B). The right slope foot experienced extensive damage, exposing sensors, by the 26-min juncture (Figure 6C). Almost complete damage ensued by the 30-min mark, with subsequent rainfall yielding minimal changes (Figure 6D).

FIGURE 6. The deformation and failure process of experimental models S6 to S9.
Experiment S7 entailed rainfall at an intensity of 90 mm/h on a slope inclined at 10° for 47 min (Figures 6E–H). During the initial stages of precipitation, the soil remained relatively unchanged in appearance, despite a gradual deepening of its color. By the 5-min mark, turbid runoff water emerged (Figure 6E). Turbidity subsequently decreased by the 16-minute point (Figure 6F), followed by runoff devoid of soil particles by the 28th minute (Figure 6G). By the 40-min mark, localized collapse concluded the rainfall (Figure 6H).
In Experiment S8, rainfall of intensity 90 mm/h persisted for 23 min (Figure 6I–L). In the initial phases of precipitation, the soil exhibited minimal changes; however, its color gradually deepened. Turbid runoff water emerged at the left slope foot by the 10-minute mark, leading to localized collapse and the formation of cracks at the right slope foot (Figure 6I). By the 15-minute juncture, damage significantly affected the right slope foot, with certain portions transforming into debris flow (Figure 6J). At the 20-minute mark, central damage occurred, resulting in accumulation within the affected region, thereby concluding the rainfall (Figures 6K,L).
Finally, Experiment S9 consisted of rainfall at an intensity of 90 mm/h for 10 min (Figure 6M–P). In the initial stages of precipitation, the soil experienced no significant changes; however, its color progressively deepened. By the 6-min mark, turbid runoff water emerged at the left slope foot, accompanied by localized collapse and the development of a muddy flow-like soil consistency (Figure 6M–P). Both the left and right slope feet encountered damage within a brief peri1od by the 7-min point, leading to a pronounced impact and the emergence of debris flow (Figure 6N). The ensuing damage persisted, affecting around three-quarters of the total volume, accumulating at the slope foot, and leading to near saturation of the accumulation layer (Figure 6O). Almost complete damage transpired by the 10-min mark, signifying the conclusion of the rainfall event (Figure 6P).
Experiment S1: Matric suction sensor data indicated that the initial phase of rainfall did not significantly alter matric suction. Throughout the rainfall event, a gradual decrease in matric suction was observed at both the left and right profile slope tops, stabilizing subsequently. A continuous decrease in matric suction occurred at the slope foot before slope failure. After the failure, matric suction at the right profile slope foot increased at 27 and 29 min, reaching 8.1 kPa. Similarly, the left profile slope foot’s matric suction surged from 2.6 kPa to 8.2 kPa at 29 min, followed by minor fluctuations (Figures 7A,B).
FIGURE 7. The variation of volumetric water content and matric suction for experimental models S1 to S5.
Experiment S2: Matric suction sensor data revealed that during the initial rainfall stages, matric suction remained relatively constant across the left and right profiles. After 4 min, a rapid decrease in matric suction was noted at the left profile slope, dropping from 6.8 kPa (slope top) to 1.8 kPa and from 5.9 kPa (slope foot) to 0.4 kPa. Similarly, the right profile experienced a swift reduction after 3 min, declining from 8.49 kPa (slope top) to 3.19 kPa and from 7.42 kPa (slope foot) to 2.19 kPa. At 12 min, the right profile slope top’s matric suction exhibited a substantial, rapid increase (Figures 7E,F).
Experiment S3: Matric suction data monitoring indicated that during the initial rainfall phase, matric suction remained stable. However, after 3 and 4 min, rapid drops in matric suction occurred at the left and right profiles, respectively. These values decreased from 9 kPa to approximately 1 kPa and from 10.7 kPa to 1.7 kPa, respectively. Following the slope failure, both profiles briefly exhibited increased matric suction at 8 and 11 min, respectively, after which data collection ceased (Figures 7I, J).
Experiment S4: Matric suction sensor data indicated that during the initial rainfall stages, matric suction remained relatively constant. Up until 3 min, both profiles’ matric suction experienced minimal fluctuations. Prior to slope failure, a consistent drop was observed, from a peak of 11.3 kPa–1.8 kPa. At 7 and 8 min, matric suction increased at the left profile slope foot and slope top, respectively, but was halted by sensor exposure. The right profile exhibited an increase at 9 min, continuing until sensor exposure (Figures 7M, N).
Experiment S5: Matric suction sensor data showed that due to the high rainfall intensity, matric suction responded after 2 min at both profiles. Pre-slope failure, matric suction continued to decrease, with a faster rate at the slope top and foot. After slope failure, matric suction surged at the left profile slope top (6 min) and at the right profile slope top and foot (7 min), rapidly causing slope failure and data termination (Figures 7Q, R).
Experiment S6: Matric suction sensor data, at varying depths, displayed stability during initial rainfall. Throughout, depths of 10 cm, 20 cm, and 30 cm witnessed rapid matric suction drops. At 10 cm, it dropped from 14.4 kPa to 3.9 kPa, at 20 cm, from 15.5 kPa to 2.2 kPa, and at 30 cm, it reached to 2.2 kPa. Some sensors were exposed to air (Figure 8A).
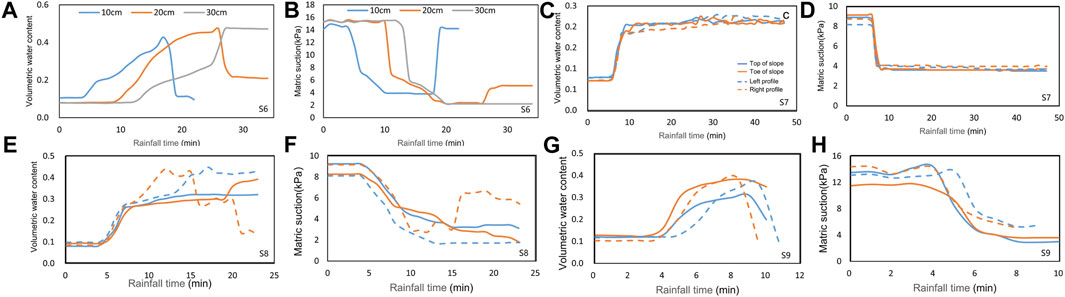
FIGURE 8. The variation of volumetric water content and matric suction for experimental models S6 to S9.
Experiment S7: Matric suction sensor data exhibited initial stability during rainfall. Continuous matric suction decrease was noted across the left and right profiles’ slope tops and slope foot, with minor fluctuations (Figure 8C).
Experiment S8: Matric suction sensor data indicated stability in initial rainfall stages. Continuous matric suction decrease was observed across the left profile slope tops and slope foot, with local fluctuations. The right profile experienced an increase at 12 and 15 min, intensifying the slope’s failure (Figure 8E).
Experiment S9: Matric suction sensor data unveiled stability during initial rainfall stages. Continuous matric suction decrease was seen across the left and right profile slope tops and slope foot, with minor local fluctuations. Matric suction at the right profile slope foot continued to decrease, with a slight, less pronounced, increasing trend at 8 min at the slope top (Figure 8G).
These nine experiments provide insights into the evolving trends of soil matric suction under varying rainfall. Initially, matric suction remained stable, gradually decreasing with prolonged rainfall, especially before slope failure. Following failure, transient matric suction increases were observed in some cases, potentially linked to changes in soil movement and drainage conditions. Depth-related variations were evident, with deeper depths displaying slower matric suction reduction rates. In certain cases, sensor exposure to air resulted in data collection termination.
Experiment S1: The results of Experiment S1 indicated that the initial volumetric water content of the soil was approximately 0.08 before the onset of rainfall. During the initial phase of precipitation, the soil’s volumetric water content showed a gradual increase. At the 5-minute mark, a rapid rise in volumetric water content was observed at the slope foot. Subsequently, at 7 min, a pronounced surge in volumetric water content was noted at the slope top. Following 11 min, there was a progressive augmentation in volumetric water content manifested at the left slope foot. By the 20-minute point, the volumetric water content at the right slope foot marginally surpassed that at the slope top, displaying a gradual increment. However, at the 27-minute juncture, a slight decrease in volumetric water content to 0.29 was observed at the right slope foot. At 29 min, substantial reductions in volumetric water content occurred at both the right and left slope feet, without reaching saturation (Figures 7C,D).
Experiment S2: The results of Experiment S2 revealed that the initial soil volumetric water content prior to rainfall ranged between 0.05 and 0.07. During the preliminary rainfall phase, the volumetric water content demonstrated gradual growth. Rapid and substantial increases in volumetric water content occurred at the slope foot by the 3-minute mark, and at the slope top by the 4-minute mark. After 6 min, the pace of volumetric water content increment decelerated. Notably, the volumetric water content at the left slope foot exhibited minor fluctuations and eventually reached saturation during the entire rainfall event. At 8 min, the volumetric water content at the right slope top slightly decreased to 0.22. By 11 min, both the slope foot and slope top experienced declines in volumetric water content, with a more modest decrease registered at the slope foot compared to a more significant reduction at the slope top (Figures 7G,H).
Experiment S3: The outcomes of Experiment S3 revealed that during the initial stages of rainfall for both profiles, there were no marked shifts in soil volumetric water content. After 3–4 min of precipitation, there was a rapid increase in volumetric water content at both the slope foot and slope top. This was followed by a decrease during the subsequent landslide movement. By the 8-minute mark, volumetric water content reduction transpired at both the slope top and slope foot, exposing sensors to the atmosphere. Between minutes 11 and 12, an abrupt reduction in volumetric water content occurred at the right profile’s slope foot and slope top, marking the point at which sensor recordings ceased (Figures 7K, L).
Experiment S4: The results of Experiment S4 demonstrated that noteworthy changes in volumetric water content were absent during the initial rainfall stages. Following 3–4 min of precipitation, a rapid upsurge in volumetric water content emerged, exhibiting similar response times at both the slope foot and slope top. Notably, the maximum volumetric water content at the slope foot and slope top aligned in time before the landslide event. Subsequently, between 7 and 8 min of rainfall, a steep descent in volumetric water content materialized at the left profile. At 9 min, both the slope foot and slope top of the right profile concurrently underwent reductions in volumetric water content. By the 10-minute mark, all sensors were exposed (Figures 7O, P).
Experiment S5: Experiment S5’s outcomes showcased an initial soil volumetric water content of approximately 0.07 prior to rainfall initiation. Within 2 min of precipitation, a swift elevation in volumetric water content occurred at both the slope foot and slope top. By the 3-min mark, the pace of volumetric water content increment moderated. A subsequent surge in volumetric water content transpired at the 5-min point, coinciding with the landslide event. Around the 6-min mark, a reduction in volumetric water content was observed at the left profile, followed by a decrease at the right profile around the 7-minute point. Data collection ceased at this point due to sensor exposure (Figures 7S, T).
Experiment S6: The findings from Experiment S6 indicated an initial volumetric water content ranging from 0.08 to 0.1. In the initial phase of rainfall, the volumetric water content exhibited a gradual increase. Rapid elevations in volumetric water content occurred at depths of 10 cm, 20 cm, and 30 cm at 4, 9, and 12 min, respectively. By the 17-minute mark, the volumetric water content at a depth of 10 cm reached 0.43 before undergoing a sharp decline. Similarly, at 26 min, the volumetric water content at a depth of 20 cm attained saturation at 0.47, followed by a subsequent decrease. Notably, no decline in volumetric water content was recorded at a depth of 30 cm, which remained consistently around 0.47 (Figure 8B).
Experiment S7: The outcomes of Experiment S7 indicated that the initial volumetric water content ranged from 0.07 to 0.08. During the initial phase of rainfall, a gradual increase in volumetric water content was observed. After 6 min, a rapid escalation in volumetric water content transpired at the slope foot. By the 9-minute mark, both the slope foot and slope top reached peak volumetric water content. Subsequently, the volumetric water content exhibited minor fluctuations, maintaining levels between 0.21 and 0.23 (Figure 8D).
Experiment S8: Experiment S8’s findings demonstrated an initial volumetric water content ranging from 0.08 to 0.09. During the initial phase of rainfall, the volumetric water content exhibited gradual augmentation. At 4 min, a rapid increase in volumetric water content was observed at both the slope foot and slope top. Subsequent to 7 min, a volumetric water content decrease materialized at the left profile. By 12 min, a slight reduction in volumetric water content occurred at the right profile’s slope top. Between the 11th and 20th minutes, reductions in volumetric water content unfolded at both the slope foot and slope top. Another decrease in volumetric water content transpired at the slope foot by the 20-minute mark (Figure 8F).
Experiment S9: The results from Experiment S9 demonstrated that during the initial rainfall stages, there was a gradual increase in volumetric water content. After 3 min, a rapid elevation in volumetric water content occurred at the slope foot, closely followed by a similar surge at the slope top. Impressively, the slope foot exhibited a faster response than the slope top. By the 7-minute mark, the right profile’s slope foot reached a maximum value of 0.31, and by the 8-minute juncture, the right profile’s slope top reached its peak at 0.29. By 9 min, both the left profile’s slope foot and slope top achieved their maximum values, with the slope foot at 0.38 and the slope top at 0.31. At this point, the sensors were exposed to air (Figure 8H).
The collective analysis of these nine experiments illuminates that the soil’s initial volumetric water content was relatively low prior to rainfall onset. During the preliminary stages of rainfall, the volumetric water content demonstrated a gradual yet consistent increase. Notably, variations in response times and patterns were observed across different depths of the soil. The shifts in volumetric water content were profoundly influenced by slope failure events, leading to the termination of sensor data collection in some cases. This left sensors exposed to the surrounding atmosphere. The response of volumetric water content often displayed distinct characteristics before and after slope failure, highlighting the dynamic nature of soil-water interactions under varying rainfall conditions.
To investigate the particle migration patterns of landslide soil under various rainfall conditions, uniform sampling was conducted on the fully disrupted landslide deposit following the ending of rainfall experiments. These samples were collected along a vertical profile, moving from top to bottom. For each test, three sets of soil samples were collected, which were subsequently dried in an oven. The dried samples were then mixed and subjected to particle size distribution tests. The effective particle diameter (d10), median particle diameter (d30), and coarse particle diameter (d60) of the soil were calculated and compared with the characteristics of the pre-test soil particles (Figure 9).
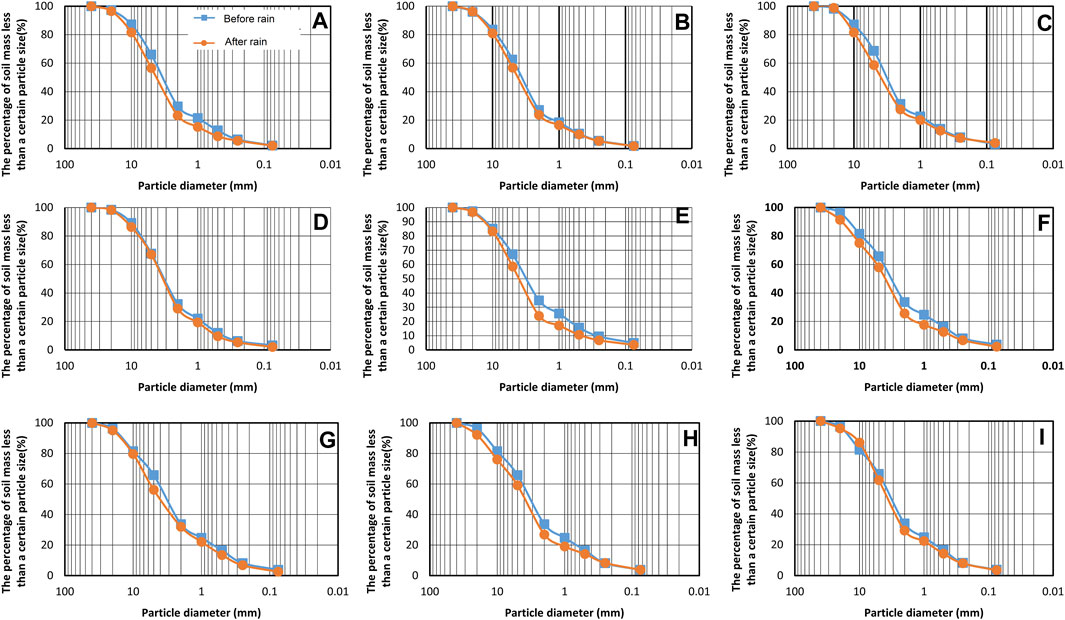
FIGURE 9. The particle size distribution curves of the soil before and after rainfall. Panels (A–I) correspond to experimental models S1 to S9, respectively.
Experiments S1, S3, S4, S8, and S9 all exhibited similar trends: Rainwater turbidity and subsequent fine particle accumulation were observed (Figures 9A, C, D, H, I). Post-rainfall analyses showed a reduction in the fraction of fine particles (those smaller than 2 mm) ranging from 3.8% to 8.1%. Alterations in the d10, d30, and d60 values were noted, generally trending towards an increase. The Coefficient of Uniformity (Cu) showed an overall rise, while the Coefficient of Curvature (Cc) also experienced an increase. These findings collectively suggest a significant migration of fine particles during rainfall, thereby impacting soil particle parameters and the overall stability of landslides.
Experiments S2, S6, and S7 displayed a slightly different pattern: Similar turbidity in rainwater and the accumulation of fine particles were observed (Figures 9B, F, G). The reduction in fine particles after rainfall was within the range of 3.3%–3.34%. Some variations in the d10, d30, and d60 values were identified. Changes in Cu and Cc were present but less pronounced. These experiments suggest a relatively minor impact of fine particle migration.
In Experiment S5: Rainwater turbidity and substantial accumulation of fine particles were observed (Figure 9E). A significant reduction of 11.8% in fine particles smaller than 2 mm occurred post-rainfall. Marked shifts in the d10, d30, and d60 values were evident. Notable changes in Cu and a substantial increase in Cc pointed to extensive fine particle migration during rainfall, with implications for potential erosion and soil strength reduction.
The results of the experiments revealed that the migration of fine particles was a prevalent occurrence during rainfall events. The extent of reduction in fine particles and the degree of change in soil particle parameters varied across different experimental conditions. Under three different rainfall intensities of 60 mm/h, 90 mm/h, and 170 mm/h, the mass fraction of particles smaller than 2 mm decreased significantly after rainfall experiments. Moreover, the characteristic particle size of the soil increased, indicating the occurrence of particle migration. Particularly, the reduction in fine particles was more pronounced under the 60 mm/h rainfall intensity, implying a relationship between particle migration and both rainfall intensity and duration. Moreover, with the prolonged duration of rainfall, the cumulative amount of rainfall also increased, leading to more extensive fine particle migration within the landslide. These migration phenomena could potentially result in particle erosion within the landslide, consequently decreasing soil strength and affecting landslide stability.
Based on the experimental phenomena and results from S1 to S9, we can classify the failure modes observed in the landslide model tests into four distinct types, as detailed below (Figure 10).
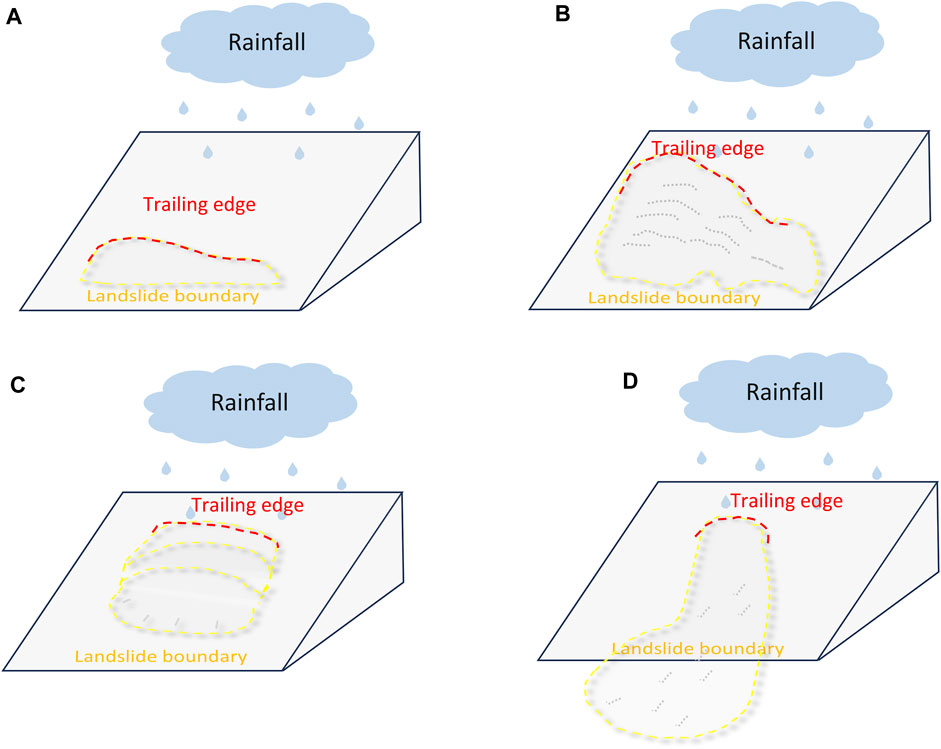
FIGURE 10. Schematic diagrams of slope failure modes: (A) Local toe collapse; (B) Shallow failure; (C) Progressive retreat failure; (D) Global disintegration failure.
Examination of the findings from Experiment S7 (rainfall intensity: 90 mm/h, slope angle: 10°, thickness: 20 cm) reveals that under rainfall conditions, initial erosion occurs on the landslide surface. With continuous rainfall, a minor collapse takes place at the lower toe of the left slope. Subsequent rainfall experiments do not lead to the expansion of the affected area. This specific mode of failure is referred to as a “local toe collapse”. Due to the gentle slope and limited elevation of the landslide, this failure mode is characterized by localized softening and collapse at the toe, typically causing only minor consequences (Figure 10A).
This failure mode corresponds to Experiments S1 (rainfall intensity: 60 mm/h, slope angle: 30°, thickness: 20 cm) and S8 (rainfall intensity: 90 mm/h, slope angle: 20°, thickness: 20 cm). In these instances, the landslide experiences its initial failure after a relatively prolonged period of rainfall. The initial failure occurs at the slope’s toe and involves a small damaged area. As the rain persists, the soil undergoes shallow failure due to the influence of rainwater. While the extent of damage increases compared to the prior stage, the depth of failure remains limited. A portion of the soil accumulates on the landslide body until stability is regained. Unlike the first type, this mode of failure involves some exposed surface due to localized toe collapse. The landslide’s deterioration continues as rainfall persists, until drainage pathways form, eventually stabilizing the landslide body (Figure 10B).
This failure mode corresponds to Experiments S2 (rainfall intensity: 90 mm/h, slope angle: 30°, thickness: 20 cm), S3 (rainfall intensity: 110 mm/h, slope angle: 30°, thickness: 20 cm), and S6 (rainfall intensity: 90 mm/h, slope angle: 30°, thickness: 30 cm). The initial stages of this mode share similarities with the second type. However, due to factors such as increased rainfall intensity, slope angle, or slope body thickness, the landslide body continues to deteriorate after the initial failure under the influence of rainwater. This failure mode progresses in a layered retreat pattern until the complete failure of the landslide body occurs (Figure 10C).
This mode encompasses Experiments S4 (rainfall intensity: 150 mm/h, slope angle: 30°, thickness: 20 cm), S5 (rainfall intensity: 170 mm/h, slope angle: 30°, thickness: 20 cm), and S9 (rainfall intensity: 90 mm/h, slope angle: 40°, thickness: 20 cm). As a result of heightened rainfall intensity and steeper slopes, localized toe collapse coincides with simultaneous failures occurring elsewhere on the landslide body. The timeframe for failure is brief, and the extent of damage is substantial. At a specific point during the rainfall, a large-scale failure event takes place, resulting in the formation of debris flows as the post-failure soil is subjected to the combined forces of rainwater and gravity. This failure mode is aptly termed a “global disintegration failure” (Figure 10D).
Experimental data from trials S1, S2, and S5 were carefully selected for an in-depth analysis of matrix suction and volumetric water content. These experiments were thoughtfully designed to capture the intricate interplay between preferential flow and matrix flow, thus enabling a comprehensive examination of the fluctuations in these two key parameters (Figures 11A–C).
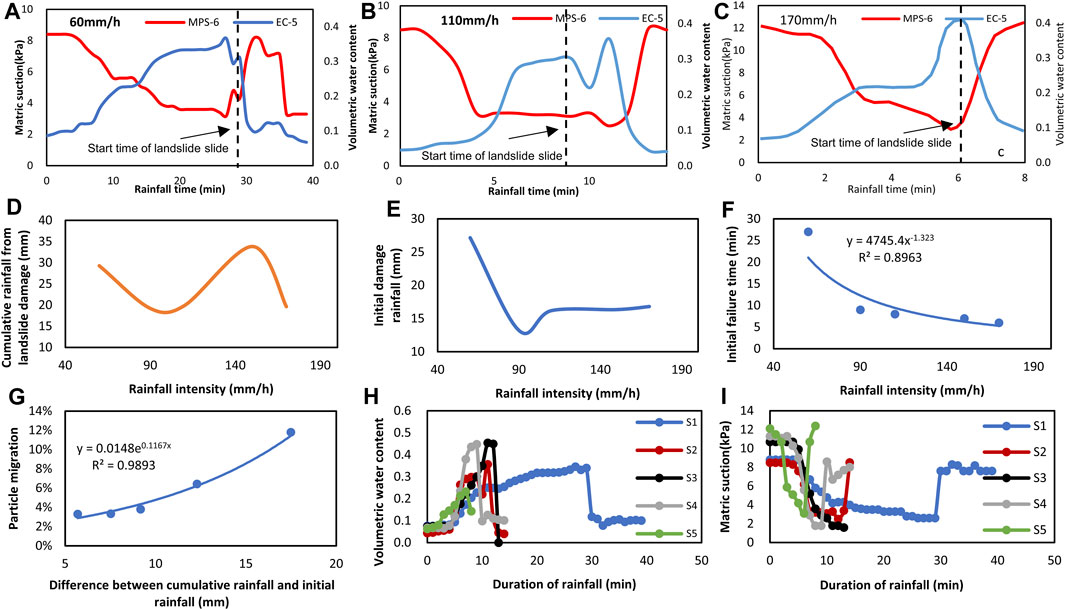
FIGURE 11. (A–C) Variations in matric suction and volumetric water content under three different rainfall intensities; (D) Curve depicting the relationship between rainfall intensity and cumulative rainfall; (E) Curve illustrating the relationship between rainfall intensity and initial failure rainfall; (F) Curve demonstrating the relationship between rainfall intensity and initial failure time; (G) Relationship between rainfall amount and the difference between cumulative rainfall and initial failure rainfall, along with particle migration; (H) Variations in volumetric water content under five different rainfall intensities; (I) Changes in matric suction under five different rainfall intensities.
The intricate dynamics of matrix suction and volumetric water content under varying rainfall intensities are vividly portrayed in Figure 11. In this study, the responses of volumetric water content and matrix suction were harnessed to encapsulate the essence of preferential flow and matrix flow, respectively. Under the influence of a rainfall intensity of 60 mm/h, it becomes apparent that the initial trajectory involves a rise in volumetric water content, while matrix suction remains relatively consistent. This phenomenon of delayed response becomes especially pronounced when the landslide commences its movement at 29 min. This intriguing observation suggests that, at this level of rainfall intensity, preferential flow predominates prior to the establishment of matrix flow (Figure 11A).
As the rainfall intensity escalates to 110 mm/h, the volumetric water content exhibits a gradual ascent during the initial phases, while matrix suction experiences a brief period of stability. Subsequently, the rate of matrix suction decline outpaces the pace of volumetric water content increase. The mutual interaction between the two parameters becomes less distinguishable as the landslide enters its sliding phase. By approximately 9 min, as the landslide slides extensively, the interaction between them becomes considerably more evident, persisting until the volumetric water content reaches 0.35, signifying the complete slope failure. This intriguing phenomenon could be attributed to either the initial spatial distance between certain sensors or the fact that some sensors failed to record the nascent effects when the landslide’s movement commenced. In this context, it is apparent that at this level of rainfall intensity, the discrepancy in the timing of preferential flow and matrix flow diminishes (Figure 11B).
Simultaneously, under the compelling impact of a rainfall intensity of 170 mm/h, both volumetric water content and matrix suction undergo dynamic transformations in the initial stages of precipitation. Across the entire duration of rainfall, matrix suction mirrors the nuanced alterations in volumetric water content, signifying the simultaneous occurrence of preferential flow and matrix flow in response to the heightened rainfall intensity. By closely examining the graph, it becomes evident that the range of volumetric water content during sliding oscillates from 0.35 to 0.41, while the soil’s saturated volumetric water content encompasses the range of 0.45–0.5. This pertinent observation underscores that as the landslide commences its movement, it remains partially saturated, and the eventual failure of the landslide is an outcome derived from the amalgamation of preferential flow and matrix flow (Figure 11C).
In essence, as the ultimate sliding failure of the landslide is reached, the volumetric water content is situated within the range of 0.35–0.41, a range that falls below the threshold of saturation. Consequently, the sliding motion of the soil unfolds within a partially saturated state. The culmination of the landslide’s failure emerges as an intricate interplay between the concurrent mechanisms of preferential flow and matrix flow, with the former manifesting more rapidly than the latter under specific conditions. Furthermore, the diminishing temporal lag in the matrix flow’s response becomes less pronounced as the intensity of rainfall escalates.
We meticulously conducted a comprehensive comparative analysis, utilizing experimental data from five distinct rainfall intensities: S1, S2, S3, S4, and S5. Drawing insights from the derived failure patterns, it is distinctly discernible that an escalation in rainfall intensity invariably results in more pronounced damage to the landslide, accompanied by a reduction in the time required for the initial failure to transpire. The intricate interplay among rainfall intensity, cumulative rainfall, initial failure rainfall, initial failure time, and the discrepancy between cumulative rainfall and initial failure rainfall, with respect to particle migration, is meticulously elucidated. Furthermore, a comprehensive exploration of the interrelationships between the response times of volumetric water content and matrix suction under varying rainfall intensities is thoughtfully presented.
As elegantly illustrated in Figure 11D, it becomes evident that as the rainfall intensity amplifies, neither cumulative rainfall nor initial failure rainfall exhibits a noticeable diminution. Nonetheless, as deduced from Figures 11D, F, it can be inferred that the soil’s inherent capacity for infiltration lies within the spectrum of 90–110 mm/h. Figure 11F compellingly illustrates the variability in the initial failure time of the landslide under diverse rainfall intensities. A direct correlation becomes apparent–higher rainfall intensity begets a shorter time span for initial failure. For instance, at a rainfall intensity of 170 mm/h, the landslide falters within a mere 6 min, whereas at 60 mm/h, a considerable 27 min elapse before the landslide succumbs. The intricacies of particle migration come to the forefront through Figure 11G, which conclusively portrays a positive correlation between the differential magnitude of cumulative rainfall and initial failure rainfall, and the extent of particle migration. Notably, a larger disparity in these values corresponds to a more substantial particle migration phenomenon.
Expanding upon the insights gleaned, Figure 11H elegantly demonstrates that the response time of volumetric water content demonstrates only a modest reduction with escalating rainfall intensity, while it consistently remains concentrated within the range of 3–4 min. Significant exceptions are noted in trials S3 and S4, where soil saturation aligns with the landslide’s ultimate failure, indicating the soil’s effective infiltration capacity within the range of 110–150 mm/h. Further unveiling the intricacies, Figure 11I distinctly outlines the response time pattern of matrix suction vis-à-vis rainfall intensity. As the rainfall intensity intensifies, the reaction time of matrix suction undergoes a curtailed trajectory. Notably, the response times for matrix suction in experiments S1, S2, S3, S4, and S5 are meticulously documented as 6, 5, 5, 4, and 3 min, respectively.
Summing up this comprehensive analysis, it emerges that the pivotal cumulative rainfall requisite for instigating landslide failure maintains its steadiness despite variations in rainfall intensity. The intricate rapport between rainfall intensity and volumetric water content response time may not be distinctly discernible; instead, it finds its nexus with the soil’s inherent infiltration rate. In stark contrast, the nexus between rainfall intensity and matrix suction response time emerges as a pronounced phenomenon, potentially attributed to a lag in matrix suction’s responsiveness under scenarios of lower rainfall intensity, when juxtaposed with volumetric water content. Drawing upon a comprehensive interpretation of Figures 11D–I, the soil’s adept infiltration capacity can reasonably be estimated at approximately 110 mm/h.
Conducting a meticulous comparative analysis, we utilized experimental data derived from four distinct trials encompassing varying slopes: S2, S7, S8, and S9. The intricate interplay among slope angle, cumulative rainfall, initial failure rainfall, and the onset of initial failure time is thoughtfully elucidated. Additionally, the intricate relationships governing the response times of both volumetric water content and matrix suction under diverse slope conditions are exhaustively expounded.
As elegantly portrayed in Figure 12A, the augmentation of slope angles begets an intricate relationship between cumulative rainfall and initial failure rainfall that, while not linear, consistently demonstrates a declining trend. Delving into Figure 12B, the nuanced interplay between diverse slope angles and the corresponding initial failure times of the landslide is impeccably showcased. Notably, an escalation in slope steepness invariably yields a compressed timeframe for the initial failure to unfold. A concrete illustration of this pattern lies in the disparity between a 10° slope, necessitating 40 min for failure, and a steep 40° slope, culminating in failure within an astonishingly brief 6 min. Evident from Figure 12C, the augmentation of slope angles does not lead to a notable reduction in the response time of volumetric water content, as this metric remains consistently centered around the 4-minute mark. The essence of Figure 12D is the rapid responsiveness of matrix suction, particularly notable at slope angles of 20° and 30°.
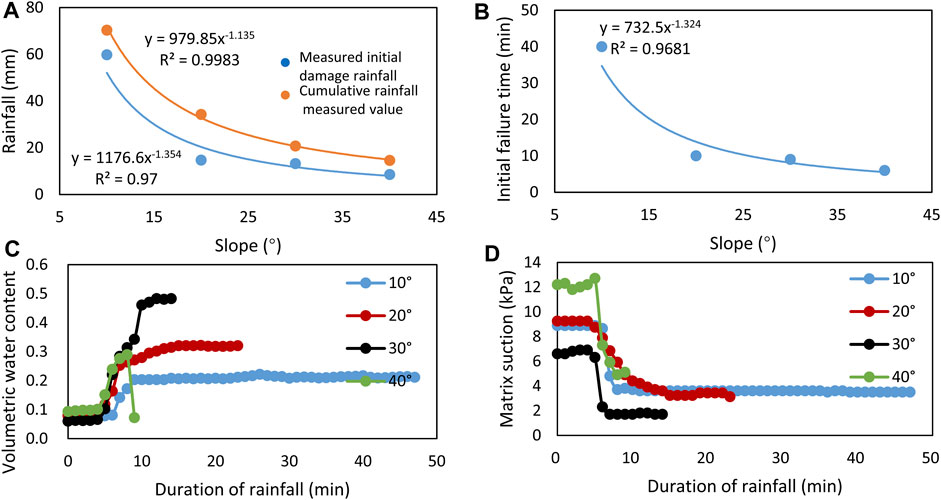
FIGURE 12. (A) Curve illustrating the relationship between slope gradient and initial failure rainfall, as well as cumulative rainfall; (B) Curve depicting the relationship between slope gradient and initial failure time; (C) Variations in volumetric water content under four different slope gradients; (D) Changes in matric suction under four different slope gradients.
In essence, the culmination of this analysis pertaining to diverse slope angles unmistakably underscores the trend toward diminishing cumulative rainfall and initial failure rainfall with ascending slope angles. Notably steeper slope angles predictably engender swifter initial failure times. Despite the ascent in slope angles, the responsiveness of volumetric water content does not significantly abbreviate, whereas matrix suction distinctly reveals a propensity for more rapid responses, particularly manifesting at slope angles of 20° and 30°.
We conducted a thorough analysis, meticulously utilizing experimental data from trial S6, with the primary aim of unraveling the complex relationship between volumetric water content and matrix suction at various depths, as intricately demonstrated in Figure 13.
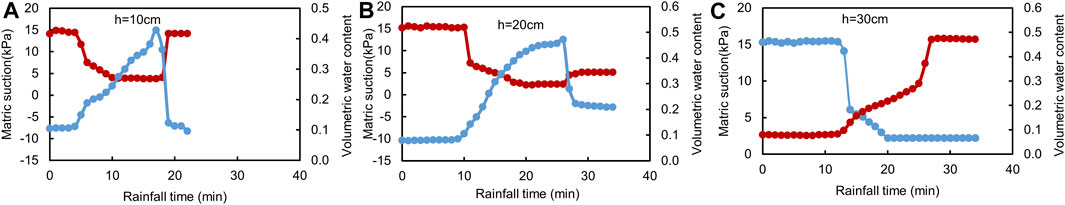
FIGURE 13. The relationship between volumetric water content and matric suction under three different depths.
Upon meticulous scrutiny of Figure 13, a conspicuous pattern emerges wherein an augmentation in depth correlates with an elongated response time for both volumetric water content and matrix suction. Delving into the nuances of the response times of volumetric water content and matrix suction at depths of 10, 20, and 30 cm, a host of salient observations come to the fore: At a depth of 10 cm, the response times of volumetric water content and matrix suction exhibit near-simultaneity, with the soil failing to reach saturation during the landslide event at this depth (Figure 13A). Progressing to a depth of 20 cm, the response time of volumetric water content outpaces that of matrix suction, while the soil does indeed attain saturation during the ensuing landslide (Figure 13B). Descending to a depth of 30 cm, the response times of volumetric water content and matrix suction once again manifest near-simultaneity, this time against the backdrop of soil saturation as the landslide unfolds at this depth (Figure 13C). This compendium of findings unveils a profound interrelationship between depth, volumetric water content, and matrix suction, underscoring the intrinsic variability in response times contingent upon depth and the saturation state of the soil in the wake of landslide occurrences.
Upon keen observation of the deformation phenomena exhibited by the landslide in this experimental setting, conducted under rainfall intensities of 60 mm/h, 110 mm/h, and 170 mm/h, it becomes apparent that the initial sliding event transpired at the base of the slope. Pertinent to the research insights furnished by Li et al. (2019), this occurrence can potentially be ascribed to localized three-dimensional effects intrinsic to the natural slope. It is noteworthy that the lateral boundary constraints inherent in the model slope could potentially introduce certain distortions to the outcomes.
Throughout the course of experiments conducted at rainfall intensities of 60 mm/h, 110 mm/h, and 170 mm/h, the cumulative rainfall exhibited a consistent upward trajectory as a function of time. Nonetheless, the critical cumulative rainfall values for triggering landslide initiation were found to be 27.2, 16.2, and 16.8 mm, respectively. This underscores the non-monotonic relationship between increasing rainfall intensity and the critical thresholds for initial landslide initiation. This intriguing revelation aligns seamlessly with the findings elucidated by Yang et al. (2019), substantiated through inclinometer sensors. In alignment with Horton’s slope infiltration theory, the rate of rainfall infiltration is often notably slower than the runoff rate across the slope surface. Under the experimental conditions characterized by a rainfall intensity of 170 mm/h, the insufficient temporal window for rainwater infiltration led to swift surface runoff that eroded the slope and consequently diminished its stability, culminating in a cascading failure. Conversely, when the rainfall rate falls below the infiltration rate, rainwater can percolate comparatively more comprehensively. For instance, under the rainfall intensity of 60 mm/h, complete rainwater infiltration transpired, inducing a rise in soil water content and self-weight, eventually instigating slope failure due to the stress state breaching the threshold of failure.
Conclusions gleaned from the changes in particle size distribution before and after the rainfall tests conducted in this study proffer insights into the substantial influence wielded by rainfall duration and cumulative rainfall on particle migration. Among these factors, rainfall duration emerged as the most influential, especially discernible under the 60 mm/h rainfall intensity. These findings substantiate the outcomes derived from orthogonal experimental ranges as established by Zhou (2012) Remarkably, antecedent to the onset of instability within the experimental setup, an aggregation of fine particles was perceptible at the slope’s base, mirroring the phenomenon expounded by Cui et al. (2017). However, it is worth mentioning that this accumulation was relatively discreet, potentially attributable to disparities in soil particle sizes and the varying magnitudes of rainfall intensities.
The study encountered certain unexpected results and challenges worth noting. One unexpected result was the finding that the cumulative rainfall required to trigger landslide initiation did not decrease with increased rainfall intensity. This non-monotonic relationship added complexity to understanding landslide initiation under varying rainfall conditions. Additionally, challenges were encountered due to localized three-dimensional effects inherent to natural slopes and potential distortions introduced by the model slope’s lateral boundary constraints. These challenges were addressed through careful consideration and interpretation of the results, acknowledging their potential influence on the outcomes.
It is important to acknowledge the limitations and uncertainties in our study. These limitations influence the generalizability of our findings. For instance, the model slope’s constraints on the lateral boundary might have introduced distortions in the outcomes. Additionally, our study does not address the influence of vegetation or other site-specific factors, which may play a role in actual landslide events. These limitations affect the transferability of our findings to natural settings and should be considered when interpreting the results.
Based on the insights gained from this study, it is pertinent to provide recommendations for future research. Specific areas and aspects of landslide behavior warrant further investigation. For instance, future research can delve deeper into the influence of vegetation and geological heterogeneity on landslide behavior. Moreover, the development of predictive models for landslide initiation under varying rainfall conditions can enhance our ability to assess landslide susceptibility and improve early warning systems. These recommendations guide the direction of future research endeavors in the field of landslide studies.
This study centers on a loose accumulation landslide located at Yuqiupo Group in Kaiyang County of Guizhou, employing it as a case study. The research conducted indoor model tests on rainfall-induced landslides utilizing on-site soil samples from the loose landslide accumulation. By tracing the evolving trends of experimental soil parameters, the response patterns of the accumulation landslide triggered by rainfall infiltration were elucidated. The study delved into the causal mechanisms underlying the landslide and arrived at the following conclusions:
(1) The planform of the Yuqiupo landslide exhibits a tower-like structure with a smaller upper segment and a broader lower segment. The landslide demonstrates a nearly linear profile, featuring a slope length of approximately 140 meters, an average horizontal width of around 60 meters, an average thickness of about 4 meters, and a total volume of roughly 40,000 cubic meters. These dimensions classify it as a small-scale landslide. Rainfall stands as the direct instigator of the Yuqiupo landslide, and the deformation failure mode of the slope is characterized by translational sliding.
(2) Indoor rainfall infiltration tests unveil the distinct patterns governing rainfall infiltration within the accumulation layer landslide. Firstly, the rate of rainfall infiltration is intimately linked to the soil’s permeability capacity. Rainfall intensities surpassing the soil’s permeability capacity do not yield an escalation in the infiltration rate, which is estimated to be approximately 110 mm/h. Secondly, the volumetric water content of the soil demonstrates a close correlation with the slope angle, reaching its zenith at angles of 20–30°, nearing saturation. Moreover, the critical threshold for initiating landslide due to rainfall does not wane with heightened intensity; rather, it decreases with greater slope angles. During the progression of landslide failure, the soil’s volumetric water content hovers around 0.3, signifying unsaturation. The failure arises as a result of the combined interplay between preferential flow and matrix flow. At lower rainfall intensities, matrix flow manifests a delay, but this lag diminishes as intensity escalates. Notably, particle migration does not exhibit significant associations with rainfall intensity and slope angle. However, across varying rainfall intensities, the volume of particle migration correlates positively with the disparity between cumulative rainfall and initial failure rainfall. Additionally, with increasing depth, the response time of volumetric water content and matrix suction elongates. At a depth of 20 cm, the response time of volumetric water content surpasses that of matrix suction. In summary, rainfall-induced changes in soil properties, specifically increased soil moisture content and reduced matrix suction, are primary mechanisms responsible for landslide failure. These processes collectively result in decreased shear strength and increased pore water pressure, leading to slope instability and ultimately landslide initiation. Lastly, the landslide failure modes can be categorized into local collapse, shallow failure, progressive retreat failure, and overall disintegration failure.
(3) Additional context regarding the broader implications of our findings and their applicability to other regions or scenarios with loose accumulation landslides is essential. The insights from this study offer valuable lessons for landslide risk management beyond the Yuqiupo landslide. Understanding the influence of rainfall intensity and other factors on landslide initiation can help in the assessment of landslide susceptibility in regions with similar geological and topographical characteristics. The knowledge gained can guide the development of early warning systems and risk reduction strategies, providing a foundation for mitigating the impact of landslides in various regions.
The original contributions presented in the study are included in the article/supplementary material, further inquiries can be directed to the corresponding author.
QS: Conceptualization, Funding acquisition, Investigation, Resources, Supervision, Validation, Writing–original draft. LZ: Conceptualization, Funding acquisition, Project administration, Resources, Supervision, Validation, Writing–review and editing. YQ: Formal Analysis, Methodology, Writing–review and editing. BL: Software, Visualization, Writing–review and editing.
The author(s) declare financial support was received for the research, authorship, and/or publication of this article. This study was supported by the Guizhou Geological and Mineral Exploration and Development Bureau Research Project (Project No.: Guizhou Geological Science Collaboration [2021] 21).
Author LZ was employed by Guizhou Water Resources and Hydropower Survey Design Institute Co. Ltd.
The remaining authors declare that the research was conducted in the absence of any commercial or financial relationships that could be construed as a potential conflict of interest.
All claims expressed in this article are solely those of the authors and do not necessarily represent those of their affiliated organizations, or those of the publisher, the editors and the reviewers. Any product that may be evaluated in this article, or claim that may be made by its manufacturer, is not guaranteed or endorsed by the publisher.
Abeykoon, T., and Jayakody, S. (2022). FACTORS CONTROLLING RAINFALL-INDUCED SLOPE INSTABILITY OF NATURAL SLOPES IN NORTH MALENY, QUEENSLAND. Int. J. GEOMATE 23 (100), 9–16. doi:10.21660/2022.100.3596
Bai, H., Feng, W., Yi, X., Fang, H., Wu, Y., Deng, P., et al. (2021). Group-occurring landslides and debris flows caused by the continuous heavy rainfall in june 2019 in mibei village, longchuan county, guangdong Province, China. Nat. Hazards 108 (3), 3181–3201. doi:10.1007/s11069-021-04819-1
Bohne, K., Zacharias, S., and Wessolek, G. (2000). Prüfung von 3 Verfahren zur Vorhersage der hydraulischen Leitfähigkeit ungesättigter Böden aus Wasserretentionsdaten oder aus der Bodenart. J. PLANT Nutr. SOIL Sci. 163 (1), 7–12. doi:10.1002/(sici)1522-2624(200002)163:1<7::aid-jpln7>3.0.co;2-#
Chen, H., and Lee, C. F. (2003). A dynamic model for rainfall-induced landslides on natural slopes. GEOMORPHOLOGY 51 (4), 269–288. doi:10.1016/S0169-555X(02)00224-6
Chen, Y. L., Zhao, L. N., Wang, Y., Jiang, Q. G., and Qi, D. (2019). Precipitation data and their uncertainty as input for rainfall-induced shallow landslide models. Front. EARTH Sci. 13 (4), 695–704. doi:10.1007/s11707-019-0791-7
Cui, Y.-f., Zhou, X.-j., and Guo, C.-x. (2017). Experimental study on the moving characteristics of fine grains in wide grading unconsolidated soil under heavy rainfall. J. Mt. Sci. 14 (3), 417–431. doi:10.1007/s11629-016-4303-x
Dahal, R. K., Hasegawa, S., Nonomura, A., Yamanaka, M., Masuda, T., and Nishino, K. (2008). GIS-based weights-of-evidence modelling of rainfall-induced landslides in small catchments for landslide susceptibility mapping. Environ. Geol. 54 (2), 311–324. doi:10.1007/s00254-007-0818-3
Ding, J. X., Yang, Z. F., Shang, Y. J., Zhou, S. H., and Yin, J. T. (2006). A new method for spatio-temporal prediction of rainfall-induced landslide. Sci. CHINA Ser. D-EARTH Sci. 49 (4), 421–430. doi:10.1007/s11430-006-0421-6
Etminan, S., Jalali, V., Mahmoodabadi, M., Siuki, A. K., and Bilondi, M. P. (2021). Assessing an efficient hybrid of Monte Carlo technique (GSA-GLUE) in uncertainty and sensitivity analysis of vanGenuchten soil moisture characteristics curve. Comput. Geosci. 25 (1), 503–514. doi:10.1007/s10596-020-10019-w
Fang, K., Dong, A., Tang, H. M., An, P. J., Zhang, B. C., Miao, M. H., et al. (2023). Comprehensive assessment of the performance of a multismartphone measurement system for landslide model test. LANDSLIDES 20 (4), 845–864. doi:10.1007/s10346-022-02009-z
Gan, J. J., and Zhang, Y. X. (2020). Analysis of model tests of rainfall-induced soil deposit landslide. Adv. Civ. Eng. 2020, 1–13. doi:10.1155/2020/6431247
Guangming, X., Guoli, W., Xingwen, G., and Youjin, Z. (2006). Centrifuge modeling for instability of excavated slope in expansive soil due to water infiltration. Chin. J. Geotechnical Eng. 28 (2), 270–273.
He, S. Q., Liu, Y. X., Yang, J. T., Bai, Z., and Zhao, J. B. (2020). A component response mode and multi-factor model for accumulation landslide displacement induced by reservoir. ROCK SOIL Mech. 41 (8), 2773–2784. doi:10.16285/j.rsm.2019.0537
Herbst, M., and Diekkruger, B. (2002). The influence of the spatial structure of soil properties on water balance modeling in a microscale catchment. Phys. Chem. EARTH 27 (9-10), 701–710. doi:10.1016/S1474-7065(02)00054-2
Li, C., Yao, D., Wang, Z., Liu, C. C., Wuliji, N., Yang, L., et al. (2016). Model test on rainfall-induced loess-mudstone interfacial landslides in Qingshuihe, China. Environ. EARTH Sci. 75 (9), 835. doi:10.1007/s12665-016-5658-6
Li, P., Su, S. R., Ma, C., Dong, Y., and Yarlagadda, P. (2017). “The characteristics of landslide with accumulation layer-bedrock contact surface -taking Langao county in China as an example,” in Proceedings of the 2017 6TH international conference on energy (USA: ENVIRONMENT AND SUSTAINABLE DEVELOPMENT).
Li, R., Bai, W., Wang, Z., Pan, J., Sun, P., and Huo, X. (2019). Research progress and key problems of rainfall slope experiment. Sci. Technol. Rev. 37 (14), 59–65. doi:10.3981/j.issn.1000-7857.2019.14.008
Liang, S., Zeng, W., Gong, X., Chen, J., and Zhong, Z. (2020). Influence of partical gradation on mechanical properties of MICP-treated sand. Yangtze River 51 (2), 179–183. doi:10.16232/j.cnki.1001-4179.2020.02.032
Lin, H., Yu, Y., Li, G., and Peng, J. (2009). Influence of rainfall characteristics on soil slope failure. Chin. J. Rock Mech. Eng. 28 (1), 198–204. doi:10.1002/9780470611807.ch2
Liu, X. L., Wang, S. M., Tan, Y. Z., Hu, X. J., and Zhao, D. P. (2011). “The study on the ratio of similar material in landslide model test,” in Advances in building materials (Germany: PTS).
Ma, J. W., Tang, H. M., Hu, X. L., Bobet, A., Yong, R., and Eldin, M. (2017). Model testing of the spatial-temporal evolution of a landslide failure. Bull. Eng. Geol. Environ. 76 (1), 323–339. doi:10.1007/s10064-016-0884-4
Ma, Z. T., Wang, W. K., Zhang, Z. Y., Brunner, P., Wang, Z. F., Chen, L., et al. (2019). Assessing bare-soil evaporation from different water-table depths using lysimeters and a numerical model in the Ordos Basin, China. HYDROGEOLOGY J. 27 (7), 2707–2718. doi:10.1007/s10040-019-02012-0
Paswan, A. P., and Shrivastava, A. K. (2023). Evaluation of a tilt-based monitoring system for rainfall-induced landslides: development and physical modelling. WATER 15 (10), 1862. doi:10.3390/w15101862
Ran, Q. H., Hong, Y. Y., Li, W., and Gao, J. H. (2018). A modelling study of rainfall-induced shallow landslide mechanisms under different rainfall characteristics. J. HYDROLOGY 563, 790–801. doi:10.1016/j.jhydrol.2018.06.040
Raoof, M., and Pilpayeh, A. (2011). Estimating unsaturated soil hydraulic properties in sloping lands by numerical inversion. J. FOOD Agric. Environ. 9 (3-4), 1067–1070.
Sun, S., and Zhang, Y. (2012). Similarity criterion in physical simulation of rainfall and sheet flow. Trans. Chin. Soc. Agric. Eng. 28 (11), 93–98. doi:10.3969/j.issn.1002-6819.2012.11.016
Van Tien, P., Luong, L. H., Duc, D. M., Trinh, P. T., Quynh, D. T., Lan, N. C., et al. (2021). Rainfall-induced catastrophic landslide in Quang Tri Province: the deadliest single landslide event in Vietnam in 2020. Landslides 18 (6), 2323–2327. doi:10.1007/s10346-021-01664-y
Vasu, N. N., Lee, S. R., Pradhan, A. M. S., Kim, Y. T., Kang, S. H., and Lee, D. H. (2016). A new approach to temporal modelling for landslide hazard assessment using an extreme rainfall induced-landslide index. Eng. Geol. 215, 36–49. doi:10.1016/j.enggeo.2016.10.006
Wang, H. L., Jiang, Z. H., Xu, W. Y., Wang, R. B., and Xie, W. C. (2022). Physical model test on deformation and failure mechanism of deposit landslide under gradient rainfall. Bull. Eng. Geol. Environ. 81 (1), 66. doi:10.1007/s10064-021-02566-y
Wang, J., Xiao, L., Zhang, J., and Zhu, Y. (2019a). Deformation characteristics and failure mechanisms of a rainfall-induced complex landslide in Wanzhou County, Three Gorges Reservoir, China. Landslides 17 (2), 419–431. doi:10.1007/s10346-019-01317-1
Wang, R., Xia, R., Xu, W., Wang, H., and Qi, J. (2019b). Study on physical simulation of rainfall infiltration process of landslide accumulation body. Adv. Eng. Sci. 51 (4), 47–54.
Weihnacht, B., and Boerner, F. (2014). Measurement of retention functions with hysteresis using ground-penetrating radar. NEAR Surf. Geophys. 12 (4), 539–548. doi:10.3997/1873-0604.2014001
Wen, H. J., Xiao, J. F., Wang, X. F., Xiang, X. K., and Zhou, X. Z. (2023). Analysis of soil-water characteristics and stability evolution of rainfall-induced landslide: a case of the siwan village landslide. FORESTS 14 (4), 808. doi:10.3390/f14040808
Wu, L. Z., Zhang, L. M., Zhou, Y., Xu, Q., Yu, B., Liu, G. G., et al. (2018). Theoretical analysis and model test for rainfall-induced shallow landslides in the red-bed area of Sichuan. Bull. Eng. Geol. Environ. 77 (4), 1343–1353. doi:10.1007/s10064-017-1126-0
Xiaojun, Z., Peng, C., and Shitao, J. (2012). Flume test study on the movement of fine grains based on orthogonal design. J. Sichuan Univ. Eng. Sci. Ed. 44 (Suppl. 1), 83–88.
Xing, X. F., Wu, C. L., Li, J. H., Li, X. Y., Zhang, L. M., and He, R. J. (2021). Susceptibility assessment for rainfall-induced landslides using a revised logistic regression method. Nat. HAZARDS 106 (1), 97–117. doi:10.1007/s11069-020-04452-4
Yamaguchi, Y., Makinoshima, F., and Oishi, Y. (2023). Simulating the entire rainfall-induced landslide process using the material point method for unsaturated soil with implicit and explicit formulations. LANDSLIDES 20, 1617–1638. doi:10.1007/s10346-023-02052-4
Yang, J. (2018). Landslide damage from extreme rainstorm geological accumulation layers within plain river basins. J. Coast. Res. 82, 1–11. doi:10.2112/SI82-001.1
Yang, W., Wang, F., Tie, Y., Wang, D., and Ouyang, C. (2021). Characteristics and dynamic process modeling of the rainfall-induced landslide on August 21, 2020 in hanyuan county, China. Front. Earth Sci. 9. doi:10.3389/feart.2021.720872
Yang, X. H., Diao, X. F., Zhou, T. Y., Hu, F., and Wang, S. H. (2023). Study on the stability of accumulated layer landslide under the coupling action of earthquake and rainfall. KSCE J. Civ. Eng. 27 (1), 98–108. doi:10.1007/s12205-022-0110-9
Yang, Z., Cai, H., Lei, X., Wang, L., Ding, P., and Qiao, J. (2019). Experiment on hydro-mechanical behavior of unsaturated gravelly soil slope. Rock Soil Mech. 40 (5), 1869–1880. doi:10.16285/j.rsm.2018.0045
Yang, Z. J., Wang, L. Y., Qiao, J. P., Uchimura, T., and Wang, L. (2020). Application and verification of a multivariate real-time early warning method for rainfall-induced landslides: implication for evolution of landslide-generated debris flows. LANDSLIDES 17 (10), 2409–2419. doi:10.1007/s10346-020-01402-w
Yi, X., Feng, W., Bai, H., Shen, H., and Li, H. (2021). Catastrophic landslide triggered by persistent rainfall in Sichuan, China: August 21, 2020, Zhonghaicun landslide. Landslides 18 (8), 2907–2921. doi:10.1007/s10346-021-01701-w
Zhan, Q. H., Wang, S. M., Guo, F., Chen, Y., Wang, L., and Zhao, D. P. (2022). Early warning model and model test verification of rainfall-induced shallow landslide. Bull. Eng. Geol. Environ. 81 (8), 318. doi:10.1007/s10064-022-02827-4
Zhang, C. Y., Zhang, M., Zhang, T. L., Dai, Z. W., and Wang, L. Q. (2020). Influence of intrusive granite dyke on rainfall-induced soil slope failure. Bull. Eng. Geol. Environ. 79 (10), 5259–5276. doi:10.1007/s10064-020-01895-8
Zhang, S. Q., Jiang, H. C., Fan, J. W., Xu, H. Y., Shi, W., Guo, Q. Q., et al. (2021). Accumulation of a last deglacial gravel layer at diexi, eastern Tibetan plateau and its possible seismic significance. Front. EARTH Sci. 9. doi:10.3389/feart.2021.797732
Zhang, S. X., Li, L., Zhao, D. S., Ni, B., Qiang, Y., and Zheng, Z. (2022). Stability and time-delay effect of rainfall-induced landslide considering air entrapment. Geosci. Lett. 9 (1), 8. doi:10.1186/s40562-022-00216-z
Zhao, L. H., Liu, M., Song, Z. C., Wang, S. G., Zhao, Z. G., and Zuo, S. (2022). Regional-scale modeling of rainfall-induced landslides under random rainfall patterns. Environ. Model. Softw. 155, 105454. doi:10.1016/j.envsoft.2022.105454
Zhou, C., Ai, D., Huang, W., Xu, H. Y., Ma, L. W., Chen, L. C., et al. (2021). Emergency survey and stability analysis of a rainfall-induced soil-rock mixture landslide at chongqing city, China. Front. EARTH Sci. 9. doi:10.3389/feart.2021.774200
Keywords: loose accumulation landslide, rainfall, physical model experiment, water-hydraulic conditions, fine particle migration
Citation: Sun Q, Zhao L, Qin Y and Liu B (2023) Experimental study on the failure of loose accumulation landslides under rainfall conditions. Front. Earth Sci. 11:1291592. doi: 10.3389/feart.2023.1291592
Received: 09 September 2023; Accepted: 10 November 2023;
Published: 28 December 2023.
Edited by:
Faming Huang, Nanchang University, ChinaReviewed by:
Mahfuzur Rahman, International University of Business Agriculture and Technology, BangladeshCopyright © 2023 Sun, Zhao, Qin and Liu. This is an open-access article distributed under the terms of the Creative Commons Attribution License (CC BY). The use, distribution or reproduction in other forums is permitted, provided the original author(s) and the copyright owner(s) are credited and that the original publication in this journal is cited, in accordance with accepted academic practice. No use, distribution or reproduction is permitted which does not comply with these terms.
*Correspondence: Longhui Zhao, YWExNTE1NzM2MjcxQDEyNi5jb20=
Disclaimer: All claims expressed in this article are solely those of the authors and do not necessarily represent those of their affiliated organizations, or those of the publisher, the editors and the reviewers. Any product that may be evaluated in this article or claim that may be made by its manufacturer is not guaranteed or endorsed by the publisher.
Research integrity at Frontiers
Learn more about the work of our research integrity team to safeguard the quality of each article we publish.