 Xue-Jun Zhang
 Xin-Bao Gu
94% of researchers rate our articles as excellent or good
Learn more about the work of our research integrity team to safeguard the quality of each article we publish.
Find out more
ORIGINAL RESEARCH article
Front. Earth Sci., 27 December 2023
Sec. Geohazards and Georisks
Volume 11 - 2023 | https://doi.org/10.3389/feart.2023.1291454
The occurrence of debris flow hazards has significant destructive effects people’s safety and the safety of their property, so the risk assessment of debris flow hazards has great significance. The maximum amount of debris flow at one time (X1), the reserves of loose substance (X2), the watershed area (X3), the length of the ditch (X4), the relative height difference (X5), the gradient of side slope (X6), the longitudinal slope of main ditch (X7), the length ratio of replenishment section (X8), the daily maximum rainfall (X9), and Faults developed in the watershed (X10) are selected as the evaluation index at first. Then the gray system-variable fuzzy sets coupling model is introduced; secondly, the relative membership degree matrix about the fuzzy variable sets is established, and the weight coefficients considering the uncertainty of assessment indices are determined based on the entropy weight method; finally, the susceptibility level of debris flow hazards is determined using the mean ranking feature value. The conclusion is drawn that the results obtained based on the coupling technique are consistent with the current specification; its accuracy arrives at 83%, and the method is feasible for the susceptibility level assessment of debris flow hazards. Compared to the traditional variable fuzzy sets model, it avoids the uncertainty of magnitude in the standard analysis, it can ensure the objectivity and accuracy of the calculation result, and its calculation process is simple and efficient. In total, the findings of the proposed model provide an alternate way to assess the susceptibility level of debris flow hazards and improve the evaluation accuracy in the future.
As the excellent development strategy continues to expand in the west of China, debris flow hazards become a severe problem that hinders economic development and restricts the national quality of life (Gu et al., 2021a). So, risk assessment for debris flow hazards is an indispensable prerequisite to solving the debris flow problem (Gu et al., 2021b; Chen and Zhou, 2019). However, the occurrence and evolution of debris flow is very complex (Wu, 2017). Its influential factors are intricate, and they interact with each other, which is hard to assess quantitatively (Gu et al., 2021c). So, the susceptibility assessment for debris flow hazards has excellent significance.
The investigations on the susceptibility assessment of debris flow have been performed by researchers in many countries (Gu and Wu, 2019). Their investigation method is composed of three types: the heuristics method (Tan et al., 2018), the physical model method (Tsaparas et al., 2002), and the machine learning method (Liang, et al., 2020; Zhang, et al., 2020). The heuristics method mainly depends on the index factor of debris flow derived from the subjective experience, and then the debris flow in the investigation area is depicted; the physical model is adopted to try to reappear the respective conditions of the slope when the geological hazards occurred to determine the safe coefficients of ramps (Gu and Wu, 2016), for example, Gu et al. (2022) assess the susceptibility level of debris flow in the Duba River Watershed using the intuitionistic fuzzy sets-TOPSIS model. However, adjusting model parameters requires a lot of time. So, for the model, the prediction of zonal debris flow still has some limitations (Zhou and Gu, 2016; Zhang, 2020). With the development of computer sciences in recent years, the machine learning method is widely applied to assess the susceptibility level of debris flow hazards (Gu et al., 2019; Zhou et al., 2015). Examples inclde the artificial neural network model (Zhao and Liu, 2005), the decision tree model (Zhou et al., 2017), the logistic regression algorithm (Xiong, et al., 2020), the random forest method (Lai, et al., 2015), and the support vector machine (Yuan, 2008). These methods can calculate the vulnerability index of debris flow directly, and the interference of artificial subjective factors can be avoided (Zhou et al., 2014).
Although the above method has promoted the development of the assessment theory of debris flow hazards enormously, improvement is still needed; for example, the calculative process is complex, and the assessment process in many methods is often quantitative or qualitative. Aiming at the shortcomings of the above methods, the entropy weight-variable fuzzy sets are introduced to assess the susceptibility level of debris flow hazards in Horse Neck Field. It has many virtues; for example, the preciseness of the algorithm in practice is very high, and relatively to traditional variable fuzzy sets theory, the suggested method needs no significant data, and its operation is easy. In addition, it can provide a solution scheme for the evaluation indicators, which are difficult to quantify and reduce the influence of human factors (Gu et al., 2022a); the method is an excellent improvement on the traditional fuzzy sets model (Xie et al., 2023).
The paper is organized as follows: in Section 2, the engineering overview is first introduced; in Section 3, theory and methodology based on the entropy-weight variable fuzzy sets model are presented; in Section 4, the assessment model of the debris flow hazards are established, and the assessment results of the proposed model are compared; in Section 5, discussions and comparative analysis are performed; in Section 6, conclusions are drawn.
Leibo County lies in the southwest of Sichuan Province in China. Horse Neck Field town is located west of Leibo County, approximately 40 km from Leibo County; its location is plotted in Figure 1. The geographical coordinates of the study area are
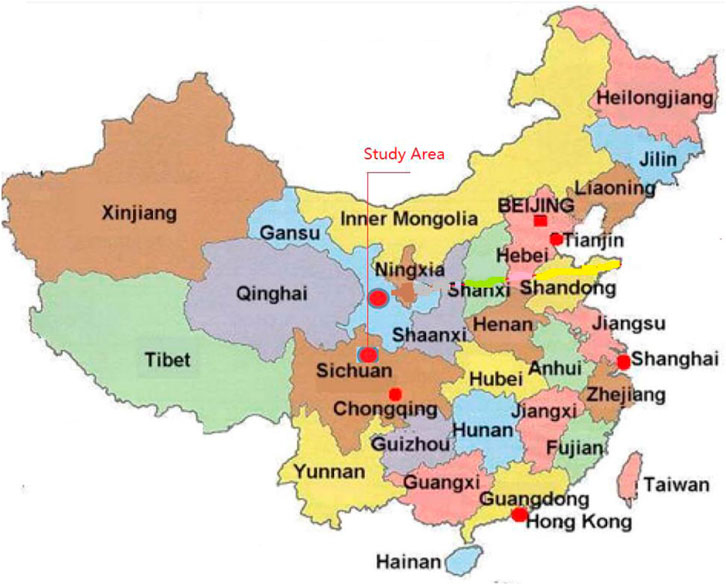
FIGURE 1. The geographical location of the study area.
Horse Neck Field Town is on the left bank of the west Suxijiao River. The geomorphologic features are characterized by deep-cutting tectonic erosion. The lowest elevation of the e-shaped valley is approximately 650 m, and its relative height difference with the highest point of the mountain is around 1130 m. The hill runs almost parallel to the gullies, and the overall profile of the slope is steep, with an average gradient of about 500. The topography and geomorphology of the study area are plotted in Figure 2.

FIGURE 2. Topography and geomorphology of the study area.
There are six branch gullies in the investigation area: Diaolou gully, Fatinghou gully, and the slope debris flow in Horse Neck Field Town. The slope debris flow in Horse Neck Field town comprises 1 # gully, 2 # gully, 3 # gully, and Erdingxi gully. A remote sensing image of these four gullies is shown in Figure 3.
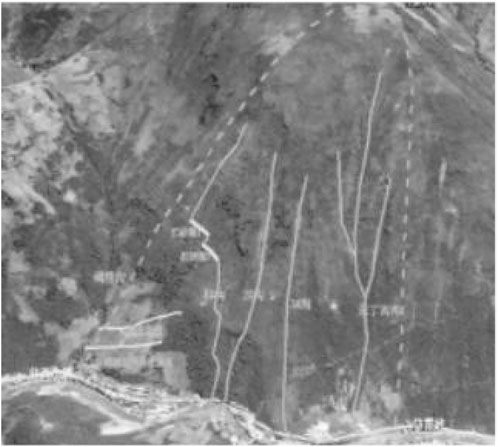
FIGURE 3. The remote sensing image of The slope debris flow.
The variable fuzzy theory (Shao et al., 2022) is a further improvement and expansion of the traditional fuzzy set theory based on dialectical materialism and the relativity and dynamic variability of the development of things, it is defined as follows:
It is assumed that
Where,
Assuming that

FIGURE 4. Linear relationship of the point x in the attractive region and repellent region.
According to the relevant definition, in Figure 2, the point
When
When
Gray system theory (Chen et al., 2022) is a systematic method suggested by Professor Deng Julong to deal with the fuzziness of small samples and lack of information. As the core parameter, the gray correlation degree needs to be calculated by the gray correlation analysis; its basic principle is to determine the degree of correlation among factors by using the similarity of geometric figures of sequential curves. The closer the geometry is, the stronger the correlation is. The basic concepts are as follows:
It is assumed that a sequence of characteristic behaviors of a system is
Further information is available (Hang and Wu, 2019):
Then
Where,
Their calculation procedure is listed as follows:
(1) Determination of evaluated objects and index sets. It is assumed that there are
(2) The dimensionless treatment of index. Assuming that
Where,
So, the dimensionless matrix
(3) The calculation of the sequence difference and maximum and minimum difference, are respectively expressed as:
Where,
Where,
(4) The determination of gray correlation coefficients
Where,
(5) The calculation of the relative membership degree
(6) The determination of index weight coefficients
The entropy weighting method is defined as describing the average amount of information using the concept of entropy (Zhou et al., 2021). Its calculative process is listed as follows:
① Normalization of different indices
Where,
② The determination of index weights
According to the normalized index matrix, the index weights can be depicted:
Where
(7) The calculation of the relative membership degree
Its expression is listed as follows:
Where,
According to Eq. 15, the synthetic membership degree is calculated as:
Where
(8) The determination of assessment results
Based on Eq. 16, the synthetic membership vector
Finally, according to the magnitudes of
The generation mechanism and evolution process of debris flow is very complex, and there are many influencing factors, so the selection of evaluation factors directly affects the final evaluation results. For the assessment model, the evaluation index is often selected based on the actual case in the engineering site. Otherwise, a more significant deviation will occur. According to the actual investigation datum, ten assessment factors in the investigation are selected as the assessment index of debris flow in Horse Neck Field. These indexes are, respectively, the maximum amount of debris flow at one time (X1), the reserves of loose substance (X2), the watershed area (X3), the length of the ditch (X4), the relative height difference (X5), the gradient of side slope (X6), the longitudinal slope of the main ditch (X7), the length ratio of replenishment section (X8), the maximum daily rainfall (X9), and Faults developed in the watershed (X10). According to the relevant specifications, the ten evaluation indexes can be classified into four levels in Table 1: susceptibility level I (low), susceptibility level II (medium), susceptibility level III (great), and susceptibility level IV (strong great). The monitoring value of ten assessment indexes about six branch gullies is depicted in Table 2.
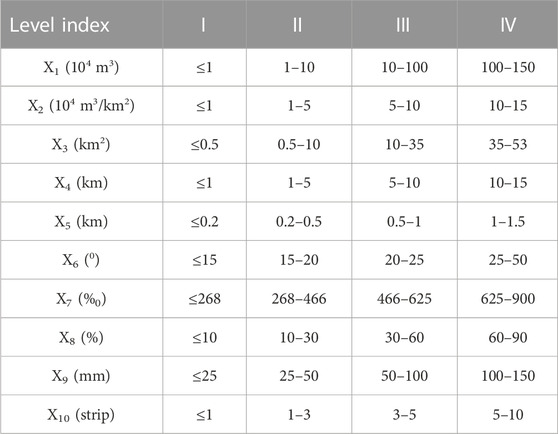
TABLE 1. The risk level classification of debris flow hazards.
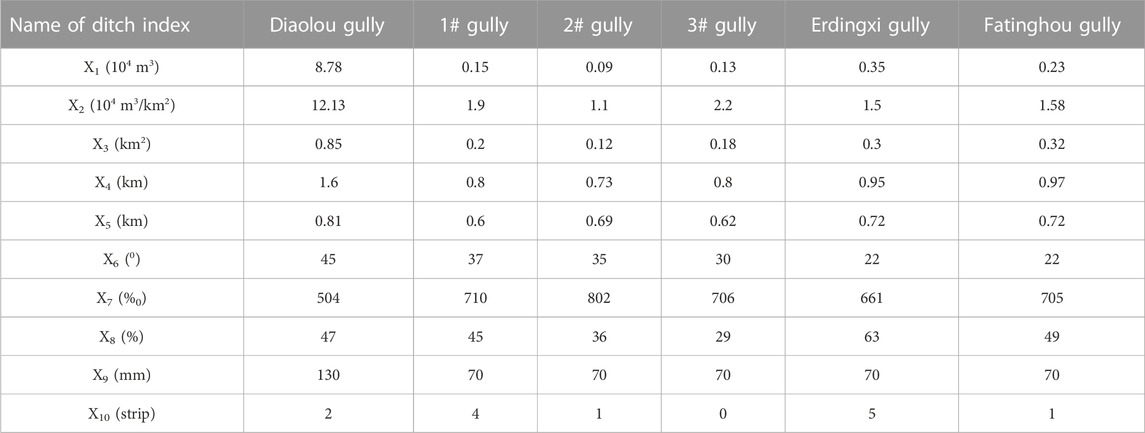
TABLE 2. The monitoring value.
A susceptibility assessment for debris flow hazards significantly influences people’s personal safety and that of their property, so assessing the susceptibility level of debris flow hazards is significant.
A new evaluation method of debris flow is provided in the paper, which is based on the variable fuzzy sets theory, as presented in Figure 5. At first, to evaluate the risk level of debris flow hazards, a complete assessment index system is established. Secondly, the weight of each assessment index is determined according to an entropy weight theory. Thirdly, the relative membership degree is determined using the coupling theory. Then, the magnitudes of synthetic certainty degree are determined; finally, the susceptibility level of debris flow hazards is distinguished.
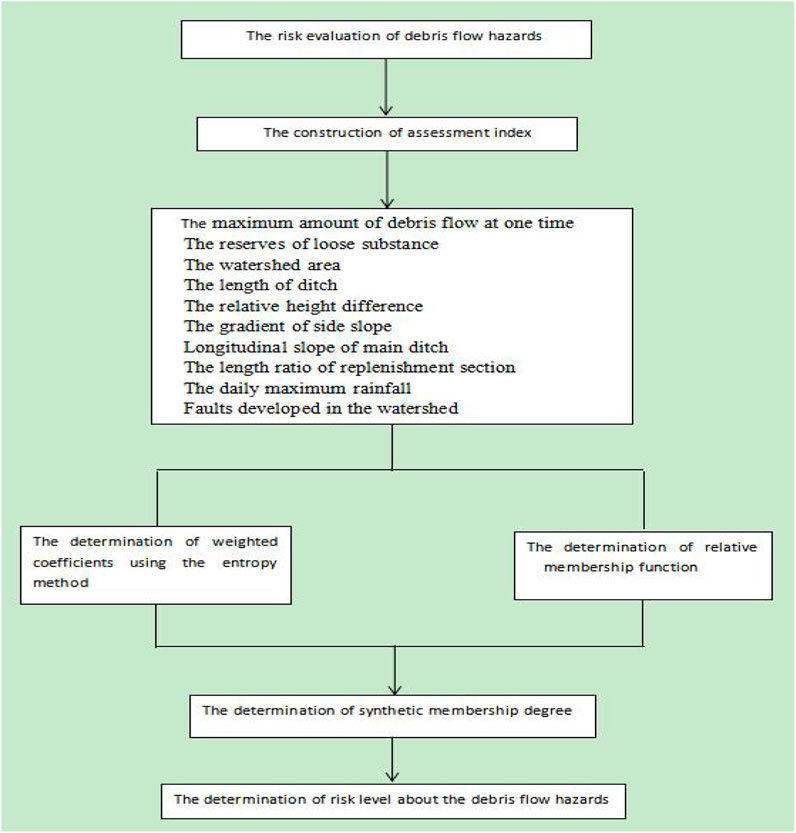
FIGURE 5. The risk evaluation process of the risk level of the debris flow hazards.
(1) The determination of the weight coefficients
According to the entropy method theory and Table 2, the weight coefficients can be calculated in Table 3.
(2) The determination of the relative membership degree matrix

TABLE 3. The weight coefficient matrix.
Based on Table 2, the data in Diaolou Gully is adopted as a sample. The actual magnitude of Diaolou gully in Table 2 usesthe optimal value, and the middle value in the grade interval in Table 1 is regarded as the reference value so that the combination matrix
Based on Eqs 8, 9, the dimensionless matrix
Then, according to Eqs 10–14, the relative membership degree matrix can be expressed as follows:
(3) Determining the comprehensive relative membership degree vector
According to Eq. 15, and in combination with the matrix of
TABLE 4. The comprehensive relative membership vector.
According to Eqs 16, 17, the normalized comprehensive relative membership degree vector can be obtained in Table 5.
TABLE 5. The normalized comprehensive relative membership degree vector.
(3) Determination of the susceptibility level of the debris flow hazards
Based on Eqs 18, 19, and in combination with Table 5, the ranking feature value of debris flow in Diaolou gully can be shown in Table 6.

TABLE 6. The feature value of 1# cross-section.
Similarly, the feature value of the six gullies is shown in Table 7.
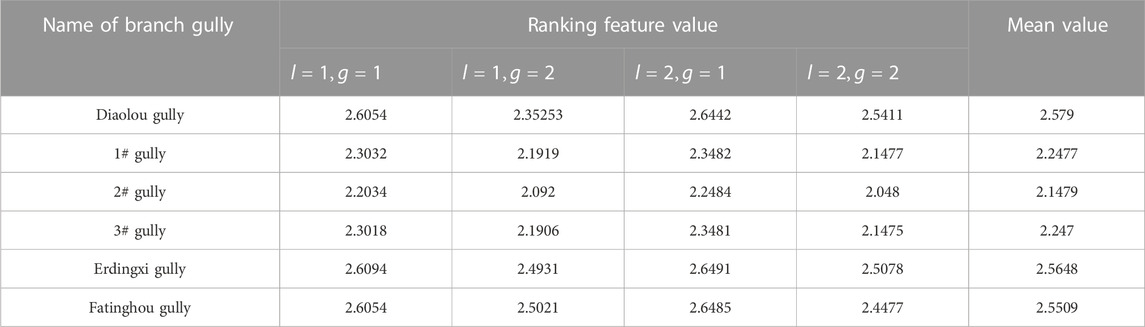
TABLE 7. The assessment values at six cross-sections.
When validating assessment results, the results in this article are compared with other methods, as listed in Table 8.
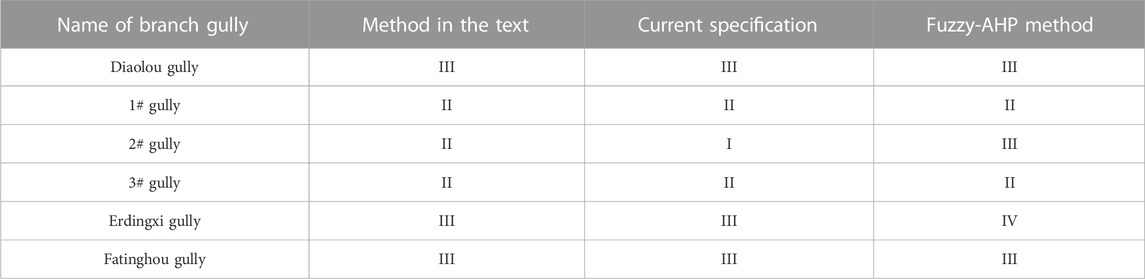
TABLE 8. The comparison of results from the different models.
The coupling model is applied to assess the debris flow hazards. The whole results are shown in Table 8. It can be found from Table 8 that the susceptibility levels of debris flow hazard from the six different gullies are different. The susceptibility level at the 2 # gully is I; at the 1# and 3 # gullies it is II; and at the remaining gullies it is III. This means that the susceptibility level for debris flow at 2 # gully is low; at 1# and 3# medium; and the susceptibility to debris flow at the rest of the gullies is excellent, so the qualified rate of susceptibility level surrounding debris flow hazards in all valleys arrives at 50%. Because the susceptibility level of debris flow hazards at gullies 1–3# is weak, no measurement need be performed, but a correlated safety procedure should be established. However, the susceptibility levels at the other gullies are significant, so the necessary consolidation measurements should be taken to prevent debris flow hazards; for example, steel mesh should be placed across the relevant slopes in the various gullies.
Based on the comparative results of the assessment model in Table 8, it can be found that the outcomes assessed by the suggested method are consistent with the current specification. Its accuracy rate achieves 83% in the text method, which is higher than the results from the Fuzzy-AHP method (67%) (Li and Sun, 2021). Relative to the Fuzzy-AHP method, the suggested method has higher accuracy, and its result has greater objectivity because the Fuzzy-AHP method is dependent on the expert’s experience. In addition, the suggested method takes into consideration more information from indicators, so its predictable results are more reasonable in comparison with the Fuzzy-AHP model. Thus, when estimating the susceptibility level of debris flow hazards in Horse Neck Field, using the suggested model to reach conclusions is feasible. The method provides accurate results and details about the susceptibility level of debris flow hazards. For example, the reserves of loose substance X2 at the Diaolou gully is 12.13, which should fall within level IV according to Table 1. In addition, the degree of membership of the other indices obtained by the provided model comes under level III, so the susceptibility level probability at the Diaolou Gully at level III is more extensive than that of levels I, IV, and II. So, the susceptibility level in the Diaolou Valley adheres soley to level III and only barely qualifies as levels I, IV, and II. Furthermore, the susceptibility level of debris flow hazards at 3# gully is more likely to be level II than the level at 1# gully because the mean ranking feature value (1.7311) at 3# gully for class III is higher than that of 1# gully (1.5039). The results obtained using the suggested model accurately demonstrate the susceptibility level of debris flow hazards and further determine the ranking of debris flow hazards at the same level.
(1) Compared to the traditional variable fuzzy sets model, during the calculative process of relative membership degree, the conventional variable fuzzy set only considers the evaluation interval corresponding to the actual value and adjacent to it, and all other intervals are treated as 0. Traditional methods will lead to the loss of a large number of data related to the indicators; the relative membership degree matrix established by the coupling model considers more information related to the index, and the expression of the membership relationship is more comprehensive and reasonable. In addition, the gray relational analysis has apparent advantages in dealing with the fuzzy calculation of small samples, which are difficult to obtain, such data as debris flow hazards assessment, and the calculation process is simple and efficient.
(2) In the calculation process, the coupling model uses the gray correlation degree instead of the traditional relative membership degree. Thus, it avoids the uncertainty of value in the standard calculation. Especially when the qualitative problem of non-linear change is conducted, in comparison with the traditional analysis, it is highly dependent on the expert experience, and there is no such problem in the coupling model so that it can ensure the objectivity and accuracy of the calculation result as far as possible.
(3) Although the suggested method has many virtues, it still has some limitations. For example, the great complexity and randomness of different indicators should be given further consideration, and the conversion between qualitative and quantitative characteristics for various indicators can not be realized, so the suggested method still has much room to improve in the future.
Considering the maximum amount of debris flow at one time (X1), the reserves of loose substance (X2), the watershed area (X3), the length of the ditch (X4), the relative height difference (X5), the gradient of side slope (X6), the longitudinal slope of the main ditch (X7), the length ratio of replenishment section (X8), the maximum daily rainfall (X9), and the Faults developed in the watershed (X10), a new assessment method is introduced in this article to assess the susceptibility level of debris flow hazards. The relative membership degree matrix of the assessment sample is determined at first using the gray system-variable fuzzy sets. Then, the weighting coefficients are calculated by the coupling method. Finally, the susceptibility level of debris flow hazards is determined using the mean ranking feature value.
The proposed method is applied to assess the susceptibility level of debris flow hazards. The result is compared with the current specifications and the Fuzzy-AHP method. The results obtained based on the suggested method are consistent with the current specification, their accuracy reaching 83%. The qualified rate of debris flow in all gullies comes at 50%. In other words, except for 1–3# gullies, for any other valleys, we should adopt necessary measures to prevent the occurrence of debris flow hazards. The results obtained using the suggested model demonstrate the susceptibility level of debris flow hazards accurately and further determine the level ranking of debris flow hazards at the same level.
Compared to the traditional methods, the suggested model has a significant advantage in dealing with the fuzzy calculation of small samples, and its calculation process is simple and efficient; furthermore, it avoids the uncertainty of magnitude in the standard analysis, and it can ensure the objectivity and accuracy of the calculation result as far as possible. For example, the large complexity and randomness of different indicators should given more consideration, and the conversion between qualitative and quantitative characteristics for various indicators cannot be realized, so the suggested method still has space to improve in the future.
In total, the findings of the proposed model provide an alternate way to assess the susceptibility level of debris flow hazards and improve the evaluation accuracy in the future.
The raw data supporting the conclusion of this article will be made available by the authors, without undue reservation.
X-JZ: Formal Analysis, Investigation, Writing–review and editing. X-BG: Funding acquisition, Methodology, Writing–original draft.
The author(s) declare financial support was received for the research, authorship, and/or publication of this article. This work is supported by Sichuan Science and Technology Program (No: 2020YJ0424), Regional Innovation Cooperation Programs of Sichuan province (2021YFQ0050), the Opening Project of Sichuan Province University Key Laboratory of Bridge Non-destruction Detecting and Engineering Computing (2022QYJ02, 2022QYY02), Key scientific research projects of colleges and universities in Henan province (23B560019).
The authors declare that the research was conducted in the absence of any commercial or financial relationships that could be construed as a potential conflict of interest.
All claims expressed in this article are solely those of the authors and do not necessarily represent those of their affiliated organizations, or those of the publisher, the editors and the reviewers. Any product that may be evaluated in this article, or claim that may be made by its manufacturer, is not guaranteed or endorsed by the publisher.
Chen, J., Shou, Y., and Zhou, X. (2022). Implementation of the novel perfectly matched layer element for elastodynamic problems in time-domain finite element method. Soil Dyn. Earthq. Eng. 152, 107054. doi:10.1016/j.soildyn.2021.107054
Chen, J. W., and Zhou, X. P. (2019). The enhanced extended finite element method for the propagation of complex branched cracks. Eng. Analysis Bound. Elem. 104, 46–62. doi:10.1016/j.enganabound.2019.03.028
Gu, X. B., Ma, Y., Wu, Q. H., Ji, X. J., and Bai, H. (2021c). The risk assessment of landslide hazards in Shiwangmiao based on intuitionistic fuzzy sets-Topsis model. Nat. Hazards 9, 283–303. doi:10.1007/s11069-021-05053-5
Gu, X. B., Shao, J. L., Wu, S. T., Wu, Q. H., and Bai, H. (2021a). The risk assessment of debris flow hazards in zhouqu based on the projection pursuit classification model. Geotechnical Geol. Eng. 8 (1), 1267–1279. doi:10.1007/s10706-021-01961-2
Gu, X. B., Wang, L., and Wu, Q. H. (2022a). The risk assessment of debris flow in the Duba River Watershed using intuitionistic fuzzy sets: TOPSIS model. Math. Problems Eng., 12. doi:10.1155/2022/2031907
Gu, X. B., and Wu, Q. H. (2016). The application of nonordinary, state-based peridynamic theory on the damage process of the rock-like materials. Math. Problems Eng. 3 (8), 1–9. doi:10.1155/2016/9794605
Gu, X. B., and Wu, Q. H. (2019). Seismic stability analysis of waterfront rock slopes using the modified pseudodynamic method. Geotech. Geol. Eng. 37 (3), 1743–1753. doi:10.1007/s10706-018-0718-1
Gu, X. B., Wu, Q. H., and Ma, Y. (2022b). Risk assessment of the rockburst intensity in a hydraulic tunnel using an intuitionistic fuzzy sets-TOPSIS model. Adv. Mater. Sci. Eng. 2022, 1–14. doi:10.1155/2022/4774978
Gu, X. B., Wu, Q. H., and Zhu, Y. H. (2019). The experimental investigation on the propagation process of crack for brittle rock similar material. Geotechnical Geol. Eng. 37 (6), 4731–4740. doi:10.1007/s10706-019-00934-w
Gu, X. B., Wu, S. T., Ji, X. J., and Zhu, Y. H. (2021b). The risk assessment of debris flow hazards in Banshanmen gully based on the entropy weight normal cloud method. Adv. Civ. Eng. 21, 1–11. doi:10.1155/2021/8841310
Hang, S. H., and Wu, G. (2019). Debris flow susceptibility and its re-liability based on random forest and GIS. Earth Sci. 44 (9), 3115–3134.
Lai, C. G., Chen, X. H., and Zhao, S. W. (2015). A flood risk assessment model based on random forest and its application. J. Hydraulic Eng. 46 (1), 58–66.
Li, H. J., and Sun, Y. (2021). Risk assessment of debris flow in sichuan Horse Neck field on fuzzy analytic hierarchy process. Microcomput. Appl. 37 (12), 123–129.
Liang, Z., Wang, C., Zhang, M. A., and Khan, K. U. J. (2020). A comparison of statistical and machine learning methods for debris flow susceptibility mapping. Stoch. Environ. Res. Risk Assess. 34 (11), 1887–1907. doi:10.1007/s00477-020-01851-8
Shao, J. L., Gao, L., Wu, Q. H., and Gu, X. B. (2022). The application of variable fuzzy sets theory on the quality assessment of surrounding rocks. Adv. Mater. Sci. Eng. 37 (3), 1–10. doi:10.1155/2022/5441829
Tan, S. C., Zhao, J. J., and Yang, L. (2018). Evaluation of land-slide susceptibility based on GIS and the information value & the K-means cluster model: take Fugong County as an example. J. Yunnan University:Natural Sci. Ed. 40 (6), 1148–1158.
Tsaparas, I., Rahardjo, H., Toll, D. G., and Leong, E. (2002). Controlling parameters for rainfall-induced landslides. Comput. Geotechnics 29 (1), 1–27. doi:10.1016/S0266-352X(01)00019-2
Wu, W., He, L., Li, W., Li, H., Wong, W. M., Ramakrishna, S., et al. (2017). Functional self-assembling peptide nanofiber hydrogel for peripheral nerve regeneration. Geol. Disasters Environ. Prot. 3, 21–30. doi:10.1093/rb/rbw034
Xie, Y., Hou, M., and Li, C. (2023). Anisotropic characteristics of acoustic emission and the corresponding multifractal spectrum during progressive failure of shale under cyclic loading. Int. J. Rock Mech. Min. Sci. 165, 105364. doi:10.1016/j.ijrmms.2023.105364
Xiong, K., Adhikari, B. R., Stamatopoulos, C., Zhan, Y., Wu, S., Dong, Z., et al. (2020). Comparison of different machine learning methods for debris flow susceptibility mapping: a case study in the sichuan province, China. Remote Sens. 12 (2), 295–310. doi:10.3390/rs12020295
Zhang, M. (2020). Hazard assessment of debris flow along highway of high altitude cold and intensity regions with aid of ArcGIS. Chin. J. Geol. Hazard Control 31 (2), 111–122.
Zhao, Y., and Liu, X. L. (2005). Application of ANN to risk assessment on debris flow. J. Geol. Hazards Environ. Preserv. 16 (2), 135–138.
Zhou, X. P., Bi, J., and Qian, Q. H. (2015). Numerical simulation of crack growth and coalescence in rock-like materials containing multiple pre-existing flaws. Rock Mech. Rock Eng. 48 (3), 1097–1114. doi:10.1007/s00603-014-0627-4
Zhou, X. P., Cheng, H., and Feng, Y. F. (2014). An experimental study of crack coalescence behaviour in rock-like materials containing multiple flaws under uniaxial compression. ROCK Mech. ROCK Eng. 47 (6), 1961–1986. doi:10.1007/s00603-013-0511-7
Zhou, X. P., Gu, X. B., Yu, M. H., and Qian, Q. H. (2016). Seismic bearing capacity of shallow foundations resting on rock masses subjected to seismic loads. KSCE J. Civ. Eng. 20 (1), 216–228. doi:10.1007/s12205-015-0283-6
Zhou, X. P., Pan, X. K., and Cheng, H. (2021). The nonlinear creep behaviors of sandstone under the different confining pressures based on NMR Technology. Rock Mech. Rock Eng. 54 (9), 4889–4904. doi:10.1007/s00603-021-02557-1
Keywords: debris flow hazards, variable fuzzy sets, application, level, susceptibility assessment
Citation: Zhang X-J and Gu X-B (2023) The application of gray system-variable fuzzy sets coupling theory on the susceptibility assessment of debris flow hazards. Front. Earth Sci. 11:1291454. doi: 10.3389/feart.2023.1291454
Received: 09 September 2023; Accepted: 23 October 2023;
Published: 27 December 2023.
Edited by:
Xiaoping Zhou, Chongqing University, ChinaReviewed by:
Nan Xiao, Changsha University of Science and Technology, ChinaCopyright © 2023 Zhang and Gu. This is an open-access article distributed under the terms of the Creative Commons Attribution License (CC BY). The use, distribution or reproduction in other forums is permitted, provided the original author(s) and the copyright owner(s) are credited and that the original publication in this journal is cited, in accordance with accepted academic practice. No use, distribution or reproduction is permitted which does not comply with these terms.
*Correspondence: Xin-Bao Gu, MzA1MTA3MUBueWlzdC5lZHUuY24=
Disclaimer: All claims expressed in this article are solely those of the authors and do not necessarily represent those of their affiliated organizations, or those of the publisher, the editors and the reviewers. Any product that may be evaluated in this article or claim that may be made by its manufacturer is not guaranteed or endorsed by the publisher.
Research integrity at Frontiers
Learn more about the work of our research integrity team to safeguard the quality of each article we publish.