
94% of researchers rate our articles as excellent or good
Learn more about the work of our research integrity team to safeguard the quality of each article we publish.
Find out more
ORIGINAL RESEARCH article
Front. Earth Sci., 15 December 2023
Sec. Biogeoscience
Volume 11 - 2023 | https://doi.org/10.3389/feart.2023.1290882
This article is part of the Research TopicNatural Methane Emissions in a Changing Arctic - Implications for Climate and EnvironmentView all 16 articles
 Muhammed Fatih Sert1*
 Hannah D. Schweitzer2,3
 Tim R. de Groot4
 Timo Kekäläinen5
 Janne Jänis5
 Hans C. Bernstein2,3
 Bénédicte Ferré1
 Friederike Gründger6
 Dimitri Kalenitchenko1,7
 Helge Niemann1,4,8
Cold seeps release methane (CH4) from the seafloor to the water column, which fuels microbially mediated aerobic methane oxidation (MOx). Methane-oxidising bacteria (MOB) utilise excess methane, and the MOB biomass serves as a carbon source in the food web. Yet, it remains unclear if and how MOx modifies the composition of dissolved organic matter (DOM) in cold seeps. We investigated MOx rates, DOM compositions and the microbial community during ex-situ incubations of seawater collected from a cold seep site at Norskebanken (north of the Svalbard archipelago) in the Arctic Ocean. Samples were incubated with and without methane amendments. Samples amended with methane (∼1 µM final concentration) showed elevated rates of MOx in both seep and non-seep incubations. Fourier transform ion cyclotron resonance mass spectrometry (FT-ICR MS) analyses showed that the number of DOM formulas (i.e., molecular diversity) increased by up to 39% in these incubations. In contrast, the number of formulas decreased by 20% in samples not amended with methane, both from non-seep and seep locations. DOM composition was thus altered towards a more diverse and heterogeneous composition along with elevated methanotrophic activity in methane-amended conditions. In addition to microbial DOM production, abating microbial diversity indicates that elevated DOM diversity was potentially related to grazing pressure on bacteria. The diversity of DOM constituents, therefore, likely increased with the variety of decaying cells contributing to DOM production. Furthermore, based on a principal coordinate analysis, we show that the final DOM composition of non-seep samples amended with methane became more resemblant to that of seep samples. This suggests that methane intrusions will affect water column DOM dynamics similarly, irrespective of the water column’s methane history.
Dissolved organic matter (DOM) in the open ocean is a heterogeneous mixture of organic compounds. DOM originates predominantly from marine primary production and further modification through a plethora of microbial and abiotic processes (Sjöstedt et al., 2021). The main microbial control on the marine DOM cycle is that primary producers transform inorganic nutrients into organic matter (dissolved and particulate) in the epipelagic ocean, and heterotrophic microbes decompose DOM to inorganic nutrients, which may then again fuel primary producers (Amon and Benner, 1996; Kujawinski, 2011; Carlson and Hansell, 2015). In addition to these two key players, protozoa, zooplankton, and viruses are also taking part in DOM cycling as they are involved in various production and decomposition mechanisms (Carlson and Hansell, 2015).
Despite the increasing number of studies addressing the interaction of microbes with DOM, pathways that generate functional and chemical diversity of DOM are poorly identified (Lau and del Giorgio, 2020). This is mainly caused by the complexity, variety and interactions of microbial processes that cannot be constrained to single mechanisms in environmental samples. Nevertheless, monoculture and co-culture experiments point out that microbes can control DOM composition by releasing unique characteristics of metabolites depending on isolation or grazing factors/conditions (Kujawinski et al., 2004; Rosselló-Mora et al., 2008; Kujawinski et al., 2016). Closely related species may produce similar suites of DOM (Becker et al., 2014; Lian et al., 2021) by producing chemically diverse and mostly persistent exometabolites from simple substrates (Lechtenfeld et al., 2015; Osterholz et al., 2015; Noriega-Ortega et al., 2019).
One important microbial process in the ocean water column that may affect DOM composition is the aerobic oxidation of methane (MOx) (Pohlman et al., 2011; Kalyuzhnaya et al., 2013; Sert et al., 2020). MOx is mediated by aerobic methane-oxidising bacteria (MOB) for energy gain and growth (Hanson and Hanson, 1996):
It is the final sink for methane in the ocean water column before reaching the atmosphere, where it contributes to global warming (Reeburgh, 2007; Graves et al., 2015; Steinle et al., 2015). In the ocean, methane is often released from sea floor point sources, so called cold seeps, where methane bubbles emanating from the sea floor are a commonly observed feature (James et al., 2016). Various geological and geochemical mechanisms and processes have been suggested as a source of seeping methane from the arctic continental shelf (Bünz et al., 2012; Berndt et al., 2014; Serov et al., 2015; James et al., 2016; Andreassen et al., 2017). Regardless of the methane source, a substantial part of the seeping methane is utilised by MOBs (Boetius and Wenzhöfer, 2013; James et al., 2016). It has been suggested that seep-derived biogeochemical processes also modify the water column DOM composition towards a more bioavailable and heterogeneous composition at Arctic Ocean cold seeps (Sert et al., 2020). MOBs are known to produce a number of organic compounds as part of their metabolism, including small molecules such as methanol (Hanson and Hanson, 1996) that are more accessible to a broader range of microbes. MOBs also produce microbial biomass comprised of e.g., lipids, fatty acids, hopanoids and steroids (Elvert and Niemann, 2008) as well as proteins (Kerckhof et al., 2021). Some strains of MOBs can also utilise carbon substrates other than methane, such as acetate, pyruvate and succinate (Dedysh et al., 2005; Theisen and Murrell, 2005; Murrell, 2010). However, the influence of MOx on water column DOM systematics on short-time scales remains mostly unresolved.
In highly complex environmental systems (e.g., cold seeps), tracing the unique signatures of a particular type of microorganism is challenging. We used an ex-situ incubation approach to (in part) constrain this complexity. Our objective was to control the temperature, light conditions and methane concentrations and provide an opportunity to elevate the activity of MOBs, which are ubiquitous organisms that are capable of utilising methane in the oxic marine water column (Hanson and Hanson, 1996; Lidstrom, 2006; Kalyuzhnaya et al., 2019). In a closed, partially controlled medium, MOx can thus be stimulated by elevating methane concentration, and all the organisms that can benefit from methane could contribute to the composition of DOM. Despite the growing interest in assessing the interactions of microbes with marine DOM, biochemical mechanisms are too versatile and complex to be fully resolved. This study provides a basis for assessing the impact of methanotrophy on DOM compositions in cold seep environments.
Seawater for the incubation medium was collected in the framework of cruise CAGE 20-7 (Ferré et al., 2020b) with R/V Kronprins Haakon at Norskebanken (ca. 80° 37′N, 14° 20′E), which is located on the continental shelf north of the Svalbard archipelago in the Arctic Ocean (Figure 1). Methane seepage was discovered at this location in 2013 (Geissler et al., 2016). We sampled two stations: one within a cluster of methane release sites (seep station) and a second one outside the methane seepage area ∼4 km to the West of the seep station (non-seep station). Water samples were collected ∼3 m above the seafloor with Niskin bottles mounted on a rosette sampler equipped with a Sea-Bird 911 plus CTD (Conductivity Temperature Depth) profiler and an SBE 43 oxygen sensor.
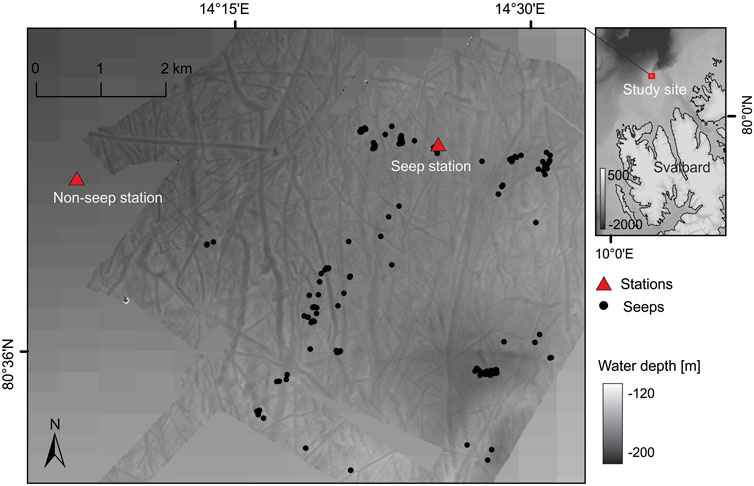
FIGURE 1. Bathymetric map of the study site showing the stations where water samples were taken for the incubation experiments (red triangles). Methane flares detected using the ship’s multibeam echosounder are indicated (black dots).
The following sampling procedure and incubation protocols were carried out at both stations: immediately after recovery of the rosette sampler, we subsampled the Niskin bottles for methane concentration and MOx measurements (methods described below) to characterise the initial conditions of the incubation medium. Then, 12 muffled glass bottles of 1,135 mL (total volume) were filled with 1,000 mL of bottom water as incubation medium (Figure 2). The bottles were sealed with airtight stoppers made of bromobutyl rubber (SCHOTT DURAN). Four out of these twelve bottles were amended with 100 μL of pure methane (≥99.0% purity, Sigma-Aldrich) with an airtight syringe immediately after capping, while the remaining eight bottles were not amended. All twelve bottles were placed horizontally in a dark, temperature-controlled incubator at 4°C. Four unamended bottles were processed within 6 h to characterise initial incubation conditions. The remaining eight bottles (four amended and four unamended) were incubated for approximately 3 days until final sampling and characterisation.
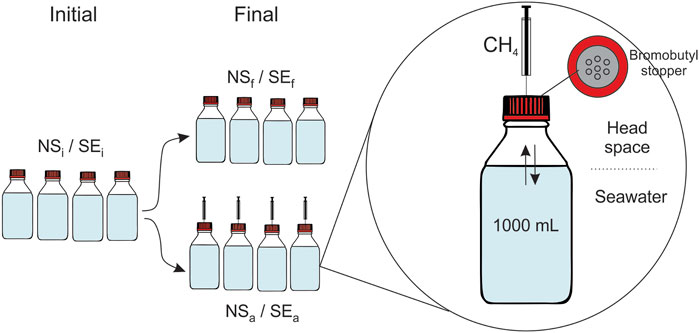
FIGURE 2. Schematic of experimental design of seawater incubations from non-seep (NS) and seep stations (SE) for either initial (i), final (f) or methane-amended final (a) conditions.
The same procedure was carried out at both seep and non-seep stations, resulting in a total of 24 bottles of six different incubation conditions with four replicates: non-seep initial (NSi), non-seep final (NSf) and non-seep amended final (NSa) from the non-seep station and seep initial (SEi), seep final (SEf), and seep amended final (SEa) from the seep station (see Figure 2; Table 1).
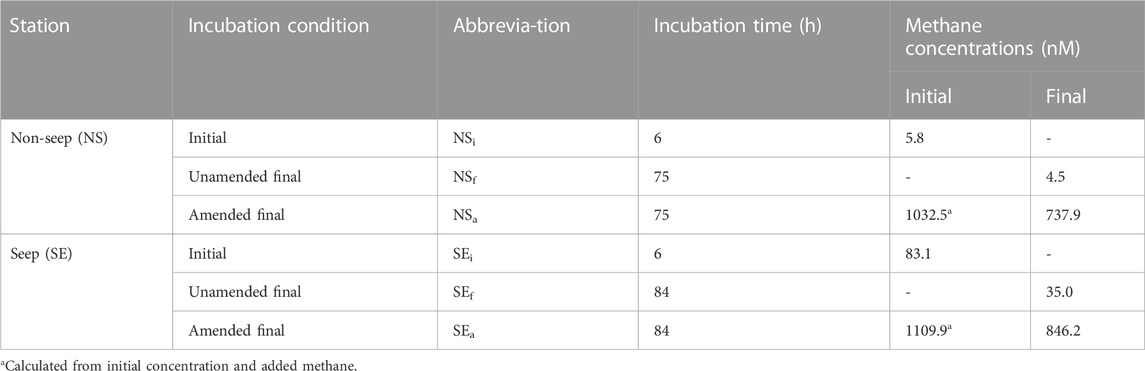
TABLE 1. Overview of the experimental conditions during incubation of water column samples from non-seep and seep locations. Abbreviations indicated here also used in the text.
Samples for methane concentration measurements for the initial characterisation of the incubation samples (NSi and SEi) were collected headspace free from Niskin bottles into 120 mL serum vials, fixed with 1 mL of NaOH solution (1 M) and crimp top sealed with bromobutyl septa. For methane concentration measurements from the incubation bottles (NSf, NSa, SEf and SEa), a 1 mL aliquot of headspace gas was sampled with a gas-tight syringe through the bromobutyl septa of the bottle caps at the end of the incubation. The 1 mL aliquot of headspace was then injected into 20 mL crimp top vials (Thermo) filled bubble-free with 0.1 M sodium hydroxide solution by replacing the same amount of solution with the help of a second syringe. Samples were stored at 4°C until analysis in the laboratory on land.
For MOx measurements, quadruplicates of 20 mL crimp top vials were filled from the Niskin bottles (initial conditions: NSi and SEi). Similarly, aliquots were subsampled from the incubation bottles after incubation (final conditions, NSf, NSa, SEf and SEa). All vials for MOx measurements were sealed bubble-free with grey-bromobutyl stoppers that are known not to hamper methanotrophic activity (Niemann et al., 2015).
Sampling for the remaining analyses was carried out as follows: four replicates of each incubation condition were filtered separately through a 0.22 µm polyether sulfone membrane filter (Millipore Sterivex) with a peristaltic pump. Filters were stored at −80°C for DNA extraction. Filtration effluent from one bottle was used for nutrients and dissolved organic carbon (DOC); i.e., 50 mL aliquots were collected into 60 mL high-density polyethylene containers and stored at −20°C until analysis of nitrate, phosphate, silicate, and DOC concentration. The remaining three bottles were used for DOM characterisation; for solid-phase extraction (SPE) of DOM, 3 × 1 L of the filtrate was acidified to pH 2 with HCl (37% v/v, Merck) and extracted with preconditioned (6 mL methanol +12 mL pH 2 water) 500 mg PPL cartridges (BondElut, Agilent Technologies) (Dittmar et al., 2008). Following the sample extraction, the cartridges were dried under an air vacuum for about 30 min, and concentrated SPE-DOM samples were eluted into pre-combusted, amber glass vials with 2 mL methanol and stored at −20°C until FT-ICR MS analysis.
Methane samples were analysed within a week after the cruise using a gas chromatography (GC) system in our home laboratory (Thermo Scientific, GC Trace 1,310, FID detector, MSieve 5A column), as explained previously (Sert et al., 2020).
Dissolved oxygen was measured directly in the incubation media with a needle-type oxygen probe (Unisense fx-6 UniAmp, OPTO-50) at the beginning and the end of the incubations. For this, we pierced through the rubber septa of the bottle caps.
MOx rates were determined by ex-situ incubations with trace amounts of 3H-labelled CH4, as described previously (Niemann et al., 2015; Steinle et al., 2015). Briefly, each sample was amended with 5 µL of 3H-CH4/N2 (18.5 kBq, American Radiolabelled Chemicals, United States of America) and incubated for 48 h in the dark at in situ temperatures. Activities of residual C3H4 and the MOx product 3H2O were measured by liquid scintillation counting. First-order rate constants (kMOx) were determined from fractional tracer turnover:
where t is the incubation time in days. kMOx was corrected for tracer turnover in killed controls (kKC <0.003 days -1; fixed with 50 µL HgCl2) and multiplied with methane concentrations [CH4], yielding MOx:
Nitrate, silicate, and phosphate concentrations were measured colourimetrically with a segmented flow nutrient analyser (ALPKEM Flow Solution IV, OI Analytical) with detection limits of 0.5 µM for nitrate, 0.06 µM for phosphate and 0.4 µM for silicate (Grasshoff et al., 1999). The precisions for the measurements were 0.1 µM for nitrate and silicate and 0.01 µM for phosphate (Sert et al., 2022). Dissolved organic carbon (DOC) and total dissolved nitrogen (TDN) concentrations were measured by a high-temperature combustion method (MQ Scientific MQ-1001) against in-house calibration standards and reference deep ocean samples (Qian and Mopper, 1996).
All FT-ICR MS measurements were carried out with a 12-T Bruker SolariX FT-ICR mass spectrometer (Bruker Daltonics, Bremen, Germany) equipped with a dynamically harmonised ICR cell (ParaCell) and an Apollo-II electrospray ionisation (ESI) source. DOM samples, diluted 1:10 (v/v) with HPLC-grade methanol, were directly infused into the ion source with a syringe pump, operating at a flow rate of 2 μL min-1. Nitrogen was used as the drying and nebulising gas. The ESI-generated ions were accumulated in the hexapole ion trap and transferred into the ICR cell for trapping, excitation, and detection. For each spectrum, 100 scans were co-added over a mass/charge ratio (m/z) range of 150–2000. Bruker Compass ftmsControl 2.1 software was used for instrument control and data acquisition. The initial spectral post-processing was done with the Bruker DataAnalysis 5.0 SR1 software package, including an internal mass re-calibration with an in-house calibration list for DOM samples. Molecular formula assignments were done with the PetroOrg IS-18.0.3 software (Omics LLC, Tallahassee, FL, United States of America) for the peaks observed at a signal-to-noise ratio (S/N) ≥ 5. Monoisotopic compositions were limited to 12C1–1001H1–20014N0–416O0–3032S0–2, with a double bond equivalent (DBE) of 0–50, homologous series inclusion (minimum of 3) and a mass error of ≤1.0 ppm. However, much lower mass errors (ca <0.2 ppm) have been achieved by visual inspection of the spectra for average mass error and by removing formulas with systematically high errors. Sodium (Na) and chlorine adducts (Cl) were also considered for positive and negative ion modes.
Molecular formulas were assigned for 18 samples (3 replicates of 6 treatments) in negative-ion ESI following the subtraction of formulas compiled from four method blanks. The replicate with the highest ionisation efficiency from each treatment (based on maximum signal intensity and the number of detected peaks) was also analysed with positive-ion ESI. Analysis performance varied considerably between replicates; we, therefore, chose the least conservative approach, and all unique formulas were considered from the replicate samples (see Supplementary Section S1 and Supplementary Table S1 for details). Then, the obtained molecular formula lists from one positive and three negative mode replicates were pooled and merged to obtain a single molecular formula list for each treatment. The intensity of negative ion replicate (with the highest number of formulas) was considered in the case of duplicate formulas from the merging lists.
Chemical characterisation of DOM compositions was conducted to obtain four different heteroatomic classes: CHO, CHON, CHOS and CHONS. Additionally, DOM compositions were classified by H:C and O:C atomic ratios using van Krevelen diagrams (Kim et al., 2003). Considering the H:C and O:C atomic ratios of major biochemical compounds, ranges of H:C and O:C were related to four distinct compound classes: 1) lipid & protein-like (LPD: H:C ≥1.5 & O:C ≤0.7), 2) carbohydrates and amino-sugar-like (CAR: H:C ≥1.5 & O:C >0.7), 3) unsaturated hydrocarbons & condensed aromatics (UHC: H:C ≤0.7 & O:C ≤0.7) and 4) lignin and tannin-like (LGN: 0.7< H:C <1.5 and H:C >0.7 & O:C >0.7). Boundaries for these classes were modified from Hockaday et al. (2009) and Hodgkins et al. (2016), as explained previously (Sert et al., 2020).
Principal coordinate analysis (PCoA) was applied to the combined molecular formula lists to depict compositional variation between incubation samples on an ordination plot in R (R Core Team, 2022). Briefly, a dissimilarity (distance) matrix was constructed based on Bray-Curtis indices (Bray and Curtis, 1957) using the ‘vegdist’ function and sum-normalised relative intensities of pooled DOM data. Then, the PCoA was conducted on the dissimilarity matrix using the ‘cmdscale’ function in Vegan (Oksanen et al., 2020). Ordination plots were constructed based on the first two principal axes, which explain the highest variations between samples. The explained variances for these two main coordination axes were calculated by determining the percentages of the first two eigenvalues relative to the sum of all eigenvalues.
Genomic DNA was extracted from the 0.22 µm filters using the DNeasy PowerWater Kit (Qiagen, Carlsbad, CA). DNA concentration was checked with Qubit 4 Fluorometer dsDNA HS assay (ThermoFisher Scientific), and quality checks were performed using the DNA 12000 assay with the Agilent Bioanalyzer (Agilent Technologies, Germany). PCR amplification and amplicon sequencing was performed at Novogene Company Limited (Cambridge, United Kingdom) using the V4 forward primer (515F) and reverse primer (806R) which targets a hypervariable region that amplifies both bacterial and archaeal 16S rRNA (Caporaso et al., 2010). In order to identify background sequences, PCR template-free negative controls were also amplified and sequenced.
Amplicon sequences were analysed in accordance with the Earth Microbiome Project (EMP) protocols (Gilbert et al., 2010) with minor modifications in quality checks. Briefly, the forward and reverse Illumina reads were joined using QIIME2 paired end flags. The reads were further denoised using DADA2 v2021.2.0 package, which pooled, filtered, de-replicated, and chimera-checked sequences (Callahan et al., 2016). After denoising, DADA2 further processes data by determining the amplicon sequence variants (ASVs). The ASVs were classified using the SILVA database v138.1 (Quast et al., 2013; Yilmaz et al., 2014).
Downstream analysis was completed in R (R Core Team, 2022), using primarily the ‘microeco’ (Liu et al., 2021) and ‘vegan’ packages (Oksanen et al., 2020). The 16S data reads assigned Mitochondria and Chloroplast (at any taxonomic level) were removed. Alpha diversity was quantified using counts of observed unique ASVs (species richness). The target taxa for methane-associated bacteria were selected from Knief (2015), and relative abundances were averaged from four replicates for incubation conditions.
The primary current system of the study site is the Svalbard branch of the West Spitsbergen current, which carries warmer Atlantic waters to the Arctic Ocean (Menze et al., 2020). Incoming Atlantic waters mix with the local surface water, forming Polar surface waters down to ∼100 m depth. CTD profiles at both stations revealed these two water masses as indicated by a temperature increase from ∼3.5°C at the surface to 5°C at ∼100 m water depth, followed by a relatively uniform temperature of ∼4.7°C down below (Figure 3A). Similarly, salinity was low at the surface (34.5 psu at seep and 34.7 psu at non-seep) and reached 35 psu at ∼100 m from whereon it remained constant until the bottom (Figure 3B). Compatible with the temperature and salinity, the vertical density profile of the stations implies several stratification layers separated by isoclines at 25 and 50 m in seep station and 50 and 125 m in the non-seep station (Figure 3C). Below 125 m, both stations indicate a uniform temperature, salinity, and density until the bottom including the layers that the incubation waters were taken.
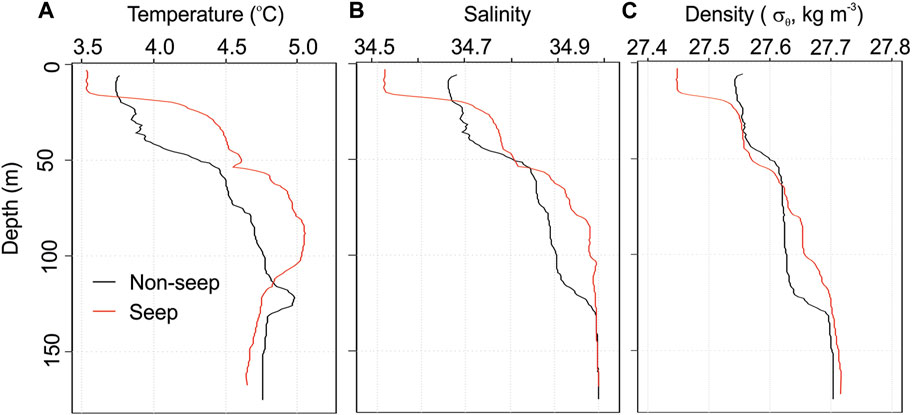
FIGURE 3. Depth profiles of (A) temperature, (B) salinity, and (C) density at both stations.
The dissolved methane concentrations were 5.8 nM for NSi and 83.1 nM for SEi, decreasing to final concentrations of 4.5 nM in NSf and 35.0 nM in SEf (Table 1). The amount of added methane corresponded to 1,026 nM in the water phase in methane-amended incubations with 1,000 mL of water and 135 mL of headspace. Therefore, the initial methane concentrations in NSa and SEa were calculated as 1032.5 and 1109.9 nM, respectively. After the incubation, the final methane concentrations were measured as 737.9 nM in NSa and 846.2 nM in SEa.
The reaction rate constants for MOx (kMOx) varied in a narrow range from 0.019 to 0.027 days-1 in all incubation setups without showing a clear pattern (Figure 4A). With respect to the higher methane concentrations in the seep stations and the amended incubations, MOx activities were markedly higher in these incubations, too (Figure 4B). Overall, MOx was low in NSi and NSf samples (0.09–0.16 nM day-1), slightly elevated by ∼20% in SEi (0.97 nM day-1) versus SEf (1.15 nM day-1) samples. MOx activities were high (up to 12 nm day-1) in methane-amended samples, irrespective of whether the sample originated from a seep or non-seep station.
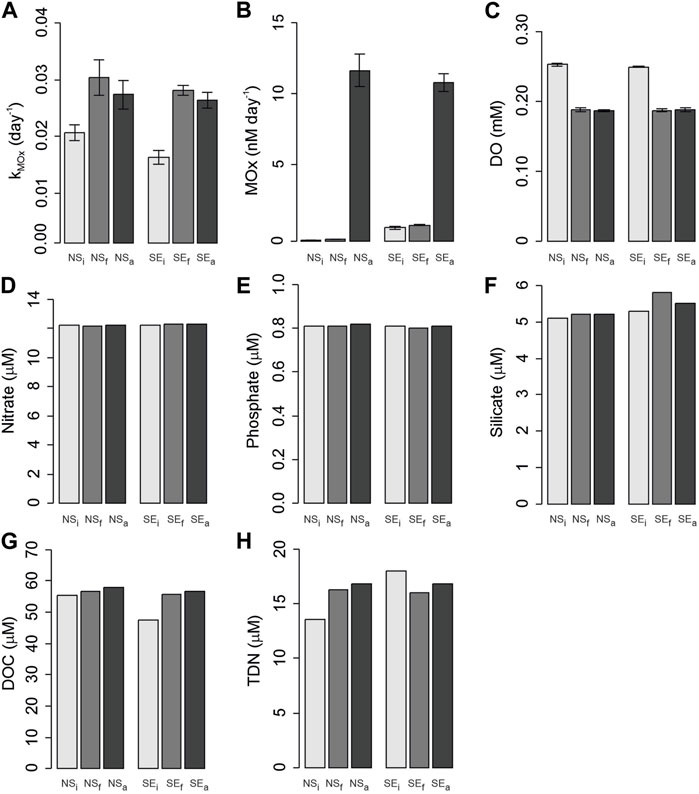
FIGURE 4. Changes in biochemical parameters before and after incubations from non-seep (NS) and seep stations (SE) for initial (i), final (f), and methane-amended final (a) conditions. (A) kMox, first order rate constant; (B) MOx, methane oxidation rate; (C) DO, dissolved oxygen; (D) Nitrate; (E) Phosphate; (F) Silicate; (G) DOC, dissolved organic carbon; (H) TDN, total dissolved nitrogen.
Dissolved oxygen concentrations decreased in all incubation bottles from 0.25 mM initial concentration to 0.19 mM final concentration (Figure 4C). Concentrations of nitrate and phosphate remained nearly constant during the incubations with average concentrations of 12.2 and 0.8 µM, respectively (Figure 4D,E). Despite a slight increase in seep incubation, silicate concentrations only varied from 5.1 to 5.8 µM in all incubation bottles (Figure 4F). DOC concentrations increased in all incubations from 55.3 µM to 56.8 and 57.9 µM in non-seep and from 47.5 µM to 55.6, and 56.8 µM seep conditions (Figure 4G). TDN concentrations were 13.6 µM in NSi and increased to 16.3 and 16.8 µM in NSf and NSa, respectively. On the contrary, TDN decreased from a maximum concentration in SEi with 18.0 µM to 16.0 and 16.8 µM in SEf and SEa, respectively (Figure 4H).
DOM comprised 3,671 and 5,137 unique molecular formulas in NSi and SEi, respectively (Figure 5A). The numbers of formulas were lower in both unamended final conditions compared to the initial values (2,837 in NSf and 4,014 in SEf). In methane-amended incubations, in stark contrast, the number of formulas increased to 5,105 and 5,551 for NSa and SEa (Figure 5A). Similar trends were observed in the numbers of formulas in biochemical class categories (CAR, LGN, LPD, see Section 2.5 for acronym description) and atomic content categories (CHO, CHON, CHOS), except for UHC and CHONS. For UHC, the number of formulas was higher in NSf compared to NSi and NSa and in SEi compared to SEa. CHONS formulas were only detected in NSa with 37 assigned peaks. Percentages of subcategories differed slightly without any particular trend between treatments (Figure 5B).
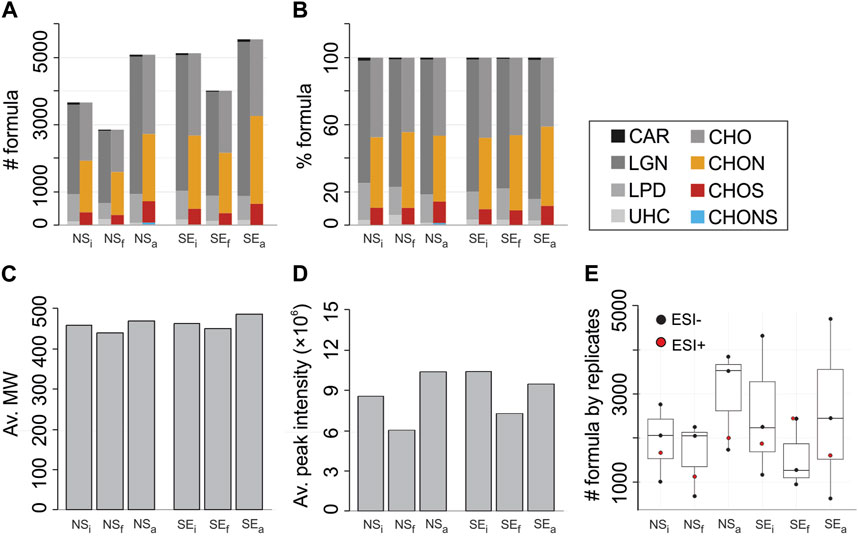
FIGURE 5. (A) Number of molecular formulas, (B) percentages of formulas, (C) average molecular weights, (D) average peak intensities and (E) number of molecular formulas by replicates obtained from non-seep (NS) and seep stations (SE) for either initial (i), final (f) or methane-amended final (a) conditions. Number of formulas in biochemical compound groups defined by H:C and O:C ratios and heteroatomic contents are given in colors. Abbreviations are LPD, lipid- and protein-like; CAR, carbohydrate-like; LGN, lignin- andtannin-like; UHC, unsaturated hydrocarbon- & condensed aromatic-like; Av., average.
The average molecular weights (m/z) and average peak intensities displayed a similar trend with the number of molecular formulas (Figure 5C,D). The average MW decreased from 458 in NSi and 464 in SEi to 439 in NSf and 451 in SEf. In NSa and SEa, the average MW were 486 and 470, respectively (Figure 5C). Similarly, average intensities in NSi and SEi were higher compared to NSf and SEf. However, it decreased slightly at SEa compared to SEi as opposed to NSi versus NSa (Figure 5D). Numbers of formulas obtained from the three ESI- and one ESI+ replicates varied noticeably (Figure 5E, Supplementary Table S1) yet without a significant statistical difference in the mean number of formulas between the incubation conditions (ANOVA, p=0.7).
The molecular compositions of SPE-DOM were similarly distributed on van Krevelen diagrams in all incubation conditions (Figure 6). The majority of mass peaks were identified in the central region of the van Krevelen diagrams from H:C atomic ratios of 1–2 and O:C atomic ratios of 0.25–0.50. Relative abundances (sum-normalised) were larger in the LPD region, with mainly CHO molecular series in NSi, NSf, NSa and SEi. However, the highest relative abundances were obtained in NSi with N-containing formulas in the LPD region (Figure 6A). With increasing molecular diversity (i.e., number of formulas), relative abundances were lower for NSa and SEa in the LPD region compared to the initial conditions. Relative abundances of CHON and CHOS formulas were higher in SEa compared to SEi in the lower half of the van Krevelen diagram.
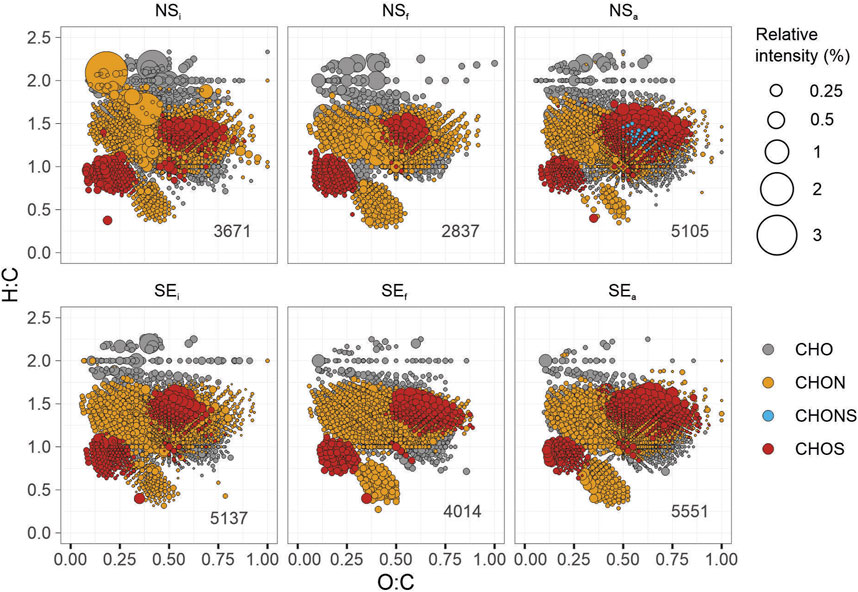
FIGURE 6. Molecular compositions of pooled DOM formulas on the van Krevelen diagrams for non-seep (NS) and seep (SE) incubations representing initial (i), final (f), or methane-amended final (a) conditions. Each symbol represents a molecular formula colored according to the heteroatomic composition: CHO (grey), CHON (yellow), CHONS (blue), and CHOS (red). Symbol sizes represent the sum-normalised relative intensity of the formulas from pooled DOM molecular lists (e.g., the sum of all relative intensities corresponds to 100% for each treatment). The total number of formulas is given on the lower right for each plot.
Compositional changes in DOM were evident in both non-seep and seep incubations, as depicted in PCoA (Figure 7). The composition shifts from NSi to NSa were evident in the first principal coordination axis (35.3% of the variation). On the other hand, compositional changes from NSi to NSf and SEi to SEf or SEa were more pronounced on the second (vertical) coordination axis, explaining 22.1% of the variation. Overall, the compositional change from NSi to NSa was the strongest, with NSa becoming more similar to the SEi and SEa composition (Figure 7).
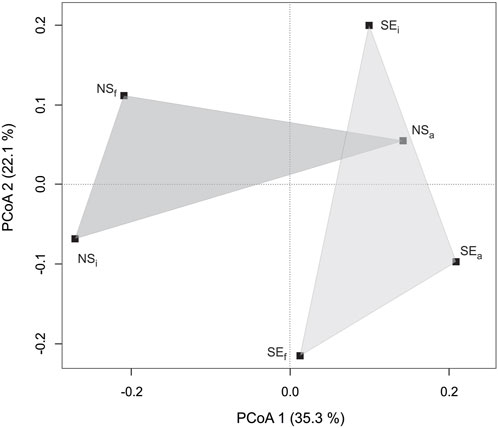
FIGURE 7. Graphical representation of principal coordinate analysis based on Bray-Curtis indices of DOM molecular compositions from non-seep (NS) and seep stations (SE) for either initial (i), final (f), or methane-amended final (a) conditions. Shaded triangles are used to illustrate non-seep and seep incubations.
The 2055 formulas were common in all incubation conditions. In order to determine molecular trends between these common formulas, changes in the intensities were calculated and interpreted as presumably decreasing or increasing during the incubation, or initial seep and non-seep conditions (Figure 8). Accordingly, the number of compounds with increasing intensity were distinctly high in NSi - SEi (1,652) and NSa -NSi (1,576). Proportionally, compounds with decreasing intensities were notably lower NSi -SEi (403) and NSa – NSi (639) compared to NSi - NSf (1,416), SEi - SEf (1,383) and SEi - SEa (1,358).
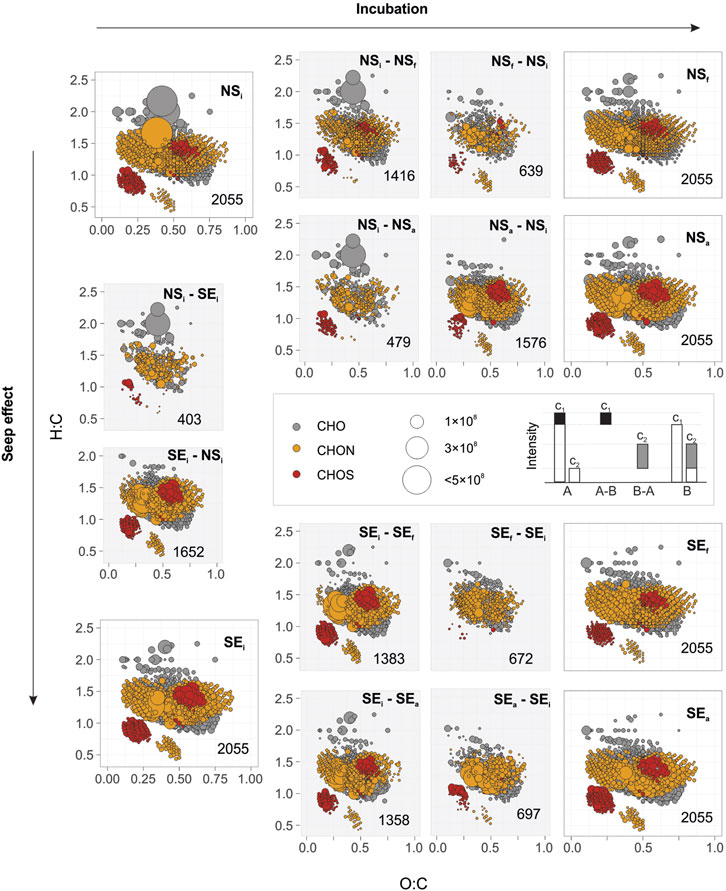
FIGURE 8. Molecular compositions of common DOM formulas on the van Krevelen diagrams for non-seep (NS) and seep (SE) incubations representing initial (i), final (f), or methane-amended final (a) conditions. Each symbol represents a molecular formula coloured according to heteroatomic composition: CHO (grey), CHON (yellow), and CHOS (red). Plots on the corners indicate 2055 DOM formulas commonly found in all six conditions whose intensities are denoted by the size of the symbols. Pale grey background plots indicate compounds with changing intensities towards the direction of the arrows so that their intensities either decreased or increased during the incubation E.g., NSi - NSf indicates compounds that declined during non-seep unamended incubation, whereas NSf- NSi shows compounds with elevated intensities (see figure caption). Differences in molecular compositions between NSi and SEi are also plotted over the vertical axis on the left (seep effect). The numbers of formulas in each plot are given in the lower right.
Sequences classified within the Bacterial kingdom were more abundant than Archaeal sequences across all samples regardless of location or incubation conditions (Figure 9A). As the most abundant Phylum, Proteobacteria accounted for 34.2%–82.0% of the total community in each sample, with NSa featuring the lowest relative abundance and NSi the highest one.
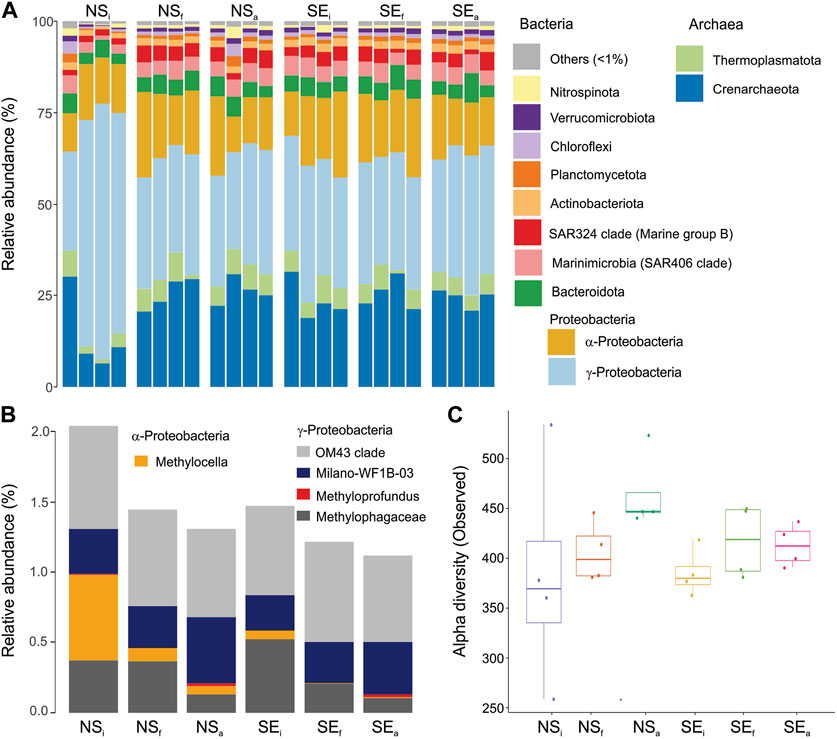
FIGURE 9. Prokaryotic community composition based on 16S rRNA gene sequences. (A) Relative abundance at Phylum level for six conditions with four replicates. All taxa that were below 1% relative abundance were grouped as Other. (B) Relative abundances of 16S rRNA sequences grouped in genus level from six conditions associated with methane oxidation. (C) Boxplots of alpha diversity based on the number of ASVs observed in each treatment that are grouped for 6 conditions.
The sequences were further classified and filtered to reveal five different genus-level organisms: Methylocella (1 ASV), OM43 clade (10 ASVs), Methyloprofundus (1 ASV), Milano WF1B-03 (1 ASV) and Methylophagaceae (2 ASVs), i.e., methanotrophic bacteria that were previously found in Arctic cold seeps (Gründger et al., 2021). Total relative abundances of these sequences accounted for 2.0% and 1.5% in NSi and SEi and decreased slightly in all four cases up to 1.1% in SEa (Figure 9B). The most apparent decreases in relative abundance were found in clades Methylocella and Methylophagaceae. However, in all methane-replate conditions (NSa, SEf and SEa), two MOB clades, Milano-WF 1B-03 and Methyloprofundus, increased relative abundance compared to NSi and SEi, respectively.
The alpha diversity (Figure 9C) increased in both methane-amended and unamended samples compared to the initial samples from both locations (seep and non-seep). The highest difference in alpha diversity was between non-seep amended (NSa) conditions compared to the initial one (NSi).
All incubations were performed under dark and oxic conditions (Figure 4C). Decreasing oxygen and elevated MOx rates indicate microbial respiration, and MOx would be the dominant process during incubations. MOx of a few nM d-1 (Figure 4B) can only explain <0.1% of the total oxygen decrease (∼0.06 mM), considering the 1:1 stoichiometry of CH4 to O2. Accordingly, 16S rRNA gene analyses indicated that non-methanotrophic, bacteria were very abundant (<98%) and the heterotrophs amongst them were the primary consumer of dissolved oxygen during the incubation. This was in line with previous observations at Arctic cold seeps, where the abundance of MOB accounts for only a small portion of the microbial community, even with high MOx and methane concentrations (Steinle et al., 2015; Gründger et al., 2021).
MOx was low at the non-seep station and in incubations without methane amendment, as expected. However, a similar range of kMOx implies the existence of an active MOB community in all samples. Based on 16S data, the most dominant member of the methane-associated bacterial community was the OM43 clade of the family Methylophilaceae, irrespective of sample and with low variation in abundance. These organisms are affiliated to Type I methylotrophs, which do not oxidise methane directly but use C1 compounds (Chistoserdova et al., 2009) and are commonly associated with coastal diatom bloom (Morris et al., 2006). Therefore, its constant abundance in all samples may be associated with typical spring-to-summer Arctic diatom successions (Tremblay et al., 2006; Croteau et al., 2022). Milano-WF1B-03 and Methyloprofundus are two known MOB species that increased in abundance in methane-replete conditions, and Methylocella and Methylophagacea decreased in all conditions (Figure 9B). However, the overall change of MOB species was considerably low, and they occurred at abundances in sub-percent range. Taken together with microbial data, we observed that a small but active MOB community was present in all samples, irrespective of the origin of the source water masses. Due to low variance in abundances, however, we suggest that MOx was not a dominant microbial process, yet it might have initiated a microbial growth.
Our measurements are the first MOx data available from the Norskebanken seep site and were in the same order of magnitude as those reported from the western and southern sections of the Svalbard continental shelve (Steinle et al., 2015; Mau et al., 2017; Gründger et al., 2021) and in other coastal margins with seep activity (Mau et al., 2012; Steinle et al., 2017) (see Supplementary Table S2). Since the variations in kMOx were relatively small compared to methane concentrations, MOx rates were higher in samples containing high amounts of methane, either naturally (SEi and SEf) or amended (NSa and SEa). The efficiency of MOx and turnover of methane increase with increasing methane concentration in various marine settings (James et al., 2016). In nature, this relationship is strongly influenced by hydrography and MOB community size, as previously observed at the southern and western shelves off the Svalbard archipelago (Mau et al., 2012; Steinle et al., 2015; Gründger et al., 2021). There, the prevalent current systems were found to transport open ocean waters with a low-standing stock of MOBs to the seep systems at times when the water column MOx was low (Steinle et al., 2015). Elevated MOx, in contrast, was found when shelf waters with a methane history and higher standing stock of MOBs were present at the seep location (Mau et al., 2012; Steinle et al., 2015; Gründger et al., 2021). The origin of potential MOBs at Norskebanken needs to be tested in future studies; it seems nevertheless possible that MOBs were transported from the western shelf towards the reference and then Norskebanken station along with a branch of the West Spitsbergen current that flows North of Svalbard eastwards.
DOC and nutrients concentrations were in line with the previous observations in the study area (e.g., Owrid et al., 2000; Renner et al., 2020; Zabłocka et al., 2020). Dissolved inorganic nutrients (phosphate, nitrate, and silicate) concentrations did not change considerably during incubations. On the other hand, there was a marked increase in DOC concentrations in all incubations and TDN concentration in non-seep incubations. Taking these together with the absence of phototrophic primary production due to dark conditions and declining dissolved oxygen concentration, we conclude that respiration was the dominant microbial process during the incubation. We suggest that DOC concentrations increased by recycling planktonic biomass via respiration. Cell deaths, viral lysis, bacterial exudates, or sloppy feeding of zooplankton and protists can all contribute to the DOC budget (Van den Meersche et al., 2011; Fouilland et al., 2014). DOC released by the cell lysis differ in biolability and include intact cellular components, metabolic products and viruses (Wilhelm and Suttle, 1999) that do not retain on the filter. DOC components stoichiometrically include organic nitrogen and phosphorus atoms that are also being part of the organic nitrogen (DON) and phosphorus (DOP) pools. Although some of the organic matter would have been rapidly incorporated by heterotrophic bacteria based on their cellular needs, the rest elevate the DOC, DON, DOP concentrations without contributing to the inorganic nutrient concentrations in the short term. Therefore, while the concentrations of DOC and TDN increased, inorganic nutrient concentrations did not change during our incubations.
Apparent modifications in DOM compositions occurred in all incubations. DOM molecular diversity and atomic heterogeneity (N and S content) increased in methane-amended incubations in both seep and non-seep treatments (Figures 5, 6). Yet, these values decreased in unamended incubations (greater extent in non-seep treatment), revealing that the availability of methane and the related activity of MOB would be the main factor for the changes in DOM molecular compositions. While the microbial role in DOM modifications was consistent with increased microbial diversity, the total relative abundance of MOB decreased in all treatments. Nevertheless, it has to be noted that we did not determine absolute cell numbers of MOBs. We can thus not fully determine if the other microbial clades became more abundant, which might have led to a decrease in the relative abundance of MOBs even if MOB biomass was constant (or even increased). Furthermore, the abundance of two MOB clades (Milano-WF 1B03 and Methyloprofundus; (Knief, 2015); increased in methane-replete incubations (NSa, SEf and SEa), indicating a positive association with elevated methane levels. Besides, our PCoA analysis indicated that DOM converges towards similar compositions in methane-rich samples (Figure 7). These observations imply an interaction between microbial composition and molecular DOM turnover. Modifications on DOM compositions were likely accomplished by microbes that were initially fuelled by methane, and their exudates and necromass were then reworked by other microbial consortia that are in competition or syntropy with MOBs (e.g., Vekeman et al., 2016).
Similar opposite trends were observed in the average molecular weights (Figure 5C) for amended and unamended incubations. Decreasing molecular weights (unamended incubations) were consistent with the bacterial reworking on DOM based on the size-reactivity continuum model stating that the degradation of DOM occurs from larger reactive molecules to smaller unreactive moieties (Benner and Amon, 2015). Based on molecular lability on the other hand, it is likely that low molecular weight DOM compounds (e.g., glucose and amino acids) are quickly assimilated by many groups of bacteria, as opposed to high molecular weight DOM (Elifantz et al., 2005; Alonso-Sáez et al., 2009). In our data, the number of compounds associated with LPD and CAR classes and corresponding percentages decreased in NSf and yet increased in NSa. Compounds in LPD and CAR molecular classes are usually interpreted as labile DOM having atomic H:C ratios larger than 1.5 (D’Andrilli et al., 2015) and are likely to indicate more recent production with lower molecular masses (Flerus et al., 2012). Therefore, we suggest that changes in molecular DOM compositions occur in connection with a higher degree of DOM production in methane-amended incubations, whereas microbial DOM assimilation was favoured in unamended incubations.
In addition to active molecular synthesis and extracellular release, cell lysis, viral infections, and sloppy feeding are also the main production routes of DOM. Therefore, if microbial network favour DOM production, this may also in connection with the pressure from upper trophic organisms or viral lysis. When methane is available, MOBs have an advantage (energy metabolism and growth) over other organisms with a limited substrate supply. MOB growth initiates microbial competition, possibly because MOBs consume micronutrients (e.g., Fe, Cu) so that other organisms are impaired or starve and die. Dead cells may then get lysed and contribute to DOM production. Alternatively, methane intrusion may cause stress in the initial microbial system altogether and elevate viral density and DOM production through viral shunt (Wilhelm and Suttle, 1999; Middelboe and Lyck, 2002; Vincent and Vardi, 2023). As opposed to an increase in microbial diversity, quantitative PCR data indicated a marked decrease in the 16S copy gene numbers in all incubation conditions compared to initial values (Supplementary Figure S1). This indicates that some portions of the DOM modifications are closely related to declining microbial activity rather than active microbial production, and the versatility of the DOM constituents increased with the variety of bacteria that have a role in DOM production.
The composition of bacteria-derived DOM is relatively unknown since they are considered to be a consumer rather than a producer of DOM (Kujawinski, 2011). Also, their ecological role in the microbial loop is defined as a facilitator for transforming DOM to particulate organic matter or from DOM to inorganic constituents (Carlson and Hansell, 2015). However, investigations on bacteria-derived DOM across various monoculture, multiculture and environmental consortia imply that bacteria may release unique characteristics of metabolites in relation to the location of isolation and grazing factors (Kujawinski et al., 2004; Rosselló-Mora et al., 2008; Kujawinski et al., 2016). For instance, recent studies showed that virus-induced DOM release is complex but features a unique metabolic footprint representative of viral infection (Zhao et al., 2019; Kuhlisch et al., 2021). Halogenation with chlorine and iodine was found to be a hallmark of virus-induced DOM of a very common coccolithophore Emiliana huxleyi (Kuhlisch et al., 2021). Our method was not optimised for detecting halogenated exometabolites, yet we confirmed that the percentage of the chlorine adducts was more than 10% in all samples. Therefore, if the abundance of chlorine adducts is a proxy for these metabolites, viral lysis could have contributed to DOM production during our incubations. Consequently, we suggest that similar DOM compositions in methane-replete samples are likely to indicate a similar microbial progression.
Another indication of microbial modification of DOM was observed in compositional characteristics. Such as the majority of DOM formulas, both in pooled and common DOM data (73%–83%), had a range of H:C ratio from 1.0 to 1.5 and O:C ratio from 0.10 to 0.75 and corresponded to the central region of van Krevelen diagram. Compounds in this range are rather unsaturated, with high abundances of oxygen atoms attached to the carbon backbone and associated with several molecular classes like lignins, tannins, (Kim et al., 2003; Rivas-Ubach et al., 2018; D’Andrilli et al., 2019), carboxylic-rich alicyclic molecules (Hertkorn et al., 2006) and to a lesser degree proteins and carbohydrates (Hockaday et al., 2009). These compounds are usually associated to a terrestrial origin (Bianchi, 2011). The ones that are stable enough to escape complete mineralisation are modified through time by diagenetic processes (Valle et al., 2018), photochemical reactions (Gonsior et al., 2009) and microbial modifications (Jiao et al., 2010). Therefore, changing compositions in these ranges are more likely linked to old DOM rather than recent production and more likely commenced by microbial mechanisms as by-products rather than fresh input of algal synthesis.
We hypothesise that the varying methane concentrations in our incubation media represent a typical cold seep environment and its surroundings in the Arctic Ocean’s continental shelf. Our seep incubations (unamended/amended) simulated the water column above typical hydrate-controlled arctic seeps at the Svalbard shelf (Berndt et al., 2014; Ferré et al., 2020a). Non-seep amended incubation, on the other hand, was designed to mimic the water column further away from cold seeps but which receive sporadic methane intrusions due to geospatial variation and dynamic hydrography (Steinle et al., 2015; Dølven et al., 2022). The observed molecular and microbial trends in these treatments suggest that methane intrusion from cold seeps may affect microbial communities and consequently alter DOM towards chemically more diverse compositions (also see Sert et al., 2020). This effect was also unambiguous in common DOM formulas (Figure 8). Analysis of these formulas on the van Krevelen diagrams showed that spectral features of changing intensities of non-seep amended incubation (NSi - NSa and NSa - NSi) were more similar to the initial composition at both sites (NSi - SEi and SEi - NSi) than to non-seep unamended incubation (NSi - NSa and NSa - NSi). Likewise, compounds with changing intensities in non-seep unamended incubation (NSi - NSf and NSf - NSi) were compositionally more similar to amended non-seep incubation (NSi - NSa and NSa - NSi) than to seep amended and unamended incubations. The number of compounds within these categories also points towards a similar trend. For instance, the number of compounds with decreasing intensity during non-seep amended incubation (NSi - NSa; n = 479) was almost equal to the number of compounds that have higher intensity in NSi compared to SEi (NSi - SEi; n=403).
Such trends in shared formulas match with the trends obtained in pooled-DOM data in terms of seep versus non-seep comparisons. First, the numbers of formulas in subcategories agree with the idea of methane limitation. Such as, the number of formulas with increasing intensity was markedly higher from methane-poor initials to methane-replete endpoints. In contrast, other treatments had higher numbers of formulas with decreasing intensities and were likely to favour DOM consumption. This indicates that DOM production was elevated when excess methane was introduced in a methane-limited environment, and in contrast, DOM was not similarly affected by new methane inclusion in already methane-replete conditions. Secondly, the compounds with increasing intensity from non-seep unamended incubation (NSa – NSi) were already high in seep samples (SEi) compared to non-seep samples (NSi). In other words, compounds with increasing intensities in NSi escalated considerably up to the level of SEi when methane was excessively available, as is the case in NSa (seep effect). This indicates that a greater extent of DOM production occurs in the seep areas compared to non-seep conditions (e.g., Sert et al., 2020).
Our main conclusion is that the changing microbial composition, activity, and grazing pressure modify DOM molecular formula compositions in seep environments. While observed trends did not entirely warrant whether active MOB cause a shift in the DOM features and/or produce specific compounds, it seems very likely that the DOM features detected in methane-replate incubations are associated with MOBs and other microbes affected by the activity of MOBs. That includes potential scavengers feeding on exudates/(necro)mass of MOB, microbes that are in competition or syntropy with MOBs and viruses that induce various biomass into DOM through viral shunt. We showed that elevated methane concentrations and methanotrophy influence both the production and consumption of DOM, converging to similar compositions despite different initial conditions (i.e., non-seep vs. seep). In addition, heterotrophic bacteria other than MOB contribute to the DOM modification in the incubation media, conceding with the production of DOM rather than the consumption, as indicated by the increasing number of molecular formulas in methane-amended incubations.
To our knowledge, this is the first incubation experiment investigating changes in DOM composition as a function of methanotrophy in microcosms with seep and non-seep waters. Our results also imply that the DOM composition in waters from non-seep locations converges to a DOM signature from seep location upon methane admixture to these waters. How far the change of DOM is directly determined by methanotrophs or indirectly by other microbes that profit from methanotrophy needs to be investigated in future studies. Ecological links (e.g., microbial community structure and activity vs. metabolic DOM profiles) consequently need to be better constrained in future studies, for example, by investigating MOB-DOM interactions with environmental stressors such as grazing pressure, community competition or hydrographic conditions.
Biochemical data and R code for statistical analyses are stored in the UiT Open Research Data Repository (https://doi.org/10.18710/U3YMFQ). Sequencing data, along with R scripts used for analysis and graphing of microbial compositions are stored in the Open Science Framework (https://doi.org/10.17605/OSF.IO/5E36J).
MS: Conceptualization, Data curation, Methodology, Project administration, Visualization, Writing–original draft, Writing–review and editing. HS: Methodology, Writing–original draft, Writing–review and editing. TG: Methodology, Writing–original draft, Writing–review and editing. TK: Methodology, Writing–original draft, Writing–review and editing. JJ: Methodology, Supervision, Writing–review and editing. HB: Methodology, Supervision, Writing–review and editing. BF: Funding acquisition, Project administration, Resources, Writing–review and editing. FG: Supervision, Writing–review and editing. DK: Methodology, Supervision, Writing–review and editing. HN: Conceptualization, Methodology, Supervision, Writing–review and editing.
The author(s) declare financial support was received for the research, authorship, and/or publication of this article. This study is funded by the Research Council of Norway through CAGE (Centre for Gas Hydrate, Environment and Climate) project number 223259 and EMAN7 (Environmental impact of Methane seepage and sub-seabed characterisation at LoVe-Node 7) project number 320100. This project was supported by the European Union’s Horizon 2020 Research and Innovation Programme (EU FT-ICR MS project; grant agreement 731077). The FT-ICR MS facility is also supported by Biocenter Finland, Biocenter Kuopio and the European Regional Development Fund (grant A70135). Authors HS and HB are grateful for funding from ABSORB–Arctic Carbon Storage from Biomes (https://site.uit.no/absorb/), a strategic funding initiative from UiT–The Arctic University of Norway.
We would like to acknowledge the crew of R/V Kronprins Haakon and the shipboard scientific party during cruise CAGE 20-7. We would like to thank Colin A. Stedmon for DOC and TDN measurements, Linda Fondes Lunde for nutrient analyses, Matteus Lindgren for methane measurements. We would like to acknowledge Anna Silyakova for discussions on the project design and earlier drafts of the manuscript.
The authors declare that the research was conducted in the absence of any commercial or financial relationships that could be construed as a potential conflict of interest.
All claims expressed in this article are solely those of the authors and do not necessarily represent those of their affiliated organizations, or those of the publisher, the editors and the reviewers. Any product that may be evaluated in this article, or claim that may be made by its manufacturer, is not guaranteed or endorsed by the publisher.
The Supplementary Material for this article can be found online at: https://www.frontiersin.org/articles/10.3389/feart.2023.1290882/full#supplementary-material
Alonso-Sáez, L., Unanue, M., Latatu, A., Azua, I., Ayo, B., Artolozaga, I., et al. (2009). Changes in marine prokaryotic community induced by varying types of dissolved organic matter and subsequent grazing pressure. J. Plankton Res. 31, 1373–1383. doi:10.1093/plankt/fbp081
Amon, R. M. W., and Benner, R. (1996). Bacterial utilization of different size classes of dissolved organic matter. Limnol. Oceanogr. 41, 41–51. doi:10.4319/lo.1996.41.1.0041
Andreassen, K., Hubbard, A., Winsborrow, M., Patton, H., Vadakkepuliyambatta, S., Plaza-Faverola, A., et al. (2017). Massive blow-out craters formed by hydrate-controlled methane expulsion from the Arctic seafloor. Science 356, 948–953. doi:10.1126/science.aal4500
Becker, J., Berube, P., Follett, C., Waterbury, J., Chisholm, S., DeLong, E., et al. (2014). Closely related phytoplankton species produce similar suites of dissolved organic matter. Front. Microbiol. 5, 111. doi:10.3389/fmicb.2014.00111
Benner, R., and Amon, R. M. W. (2015). The size-reactivity continuum of major bioelements in the ocean. Annu. Rev. Mar. Sci. 7, 185–205. doi:10.1146/annurev-marine-010213-135126
Berndt, C., Feseker, T., Treude, T., Krastel, S., Liebetrau, V., Niemann, H., et al. (2014). Temporal constraints on hydrate-controlled methane seepage off Svalbard. Science 343, 284–287. doi:10.1126/science.1246298
Bianchi, T. S. (2011). The role of terrestrially derived organic carbon in the coastal ocean: a changing paradigm and the priming effect. Proc. Natl. Acad. Sci. 108, 19473–19481. doi:10.1073/pnas.1017982108
Boetius, A., and Wenzhöfer, F. (2013). Seafloor oxygen consumption fuelled by methane from cold seeps. Nat. Geosci. 6, 725–734. doi:10.1038/ngeo1926
Bray, J. R., and Curtis, J. T. (1957). An ordination of the upland forest communities of southern Wisconsin. Ecol. Monogr. 27, 325–349. doi:10.2307/1942268
Bünz, S., Polyanov, S., Vadakkepuliyambatta, S., Consolaro, C., and Mienert, J. (2012). Active gas venting through hydrate-bearing sediments on the Vestnesa Ridge, offshore W-Svalbard. offshore w-svalbard. Mar. Geol. 334, 189–197. doi:10.1016/j.margeo.2012.09.012
Callahan, B. J., McMurdie, P. J., Rosen, M. J., Han, A. W., Johnson, A. J. A., and Holmes, S. P. (2016). DADA2: high-resolution sample inference from Illumina amplicon data. Nat. Methods 13, 581–583. doi:10.1038/nmeth.3869
Caporaso, J. G., Kuczynski, J., Stombaugh, J., Bittinger, K., Bushman, F. D., Costello, E. K., et al. (2010). QIIME allows analysis of high-throughput community sequencing data. Nat. Methods 7, 335–336. doi:10.1038/nmeth.f.303
Carlson, C. A., and Hansell, D. A. (2015). “Chapter 3 - DOM sources, sinks, reactivity, and budgets,” in Biogeochemistry of marine dissolved organic matter. Second Edition (Boston: Academic Press), 65–126. doi:10.1016/B978-0-12-405940-5.00003-0
Chistoserdova, L., Kalyuzhnaya, M. G., and Lidstrom, M. E. (2009). The expanding world of methylotrophic metabolism. Annu. Rev. Microbiol. 63, 477–499. doi:10.1146/annurev.micro.091208.073600
Croteau, D., Lacour, T., Schiffrine, N., Morin, P.-I., Forget, M.-H., Bruyant, F., et al. (2022). Shifts in growth light optima among diatom species support their succession during the spring bloom in the Arctic. J. Ecol. 110, 1356–1375. doi:10.1111/1365-2745.13874
D’Andrilli, J., Cooper, W. T., Foreman, C. M., and Marshall, A. G. (2015). An ultrahigh-resolution mass spectrometry index to estimate natural organic matter lability: FTICRMS organic matter molecular lability index. Rapid Commun. Mass Spectrom. 29, 2385–2401. doi:10.1002/rcm.7400
D’Andrilli, J., Junker, J. R., Smith, H. J., Scholl, E. A., and Foreman, C. M. (2019). DOM composition alters ecosystem function during microbial processing of isolated sources. Biogeochemistry 142, 281–298. doi:10.1007/s10533-018-00534-5
Dedysh, S. N., Knief, C., and Dunfield, P. F. (2005). Methylocella species are facultatively methanotrophic. J. Bacteriol. 187, 4665–4670. doi:10.1128/JB.187.13.4665-4670.2005
Dittmar, T., Koch, B., Hertkorn, N., and Kattner, G. (2008). A simple and efficient method for the solid-phase extraction of dissolved organic matter (SPE-DOM) from seawater. Limnol. Oceanogr. Methods 6, 230–235. doi:10.4319/lom.2008.6.230
Dølven, K. O., Ferré, B., Silyakova, A., Jansson, P., Linke, P., and Moser, M. (2022). Autonomous methane seep site monitoring offshore western Svalbard: hourly to seasonal variability and associated oceanographic parameters. Ocean. Sci. 18, 233–254. doi:10.5194/os-18-233-2022
Elifantz, H., Malmstrom, R. R., Cottrell, M. T., and Kirchman, D. L. (2005). Assimilation of polysaccharides and glucose by major bacterial groups in the Delaware Estuary. Appl. Environ. Microbiol. 71, 7799–7805. doi:10.1128/AEM.71.12.7799-7805.2005
Elvert, M., and Niemann, H. (2008). Occurrence of unusual steroids and hopanoids derived from aerobic methanotrophs at an active marine mud volcano. Org. Geochem. 39, 167–177. doi:10.1016/j.orggeochem.2007.11.006
Ferré, B., Jansson, P. G., Moser, M., Serov, P., Portnov, A., Graves, C. A., et al. (2020a). Reduced methane seepage from Arctic sediments during cold bottom-water conditions. Nat. Geosci. 13, 144–148. doi:10.1038/s41561-019-0515-3
Ferré, B., Moser, M., Dølven, K. O., Sert, F., Stetzler, M., Savini, A., et al. (2020b). CAGE 20-7 Cruise report: sediment and water column analyses around flares at Norskebanken, Hinlopen and offshore Prins Karls Forland.
Flerus, R., Lechtenfeld, O. J., Koch, B. P., McCallister, S. L., Schmitt-Kopplin, P., Benner, R., et al. (2012). A molecular perspective on the ageing of marine dissolved organic matter. Biogeosciences 9, 1935–1955. doi:10.5194/bg-9-1935-2012
Fouilland, E., Tolosa, I., Bonnet, D., Bouvier, C., Bouvier, T., Bouvy, M., et al. (2014). Bacterial carbon dependence on freshly produced phytoplankton exudates under different nutrient availability and grazing pressure conditions in coastal marine waters. FEMS Microbiol. Ecol. 87, 757–769. doi:10.1111/1574-6941.12262
Geissler, W. H., Gebhardt, A. C., Gross, F., Wollenburg, J., Jensen, L., Schmidt-Aursch, M. C., et al. (2016). Arctic megaslide at presumed rest. Sci. Rep. 6, 38529. doi:10.1038/srep38529
Gilbert, J. A., Meyer, F., Jansson, J., Gordon, J., Pace, N., Tiedje, J., et al. (2010). The Earth Microbiome project: meeting report of the “1st EMP meeting on sample selection and acquisition” at argonne national laboratory october 6th 2010. Stand. Genomic Sci. 3, 249–253. doi:10.4056/aigs.1443528
Gonsior, M., Peake, B. M., Cooper, W. T., Podgorski, D., D’Andrilli, J., and Cooper, W. J. (2009). Photochemically induced changes in dissolved organic matter identified by ultrahigh resolution Fourier transform ion cyclotron resonance mass spectrometry. Environ. Sci. Technol. 43, 698–703. doi:10.1021/es8022804
Grasshoff, K., Ehrhardt, M., Kremling, K., and Anderson, L. G. (Editors) (1999). Methods of seawater analysis. 3rd, completely rev. extended ed ed. (Weinheim ; New York: Wiley VCH).
Graves, C. A., Steinle, L., Rehder, G., Niemann, H., Connelly, D. P., Lowry, D., et al. (2015). Fluxes and fate of dissolved methane released at the seafloor at the landward limit of the gas hydrate stability zone offshore western Svalbard: dissolved methane off western Svalbard. J. Geophys. Res. Oceans 120, 6185–6201. doi:10.1002/2015JC011084
Gründger, F., Probandt, D., Knittel, K., Carrier, V., Kalenitchenko, D., Silyakova, A., et al. (2021). Seasonal shifts of microbial methane oxidation in Arctic shelf waters above gas seeps. Limnol. Oceanogr. N/a. 66, 1896–1914. doi:10.1002/lno.11731
Hanson, R. S., and Hanson, T. E. (1996). Methanotrophic bacteria. Microbiol. Rev. 60, 439–471. doi:10.1128/mr.60.2.439-471.1996
Hertkorn, N., Benner, R., Frommberger, M., Schmitt-Kopplin, P., Witt, M., Kaiser, K., et al. (2006). Characterization of a Major Refractory Component of Marine Dissolved Organic Matter. Geochimica et Cosmochimica Acta 70 (12), 2990–3010. doi:10.1016/j.gca.2006.03.021
Hockaday, W. C., Purcell, J. M., Marshall, A. G., Baldock, J. A., and Hatcher, P. G. (2009). Electrospray and photoionization mass spectrometry for the characterization of organic matter in natural waters: a qualitative assessment. Limnol. Oceanogr. Methods 7, 81–95. doi:10.4319/lom.2009.7.81
Hodgkins, S. B., Tfaily, M. M., Podgorski, D. C., McCalley, C. K., Saleska, S. R., Crill, P. M., et al. (2016). Elemental composition and optical properties reveal changes in dissolved organic matter along a permafrost thaw chronosequence in a subarctic peatland. Geochim. Cosmochim. Acta 187, 123–140. doi:10.1016/j.gca.2016.05.015
James, R. H., Bousquet, P., Bussmann, I., Haeckel, M., Kipfer, R., Leifer, I., et al. (2016). Effects of climate change on methane emissions from seafloor sediments in the Arctic Ocean: a review. Limnol. Oceanogr. 61, S283–S299. doi:10.1002/lno.10307
Jiao, N., Herndl, G. J., Hansell, D. A., Benner, R., Kattner, G., Wilhelm, S. W., et al. (2010). Microbial production of recalcitrant dissolved organic matter: long-term carbon storage in the global ocean. Nat. Rev. Microbiol. 8, 593–599. doi:10.1038/nrmicro2386
Kalyuzhnaya, M. G., Gomez, O. A., and Murrell, J. C. (2019). “The methane-oxidizing bacteria (methanotrophs),” in Taxonomy, genomics and ecophysiology of hydrocarbon-degrading microbes. Editor T. J. McGenity (Cham: Springer International Publishing), 245–278. doi:10.1007/978-3-030-14796-9_10
Kalyuzhnaya, M. G., Yang, S., Rozova, O. N., Smalley, N. E., Clubb, J., Lamb, A., et al. (2013). Highly efficient methane biocatalysis revealed in a methanotrophic bacterium. Nat. Commun. 4, 2785. doi:10.1038/ncomms3785
Kerckhof, F.-M., Sakarika, M., Van Giel, M., Muys, M., Vermeir, P., De Vrieze, J., et al. (2021). From biogas and hydrogen to microbial protein through co-cultivation of methane and hydrogen oxidizing bacteria. Front. Bioeng. Biotechnol. 9, 733753. Available at:. doi:10.3389/fbioe.2021.733753
Kim, S., Kramer, R. W., and Hatcher, P. G. (2003). Graphical method for analysis of ultrahigh-resolution broadband mass spectra of natural organic matter, the van Krevelen Diagram. Anal. Chem. 75, 5336–5344. doi:10.1021/ac034415p
Knief, C. (2015). Diversity and habitat preferences of cultivated and uncultivated aerobic methanotrophic bacteria evaluated based on pmoA as molecular marker. Front. Microbiol. 6. 1346, doi:10.3389/fmicb.2015.01346
Kuhlisch, C., Schleyer, G., Shahaf, N., Vincent, F., Schatz, D., and Vardi, A. (2021). Viral infection of algal blooms leaves a unique metabolic footprint on the dissolved organic matter in the ocean. Sci. Adv. 7, eabf4680. doi:10.1126/sciadv.abf4680
Kujawinski, E. B. (2011). The impact of microbial metabolism on marine dissolved organic matter. Annu. Rev. Mar. Sci. 3, 567–599. doi:10.1146/annurev-marine-120308-081003
Kujawinski, E. B., Del Vecchio, R., Blough, N. V., Klein, G. C., and Marshall, A. G. (2004). Probing molecular-level transformations of dissolved organic matter: insights on photochemical degradation and protozoan modification of DOM from electrospray ionization Fourier transform ion cyclotron resonance mass spectrometry. Mar. Chem. 92, 23–37. doi:10.1016/j.marchem.2004.06.038
Kujawinski, E. B., Longnecker, K., Barott, K. L., Weber, R. J. M., and Kido Soule, M. C. (2016). Microbial community structure affects marine dissolved organic matter composition. Front. Mar. Sci. 3. doi:10.3389/fmars.2016.00045
Lau, M. P., and del Giorgio, P. (2020). Reactivity, fate and functional roles of dissolved organic matter in anoxic inland waters. Biol. Lett. 16, 20190694. doi:10.1098/rsbl.2019.0694
Lechtenfeld, O. J., Hertkorn, N., Shen, Y., Witt, M., and Benner, R. (2015). Marine sequestration of carbon in bacterial metabolites. Nat. Commun. 6, 6711–6718. doi:10.1038/ncomms7711
Lian, J., Zheng, X., Zhuo, X., Chen, Y.-L., He, C., Zheng, Q., et al. (2021). Microbial transformation of distinct exogenous substrates into analogous composition of recalcitrant dissolved organic matter. Environ. Microbiol. 23, 2389–2403. doi:10.1111/1462-2920.15426
Lidstrom, M. E. (2006). “Aerobic methylotrophic prokaryotes,” in The prokaryotes: volume 2: ecophysiology and biochemistry. Editors M. Dworkin, S. Falkow, E. Rosenberg, K.-H. Schleifer, and E. Stackebrandt (New York, NY: Springer), 618–634. doi:10.1007/0-387-30742-7_20
Liu, C., Cui, Y., Li, X., and Yao, M. (2021). microeco: an R package for data mining in microbial community ecology. FEMS Microbiol. Ecol. 97, fiaa255. fiaa255. doi:10.1093/femsec/fiaa255
Mau, S., Heintz, M. B., and Valentine, D. L. (2012). Quantification of CH4 loss and transport in dissolved plumes of the Santa Barbara Channel, California. Cont. Shelf Res. 32, 110–120. doi:10.1016/j.csr.2011.10.016
Mau, S., Römer, M., Torres, M. E., Bussmann, I., Pape, T., Damm, E., et al. (2017). Widespread methane seepage along the continental margin off Svalbard - from Bjørnøya to Kongsfjorden. Sci. Rep. 7, 42997. doi:10.1038/srep42997
Menze, S., Ingvaldsen, R. B., Nikolopoulos, A., Hattermann, T., Albretsen, J., and Gjøsæter, H. (2020). Productive detours – Atlantic water inflow and acoustic backscatter in the major troughs along the Svalbard shelf. Prog. Oceanogr. 188, 102447. doi:10.1016/j.pocean.2020.102447
Middelboe, M., and Lyck, P. G. (2002). Regeneration of dissolved organic matter by viral lysis in marine microbial communities. Aquat. Microb. Ecol. 27, 187–194. doi:10.3354/ame027187
Morris, R. M., Longnecker, K., and Giovannoni, S. J. (2006). Pirellula and OM43 are among the dominant lineages identified in an Oregon coast diatom bloom. Environ. Microbiol. 8, 1361–1370. doi:10.1111/j.1462-2920.2006.01029.x
Murrell, J. C. (2010). “The aerobic methane oxidizing bacteria (methanotrophs),” in Handbook of hydrocarbon and lipid microbiology. Editor K. N. Timmis Germany, (Springer Berlin Heidelberg), 1953–1966. doi:10.1007/978-3-540-77587-4_143
Niemann, H., Steinle, L., Blees, J., Bussmann, I., Treude, T., Krause, S., et al. (2015). Toxic effects of lab-grade butyl rubber stoppers on aerobic methane oxidation. Limnol. Oceanogr. Methods 13, 40–52. doi:10.1002/lom3.10005
Noriega-Ortega, B. E., Wienhausen, G., Mentges, A., Dittmar, T., Simon, M., and Niggemann, J. (2019). Does the chemodiversity of bacterial exometabolomes sustain the chemodiversity of marine dissolved organic matter? Front. Microbiol. 10, 215. doi:10.3389/fmicb.2019.00215
Oksanen, J., Blanchet, F. G., Friendly, M., Kindt, R., Legendre, P., McGlinn, D., et al. (2020). Vegan: community ecology package. Available at: https://CRAN.R-project.org/package=vegan.
Osterholz, H., Niggemann, J., Giebel, H.-A., Simon, M., and Dittmar, T. (2015). Inefficient microbial production of refractory dissolved organic matter in the ocean. Nat. Commun. 6, 7422. doi:10.1038/ncomms8422
Owrid, G., Socal, G., Civitarese, G., Luchetta, A., Wiktor, J., Nöthig, E.-M., et al. (2000). Spatial variability of phytoplankton, nutrients and new production estimates in the waters around Svalbard. Polar Res. 19, 155–171. doi:10.3402/polar.v19i2.6542
Pohlman, J. W., Bauer, J. E., Waite, W. F., Osburn, C. L., and Chapman, N. R. (2011). Methane hydrate-bearing seeps as a source of aged dissolved organic carbon to the oceans. Nat. Geosci. 4, 37–41. doi:10.1038/ngeo1016
Qian, J., and Mopper, K. (1996). Automated high-performance, high-temperature combustion total organic carbon analyzer. Anal. Chem. 68, 3090–3097. doi:10.1021/ac960370z
Quast, C., Pruesse, E., Yilmaz, P., Gerken, J., Schweer, T., Yarza, P., et al. (2013). The SILVA ribosomal RNA gene database project: improved data processing and web-based tools. Nucleic Acids Res. 41, D590–D596. doi:10.1093/nar/gks1219
R Core Team (2022). R: a language and environment for statistical computing. Available at: https://www.R-project.org/.
Reeburgh, W. S. (2007). Oceanic methane biogeochemistry. Chem. Rev. 107, 486–513. doi:10.1021/cr050362v
Renner, A., Bailey, A., Reigstad, M., Sundfjord, A., and Øygarden, S. (2020). Hydrography and nutrient concentrations in years of contrasting sea ice conditions in the Atlantic inflow region north of Svalbard. Copernicus Meetings. doi:10.5194/egusphere-egu2020-1606
Rivas-Ubach, A., Liu, Y., Bianchi, T. S., Tolić, N., Jansson, C., and Paša-Tolić, L. (2018). Moving beyond the van Krevelen diagram: a new stoichiometric approach for compound classification in organisms. Anal. Chem. 90, 6152–6160. doi:10.1021/acs.analchem.8b00529
Rosselló-Mora, R., Lucio, M., Peña, A., Brito-Echeverría, J., López-López, A., Valens-Vadell, M., et al. (2008). Metabolic evidence for biogeographic isolation of the extremophilic bacterium Salinibacter ruber. ISME J. 2, 242–253. doi:10.1038/ismej.2007.93
Serov, P., Portnov, A., Mienert, J., Semenov, P., and Ilatovskaya, P. (2015). Methane release from pingo-like features across the South Kara Sea shelf, an area of thawing offshore permafrost. J. Geophys. Res. Earth Surf. 120, 1515–1529. doi:10.1002/2015JF003467
Sert, M. F., D’Andrilli, J., Gründger, F., Niemann, H., Granskog, M. A., Pavlov, A. K., et al. (2020). Compositional differences in dissolved organic matter between arctic cold seeps versus non-seep sites at the Svalbard continental margin and the Barents Sea. Front. Earth Sci. 8, 552731. doi:10.3389/feart.2020.552731
Sert, M. F., Niemann, H., Reeves, E. P., Granskog, M. A., Hand, K. P., Kekäläinen, T., et al. (2022). Compositions of dissolved organic matter in the ice-covered waters above the Aurora hydrothermal vent system, Gakkel Ridge, Arctic Ocean. Biogeosciences 19, 2101–2120. doi:10.5194/bg-19-2101-2022
Sjöstedt, J., Lapierre, J.-F., Yamashita, Y., and Baltar, F. (2021). Editorial: microbial utilization and transformation of dissolved organic matter in aquatic environments–from streams to the deep ocean. Front. Microbiol. 12, 668560. Available at:. doi:10.3389/fmicb.2021.668560
Steinle, L., Graves, C. A., Treude, T., Ferré, B., Biastoch, A., Bussmann, I., et al. (2015). Water column methanotrophy controlled by a rapid oceanographic switch. Nat. Geosci. 8, 378–382. doi:10.1038/ngeo2420
Steinle, L., Maltby, J., Treude, T., Kock, A., Bange, H. W., Engbersen, N., et al. (2017). Effects of low oxygen concentrations on aerobic methane oxidation in seasonally hypoxic coastal waters. Biogeosciences 14, 1631–1645. doi:10.5194/bg-14-1631-2017
Theisen, A. R., and Murrell, J. C. (2005). Facultative methanotrophs revisited. J. Bacteriol. 187, 4303–4305. doi:10.1128/JB.187.13.4303-4305.2005
Tremblay, J.-É., Michel, C., Hobson, K. A., Gosselin, M., and Price, N. M. (2006). Bloom dynamics in early opening waters of the Arctic Ocean. Limnol. Oceanogr. 51, 900–912. doi:10.4319/lo.2006.51.2.0900
Valle, J., Gonsior, M., Harir, M., Enrich-Prast, A., Schmitt-Kopplin, P., Bastviken, D., et al. (2018). Extensive processing of sediment pore water dissolved organic matter during anoxic incubation as observed by high-field mass spectrometry (FTICR-MS). Water Res. 129, 252–263. doi:10.1016/j.watres.2017.11.015
Van den Meersche, K., Soetaert, K., and Middelburg, J. J. (2011). Plankton dynamics in an estuarine plume: a mesocosm 13C and 15N tracer study. Mar. Ecol. Prog. Ser. 429, 29–43. doi:10.3354/meps09097
Vekeman, B., Kerckhof, F.-M., Cremers, G., de Vos, P., Vandamme, P., Boon, N., et al. (2016). New Methyloceanibacter diversity from North Sea sediments includes methanotroph containing solely the soluble methane monooxygenase. Environ. Microbiol. 18, 4523–4536. doi:10.1111/1462-2920.13485
Vincent, F., and Vardi, A. (2023). Viral infection in the ocean—a journey across scales. PLOS Biol. 21, e3001966. doi:10.1371/journal.pbio.3001966
Wilhelm, S. W., and Suttle, C. A. (1999). Viruses and Nutrient Cycles in the Sea: viruses play critical roles in the structure and function of aquatic food webs. BioScience 49, 781–788. doi:10.2307/1313569
Yilmaz, P., Parfrey, L. W., Yarza, P., Gerken, J., Pruesse, E., Quast, C., et al. (2014). The SILVA and “all-species living tree project (LTP)” taxonomic frameworks. Nucleic Acids Res. 42, D643–D648. doi:10.1093/nar/gkt1209
Zabłocka, M., Kowalczuk, P., Meler, J., Peeken, I., Dragańska-Deja, K., and Winogradow, A. (2020). Compositional differences of fluorescent dissolved organic matter in Arctic Ocean spring sea ice and surface waters north of Svalbard. Mar. Chem. 227, 103893. doi:10.1016/j.marchem.2020.103893
Keywords: dissolved organic matter, methane, cold seeps, Arctic Ocean, methane oxidation, methanotrophs, FT-ICR MS
Citation: Sert MF, Schweitzer HD, de Groot TR, Kekäläinen T, Jänis J, Bernstein HC, Ferré B, Gründger F, Kalenitchenko D and Niemann H (2023) Elevated methane alters dissolved organic matter composition in the Arctic Ocean cold seeps. Front. Earth Sci. 11:1290882. doi: 10.3389/feart.2023.1290882
Received: 08 September 2023; Accepted: 04 December 2023;
Published: 15 December 2023.
Edited by:
Andrew Jonathan Hodson, The University Centre in Svalbard, NorwayReviewed by:
Xiyang Dong, Third Institute of Oceanography of the Ministry of Natural Resources, ChinaCopyright © 2023 Sert, Schweitzer, de Groot, Kekäläinen, Jänis, Bernstein, Ferré, Gründger, Kalenitchenko and Niemann. This is an open-access article distributed under the terms of the Creative Commons Attribution License (CC BY). The use, distribution or reproduction in other forums is permitted, provided the original author(s) and the copyright owner(s) are credited and that the original publication in this journal is cited, in accordance with accepted academic practice. No use, distribution or reproduction is permitted which does not comply with these terms.
*Correspondence: Muhammed Fatih Sert, bXVoYW1tZWQuZi5zZXJ0QHVpdC5ubw==
Disclaimer: All claims expressed in this article are solely those of the authors and do not necessarily represent those of their affiliated organizations, or those of the publisher, the editors and the reviewers. Any product that may be evaluated in this article or claim that may be made by its manufacturer is not guaranteed or endorsed by the publisher.
Research integrity at Frontiers
Learn more about the work of our research integrity team to safeguard the quality of each article we publish.