 Jiawei Wan1,2
 Bin Li
- 1Institute of Geomechanics, Chinese Academy of Geological Sciences, Beijing, China
- 2Key Laboratory of Active Tectonics and Geological Safety, Ministry of Natural Resources, Beijing, China
- 3College of Geological Engineering and Geomatics, Chang’an University, Xi’an, China
Pumping-induced normal fault reactivation and the resultant ground fracture have been observed in faulted basins worldwide, but the process and mechanism are poorly understood thus far. In this study, we conducted centrifuge model tests to investigate and analyze these issues. Two simplified faulted models, Models 1 and 2, were developed based on an actual event that occurred in the Beijing Plain, China. Our model tests reproduced the pumping-induced normal fault reactivation, characterized by localized hanging wall subsidence with new fault scarp formation in the models. The monitoring results showed that water table decline drastically accelerated uneven subsidence. Although the deformation pattern did not respond to variations in the material properties of the hanging wall and footwall, the magnitude of the reactivated normal faulting was influenced. The maximum vertical offset in Model 2 was much larger than that in Model 1 due to a larger compression modulus in the hanging wall and footwall in Model 2. Furthermore, the reactivation mechanism was revealed based on Anderson’s faulting theory. Normal faulting occurs once the maximum principal stress becomes vertical and the intermediate and minimum principal stresses become horizontal. Groundwater pumping increases the effective stress, leading to the addition of vertical stress and the resultant normal fault reactivation. Our findings provide a better understanding of human interactions with the Earth’s surface and are helpful for mitigating faulting-caused disasters.
1 Introduction
Fault creeps endangers buildings, roads, tunnels, and other essential infrastructures that cannot accommodate fault motion. Wu et al. (2004) documented that a 150-m long road of the Golmud-Lhasa Highway across the Tibetan Plateau was destroyed by fault creep of the normal South Ando fault with 20-cm vertical offsets. Similar serious damage caused by continuous strike-slip faulting and thrusting has also been reported in the literature (Azzaro et al., 1998; Lee et al., 2003; Carpenter et al., 2011; Harris, 2017; Yan et al., 2021). It is believed that fault creep can be reactivated by human activities (Gupta, 2002; Donnelly, 2009; Davies et al., 2013; Lamontagne et al., 2018; Passelègue et al., 2018; Peng et al., 2020). In the faulted basin of Querétaro, Mexico, at least 16 casings of pumping wells were ruptured along pre-existing normal faults in a 10-year period without seismic events (Carreon-Freyre et al., 2016). Many ground fractures and ruptures, or so-called earth fissures, occurred, accompanying substantial differential subsidence and dislocated infrastructure. Accordingly, Ochoa-González et al. (2018) conducted a three-dimensional numerical analysis to analyze the formation mechanism of ground fractures occurring in the Querétaro basin, and their results proved that pumping-induced piezometric declines triggered fault reactivation.
Similar land deformation patterns have occurred in the northern Beijing Plain, China, where several Cenozoic normal faults lie beneath. The Gaoliying and Shunyi earth fissures, as shown in Figure 1, accompanying the pumping-induced land subsidence, vertically dislocated the ground surface (Wan et al., 2020). They are distributed along the shallowly buried normal faults in a 7- and 13- km long zones, respectively, and the maximum vertical offset is approximately 30 cm. Thus, many buildings, roads, and an international airport constructed on earth fissure zones have been continuously damaged for decades. Our previous study (Wan et al., 2021) analyzed the formation mechanism of the Shunyi earth fissures and found that the deformation pattern of the new earth fissures is inherited from the pre-existing normal fault. The localized surface faulting, represented by the earth fissures and related differential subsidence, may suggest partial reactivation of the pre-existing normal fault. This argument was supported by Zhou et al. (2022) using high-resolution interferometric synthetic aperture radar (InSAR) and numerical modeling. However, the entire process of fault reactivation due to groundwater overexploitation is poorly understood thus far.
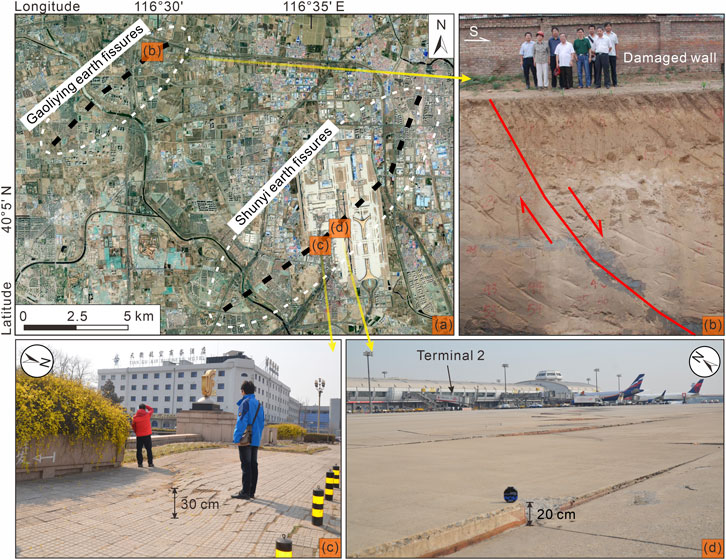
FIGURE 1. (A) Distributions of the Gaoliying and Shunyi earth fissures in the Beijing Plain, China. (B) An 8.4-m deep trench in Xiwanglu village, revealing recent normal faulting across the Gaoliying fissures. The picture was derived from a report available to the public (Beijing Hydrogeological and Engineering Geological Survey, 2007). (C,D) Photos of the Shunyi earth fissures with uneven subsidence, taken on 15 March 2017.
Theoretical analysis, numerical simulation, and model test methods were applied in the evaluation of the characteristics and failure mechanism of materials (Song et al., 2021a; Song et al., 2021b; Wang et al., 2023; Zhou et al., 2023). In contrast, centrifuge model testing is a more practical approach to exploring and analyzing the deformation behavior of materials subjected to stress change (Meguid et al., 2008; White, 2008). It technically enables small-scale models to feel the same stress field as a full-scale prototype since the external acceleration field is specified times greater than the gravitational acceleration. This method has been used in some studies of faulting-induced ground surface deformation (Tali et al., 2019; Sabagh and Ghalandarzadeh, 2020; Song et al., 2021c) and pumping-induced subsidence (Cui and Tang, 2010; Rincón et al., 2020). However, previous test cases did not research the deformation behavior of an aquifer system containing a pre-existing fault under the effects of groundwater withdrawal.
This paper aimed to study the pumping-induced aquifer system deformation and consequent fault reactivation using the centrifuge model test method. Two physical models representing faulted aquitards and aquifers were constructed to evaluate the effects of the hydrogeological conditions on fault reactivation. The aquitards were purely made of clay, whereas the aquifers were composed of sand. The pre-existing fault zone was considered a mixed material. For model construction, the real case that occurred in the faulted land of the Beijing Plain, China, was referred to. We monitored the pore pressure variations, displacement field, and model deformation process and conducted a comprehensive analysis based on the monitoring data derived from the two model tests. The study results can provide a better understanding of the interaction between the Earth’s surface deformation and human activities, which is helpful in mitigating faulting-caused disasters.
2 Methodology
We chose the centrifuge model test method and constructed two centrifuge models based on different Quaternary aquifer systems to display the large-scale land surface deformation process in a small-scale model and in a relatively short time. Centrifuge modeling is an advanced physical modeling technique for tackling complex geotechnical problems. It was first proposed by French engineer Édouard Phillips in 1869 and initially applied to study various geotechnical problems in the 1930s (Craig, 1989; Charles, 2014). After rapid development, the centrifuge model technique was generally well accepted in the geotechnical society. In the geotechnical centrifuge model test, a small-scale physical model can experience an elevated acceleration caused by centrifuge rotation to eliminate the weight loss effects due to the shrunken scale. Namely, the stress state of the 1/n scaled model is consistent with that of the prototype when the centrifugal acceleration reached n times the gravitational acceleration.
The centrifugal acceleration ng is related to the centrifuge rotation speed, as presented in Eq. 1.
where r and ω are the radius and angular velocity of the beam, respectively. Based on the well-known equivalence principle developed by Albert Einstein, the physical behavior of the model under gravity is equivalent to that of the prototype under the centrifugal force. Thus, we can use the geotechnical centrifuge model test method to study the geotechnical problems of the prototype, provided that the centrifuge machine provides sufficient centrifugal acceleration.
Previous studies (Taylor, 1995; Garnier et al., 2007) have made a detailed inventory of the scaling laws for the geotechnical centrifuge model test. Some scaling factors used in this paper are summarized in Table 1, given that the centrifugal acceleration is ng. This table shows that centrifuge modeling effectively reduces the model size and substantially shortens the test time (consolidation time).
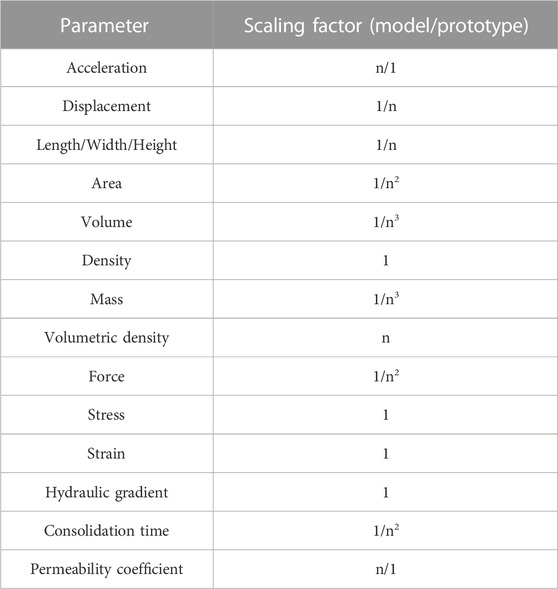
TABLE 1. Scaling factors in the geotechnical centrifuge model test.
3 Model preparation
3.1 Model test apparatus
The test facility employed in this paper was a large beam geotechnical centrifuge belonging to the Changjiang River Scientific Research Institute, China. It was established in 2009 and has been applied many times to address various geotechnical problems (Feng et al., 2013; Li et al., 2016; Zhang et al., 2021). This centrifuge facility essentially consists of a data acquisition panel, a beam with a radius of 3.5 m, a motor axis, a counterweight platform, and a modeling box platform (Figure 2A). The capacity and the maximum acceleration of the centrifuge can reach 200 g-ton and 200 g (where g is the gravitational acceleration), respectively. During the tests in this paper, the centrifugal acceleration was incrementally increased up to 100 g.
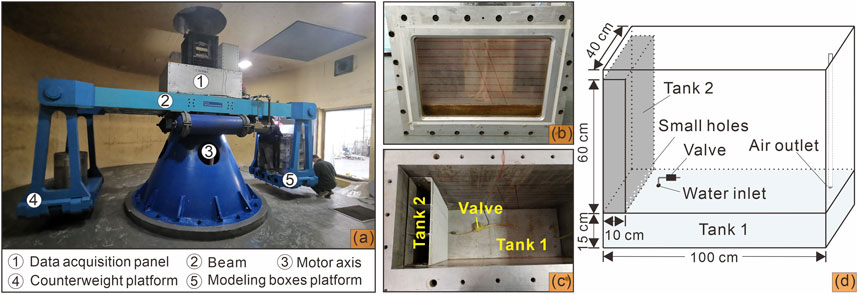
FIGURE 2. Geotechnical centrifuge and model box used in this paper. (A) Overview of the centrifuge. (B) Front side of the box. (C) Open top. (D) Perspective view of the model box and critical components.
The modeling box used for the tests had dimensions of 1 m × 0.8 m × 0.4 m in length, height, and width. It was mainly made of thick high-strength stainless steel plates, except for the front wall containing a transparent plexiglass plate so that the internal deformation of the model materials could be directly observed (Figures 2B, C). Tank 1, with a volume of 0.06 m3, was situated at the bottom of the box for water storage (Figures 2C, D). A water inlet, controlled by a solenoid valve, and an air outlet, connected with a long tube, were set on the top of Tank 1. Using Tank 1 and the valve, we could electrically control the water table decline in the model during the test. Tank 2, with a volume of 0.024 m3, was placed on the left side of the modeling box for water pressure observation and monitoring (Figures 2C, D). Two rows of small holes were set on the bottom of the right wall of Tank 2, enabling water inflow and outflow.
3.2 Model test design
For model construction, the geological conditions of the faulted land in the Beijing Plain, China, were referred to, where two groups of earth fissures, accompanying pumping-induced Quaternary aquifer system compaction, vertically dislocated the ground surface along the pre-existing normal fault (Wan et al., 2020; Wan et al., 2021). Then, we designed two simplified models in this paper, Models 1 and 2 (Figure 3A), to compare and analyze the deformation processes of faulted lands within different types of Quaternary aquifer systems under the effects of water table decline. They represented faulted aquitards and aquifers, respectively. The aquitards were purely made of clay, whereas the aquifers were composed of sand. The pre-existing fault zone was considered a mixed material that consisted of clay and sand in a 1:1 dry mass ratio. It had a permeability coefficient between that of clay and sand and a lower compression modulus than all surrounding soils (Caine et al., 1996; Faulkner et al., 2006; Wan et al., 2021). The properties of the fault zones in the two models were essentially identical.
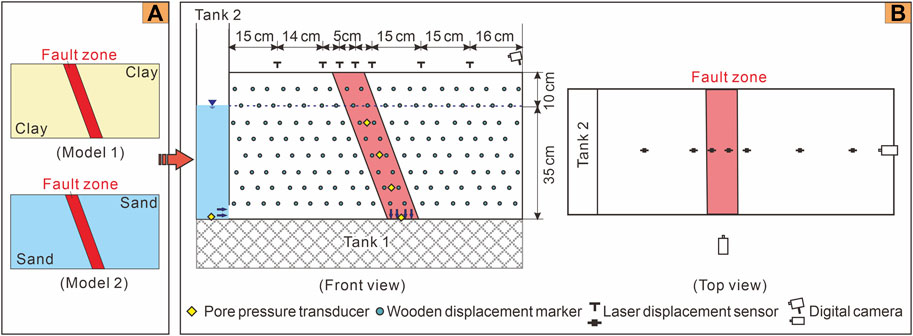
FIGURE 3. Design of Models 1 and 2 in the test. (A) Conceptual models. (B) Layout of the measurement and monitoring system. The initial water table was at the height of 35 cm. The blue arrows indicate the direction of the water flow since the testing began. From left to right, the laser displacement sensors were coded LD1∼LD7 in sequence. Pore pressure transducers in the fault zone were coded PP1∼PP4 along the upward direction, while that in Tank 2 was PP5.
Both Models 1 and 2 were 0.9 m × 0.45 m × 0.4 m in length, height, and width. The pre-existing fault zone was set in the middle with a dip angle of 70°, indicating that the model soils had been faulted. The top of the model was a flat surface before testing began. The fault zone width was set as 10 cm and enlarged to 10 m after the centrifugal acceleration reached 100 g, according to the scaling factor shown in Table 1. For the same reason, after the acceleration increased to 100 g, the size of Models 1 and 2 became 90 m × 45 m × 40 m.
3.3 Measurement and monitoring system
During the model test, water pressure, displacement, and deformation features were measured or monitored for further analysis. The water pressures at different positions were monitored by five miniature pore pressure transducers. Four transducers were buried in the fault zone at heights of 0–30 cm with a vertical spacing of 10 cm, and the other was at the bottom of Tank 2. From the front view, the displacements of the model materials were measured using wooden displacement markers buried in the soil, together with measuring tape pasted around the plexiglass plate on the front wall. Both the horizontal and vertical spacings of the displacement markers were 5 cm. The vertical displacements of the top surface were also monitored by seven laser displacement sensors installed above the model box. Both the water pressure and laser displacement sensor values were recorded once per second. The deformation phenomenon was observed using two high-definition digital cameras from the top and front views. A data acquisition system affiliated with the beam geotechnical centrifuge automatically recorded these monitoring results. The layout of the measuring and monitoring devices is shown in Figure 3B.
3.4 Soil properties
We designed two test models (Models 1 and 2) in this paper based on the real geological conditions in the faulted land of the Beijing Plain, China, which mainly consists of clays and sands. The materials used in Models 1 and 2 represented faulted aquitards and aquifers, respectively. According to our previous field investigation results (Wan et al., 2020; Wan et al., 2021), the aquitards were purely made of clay, whereas the aquifers were composed of sand; the pre-existing fault zone was considered a mixed material.
We used clay and sand to construct the physical models in the centrifuge model test, as shown in Figure 3A. Most of the clay particles had a size of less than 0.002 mm. The maximum dry unit weight of the clay was 1720 kg/m3 with respect to the optimum water content of 17%. The sands in the model test were natural river sands screened to sizes in the range of 0.35–2 mm. The pre-existing fault zone was created by clays and sands mixed in a dry mass ratio of 1:1.
The model materials were compacted layer-by-layer at a unit thickness of 5 cm in the model box. Their compaction degree was limited to a certain extent to protect the devices, transducers, sensors, and wires from damage caused by the compacting hammer. Note that the compaction degree of the pre-existing fault zone was relatively low to ensure that it had a smaller compression modulus than the surrounding soils. The properties of the three types of compacted model materials are listed in Table 2.
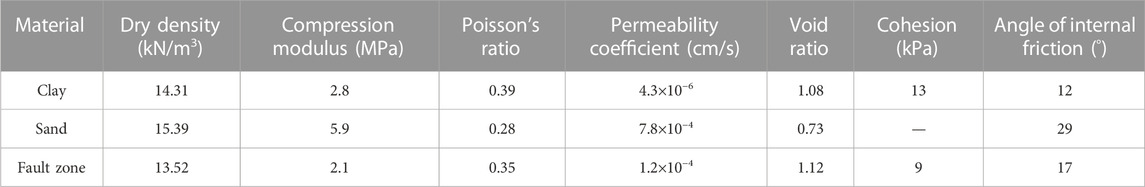
TABLE 2. Properties of the model materials.
4 Test procedure
Two centrifuge model tests were conducted to simulate the process of pumping-induced normal fault reactivation in the faulted Quaternary aquifer system. They had broadly similar procedures, including the following key steps:
1) Check all required equipment, devices, wires, soft systems, and materials before model testing.
2) Compact the soil layers of 5 cm thickness in the model box using a calibrated steel hammer. Scratch each layer surface before the next layer is laid to improve the homogeneity. Bury the wooden displacement markers and pore pressure transducers. Soak the soils below a height of 35 cm (Figure 3B).
3) Put the modeling box and counterweight onto the platform of the geotechnical centrifuge (Figure 2). Install the laser displacement sensors and digital cameras according to the model test design (Figure 3B). Connect the transducers, sensors, and cameras to the data acquisition panel of the centrifuge.
4) Start the centrifuge and incrementally increase the centrifugal acceleration. Maintain the rotation speed of the centrifuge once the acceleration reaches 100 g.
5) After the initial deformation caused by the acceleration increase becomes stable, turn on the valve (Figure 2) to cause a water table decline. The model test can be ended when the model deformation has essentially ceased.
5 Results and analysis
5.1 Model 1
During the test, the centrifugal acceleration was incrementally increased in five stages: 20 g, 40 g, 60 g, 80 g, and 100 g. The next step was started when the model deformation was overall stabilized. After the acceleration reached 100 g, the centrifuge kept rotating at a constant angular velocity until the test ended. The time when the acceleration of Model 1 reached 100 g was 2,117 s, and the whole duration of the test was 3,613 s. At 2,350 s, the water inlet valve of Tank 1 was turned on. Then, water stored in the model soils flowed downward into Tank 1, and consequently, the water table declined from the height of 35 cm, representing the process of groundwater exploitation.
The monitoring results of the pore pressure transducers in Model 1 are shown in Figure 4. The PP1∼PP4 transducers were buried in the fault zone in sequence at heights of 0–30 cm with a vertical spacing of 10 cm, and PP5 was immersed in pure water in Tank 2 (Figure 3B). The change in the pore pressure is affected by the centrifugal acceleration and water table decline according to the classical fluid pressure equation considering the scaling factor (Table 2) as follows:
where P is the pore pressure, ρ is the density of the liquid, a is the vertical acceleration (a=1 g when it is the gravitational acceleration), and h is the depth of the liquid. As shown in Figure 4, the pore pressures from the PP1∼PP5 transducers incrementally increased before the centrifugal acceleration reached 100 g (t=2,117 s), which agreed with the five increasing stages of centrifugal acceleration. The pore pressures became 343 kPa, 245 kPa, 147 kPa, 49 kPa, and 343 kPa when the time was 2,117 s. However, pore pressures in the model (PP2∼PP4) decreased more or less during every rotation stage with certain constant speeds before the water inlet valve was turned on. PP4 had the most drastic decrease, while PP2 had the slightest decrease. This was caused by some water stored in the shallow layers flowing toward the free surface (upward) during the compaction of unconsolidated model soils.
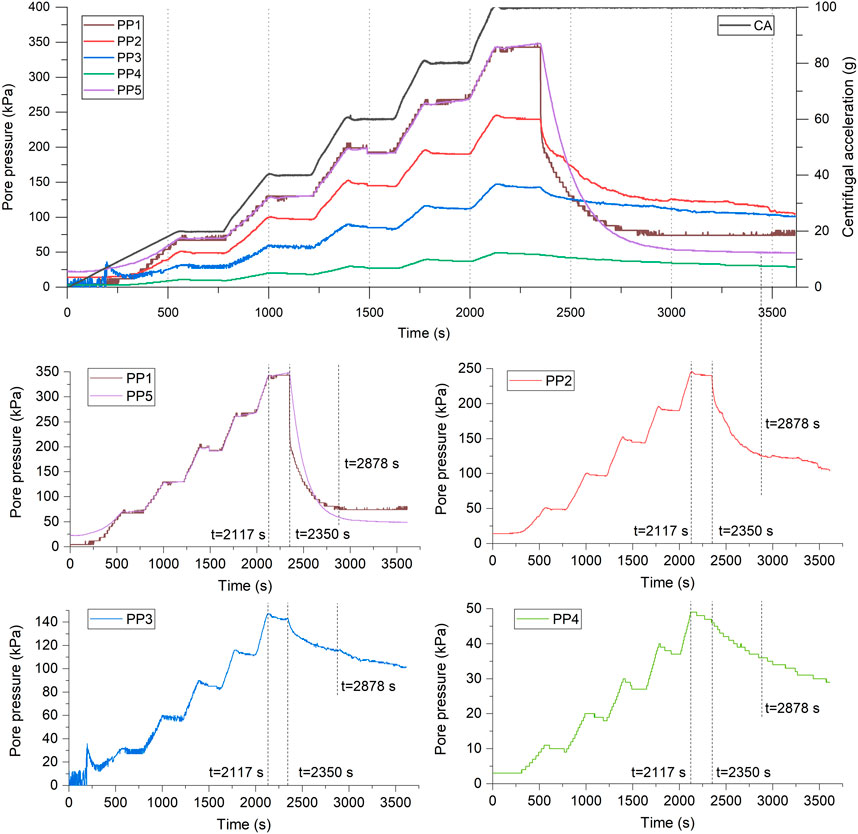
FIGURE 4. Variation in the centrifugal acceleration and monitoring results of the pore pressure transducers. The locations of the PP1∼PP5 transducers in Model 1 are shown in Figure 3B.
During the centrifugal acceleration maintained at 100 g, the pore pressures decreased mainly following the water table decline after t=2,350 s. The rate and degree of the decrease in pore pressures were governed by the location in the faulted clayey model. The pore pressure recorded by the PP1 transducer, buried at the bottom of the model soils and close to the water inlet valve, decreased at the most rapid rate. In contrast, the PP4 transducer buried adjacent to the model top had an evident pore pressure decrease but at a slow pace. The decreasing rates of the pore pressures slowed with time (Figure 4). At 2,878 s, the transient decreasing rates of pore pressures of PP1∼PP4 became 0, 0.02 kPa/s, 0.02 kPa/s, and 0.01 kPa/s, indicating that the pore pressure dissipation process tended to stop. Due to the low permeability of the clayey materials of Model 1, the pore pressures did not entirely dissipate at the test end.
As shown in Figure 5, every layer of Model 1 evidently deformed in the centrifuge model test. The surface subsidence was 1–3 cm, which was calculated using the measuring tape with wooden displacement markers. The deformation was caused by the compaction of unconsolidated soils due to the vertical effective stress increase, according to Terzaghi’s effective stress principle as follows:
where P is the pore pressure, σ′ is the effective stress, and σ is the total stress. The total stress σ can be understood in terms of
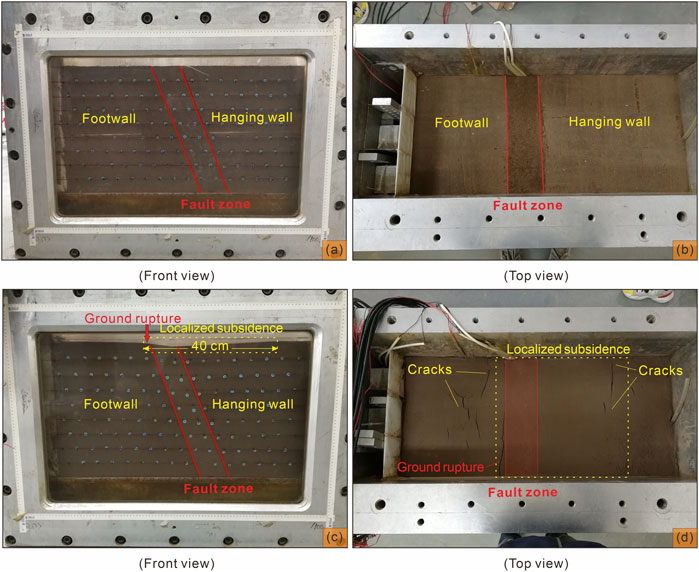
FIGURE 5. Deformation and failure patterns of Model 1. (A,B) Model 1 before the centrifuge model test. (C,D) Model 1 after the centrifuge model test.
The most intense compaction occurred in the pre-existing fault zone, leading to the upper and surrounding areas dramatically deforming. The deformation pattern of the soils was three-dimensional but was dominated by subsidence. In addition, a small amount of horizontal movements toward the fault zone occurred in both the hanging wall and footwall. On the model surface, a localized subsidence area covering an area of 40 cm × 40 cm formed along the pre-existing fault zone and largely on the hanging wall (Figures 5C, D). The largest subsidence was approximately 3 cm, measured using the measuring tapes pasted on the model box. A 25-cm-long ground rupture, or earth fissure, formed accompanying the uneven subsidence along the left boundary of the localized subsidence area adjacent to the fault zone (Figure 5D). The new rupture and localized subsidence on the right side were controlled by the pre-existing fault zone. This uneven deformation pattern in the model indicated that the pre-existing fault was reactivated to a certain extent. These findings agreed with our previous numerical simulations regarding the Shunyi fissures (Wan et al., 2021). Moreover, several short cracks with different shapes and trends formed close to both edges of the localized subsidence area. Such cracks have been widely observed in groundwater-overexploitation-induced subsidence areas (Galloway and Burbey, 2011; Gambolati and Teatini, 2015; Peng et al., 2020).
The complete process of subsidence and rupture formation in Model 1 was recorded by two digital cameras from the front and top views. The screenshots of the video at the moments before the groundwater declined (t=2,349 s) and when the test ended (t=3,613 s) were selected in the detailed analysis. As shown in Figure 6, ground rupture controlled by the pre-existing fault zone formed, accompanying the uneven model deformation, before the water inlet valve was opened. After the valve was opened (t=2,350 s), the uneven deformation of Model 1 was supposed to be intensified due to the water table decline and the consequent effective stress increase, according to conventional consolidation theory. We drew several reference lines on the screenshot images to observe the uneven deformation pattern during this period (Figure 6). The images from the front view showed that the increased subsidence had a degree of less than 1 cm, and the shallow layers had relatively more significant deformation, measured using the L0∼L7 lines. From the top view, the displacements relative to the LA and LB lines indicated that the hanging wall subsided more evidently. These monitoring results displayed the process of pre-existing normal fault reactivation, although reactivation began before the water table declined.
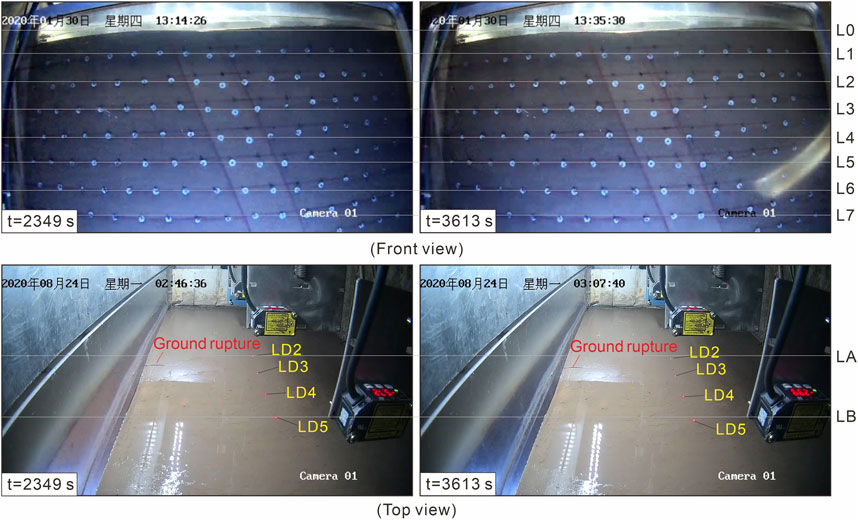
FIGURE 6. Monitoring results of two high-definition digital cameras from the front and top views of Model 1. L0∼L7 and LA∼LB on the images are the codes of the horizontal reference lines. LD2∼LD5 are the codes of the laser displacement sensors, and the red dots mark the monitoring locations.
Moreover, the video showed that water continuously seeped out of Model 1 and accumulated in the localized subsidence area during the model test, which agreed with the pore pressure results shown in Figure 4. The maximum height of the standing water was approximately 0.5 cm. The standing water increased the water content and plasticity of the shallow soils, allowing the model to become deformed without cracking or fracturing. After the centrifuge stopped rotating, the water on the model surface infiltrated down, facilitating ground fracture propagation. This is why the ground rupture in the photo (Figure 5D) was more significant than that in the video screenshot (Figure 6).
The vertical displacements of the Model 1 surface were monitored by seven laser displacement sensors (LD1∼LD7). The LD1 and LD2 sensors monitored the footwall displacement, the LD3 and LD4 sensors monitored the fault zone displacement, and the LD5∼LD7 sensors monitored the hanging wall displacement. Their locations are shown in Figure 3B.
The results shown in Figure 7 proved that the laser displacement sensors performed well during the test. The vertical displacements of the Model 1 surface increased with regularity, and no runtime error occurred. The variations in the vertical displacements of the Model 1 surface were primarily controlled by the centrifugal acceleration but were also influenced by the water table decline (Figure 7A). The subsidence of the model ranged from 17.69 to 36.36 mm. The pre-existing fault zone and part of the hanging wall experienced the most significant deformation, whereas the edges of the model, which were far from the fault zone, deformed by less than half. This result agreed with the photos taken after the model test (Figure 5) and the video screenshots at t=3,613 s (Figure 6).
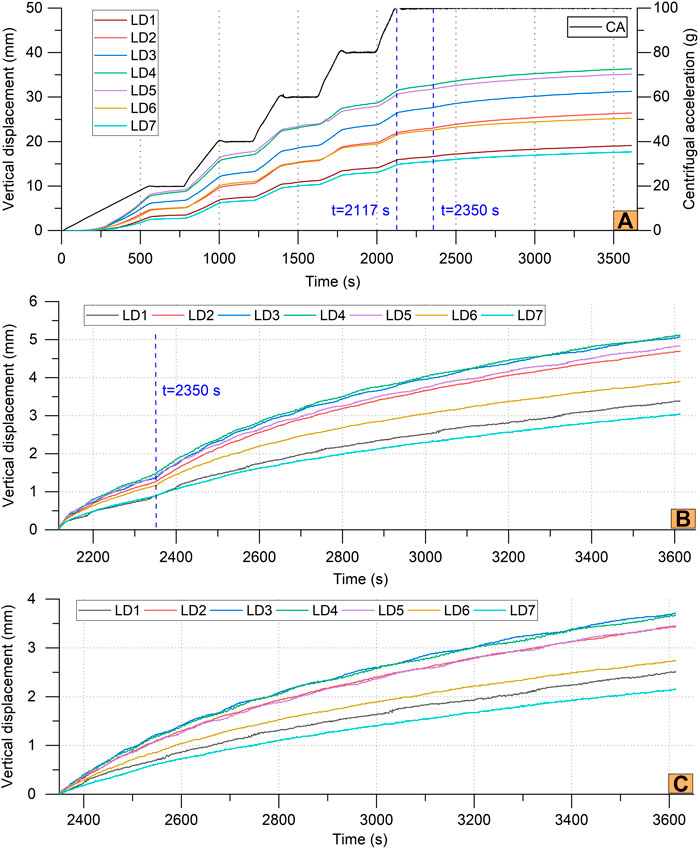
FIGURE 7. Vertical displacements of the Model 1 surface, monitored by the laser displacement sensors. (A) Displacements in the whole test period. (B) Incremental displacements when the centrifugal acceleration was 100 g (t≥2,117 s). (C) Incremental displacements when the water table was declining (t≥2,350 s).
The monitored vertical displacements verified that the uneven deformation of Model 1 was reactivated by the water table decline. After the centrifugal acceleration was maintained at 100 g (t≥2,117 s), the increase rate of the vertical displacement initially slowed and then suddenly accelerated after the water table began to decline (t=2,350 s), as shown in Figure 7B. During the water table decline, the incremental vertical displacement ranged from 2.16 mm to 3.71 mm (Figure 7C). The fault zone and part of the hanging wall still experienced more significant deformation than other places. The fault zone subsided most intensely, based on the LD3 and LD4 sensors obtaining the largest displacement (Figure 7C), due to its higher permeability coefficient, which facilitated the pore pressure decrease during this period. This was unlike the subsidence pattern before the water table declined and proved the substantial effect of groundwater pumping on the model deformation.
5.2 Model 2
Model 2 had a similar structure to Model 1 except that the hanging wall and footwall were made of sand (Figure 3A). The model test lasted for 4,681 s, and the procedure still contained five stages of centrifugal acceleration increase (20 g, 40 g, 60 g, 80 g, and 100 g). The acceleration reached 100 g at 2,130 s. Subsequently, the centrifuge rotated at a constant speed until 4,681 s.
Three water table decline times were designed and implemented in Model 2. Specifically, the water inlet valve of Tank 1 was turned on three times and turned off twice based on the monitoring results from the PP5 transducer in Tank 2 and the LD1∼LD7 sensors. The first turning on of the valve was at 2,718 s, and then the water table declined from a height of 35 cm. When the water table dropped to 23 cm, as calculated using the pore pressure of the PP5 transducer according to Eq. 2, the valve was turned off for hundreds of seconds to allow the model deformation to stabilize. In the periods of 3,143–3,441 s and 3,615–4,681 s, the valve was turned on again, and the water table declined from 23 cm to 12 cm, respectively. The last time, the water table declined until the end of the model test.
The locations of the PP1∼PP5 transducers in Model 2 were identical to those in Model 1 (Figure 3B). Similarly, the monitoring results showed that the pore pressure variation was closely associated with the centrifugal acceleration increase and the water table decline, as shown in Figure 8. When the acceleration reached 100 g (t=2,130 s), the pore pressures of the PP1∼PP5 transducers became 343 kPa, 245 kPa, 147 kPa, 49 kPa, and 343 kPa. The water inlet valve of Tank 1 in Model 2 was turned on three times at various intervals to simulate three stages of water table decline. Correspondingly, the pore pressures of the PP1∼PP5 transducers decreased after t=2,718 s. During the first, second, and third water table declines, the values of the PP4, PP3, and PP2 transducers reached the minimum values, respectively. The PP1 and PP5 transducers had substantially identical variations in the pore pressures. At t=4,097 s, the water table of Model 2 tended to be stable in view of the decreasing rate of the pore pressure of the PP1 and PP5 transducers, which had become 0.01 kPa/s.
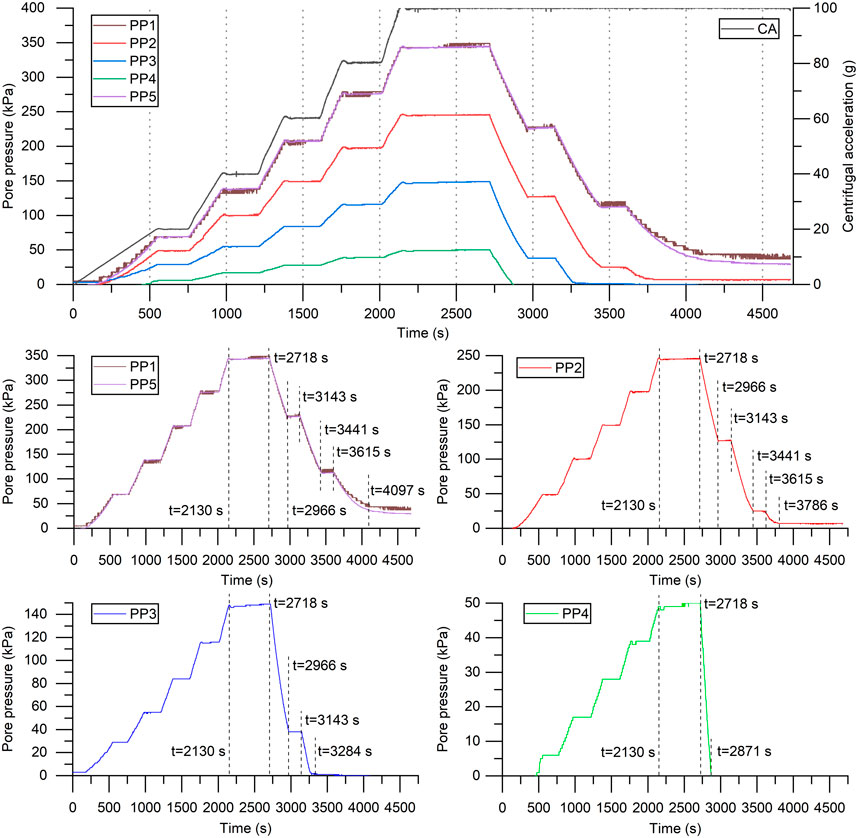
FIGURE 8. Variation in the centrifugal acceleration and monitoring results of the pore pressure transducers. The locations of the PP1∼PP5 transducers in Model 2 are shown in Figure 3B.
Model 2 had essentially constant pore pressures when the centrifugal acceleration was maintained at a specific value and the water inlet valve was turned off, which was different from the results in Model 1. This result indicated that water did not flow to the surface of Model 2 during the compaction of the unconsolidated soils. The reason was that Model 2, made of sandy materials, had a high permeability coefficient favorable for water infiltration.
Model 2 subsided 0.2–3 cm, accompanied by slight horizontal movements oriented toward the pre-existing fault zone, after the test, measured using the measuring tape and wooden displacement markers (Figure 9). The fault zone and surrounding areas, especially the hanging wall, experienced the most significant deformation, leading to localized subsidence forming on the model surface. The localized subsidence roughly covered an area of 34.5 cm × 40 cm, and the boundaries were very clear (Figures 9C, D). Models 2 and 1 had similar deformation patterns, whereas the subsidence degree and the scale of the localized subsidence in Model 2 were smaller than those in Model 1.
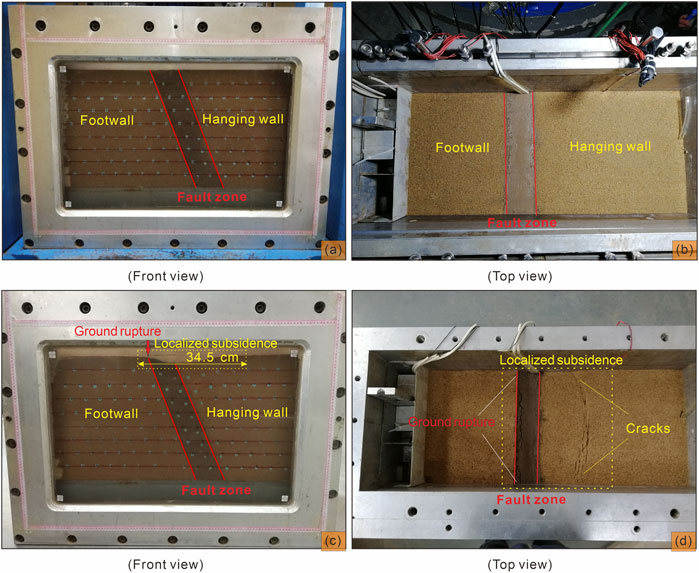
FIGURE 9. Deformation and failure patterns of Model 2. (A) and (B) Model 2 before the centrifuge model test. (C,D) Model 2 after the centrifuge model test.
At the boundary of the localized subsidence area, ground rupture formed and propagated along the pre-existing fault zone with a length of 40 cm, passing through all of Model 2. The right side of the ground fracture, where the fault zone dipped toward, subsided much more severely than the left side. The largest vertical offset was approximately 2.5 cm. Thus, the pattern of pre-existing normal fault reactivation occurred again in the model test, and it was more evident in Model 2 (Figures 9C, D) than in Model 1 (Figures 5C, D). These results agreed with our previous numerical simulations regarding earth fissures in the Beijing Plain, China (Wan et al., 2021). Moreover, similar to Model 1, a series of arc-shaped cracks formed close to the boundary of the localized subsidence. They surrounded the center of the model where the water inlet valve was buried, indicating that the cracks were, unlike ground fracture, controlled by the location of groundwater pumping.
The uneven subsidence and ground fracture in Model 2 were more significant than those in Model 1 because the model materials of the hanging wall and footwall were replaced by sand in Model 2, which had a higher compression modulus (Table 2). The unconsolidated soils of the hanging wall and footwall in Model 2 therefore slightly compacted under the same water table decline conditions. Meanwhile, the fault zones in Models 1 and 2 deformed to similar degrees due to their identical material properties. Thus, the uneven subsidence became more significant in Model 2, and then, the ground fracture propagated through the whole model.
The mechanical behavior of Model 2 was recorded by two digital cameras installed in front of and above the model box. The video showed that dramatic localized subsidence and extensive ground fracture formed before the groundwater declined (t<2,718 s), and the uneven deformation intensified after the water table fell (Figure 10). The pumping-induced subsidence was more evident in the fault zone and adjacent hanging wall, whereas it was very slight in the footwall, as measured by using the reference lines on the screenshots of the video. These results recorded by cameras for Models 1 and 2 proved that the pre-existing normal fault zone would be reactivated by human activity, especially in the shallow layers.
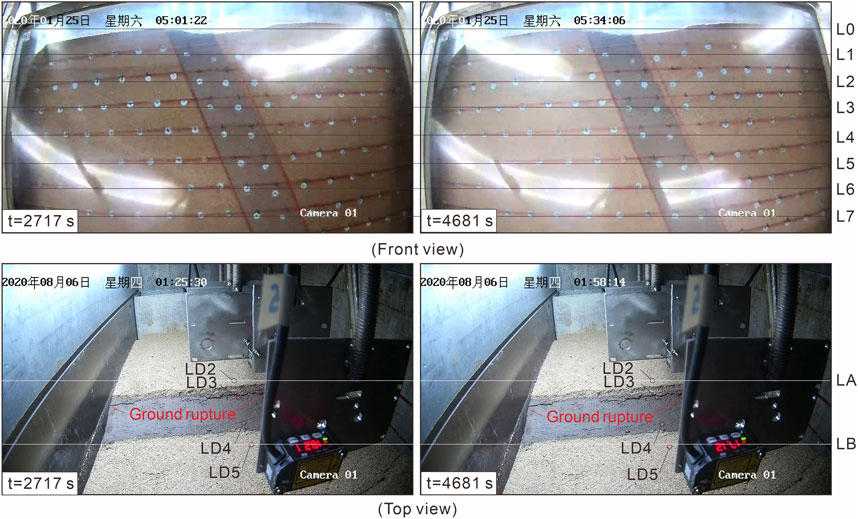
FIGURE 10. Monitoring results of two high-definition digital cameras from the front and top views of Model 2. L0∼L7 and LA∼LB on the images are the codes of the horizontal reference lines. LD2∼LD5 are the codes of the laser displacement sensors, and the red dots in the black circles mark the monitoring locations.
The LD1∼LD7 laser displacement sensors installed above the model box, shown in Figure 3B, monitored the vertical displacements of the top surface of Model 2 during the model test. The monitoring results showed that the vertical displacements varied with the increase in the centrifugal acceleration and the decrease in the pore pressures, and evident subsidence only occurred in the pre-existing fault zone and the adjacent hanging wall (Figure 11A). The largest subsidence was 32.72 mm, measured by the LD4 sensor, and the smallest was 2.72 mm, measured by the LD1 sensor. Namely, the vertical surface offset reached 30 mm in Model 2. These monitoring results agreed with the photos in Figure 9 and the video screenshots in Figure 10.
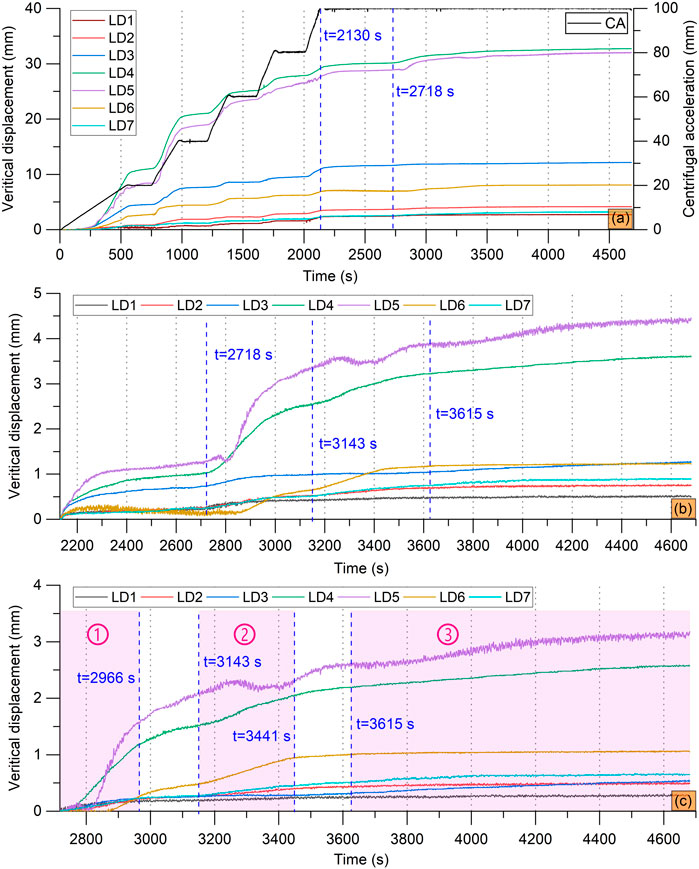
FIGURE 11. Vertical displacements of the Model 2 surface, monitored by laser displacement sensors. (A) Displacements in the whole test period. (B) Incremental displacements when the centrifugal acceleration was 100 g (t≥2,130 s). (C) Incremental displacements beginning at the first water table decline (t≥2,718 s). The numbers ①, ②, and ③ with light purple bands indicate the first, second, and third water table declines in the model test, respectively.
The monitored displacements showed that the pre-existing fault zone in Model 2 was evidently reactivated by the water table decline. As shown in Figure 11B, the model deformation approached the end soon after the centrifugal acceleration reached 100 g. However, the nearly stable situation was readily disturbed when the water inlet valve of Tank 1 was opened. The vertical displacements from the LD4 and LD5 sensors dramatically changed due to the water table decline, whereas the displacements at other locations of Model 2 slightly increased. A displacement decrease occurred twice in the LD5 records because of the horizontal movements of the sand grains on the model surface, as shown in the photos (Figure 9) and video screenshots (Figure 10). The incremental displacements during t≥2,718 s ranged in 0.27–3.18 mm (Figure 11C). Then, the hanging wall subsided 2.91 mm relative to the footwall, which was more significant than the result in Model 1 (Figure 7C). The dramatic pumping-induced subsidence of the hanging wall, behaving similar to normal faulting, indicated that the pre-existing fault zone in Model 2 had been reactivated.
Furthermore, the three water table decline times induced different degrees of normal fault reactivation in Model 2 (Figure 11C), although they had similar height drops. The water table first dropped from 35 cm to 23 cm in the model, then from 23 cm to 12 cm, and lastly from 12 cm to approximately 0. The vertical displacements of the hanging wall adjacent to the fault, shown in the LD4 and LD5 curves, soared during the first decline and evidently increased during the second decline. In contrast, the increase rate was less marked during the last decline. Thus, the uneven deformation of Model 2 mainly occurred in the first two water table declines, indicating that groundwater overexploitation in shallower faulted layers may be more susceptible to fault reactivation and ground fracture formation.
6 Discussion
6.1 Deformation pattern in the faulted land due to groundwater exploitation
Two centrifuge model tests were conducted under nearly identical experimental conditions in this study to simulate the process of uneven ground deformation and fault reactivation in faulted lands triggered by groundwater pumping. The model test results displayed the generation of a new ground fracture along the pre-existing fault zone with localized subsidence of the hanging wall, which occurred before the water table declined but was substantially promoted by pumping. When the centrifugal acceleration was maintained at 100 g, the decrease in the model deformation rate was sharply reversed by the start of the water table decline, based on the video records and vertical displacement variations during the tests. The test results showed that the deformation pattern in the faulted land did not respond to variations in the material properties of the sedimentary soils constituting the hanging wall and footwall.
The shallow part of the pre-existing normal fault was reactivated in the model test, which resulted in uneven surface deformation and new ground fracture formation (Figure 12). The new fractures were long and straight due to the control of the fault zone lying beneath, unlike the common short cracks formed adjacent to pumping-induced surface subsidence boundaries. The surface subsidence of the hanging wall was much more significant than that of the footwall, indicating that the models experienced uneven subsidence. The significant subsidence was mainly in a localized area, and the scale may be influenced by the depression cone and the pre-existing fault zone. The normal faulting occurring in the faulted models was inherited from the pre-existing normal fault but less related to the location of the pumping well, which has been verified by our previous numerical simulations (Wan et al., 2021).
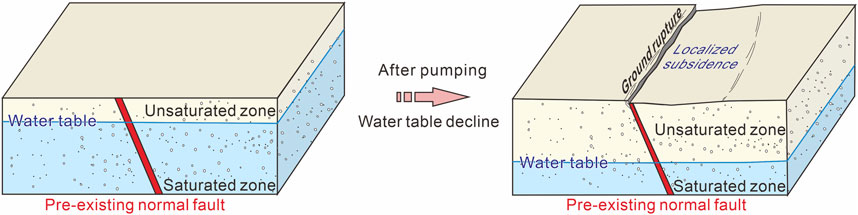
FIGURE 12. Pattern of pumping-induced subsidence and normal fault reactivation based on the results of the centrifuge model tests.
The water table decline process was broken down into three intermittent steps in the Model 2 test to gain a deeper understanding of the rapid response of fault reactivation to groundwater pumping. The results showed that the subsidence of the hanging wall was immediately aggravated after every time the water table declined, indicating the intensification of normal faulting. Nevertheless, the response was attenuated in proportion to the cumulative height drop of the water level. During the last decline, the water table dropped from a height of 12 cm with a corresponding but nonsignificant increase in hanging wall subsidence. This finding suggested that pumping in shallow faulted layers could be more prone to normal fault reactivation.
6.2 Effects of the properties of sedimentary soils
The magnitude of the reactivated normal faulting, instead of the model deformation pattern, was influenced by the material properties of the sedimentary soils. In Model 1, the total vertical offset was 18.67 mm, equal to the maximum displacement of 36.36 mm minus the minimum of 17.69 mm; the vertical offset after the water table declined was 1.55 mm, equal to the maximum incremental displacement of 3.71 mm minus the minimum of 2.16 mm. In contrast, in Model 2, the total vertical offset reached 30.00 mm (32.72 mm minus 2.72 mm), and the vertical offset caused by pumping was 2.91 mm (3.18 mm minus 0.27 mm). Evidently, Model 2 experienced more severe normal faulting than Model 1, and the new ground fracture formed along the pre-existing normal fault in Model 2 was thus much longer and wider. The main reason was that the sands in Model 2 had a compression modulus more than twice that of the clay in Model 1, which resulted in the footwall of Model 2 having negligible subsidence. Moreover, the reactivated faulting magnitude in Model 1 was also restricted by the low permeability of clay. This increased the difficulty of water pressure dissipation, and as a result, the development of pumping-induced deformation was limited.
6.3 Mechanism of normal fault reactivation
Anderson (1905), Anderson (1951) proposed a faulting theory, which is widely recognized today, to explain the mechanisms of three basic types of faulting. It is based on the assumption that there is no shear on the Earth’s free surface; thus, one principal stress direction is vertical, and the other two are horizontal. In this theory, normal dip-slip faults only occur when the maximum principal stress is vertical, and the intermediate and minimum principal stresses are horizontal.
Our centrifuge model tests satisfied the aforementioned assumption. During the test, the increased centrifugal acceleration caused a surge of pressure in the vertical direction perpendicular to the surface of Models 1 and 2. The maximum principal stress, accordingly, became vertical, and the intermediate and minimum principal stresses became horizontal (Figure 13A). This stress state conformed with Anderson’s normal faulting model. As a result, the pre-existing normal fault was reactivated, accompanied by localized subsidence of the hanging wall. The pumping-induced water table decline in the further test steps increased the effective stress, leading to the addition of vertical stress and the resultant intensification of normal faulting (Figure 13B). These results revealed that the normal fault reactivation in the model testing and the actual normal fault formation basically have identical mechanisms in that both are triggered by the vertical stress addition. Furthermore, groundwater pumping would cause normal fault reactivation due to the appropriate principal stresses, similar to tectonic movement, except that the reactivation progress caused by human activity is largely limited to a localized area.
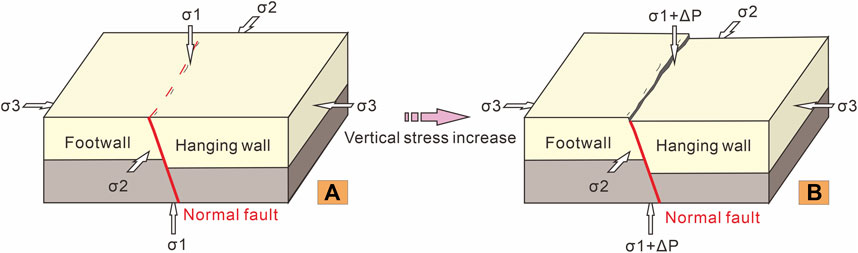
FIGURE 13. Stress state of the models in the tests and mechanism of normal fault reactivation. σ1, σ2, and σ3 are the maximum, intermediate, and minimum principal stresses, respectively. ΔP is the incremental stress. Yellow and brown blocks represent different sedimentary layers to distinguish the dislocation. (A) Stress state after the centrifugal acceleration increased. (B) Stress state after the water table declined.
6.4 Novelty and limitations
The entire process of pumping-induced normal fault reactivation in faulted lands was distinctly displayed in this study using the centrifuge model test method. It was characterized by small-scale normal faulting of models in which the hanging wall subsided with new fault scarp formation. The results from Models 1 and 2, which consisted of different materials, showed that the pre-existing fault zone governed this model deformation pattern. The material properties of the hanging wall and footwall only exerted an influence on the deformation degree. Thus, we believe that the normal faults contained in Quaternary aquifers, aquitards, or even their combinations would be reactivated by groundwater exploitation.
In the faulted basin of Querétaro, Mexico, at least 16 casings of pumping wells were believed to be ruptured due to pumping-induced fault reactivation (Carreon-Freyre et al., 2016; Ochoa-González et al., 2018). A similar phenomenon in which new ground fractures formed and vertically dislocated the surface along pre-existing normal faults also occurred in the northern Beijing Plain, China, which has been surveyed (Wan et al., 2020; Wan et al. 2021; Wan et al. 2022). In this paper, our findings confirmed the hypothesis that normal fault reactivation can be triggered by groundwater withdrawal. We reproduced the pumping-induced normal fault reactivation characterized by localized hanging wall subsidence with new fault scarp formation in the models. The maximum vertical offset was 18.67 mm in Model 1 and 30.00 mm in Model 2. This is acceptable because not all the model subsidence occurred after the centrifugal acceleration reached 100 g. Furthermore, the reactivation mechanism was explained based on Anderson’s faulting theory. Activation and reactivation of normal faulting would occur once the maximum principal stress is vertical and the intermediate and minimum principal stresses are horizontal. The driving force was mainly contributed by gravity. Therefore, the sharp increase in effective stress in the soils caused by the water table decline resulted in the addition of vertical stress and finally led to normal fault reactivation. These findings not only provide a better understanding of human interactions with the Earth’s surface but also prove the necessity of reducing or avoiding large withdrawals in faulted basins, especially adjacent to shallowly buried normal fault zones, which is helpful for preventing faulting disasters.
We not only discussed the displacement increase after the centrifugal acceleration was maintained at 100 g but also analyzed the acceleration variation part because it verified the authenticity of our model test. A large proportion of model deformation inevitably occurred before the centrifugal acceleration reached 100 g, which may influence the final conclusions. Thus, the discussion of the acceleration variation was essential and could not be ignored.
The self-consistent monitoring results, including the centrifugal accelerations, pore pressures, real-time videos, and vertical displacements, verified the accuracy and reliability of our study. Nevertheless, the model tests had one limitation—precise regulation of the initial compaction degree of the soils in the small-scale model box was difficult, which led to the occurrence of normal faulting in Models 1 and 2 ahead of schedule. Inadequate compaction of the model soils was inevitable due to the considerable gap between human efforts in normal gravity (1 g) conditions and the power of 100 g acceleration. Thus, even if the soils were more highly compacted, normal fault reactivation would still probably occur before the water table declined. Moreover, the human power used in the compaction had to be limited to avoid unexpected damage to the buried electronics and wires. Even so, the model test results are acceptable. The increased hanging wall subsidence induced by groundwater pumping was not slight but sufficiently evident in the video records and vertical displacement curves due to the enlargement effects according to the scaling laws of the geotechnical centrifuge model test.
7 Conclusion
The process of pumping-induced normal fault reactivation in faulted lands was simulated and analyzed using the geotechnical centrifuge model test method based on a real case occurring in the northern Beijing Plain, China. The key findings of this study are as follows:
(1) Groundwater pumping partly reactivated the pre-existing normal fault in the models, characterized by localized subsidence of the hanging wall and new ground fracture formation along the pre-existing fault zone. This deformation pattern did not respond to variations in the material properties of the hanging wall and footwall.
(2) The properties of the sedimentary layers influenced the magnitude of the reactivated normal faulting. The maximum vertical offset was 18.67 mm in Model 1 and 30.00 mm in Model 2, indicating that Model 2 experienced more dramatic normal faulting than Model 1. This resulted from the Model 2 footwall subsiding negligibly, and the root cause was that the sands in Model 2 had a much larger compression modulus.
(3) The reactivation and original formation of normal faulting were mainly triggered by gravity when the maximum principal stress became vertical and the intermediate and minimum principal stresses became horizontal. Groundwater pumping increased the effective stress, leading to the addition of vertical stress and the resultant normal fault reactivation.
In conclusion, groundwater pumping would reactivate the pre-existing normal fault in faulted lands in a localized area, regardless of the effect of the material properties of the hanging wall and footwall. The reactivation mechanism was revealed and explained based on Anderson’s faulting theory. Our results provide a better understanding of human interactions with the Earth’s surface, and accordingly, we recommend adequately reducing or avoiding large withdrawals adjacent to a shallowly buried normal fault zone to prevent faulting disasters.
Data availability statement
The original contributions presented in the study are included in the article/Supplementary Material, further inquiries can be directed to the corresponding author.
Author contributions
JW: Conceptualization, Data curation, Formal Analysis, Funding acquisition, Investigation, Methodology, Validation, Writing–original draft, Writing–review and editing. BL: Conceptualization, Funding acquisition, Methodology, Resources, Supervision, Writing–review and editing. YG: Methodology, Resources, Writing–review and editing. CT: Supervision, Writing–review and editing. ZL: Investigation, Methodology, Writing–original draft.
Funding
The author(s) declare financial support was received for the research, authorship, and/or publication of this article. This study was funded by the National Key R&D Program of China (No. 2022YFC3004301) and the National Natural Science Foundation of China (U2244226 and U2244227), and China Geological Survey (DD20230540, DD20230538).
Acknowledgments
We thank the Changjiang River Scientific Research Institute, China, for providing the model test apparatus. We also appreciate the help of the postgraduate Han Zhang and Weile Wu from Chang’an University, China, during the model testing.
Conflict of interest
The authors declare that the research was conducted in the absence of any commercial or financial relationships that could be construed as a potential conflict of interest.
Publisher’s note
All claims expressed in this article are solely those of the authors and do not necessarily represent those of their affiliated organizations, or those of the publisher, the editors and the reviewers. Any product that may be evaluated in this article, or claim that may be made by its manufacturer, is not guaranteed or endorsed by the publisher.
References
Anderson, E. M. (1905). The dynamics of faulting. Trans. Edinb. Geol. Soc. 8 (3), 387–402. doi:10.1144/transed.8.3.387
Anderson, E. M. (1951). The dynamics of faulting and dike formation with application to Britain. 2nd Edition. London Edinburgh: Oliver & Boyd.
Azzaro, R., Ferreli, L., Michetti, A. M., Serva, L., and Vittori, E. (1998). Environmental hazard of capable faults: the case of the pernicana fault (Mt. Etna, sicily). Nat. Hazards 17, 147–162. doi:10.1023/A:1008034422086
Beijing Hydrogeological and Engineering Geological Survey (2007). Preliminary regional engineering geological exploration report in Shunyi new town. Beijing: Geological Survey.
Caine, J. S., Evans, J. P., and Forster, C. B. (1996). Fault zone architecture and permeability structure. Geol 24 (11), 1025–1028. doi:10.1130/0091-7613(1996)024<1025:FZAAPS>2.3.CO;2
Carpenter, B. M., Marone, C., and Saffer, D. M. (2011). Weakness of the San Andreas Fault revealed by samples from the active fault zone. Nat. Geosci. 4 (4), 251–254. doi:10.1038/ngeo1089
Carreon-Freyre, D., Cerca, M., Ochoa-Gonzalez, G., Teatini, P., and Zuñiga, R. (2016). Shearing along faults and stratigraphic joints controlled by land subsidence and piezometric gradients in the Valley of Queretaro, Mexico. Hydrogeol. J. 24 (3), 657–674. doi:10.1007/s10040-016-1384-0
Charles, W. W. N. G. (2014). The state-of-the-art centrifuge modelling of geotechnical problems at HKUST. J. Zhejiang Univ. Sci. 15 (1), 1–21. doi:10.1631/jzus.A1300217
Craig, W. H. (1989). Édouard Phillips (1821–89) and the idea of centrifuge modelling. Géotechnique. 39 (4), 697–700. doi:10.1680/geot.1989.39.4.697
Cui, Z. D., and Tang, Y. Q. (2010). Land subsidence and pore structure of soils caused by the high-rise building group through centrifuge model test. Eng. Geol. 113, 44–52. doi:10.1016/j.enggeo.2010.02.003
Davies, R., Foulger, G., Bindley, A., and Styles, P. (2013). Induced seismicity and hydraulic fracturing for the recovery of hydrocarbons. Mar. Pet. Geol. 45 (4), 171–185. doi:10.1016/j.marpetgeo.2013.03.016
Donnelly, L. J. (2009). A review of international cases of fault reactivation during mining subsidence and fluid abstraction. Q. J. Eng. Geol. Hydrogeol. 42 (1), 73–94. doi:10.1144/1470-9236/07-017
Faulkner, D. R., Mitchell, T. M., Healy, D., and Heap, M. J. (2006). Slip on "weak" faults by the rotation of regional stress in the fracture damage zone. Nat 444, 922–925. doi:10.1038/nature05353
Feng, Z., Yin, Y. P., Li, B., and Yan, J. K. (2013). Physical modeling of landslide mechanism in oblique thick-bedded rock slope: a case study. Acta Geol. sin-engl. 87 (4), 1129–1136. doi:10.1111/1755-6724.12115
Galloway, D. L., and Burbey, T. J. (2011). Revisão: subsidência regional associada à extracção de água subterrânea. Hydrogeol. J. 19 (8), 1459–1486. doi:10.1007/s10040-011-0775-5
Gambolati, G., and Teatini, P. (2015). Geomechanics of subsurface water withdrawal and injection. Water Resour. Res. 51, 3922–3955. doi:10.1002/2014wr016841
Garnier, J., Gaudin, C., Springman, S. M., Culligan, P. J., Goodings, D., Konig, D., et al. (2007). Catalogue of scaling laws and similitude questions in geotechnical centrifuge modelling. Int. J. Phys. Model. Geo 7 (3), 01–23. doi:10.1680/ijpmg.2007.070301
Gupta, H. K. (2002). A review of recent studies of triggered earthquakes by artificial water reservoirs with special emphasis on earthquakes in Koyna, India. Earth-Sci Rev. 58 (3-4), 279–310. doi:10.1016/S0012-8252(02)00063-6
Harris, R. A. (2017). Large earthquakes and creeping faults. Rev. Geophys 55, 169–198. doi:10.1002/2016RG000539
Jacob, C. E. (1940). On the flow of water in an elastic artesian aquifer. Am. Geophys Union 21, 574–586. doi:10.1029/TR021i002p00574
Lamontagne, M., Rogers, G., Cassidy, J., Tournier, J., and Lawrence, M. S. (2018). A review of reservoir monitoring and reservoir-triggered seismicity in Canada. Bull. Seismol. Soc. Am. 108 (5B), 3062–3079. doi:10.1785/0120180009
Lee, J. C., Angelier, J., Chu, H. T., Hu, J. C., Jeng, F. S., and Rau, R. J. (2003). Active fault creep variations at Chihshang, Taiwan, revealed by creep meter monitoring, 1998–2001. J. Geophys Res. 108, 2528. doi:10.1029/2003JB002394
Li, B., Feng, Z., Wang, G. Z., and Wang, W. P. (2016). Processes and behaviors of block topple avalanches resulting from carbonate slope failures due to underground mining. Environ. Earth Sci. 75, 694. doi:10.1007/s12665-016-5529-1
Meguid, M. A., Saada, O., Nunes, M. A., and Mattar, J. (2008). Physical modeling of tunnels in soft ground: a review. Tunn. Undergr. Sp. Tech. 23 (2), 185–198. doi:10.1016/j.tust.2007.02.003
Ochoa-González, G. H., Carreón-Freyre, D., Franceschini, A., Cerca, M., and Teatini, P. (2018). Overexploitation of groundwater resources in the faulted basin of Querétaro, Mexico: A 3D deformation and stress analysis. Eng. Geol. 245, 192–206. doi:10.1016/j.enggeo.2018.08.014
Passelègue, F. X., Brantut, N., and Mitchell, T. M. (2018). Fault reactivation by fluid injection: controls from stress state and injection rate. Geophys Res. Lett. 45, 12837–12846. doi:10.1029/2018gl080470
Peng, J. B., Qiao, J. W., Sun, X. H., Lu, Q. Z., Zheng, J. G., Meng, Z. J., et al. (2020). Distribution and generative mechanisms of ground fissures in China. J. Asian Earth Sci. 191, 104218. doi:10.1016/j.jseaes.2019.104218
Rincón, E. R., Renato, P. C., and Bernardo, C. H. (2020). Analysis of settlements in piled raft systems founded in soft soil under consolidation process. Can. Geotech. J. 57, 537–548. doi:10.1139/cgj-2018-0702
Sabagh, M., and Ghalandarzadeh, A. (2020). Centrifugal modeling of continuous shallow tunnels at active normal faults intersection. Transp. Geotech. 22, 100325. doi:10.1016/j.trgeo.2020.100325
Song, D., Liu, X., Huang, J., and Zhang, J. (2021b). Energy-based analysis of seismic failure mechanism of a rock slope with discontinuities using Hilbert-Huang transform and marginal spectrum in the time-frequency domain. Landslides 18, 105–123. doi:10.1007/s10346-020-01491-7
Song, D., Liu, X., Huang, J., Zhang, Y., Zhang, J., and Nkwenti, B. N. (2021c). Seismic cumulative failure effects on a reservoir bank slope with a complex geological structure considering plastic deformation characteristics using shaking table tests. Eng. Geol. 286, 106085. doi:10.1016/j.enggeo.2021.106085
Song, D., Liu, X., Li, B., Zhang, J., and Bastos, J. J. V. (2021a). Assessing the influence of a rapid water drawdown on the seismic response characteristics of a reservoir rock slope using time–frequency analysis. Acta Geotech. 16, 1281–1302. doi:10.1007/s11440-020-01094-5
Tali, N., Lashkaripour, G. R., Moghadas, N. H., and Ghalandarzadeh, A. (2019). Centrifuge modeling of reverse fault rupture propagation through single-layered and stratified soil. Eng. Geol. 249, 273–289. doi:10.1016/j.enggeo.2018.12.021
Taylor, R. N. (1995). Geotechnical centrifuge Technology. London: Blackie Academic and Professional. doi:10.1201/9781482269321
Terzaghi, K. (1925). Principles of soil mechanics: IV Settlement and consolidation of clay. Eng. News-Rec. 95 (3), 874–878.
Wan, J. W., Li, B., Gao, Y., Tan, C. X., Feng, C. J., and Zhang, P. (2022). Dynamic response of the inhomogeneous pavement structure containing a buried fault zone under the moving aircraft loads. Bull. Eng. Geol. Environ. 81, 301. doi:10.1007/s10064-022-02770-4
Wan, J. W., Li, B., Tan, C. X., Feng, C. J., and Zhang, P. (2021). Formation mechanism of pumping-induced earth fissures associated with a pre-existing normal fault, Beijing, China. Eng. Geol. 294, 106361. doi:10.1016/j.enggeo.2021.106361
Wan, J. W., Li, B., Tan, C. X., Feng, C. J., Zhang, P., and Qi, B. S. (2020). Characteristics and main causes of earth fissures in northeastern Beijing plain, China. Bull. Eng. Geol. Environ. 79, 2919–2935. doi:10.1007/s10064-020-01731-z
Wang, L., Wu, C., Yang, Z., and Wang, L. (2023). Deep learning methods for time-dependent reliability analysis of reservoir slopes in spatially variable soils. Comput. Geotech. 159, 105413. doi:10.1016/j.compgeo.2023.105413
White, D. J. (2008). Contributions to géotechnique 1948–2008: physical modelling. Géotechnique. 58 (5), 413–421. doi:10.1680/geot.2008.58.5.413
Wu, Z. H., Barosh, P. J., Hu, D. G., Wu, Z. H., Zhao, X. T., Ye, P. S., et al. (2004). Hazards posed by active major faults along the Golmud–Lhasa railway route, Tibetan plateau, China. Eng. Geol. 74 (3-4), 163–182. doi:10.1016/j.enggeo.2004.02.004
Yan, Y. S., Chen, Y. H., Wang, C. C., Hwu, Y., Chiang, C. C., Sheu, H. S., et al. (2021). Faults caused by the fault: microstructural and mineral characterization of deformation in Chungliao tunnel, Taiwan, caused by Chishan fault. Eng. Geol. 292 (6), 106245. doi:10.1016/j.enggeo.2021.106245
Zhang, J. W., Cao, J., Li, B., Zhou, K. Y., and Lü, X. L. (2021). Centrifuge model test on the settlement of valley-type loess filled after construction and subjected to rainfall infiltration. Adv. Civ. Eng. 2021, 1–11. doi:10.1155/2021/8852623
Zhou, C., Hu, Y., Xiao, T., Ou, Q., and Wang, L. (2023). Analytical model for reinforcement effect and load transfer of pre-stressed anchor cable with bore deviation. Constr. Build. Material 379, 131219. doi:10.1016/j.conbuildmat.2023.131219
Keywords: groundwater pumping, fault reactivation, pre-existing normal fault, centrifuge model test, deformation, ground fracture
Citation: Wan J, Li B, Gao Y, Tan C and Li Z (2023) Pumping-induced reactivation of a pre-existing normal fault: insights from a centrifuge model test. Front. Earth Sci. 11:1289568. doi: 10.3389/feart.2023.1289568
Received: 06 September 2023; Accepted: 16 October 2023;
Published: 26 October 2023.
Edited by:
Chong Xu, Ministry of Emergency Management, ChinaReviewed by:
Yankun Wang, Yangtze University, ChinaMing Zhang, China University of Geosciences Wuhan, China
Danqing Song, South China University of Technology, China
Copyright © 2023 Wan, Li, Gao, Tan and Li. This is an open-access article distributed under the terms of the Creative Commons Attribution License (CC BY). The use, distribution or reproduction in other forums is permitted, provided the original author(s) and the copyright owner(s) are credited and that the original publication in this journal is cited, in accordance with accepted academic practice. No use, distribution or reproduction is permitted which does not comply with these terms.
*Correspondence: Bin Li, bGliX2x4c0BtYWlsLmNncy5nb3YuY24=
†Present address: Zhuang Li, Department of Water Conservancy Engineering, Henan Vocational College of Water Conservancy and Environment, Zhengzhou, China