 Jingde Lin
 Siyuan Xu1,2
- 1PetroChina Coalbed Methane Company Limited Engineering Technology Research Institute, Xi’an, China
- 2China United Coal-bed Methane National Engineering Research Center Company Limited, Beijing, China
The potential risks of liquid-loading can be significantly decreased by precisely calculating the minimum gas flowrate required for continuous liquid removal in gas wells and using suitable deliquification technology beforehand. Due to lack of comparative studies with liquid-loading characteristics, existing prediction models are not very adaptable in the course of the application. So as to investigate the flowing behavior of liquid film under different conditions, visual experiment was conducted. The findings indicate that as the inclined angle increases, the liquid-film-reversal gas velocity increases initially before decreasing. The maximum velocity of liquid-film-reversal is around 55°. The liquid-film-reversing gas velocity increases linearly along with the rise in superficial liquid velocities. The liquid-film-reversal gas velocity likewise increases linearly as the superficial liquid velocities. The analysis findings also indicate that several dynamic liquid-loading symptoms of the gas well are inconsistent with the liquid-film-reversal criterion, meaning that the gas well does not instantly follow the liquid-film-reversal. On the basis of our experimental findings, a new liquid-loading commencement criteria was then developed. As a result, this research suggests a novel model for evaluating liquid-loading in gas wells. The model’s accuracy was found to be as high as 85.7% by looking at 14 gas wells and perform better than other models in the Coleman dataset, which can theoretically enable the prediction of liquid-loading in gas wells.
1 Introduction
Oil and natural gas are the most important sources of energy and play a vital role in economic development (Chai, M. et al., 2022; Chai, M. et al., 2023). The majority of China conventional gas reservoirs are now in the middle and late stages of utilization as a result of the decline in reservoir pressure. The drag force of natural gas does not remove liquid continuously, causing the liquid to accumulate in the wellbore, dramatically increasing the wellbore pressure gradient and reducing gas production (Luo et al., 2022; Luo et al., 2023; Lea et al., 2008). Therefore, it is crucial to correctly forecast the lowest gas flowrate required for the beginning of liquid-loading, and to implement the necessary technological solutions to provide steady gas well production at low gas production stage (Zhang et al., 2021).
Turner et al. (1696) first suggested a model for forecasting the minimum gas flowrate of liquid removal based on droplet reversal, which is based on the force balance analysis of the droplet and determined the lowest flow rate necessary to push the droplet upwards. The force of droplet in gas core is proportional to the area of the droplet and the drag of the gas on the droplet. For this model, the safety value of 1.2 and the drag coefficient of 0.44 were chosen. Coleman et al. (1991) obtained higher calculation accuracy by remove the safety coefficient in the field application of Turner model by comparison with filed data. Guo et al. (2006) believe that when the force is in equilibrium, only the droplet can be kept from falling. Considering that the gas flow rate can carry the droplet, the coefficient of 1.2 should be multiplied again. In terms of droplet shape, Li et al. (2002) believed that ellipsoidal droplet under pressure difference was more reasonable. Based on mechanical results, Wang et al. (2016a) derived a ball-cap model of critical gas flow rate. In the context of liquid-droplet reversal models, while they are widely accepted for their straightforward predictions of liquid-loading onset, the absence of empirical evidence from experiments and gas wells hinders the verification of the relationship between droplet reversal and liquid loading. In a study conducted by Van’t Wenstende et al. (2007), annular/churn air-water upward flow experiments were conducted in a 50-mm pipe. The findings revealed that the measured droplet diameter significantly differed from the assumptions made in Turner’s model, and no instances of droplets flowing counter-currently with the gas flow were observed. Moreover, the empirical findings of Sawant et al. (2008) and Alamu (2012) provide evidence that the entrainment rate of droplets is significantly lower compared to that of the film during the transition of annular/churn flow. This discrepancy is particularly pronounced in inclined pipes, where droplets are unable to be conveyed over long distances (Wang et al., 2016b). Consequently, the concept of liquid-film reversal appears to offer a more plausible explanation for elucidating the onset of liquid-loading mechanism.
Therefore, many experimental and theoretical studies in recent years have identified liquid-film-reversal, the liquid in the wellbore flows upward in the form of the thin film, which is close to the pipe wall, and the direction of the liquid film flow is opposite to the direction of the gas flow, as the mechanism of liquid-loading onset. Through the multiphase flow experiments, Guner et al. (2015), Alsaadi et al. (2013), and Liu et al. (2022) observed the liquid-film-reversal and examined the impact of several factors under the critical gas flowrate, including inclination, liquid flow rate, pipe size, and others. To increase the model’s accuracy, Wang et al. (2021), Pagou et al. (2020) and Luo et al. (2020) used parameter optimization dependent on the Barnea, (1986). In recent years, based on the reversal of a non-uniform liquid film, Vieira et al. (2021) introduces a new model for predicting liquid loading onset. By using the principle of minimum energy. Wujie et al. (2021) developed a new model for calculating the gas-liquid distribution at critical conditions. Liu et al. (2018) established the elliptical distribution model of the liquid film of the inclined pipe, and the cross-sectional velocity distribution model is coupled to solve the cross-sectional flow rate integrally. Wang et al. (2022) presented a simplified model and a unified model to predict the critical gas velocities of film reversal based on the conservative momentum principle. Ejim. (2023) developed a methodology to estimate the superficial critical gas velocities for liquid loading, which is concentrated on the principle of momentum conservation for a deviated tubing.
As a whole, there are various methods for forecasting the lowest gas flowrate of continuous liquid removal in gas wells (Zhang et al., 2019). The conventional criterion of liquid-film reversal are all focused on the gas wells’ production timelines to assess if liquid accumulation is occurring. When the liquid film occurs, we assume that the liquid will be loaded at the wellbore. No mechanism and analysis are provided to prove liquid-film-reversal point will lead to liquid loaded immediately and no comparative studies of liquid-film reversal result with liquid-loading symptoms is presented in the previous studies. However, some studies (Wang et al., 2015; Pan et al., 2019) indicate the liquid-film reversal model is too conservative to forecast liquid loading in China. If we use this criterion to predict liquid loading, deliquification methods will be implemented too early. Actually, according to the observation in the experiment, the flow behavior of liquid film is still stable relatively when liquid film is just reversing. Therefore, this paper combines experimental wellbore observation with the features of wellbore flow, defines the new criterion of liquid loading in gas wells, and establishes a new model of critical gas flow rate of continuous liquid removal by conducting physical experiments.
2 Experimental setup
The experimental setup uses a visual plexiglass pipe to obverse the wellbore flow phenomenon. The pipeline measures 50 mm in diameter and 8 m in length. As seen in Figure 1, it may be swapped simultaneously at any angle between 0° and 90°. The entire experimental set-up may be broken down into a data collecting system, a liquid supply system, and a gas supply system. The liquid is supplied by the water pump, while the gas is supplied by the air compressor, kept in the gas tank, and safely transferred to the experimental tube section. In order to enhance comprehension of two-phase flow, the installation of two pressure sensors was undertaken. One sensor was positioned at the entrance of the pipe downstream, while the other was placed at the exit. Liquid holdup was determined by measuring the liquid volume with the aid of two quick-closing valves. Furthermore, the direction of liquid-film flow was documented using an high-speed camera. The measuring device transmits all of the test and measurement data to the paperless recorder, which is subsequently loaded into the computer for data sorting and analysis, and specification summary of measurement and control system components in Table 1. In addition, At the exit of the experimental device, a gas-liquid separator is also installed. The liquid is collected at the bottom of the separator for recycling, while the gas is vented into the air from the top of the separator.
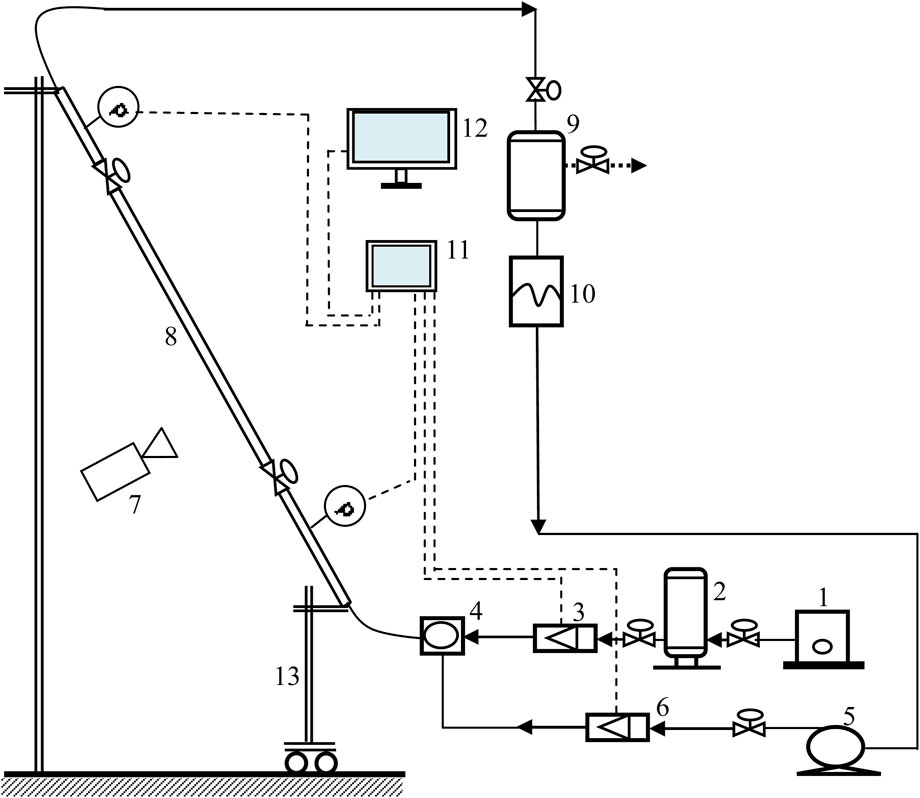
FIGURE 1. Two-phase flow experimental setup. 1-Air compressor; 2-Gas storage tank; 3-Gas flow meter; 4-gas-liquid mixer; 5-centrifugal pump; 6-turbine liquid flowmeter; 7-High-speed cameras; 8-Experimental observation section; 9-gas-liquid separator; 10-Water tank; 11-Paperless recorder; 12-Computer; 13-Sliding support frame.
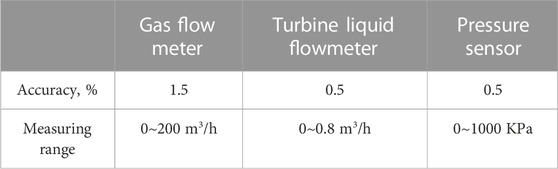
TABLE 1. Specification summary of measurement and control system components.
3 Analysis of criterion for continuous liquid removal
The accurate estimation of liquid-loading is the key to the stability analysis of gas wells (Luo et al., 2020). Liquid-loading models are mainly developed based on liquid-film-reversal. Therefore, this paper experimentally analyzes the effect of some key parameters on liquid-film-reversal.
3.1 Liquid-film-reversal in the pipe
The accurate measurement of the liquid-film-reversal gas flow rate in the experiment serves as the foundation for an accurate investigation of the factors affecting liquid-film-reversal. Therefore, dyeing agent is injected into the middle section of the experimental pipe to facilitate the observation of the experimental phenomenon of liquid-film-reversal, as can be seen in Figure 2. The gas velocity may be reliably estimated by comparing the gas-liquid flow behavior of liquid carrying and the color distribution near the injection site. When the test gas flow rate is greater than the liquid-film-reversal gas flow rate, the dyeing agent only appears downstream of the injection hole, as shown in the yellow dotted box in the Figure 2A. With the decrease of the test gas flow rate, when the dyeing agent appears upstream of the liquid injection hole, the corresponding maximum superficial gas flow rate is the liquid-film-reversal gas flow rate.
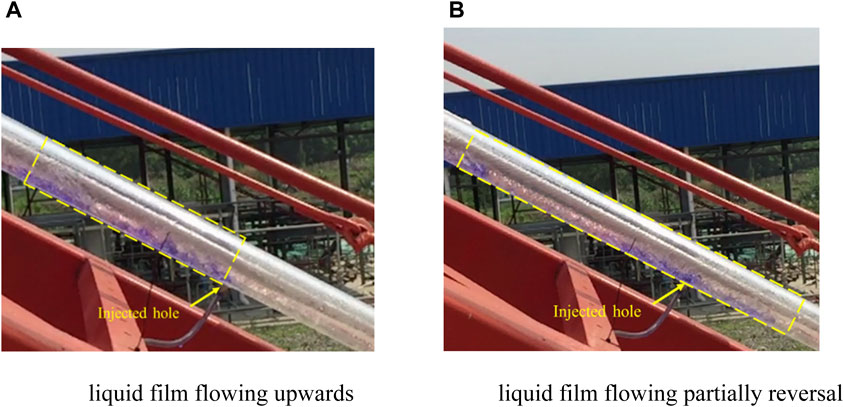
FIGURE 2. Comparison of liquid film before and after reversal. (A) liquid film flowing upwards (B) liquid film flowing partially reversal.
Figure 3A depicts the connection among the liquid-film-reversal gas flow rate and the liquid flow rate in a vertical pipe with varying pipe diameters. As the liquid velocity increases, the width the liquid adhering to the wall of the tube grows, which results in an increase in gas velocity to maintain the liquid upward flow without reversing. It is also possible to deduce that the liquid-film-reversal velocity is roughly linear with the superficial liquid velocity.
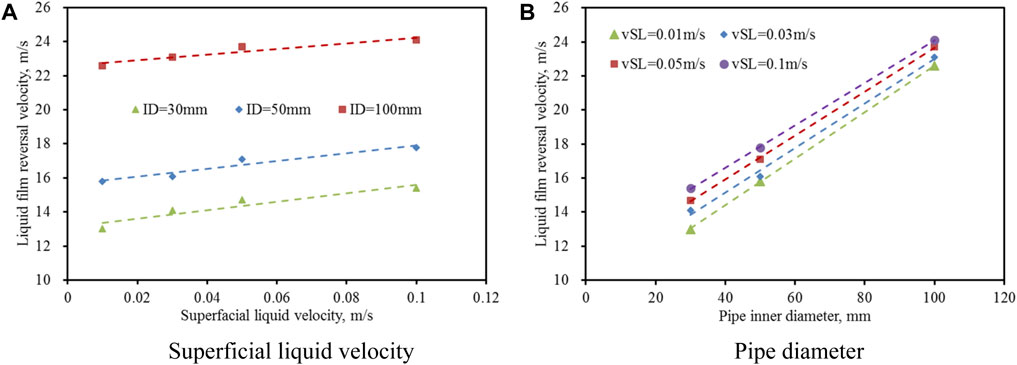
FIGURE 3. Film-reversal velocity variation with superficial liquid velocity and pipe inner diameter (θ=90°). (A) Superficial liquid velocity (B) Pipe diameter.
Similarly, Figure 3B shows that larger the pipe size, the higher the liquid-film-reversal velocity. Pipe diameter is inversely proportional to interfacial shear stress, based on Wallis’s interfacial shear stress equation (Wallis., 1969). The greater the pipe diameter, the less the interfacial shear stress act on the liquid layer. Under the same thickness, the wider the pipe diameter, the greater the liquid-film-reversal velocity.
Figure 4 depicts the measured gas flow rate varies with inclined angle and liquid flow rate. As the inclined angle increases, the measured gas flow rate increases first and then decreases, and the liquid carrying critical gas flow rate reaches maximum when the inclined angle is around 55°, which is in line with the direction in which the Belfroid-proposed angle adjustment item has changed (Belfroid et al., 2008). Based on the critical gas velocity found on the vertical pipe, the liquid-film-reversal gas velocity at various angles was calculated using the Belfroid angle adjustment item, and the comparison with the experimental result is displayed in Figure 4. It can be concluded that the Belfroid angle correction term may be utilized to compute the critical velocity in various angles when the critical gas flow rate in vertical pipe is an input parameter.
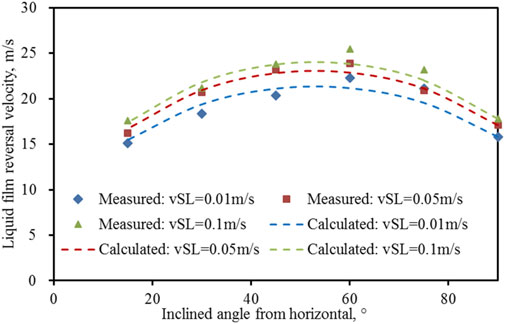
FIGURE 4. Film-reversal gas velocity variation with inclined angle.
3.2 Comparison of liquid-film-reversal and liquid-loading symptoms
Although liquid-film-reversal is designated as liquid-loading onset, we will compare the features of liquid-film-reversal with the liquid-loading symptoms. When liquid-loading occurs in gas wells, some symptoms can be observed, such as pressure gradient inflection point in the wellbore, unstable gas well production and rapid decrease in tubinghead pressure, appearance of liquid slug at the wellhead, and fluctuations of pressure.
The liquid will gather up in the wellbore while liquid loading takes place, when the liquid affixed to the pipeline inwall is inverted, the liquid will not accumulate. As the vSG is 12.8 m/s and the vSL is 0.01 m/s, Figure 5 demonstrates that the liquid affixed to the pipeline inwall has reversed. The liquid adhered to pipe sidewall is now plainly observed to be falling downhill at this condition. However, the liquid attached to the pipe wall does not always fall back to the bottom of the wellbore, but is constantly subjected to the upward “resistance” of the gas core during the falling down process and gradually becomes thicker, which will cause the gas core area to gradually be less. When the liquid accumulates enough, the gas will accumulate a lot of energy to push through the liquid, thus carrying the liquid upward in a large liquid wave. When the liquid wave flows rapidly upward, the part close to the tube wall gradually falls downward, so repeated cycle, resulting in a certain wave feature, which is also the main form of carrying liquid upward. However, this localized accumulation of liquid is mainly reflected in a slight thickening of the liquid film, which does not result in the formation of a liquid plug to block the wellbore, and the gas remains in a continuous phase, and then this does not result in liquid collection at the bottom. As a result, the pressure gradient is mainly due to gravity gradient and friction gradient (ignoring acceleration gradient), the experimental results of pressure gradient inflection point was not shown when the liquid attached to the pipe wall was reversed.
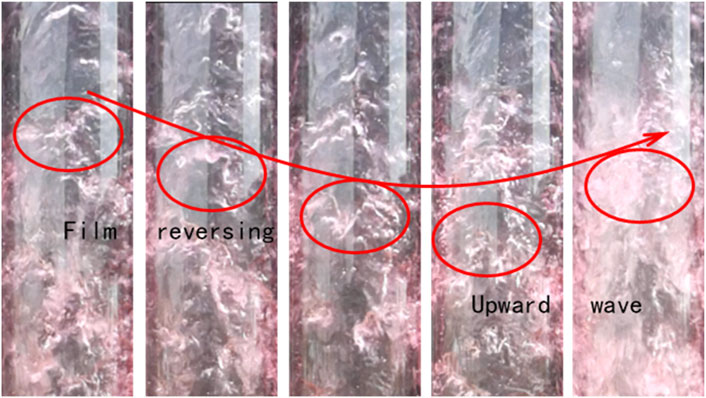
FIGURE 5. Snapshot when liquid-film-reversal.
Another crucial aspect of liquid-loading is that gas production varies, the amount of gas produced decline rate increases noticeably, and the tube pressure rapidly declines. During the experiment, it is found that the wellbore pressure remains steadily when the liquid affixed to the pipeline inwall is reversed, and the gas production and tubing pressure will not be greatly changed even if the gas volume is greatly changed due to the low liquid holdup. Therefore, when liquid-loading arises, the liquid-film-reversal criteria is inconsistent with the features of gas well unstable, rising decline rate, and falling tubing pressure.
Figure 6 depicts the change curve of liquid holdup when vSG is 0.01 m/s and pipe diameter is 50 mm. When the liquid affixed to the pipeline inwall is reversed, the wellbore liquid holdup is in a very low region (5%), and the change rate with the change of superficial gas velocity is quite minor. From another perspective, the liquid holdup slightly changed in the continuous upward region of the liquid attached to the pipeline inwall; even if the gas flow rate changes dramatically, it is difficult to create a significant change in liquid holdup. In the case of fast changes in liquid holdup, a little change in gas flow rate has a large influence on the wellbore liquid holdup. Coupled with the volatility of wellbore flow after liquid-film-reversal, the gas well becomes relatively unstable.
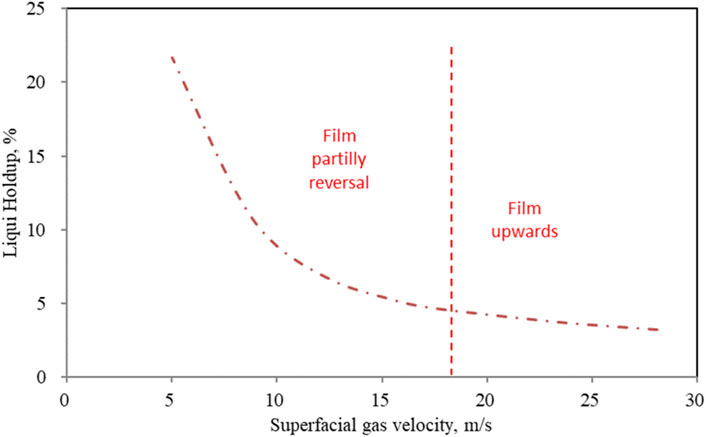
FIGURE 6. Liquid holdup curve (ID=50mm; vSL=0.01 m/s).
Slug flow is another sign of liquid-loading since it occurs in the wellbore. When it happens, it can cause large transient pressure fluctuations in the wellbore. Figure 7 shows the influence of flow pattern on transient tubinghead pressure. According to the description of Lea et al. (3) and based on the transient pressure recording, it is evident that when the flow pattern is slug flow, there will be obvious pressure fluctuation. This is so that the orifice plate’s pressure does not peak when the liquid flows through it as a liquid plug, which would otherwise happen owing to the liquid phase’s high density.
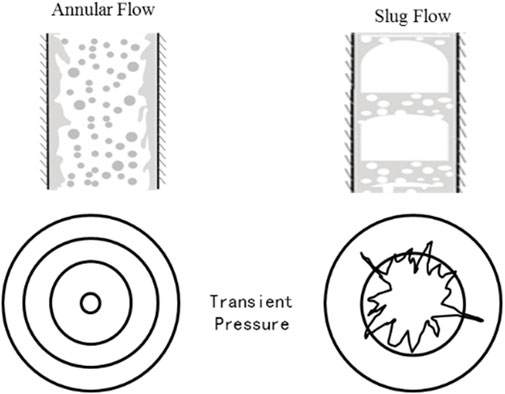
FIGURE 7. The effect of flow pattern on tubinghead pressure.
Figure 7 intuitively shows the flow state and characteristics of gas and liquid before and after a gas well, there is still problem with this theory: assuming that liquid-film-reversal is the beginning of liquid deposition, liquid accumulation will follow liquid-film-reversal in the wellbore and will be followed by liquid slug and orifice pressure variation in the gas well. It is clear from the widely used Taitel flow pattern map that there exists a transition boundary between churn flow and plug flow, and that the flow pattern corresponding to the liquid plug is plug flow. Slug flow has a corresponding gas velocity that is substantially lower than that of churn flow, and the liquid-film-reversal is typically utilized for the border between annular flow and churn flow, between the two boundary lines is the churn flow. Therefore, the churn flow between fog flow and slug flow has a broad spectrum of gas velocity, and is widely found in low-producing gas wells, there is no clear basis to use these two flow patterns as the characteristics of liquid accumulation.
To sum up, the liquid-film-reversal criterion is incompatible to some changing features of liquid-loading: when the liquid-film-reversal occurs, the gas liquid flow in the wellbore is comparatively stable, and it is very different from the pressure and production fluctuation shown when gas well fluid accumulation occurs. It is no question that liquid-film-reversal causes a rise in wellbore holdup and an increase in the instability of the flow. The assessment of gas well accumulation and the use of drainage and gas production procedures, however, lack direction because liquid-film-reversal is too conservative to foresee the beginning of liquid-loading in gas wells.
3.3 A new criterion for continuous liquid removal
Since liquid-film-reversal is too conservative, it is necessary to find a more reasonable criterion to judge whether it can remove liquid continuously. Therefore, we conducted more experimental tests at different gas velocities.
Figure 8 depicts gas liquid two-phase flow snapshot when vSL is 0.03 m/s and vSG is 16\12\8\6 m/s respectively. As the rate of slip of the liquid affixed to the pipeline inwall accelerates from the experimental phenomena of wellbore flow, the liquid holdup grows, and the oscillation becomes more visible. When the vSG is 16 m/s, annular flow occurs in the pipe, and the liquid affixed to the pipeline inwall is equally spread along the pipe wall. In general, the flow is particularly steady, the liquid affixed to the pipeline inwall primarily flows upward in the form of laminar flow. Despite the liquid-film-reversed when vSG dropped to 12 m/s, it was found that the liquid attached to the pipe wall flow was still mostly regular with very minor oscillations and that the liquid holdup remained at a low level and only little varied. Therefore, the conclusion may be drawn even if there is a significant variation in the gas flow rate before and after the liquid-film-reversal. Approximately half of the liquid-film-reversal occurs when the vSG falls to 8 m/s. When the vSG decreases to 8 m/s, which is approximately half of the liquid-film-reversal, the huge waves appears fluctuates up and down, the liquid film close to the wall of the tube slips severely, and during the slipping process, the local liquid holdup increases under the influence of gas drag force. The obvious liquid slug can bridge the pipe and there is no continuous gas core. Further decrease in superficial gas velocity will make oscillation larger. At the moment when the liquid sslug is formed, it hinders the normal flow of gas, and when the pressure rises, the gas breaks through the liquid slug and flows to the wellhead. More turbulent vortices are formed between the gas and liquid, and the wellbore flow becomes more unstable.
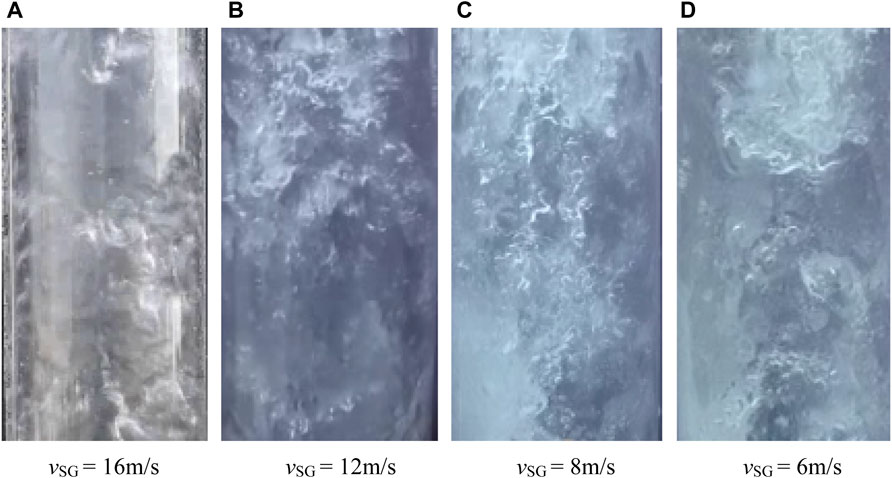
FIGURE 8. Snapshot at different superficial gas velocities (vSL=0.03 m/s). (A) vSG = 16 m/s (B) vSG = 12 m/s (C) vSG = 8 m/s (D) vSG = 6 m/s.
Wellbore pressure fluctuations are closely related to stable gas well production. Figure 9 shows pressure fluctuations at different superficial gas velocities, the standard deviation was chosen to characterize the fluctuations in wellbore pressure drop. As the superficial gas flow rate is 16 m/s, the wellbore pressure changes smoothly with time and fluctuates very little, with a standard deviation of 0.028. When the superficial gas flow rate decreases to 12 m/s, the pressure begins to fluctuate up and down slightly and the standard deviation increases to 0.043. In particular, Figure 10 shows schematic diagram of liquid film flowing at low superficial gas velocity, the wellbore pressure fluctuations increase rapidly when the apparent gas flow rate is reduced to 8 m/s, with a standard deviation of 0.12. It was verified that when bridging of fluids occurs, the pressure rises and subsequently the fluid plug is carried by the gas and the wellbore pressure drops. Under these conditions, the gas drag force is difficult to fully carry the liquid plug completely upward, and some of the continued liquid slips. Longer bridging fluid plugs form at a superficial gas flow rate of vSG=6 m/s, resulting in a greater increase in wellbore pressure with a standard deviation of 0.41. Further, it can be shown that after liquid film reversal, the wellbore pressure fluctuation is little so that the gas well can still be produced stably.
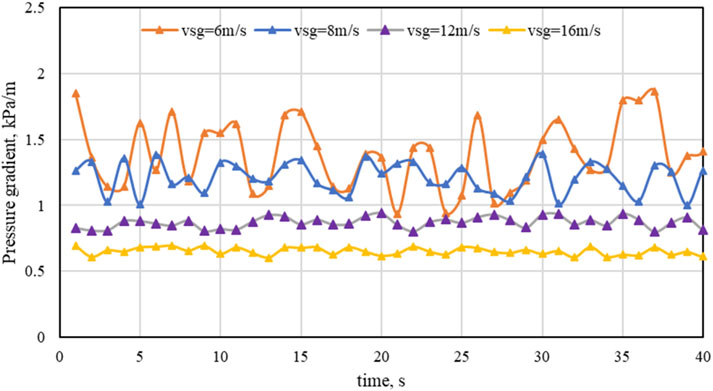
FIGURE 9. Pressure fluctuations at different superficial gas velocitiesAt this time, it means that the liquid carrying ability of the gas phase correlates to the liquid falling capacity, and that further lowering the gas flow rate will result in a stronger liquid attached to the pipe wall falling capacity. This will make the wellbore fluctuation and liquid holdup more susceptible to the influence of the gas flow rate, causing wellbore accumulation. It is obvious that the gas flow rate linked with the reversal of half the liquid layer may better describe the characteristics of liquid-loading. Therefore, we define it as the minimal gas velocity need for continuous liquid removal. Liquid-film-reversal is a reliable signal even if it anticipates liquid-loading in gas wells before it really happens. We refer to the liquid-film-reversal as a liquid-loading warning sign.
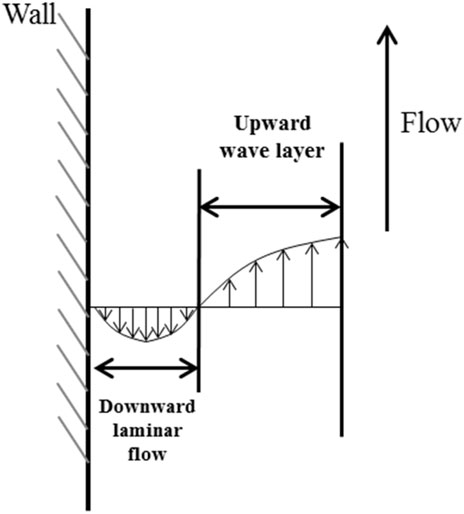
FIGURE 10. Schematic diagram of liquid film flowing at low superficial gas velocity.
4 New model for continuous liquid removal
The essential theories in liquid flooding and liquid convection are applied for modeling in order to build an accessible and complete empirical model to forecast the flow rate of liquid-film-reversal gas. Countercurrent points are used to demonstrate the shift from co-current flow to counter-current flow in vertical pipes. When this happens, a portion of the liquid begins to flow downhill, enhancing the ripple. The transition between annular and churn flow is commonly considered as the gas flow rate accompanying liquid-film-reversal. Wallis provided a straightforward empirical model in 1969, which is written as follows:
Where m and C are constants, dimensionless;
Where vSG is the superficial gas velocity, m/s; vSL is the superficial liquid velocity, m/s; g is the gravitational acceleration, m/s2; ρL is the liquid density, kg/m3; D is the pipe diameter, m; ρG is the gas density, kg/m3; Normally, the influence of liquid flow rate on liquid-film-reversal is typically neglected. Therefore, Eq. 1 can be adapted:
The findings of the preceding experimental tests reveal that the liquid-film-reversal gas flow rate is essentially linear with the superficial liquid flow velocity. The liquid term can be added to Eq. 2 to increase the influence of the liquid flow rate on liquid-loading:
According to the vertical section, the gas velocity at different angles may be calculated using the Belfroid angle correction item, so the calculation model of liquid-film-reversal gas velocity of horizontal wells can be presented as:
where
Combined with the experimental data, we can fit the parameters in Eq. 4, and the warning criterion of liquid-loading in horizontal gas wells is obtained as follows:
The minimum gas velocity for continuous liquid removal, i.e., the critical gas velocity is obtained as follows:
5 Model evaluation
In order to evaluate the performance of the new model, we validate our new model against some field production data from 14 gas wells and the Coleman et al. (1991) dataset.
We collected field production data from 14 gas wells, which the production dynamics of a typical well is shown in Figure 11, the corresponding pressure fluctuations are shown in Figure 12. As the early stage of gas well production, the production rate of the X gas well can peak at 3.5 × 10⁴ m3/d, which corresponds to the high wellhead pressure at the same time. With continued production, the production of gas and wellhead pressure declined fast. The differential between the wellhead pressure and the casing pressure was steadily raised, and liquid output dropped precipitously, down to 0 m3/d. Subsequently, the deliquification technologies was adopted to increase the liquid production and alleviate the liquid accumulation situation. Therefore, the critical production of the gas well is 2.2 × 10⁴ m3/d, which corresponds to wellhead pressure of 1.8 MPa.
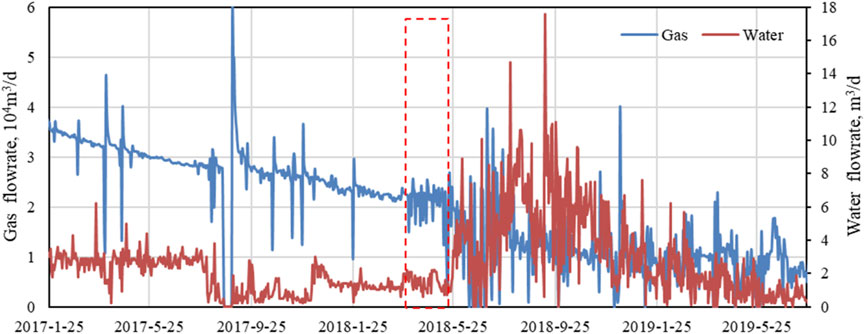
FIGURE 11. The production curve of X well.
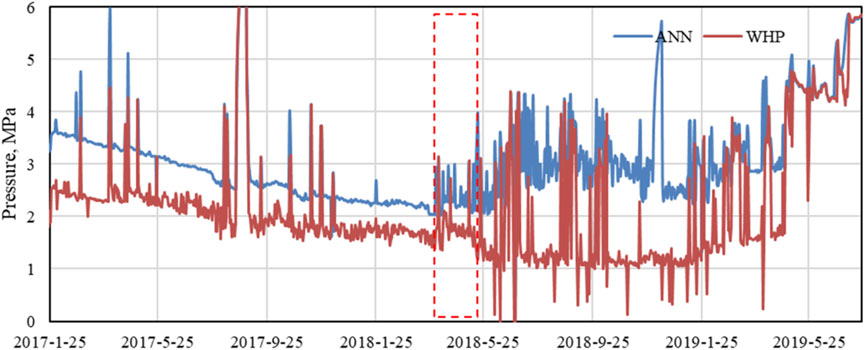
FIGURE 12. X well pressure variation curve.
As shown in Figure 13, the new model was used to calculate the critical gas flowrate. With the increase of depth, it can be seen that the critical gas flowrate will increase and reaches maximum at the vertical depth of 2400 m and then decrease dramatically. This is because inclined angle is about 55 at 2400 m and the inclined angle decreases rapidly. According to Eq. 6, we can expect the critical gas flowrate will decrease quickly. Since we don’t have intensive data of well bore configuration, leading to the existence of a turning point. Due to the borehole track characteristics of the gas well can be categorized as a directional well, the inclined section of the critical gas production is larger than the vertical section. It was found that the actual gas production from the well was only 2.2 × 10⁴ m3/d, which was less than the critical production, causing production to take place with liquid-loading.
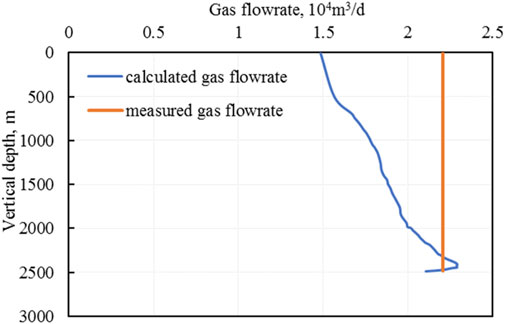
FIGURE 13. Calculated the critical gas production of the wellbore.
Furthermore, 14 gas wells were utilized to calculate liquid-loading based on the change in the differential between wellhead pressure and casing pressure as well as the condition of wellbore pressure measurement data. Table 2 shows the accuracy of the new model employed for fluid accumulation prediction. The model calculation results demonstrate that the calculated value of wells X4 and X13 is small, while the other wells are successfully anticipated. The new model has a prediction accuracy of 85.7%, which is significantly greater than Turner’s model’s accuracy of 42.9%.
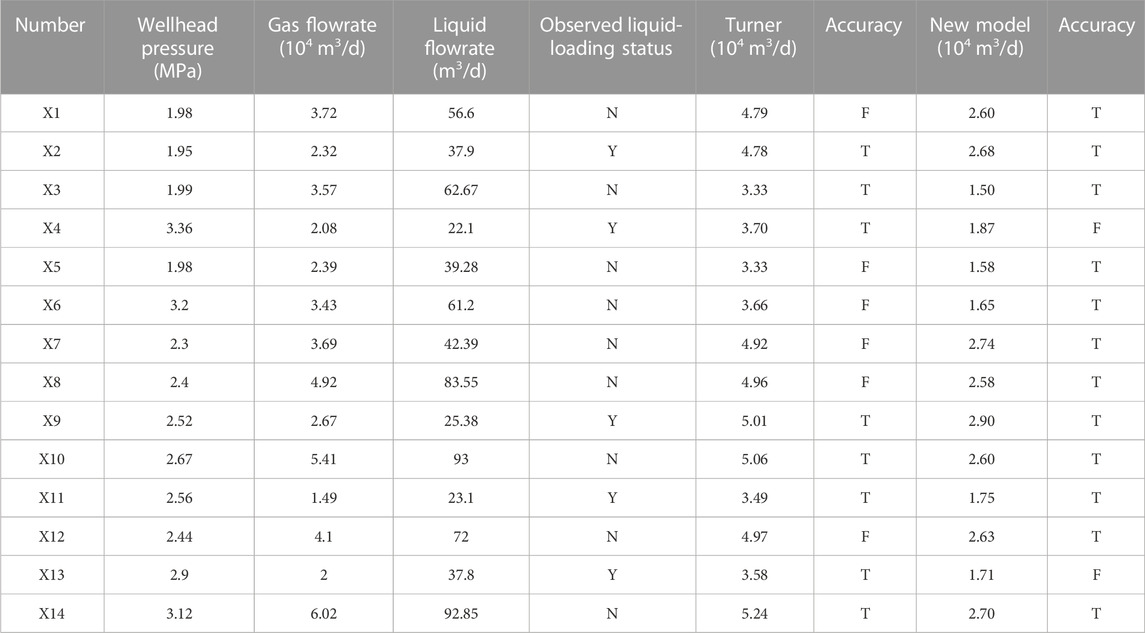
TABLE 2. Prediction results of liquid-loading gas wells.
Another dataset provided by Coleman et al. (1991) comprises 34 gas wells, all of which are liquid-loaded. The study examines two liquid-loading criteria for identifying the onset of liquid-loading. Initially, some wells were conducted to ascertain the critical flow rate by gradually reducing the wellhead pressure. Additionally, the critical flow rates in the remaining wells were determined through analysis of historical production data. Consequently, the recorded gas flow rate for these wells is expected to closely approximate the critical gas flow rate. Figure 14 presents a comparison between the predicted outcomes of the proposed model at the bottomhole conditions. We can see liquid film reversal is too conservative as we analyzed. Notably, the proposed model exhibits the lowest prediction and is in closest proximity to the 45° line. Hence, it can be inferred that the proposed model attains the most favorable performance.
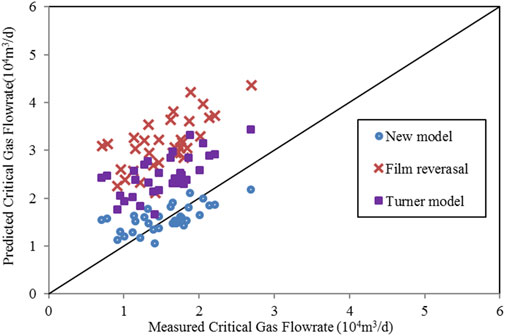
FIGURE 14. Model validation against the Coleman et al. dataset.
Although our new model achieves higher accuracy than other models, deviation still exist. Some reasons can account for it. Firstly, in the experimental observation, although the gas flow rate linked with the reversal of half the liquid layer may better describe the characteristics of liquid-loading, we can’t measure directly. Furthermore, the new model is an empirical model, which is modified from experimental results based on liquid-film reversal criterion. Its stability still need more verify and validation.
Therefore, a more comprehensive mechanistic model is still required to be developed to capture the characteristics of liquid-loading. Furthermore, it is worth noting that in some gas reservoirs characterized by high PI, liquid-loading symptoms are still evident in gas wells at or slightly below the gas flow rate associated with liquid-film reversal. This occurrence can be attributed to the reservoir’s inability to effectively transport both gas and liquid to the surface. Consequently, the implementation of a nodal analysis system is employed in these gas wells to forecast the instabilities of gas wells.
6 Conclusion
(1) The results of comparative analysis show that it is difficult to observe the phenomenon consistent with the characteristics of the commonly used method of judging gas well liquid accumulation in the liquid-film-reversal experiment, and the existing limits are difficult to explain gas well fluid accumulation completely and reasonably.
(2) The wellbore flow remains stable when the liquid attached to the pipe wall is reversed, but there is a corresponding relationship between the critical liquid-carrying gas flow rate and the liquid-film-reversal gas flow rate, which is about 0.5 times of the liquid-film-reversal gas flow rate.
(3) A new model for prediction of critical liquid-carrying gas flow rate is established from experimental results based on liquid-film reversal criterion. The model’s accuracy was found to be as high as 85.7% by looking at 14 gas wells and perform better than other models in the Coleman dataset, which can theoretically enable the prediction of liquid-loading in gas wells.
(4) It is suggested to conduct more visual experiments of gas-liquid two-phase flow with liquid flow rate in the future, and fit empirical models based on a large number of experimental data to improve the corresponding relationship between liquid-film-reversal and gas flow rate of gas well accumulation. A more comprehensive mechanistic model is also expected to be developed to capture the characteristics of liquid-loading.
Data availability statement
The original contributions presented in the study are included in the article/Supplementary Material, further inquiries can be directed to the corresponding author.
Author contributions
JL: Conceptualization, Data curation, Methodology, Supervision, Writing–review and editing. SX: Conceptualization, Data curation, Methodology, Supervision, Writing–original draft. YL: Formal Analysis, Project administration, Validation, Writing–review and editing.
Funding
The author(s) declare that no financial support was received for the research, authorship, and/or publication of this article.
Acknowledgments
The authors like to express appreciation to the support given by the Scientific Research and Technological Development Program of China National Petroleum Corporation (2021DJ2006: Research on Key Technologies for Exploration and Development of Land and Sea Transitional Shale Gas).
Conflict of interest
Authors JL, SX, and YL were employed by PetroChina Coalbed Methane Company Limited Engineering Technology Research Institute. Authors JL, SX, and YL were employed by China United Coal-bed Methane National Engineering Research Center Company Limited.
Publisher’s note
All claims expressed in this article are solely those of the authors and do not necessarily represent those of their affiliated organizations, or those of the publisher, the editors and the reviewers. Any product that may be evaluated in this article, or claim that may be made by its manufacturer, is not guaranteed or endorsed by the publisher.
References
Alamu, M. B. (2012). Gas-well liquid loading probed with advanced instrumentation [J]. SPE J., 17(1): 251–270. doi:10.2118/153724-pa
Alsaadi, Y., Pereyra, E., Torres, C., and Sarica, C. (2013). Liquid-loading of highly deviated gas wells from 60° to 88°. SPE Annual Technical Conference and Exhibition, Houston, Texas, USA, 28-30 September.IEEE.
Barnea, D. (1986). Transition from annular flow and from dispersed bubble flow-unified models for the whole range of pipe inclinations. Int. J. Multiph. Flow 12, 733–744. doi:10.1016/0301-9322(86)90048-0
Belfroid, S., Schiferli, W., Alberts, G., et al. (2008). “Predicting onset and dynamic behavior of liquid-loading gas wells,” in SPE Annual Technical Conference and Exhibition, Colorado, USA, 21–24 September 2008 (Denver).
Chai, M., Chen, Z., Nourozieh, H., and Yang, M. (2023). Numerical simulation of large-scale seasonal hydrogen storage in an anticline aquifer: a case study capturing hydrogen interactions and cushion gas injection. Appl. Energy 334, 120655. doi:10.1016/j.apenergy.2023.120655
Chai, M., Yang, M., and Chen, Z. (2022). Analytical and numerical study of thermal and solvent-based gravity drainage for heavy oil recovery. J. Petroleum Sci. Eng. 208, 109214. doi:10.1016/j.petrol.2021.109214
Coleman, S. B., Clay, H. B., Mccurdy, D. G., and Norris, L. H. (1991). A new look at predicting gas-well load-up. J. Petroleum Technol. 43 (3), 329–333. doi:10.2118/20280-pa
Ejim, C. (2023). Establishing critical gas velocities for liquid loading in deviated gas wells. Paper presented at the Middle East oil, gas and geosciences show. Manama, Bahrain. doi:10.2118/213620-MS
Guner, M., Pereyra, E., and Sarica, C. (2015). Liquid-loading of gas wells with deviations from 0° to 45°. SPE production and operation symposium. Oklahoma City, Oklahoma, USA: Springer, 1–5.
Guo, B., Ghalambor, A., and Xu, C. (2006). A systematic approach to predicting liquid-loading in gas wells. SPE Prod. Operations 21 (1), 81–88. doi:10.2118/94081-pa
Lea, J. F., Nickens, H. V., and Wells, M. R. (2008). Gas well deliquification. USA: Gulf Professional Publishing.
Li, M., Li, S. L., and Sun, L. T. (2002). New view on continuous-removal liquids from gas wells. SPE Prod. Facil. 43, 42–46. doi:10.2118/75455-pa
Liu, J., Jiang, L., Ye, C., Cai, D., Li, J., Liu, Z., et al. (2022). A new calculation model of critical liquid-carrying velocity in inclined wells based on the principle of liquid film delamination slippage. J. Petroleum Sci. Eng. 216, 110808. doi:10.1016/j.petrol.2022.110808
Liu, Y. H., Luo, C. C., Zhang, L. H., Liu, Z. B., Xie, C. Y., and Wu, P. B. (2018). Experimental and modeling studies on the prediction of liquid-loading onset in gas wells. J. Nat. Gas Sci. Eng. 57, 349–358. doi:10.1016/j.jngse.2018.07.023
Luo, C., Cao, Y., Liu, Y., Zhong, S., Zhao, S., Liu, Z., et al. (2022). Experimental and modeling investigation on gas-liquid two-phase flow in horizontal gas wells. J. Energy Resour. Technol. 145, 1–13. doi:10.1115/1.4055223
Luo, C., Gao, L., Liu, Y., Xie, C., Ye, C., Yang, J., et al. (2023). A modified model to predict liquid-loading in horizontal gas wells. J. Energy Resour. Technol. 145 (8). doi:10.1115/1.4062504
Luo, C., Zhang, L., Liu, Y., Zhao, Y., Xie, C., Wang, L., et al. (2020). An improved model to predict liquid holdup in vertical gas wells. J. Petroleum Sci. Eng. 184, 106491. doi:10.1016/j.petrol.2019.106491
Pagou, A. L., Wu, X., Zhu, Z., and Peng, L. (2020). Liquid film model for prediction and identification of liquid loading in vertical and inclined gas wells. J. Petroleum Sci. Eng. 188, 106896. doi:10.1016/j.petrol.2019.106896
Pan, J., Wang, W., Wang, L., Zhang, Li, Chen, J., and Pu, X. (2019). Prediction model of continuous liquid carrying in gas wells considering droplet entrainment. Acta Pet. Sin. 40 (3), 332–336. doi:10.7623/syxb201903007
Sawant, P., Ishii, M., and Mori, M. (2008). Droplet entrainment correlation in vertical upward Co-current annular two-phase flow [J]. Nucl. Eng. Des., 238(6): 1342–1352. doi:10.1016/j.nucengdes.2007.10.005
Turner, R. G., Hubbard, M. G., and Dukler, A. E. (1696). Analysis and prediction of minimum flow rate for the continuous removal of liquids from gas wells. J. Petroleum Technol. 21 (11), 1475–1482. doi:10.2118/2198-pa
Van’t Westende, J. M. C., Kemp, H. K., Belt, R. J., Portela, L., Mudde, R., and Oliemans, R. (2007). On the role of droplets in cocurrent annular and churn-annular pipe flow. Int. J. Multiph. flow 33 (6), 595–615. doi:10.1016/j.ijmultiphaseflow.2006.12.006
Vieira, C., Stanko, M., and Oplt, T. (2021). An improved model for predicting liquid loading onset in inclined pipes with non-uniform liquid wall films. J. Nat. Gas Sci. Eng. 91, 103902. doi:10.1016/j.jngse.2021.103902
Wang, L. S., Liu, S., Hou, L. T., Yang, M., Zhang, J., and Xu, J. Y. (2022). Prediction of the liquid film reversal of annular flow in vertical and inclined pipes. Int. J. Multiph. Flow 146, 103853. doi:10.1016/j.ijmultiphaseflow.2021.103853
Wang, W. J., Cui, G. M., Wei, Y. Q., and Pan, J. (2021). A new model for predicting the critical liquid-carrying velocity in inclined gas wells. Petroleum Explor. Dev. 48 (05), 1218–1226. doi:10.1016/s1876-3804(21)60104-0
Wang, Z., Bai, H., Zhu, S., Zhong, H., and Li, Y. (2015). An entrained-droplet model for prediction of minimum flow rate for the continuous removal of liquids from gas wells. SPE J. 20 (05), 1135–1144. doi:10.2118/174077-pa
Wang, Z., Guo, L., Wu, W., Zhu, S., and Zhou, H. Experimental study on the critical gas velocity of liquid-loading onset in an inclined coiled tube[J]. J. Nat. Gas Sci. Eng., 2016a, 34: 22–33. doi:10.1016/j.jngse.2016.06.044
Wang, Z. B., Guo, L. J., Zhu, S. Y., and Nydal, O. J. (2016b). Prediction of the critical gas velocity of liquid unloading in horizontal gas wells. SPE J., 1135–1144. doi:10.2118/189439-PA
Wujie, W. A. N. G., Guomin, C. U. I., Yaoqi, W. E. I., and Jie, P. A. N. (2021). A new model for predicting the critical liquid-carrying velocity in inclined gas wells. Petroleum Explor. Dev. 48 (5), 1218–1226. doi:10.1016/s1876-3804(21)60104-0
Yuan, G., Pereyra, E., Sarica, C., and Sutton, R. P. (2013). An experimental study of liquid-loading of vertical and deviated gas wells. J. Petroleum Technol. 65 (11), 158–161. doi:10.2118/1113-0158-jpt
Zhang, L., Luo, C., Liu, Y., Zhao, Y., Xie, C., and Xie, C. (2021). A simple and robust model for prediction of liquid-loading onset in gas wells. Int. J. Oil, Gas Coal Technol. 26 (3), 245–262. doi:10.1504/ijogct.2021.113136
Keywords: continuous liquid loading, liquid film reversal, new criterion, liquid slug, model accuracy
Citation: Lin J, Xu S and Liu Y (2023) Experimental and modeling studies on continuous liquid removal in horizontal gas wells. Front. Earth Sci. 11:1288208. doi: 10.3389/feart.2023.1288208
Received: 04 September 2023; Accepted: 20 November 2023;
Published: 28 December 2023.
Edited by:
Jinze Xu, University of Calgary, CanadaReviewed by:
Maojie Chai, University of Calgary, CanadaGuanzheng Qu, Xi’an Shiyou University, China
He Yanfeng, Changzhou University, China
Copyright © 2023 Lin, Xu and Liu. This is an open-access article distributed under the terms of the Creative Commons Attribution License (CC BY). The use, distribution or reproduction in other forums is permitted, provided the original author(s) and the copyright owner(s) are credited and that the original publication in this journal is cited, in accordance with accepted academic practice. No use, distribution or reproduction is permitted which does not comply with these terms.
*Correspondence: Jingde Lin, bGpkc2VsZkAxMjYuY29t