 Sihan Qiang1
 Fengnian Wang
94% of researchers rate our articles as excellent or good
Learn more about the work of our research integrity team to safeguard the quality of each article we publish.
Find out more
ORIGINAL RESEARCH article
Front. Earth Sci., 28 December 2023
Sec. Geoinformatics
Volume 11 - 2023 | https://doi.org/10.3389/feart.2023.1287151
This article is part of the Research TopicCoal and Rock Dynamic Disasters: Advances of Physical and Numerical Simulation in Monitoring, Early Warning, and Prevention, volume IIView all 29 articles
The stability of the tunnel face is the key problem in shield tunnel construction. This paper focuses on the face stability of a shallow tunnel in sand. Numerical simulation and theoretical analysis are combined to study the limit support pressure and failure zone. Firstly, numerical simulation is employed to study the collapse of the tunnel face, obtaining the limit support pressure and collapse zone. A new failure model suitable for shallow tunnels is constructed based on these numerical simulations. Then, an analytic solution for the limit support pressure is derived using limit analysis upper bound theory. The accuracy and applicability of this proposed model are verified by comparing it with numerical results and classical analytical models. Through this research, it is found that the proposed model provides a more accurate description of situations where soil arches cannot be formed for shallow tunnels in sand, leading to higher accuracy in calculating the limit support pressure. The influence of various factors on stability of the tunnel face is analyzed, revealing mechanisms of tunnel face collapse.
Recently, tunnels have been constructed mainly using the shield method. During shield construction, tunnel face is usually stabilized by controlling the pressure in soil or slurry chamber. The stability of the tunnel face is typically ensured by controlling the pressure in the soil chamber or slurry chamber during shield tunneling (Chen et al., 2018; Wang et al., 2021a). Insufficient support pressure can easily lead to collapse of the excavation face, resulting in significant economic losses. Therefore, determining the values of soil chamber pressure and slurry chamber pressure is crucial for the control of shield tunneling (Liao et al., 2009). Currently, many researchers have employed a combination of model test, numerical simulations, and theoretical analysis to study the limit support pressure (σT) of collapse, the minimum support pressure to maintain stability of excavation face.
Researchers have conducted various physical experiments to study σT and the failure zone shapes (Kirsch, 2010; Messerli et al., 2010; Chen et al., 2013; Wang et al., 2021b). Some researchers have also conducted centrifuge model tests to study collapse mechanism of tunnel face, yielding significant research outcomes (Atkinson et al., 1977; Chambon and Corte, 1994; Meguid et al., 2008; Idinger et al., 2011; Li et al., 2023). Physical model tests not only provide validation for numerical simulation results but also establish a solid foundation for theoretical models. Numerical simulation, due to their advantages of low cost, high efficiency, and repeatability, are often used as a complement to model experiments and are widely applied in tunnel engineering. Currently, the main numerical models used are the continuum models (Senent et al., 2013; Li et al., 2019; Li et al., 2020; Liu H. et al., 2023) and the discrete element models. The discrete element method has also been extensively employed to investigate tunnel face instability (Funatsu et al., 2008; Chen et al., 2011; Zhang et al., 2011; Liu and Li, 2023), since its capability to handle mechanics problems involving discontinuous materials. Scholars have made significant achievements in various aspects, including the calculation of σT and definition of collapse zone.
Theoretical analysis is an essential approach to obtain the σT of excavation face, and scholars have been devoted themselves to proposing theoretical solutions for calculating the σT. Currently, there are two main methods. The limit equilibrium method assumes a failure mode and solves the σT based on the equilibrium conditions of forces. Scholars have proposed different failure models and obtained σT for different soil layers (Horn, 1961; Murayama et al., 1966; Anagnostou and Kovári, 1994; Arthur et al., 1994; Yu et al., 2020; Zhang et al., 2020; Liu S. et al., 2023; Zhang et al., 2023). The limit analysis method mainly acquire the limit support pressure from an energy perspective. (Leca and Dormieux, 1990) proposed failure mechanisms consisting of a single truncated cone or double truncated cones and derived the theoretical solutions of σT based on the limit analysis upper bound theory. Based on the model proposed by (Leca and Dormieux, 1990; Soubra et al., 2008) proposed a 3D failure model with multiple truncated cones and found that increasing the number of truncated cones beyond five had little effect on computational accuracy. This failure model has been widely cited by scholars. (Mollon et al., 2011b) using a logarithmic spiral model and spatial discretization technique, established a new 2D failure model that further improved the calculation accuracy. In addition, (Mollon et al., 2011a) proposed a 3D horn-shaped collapse model based on a multi-block model and spatial discretization technique, which overcame non-overlap of the multi-truncated cones model at excavation face and further improves the accuracy of the model.
Based on model tests and numerical simulations, researchers have abstracted failure models of excavation face instability during shield tunneling and derived analytical solutions for the σT. However, there are still some unresolved issues that deserve attention. For shallow tunnels, the σT obtained by the limit equilibrium theory tends to be higher than the experimental values, which can easily lead to passive instability of tunnel face. On the other hand, models based on limit analysis theory can form soil arching even in case of shallow tunnels. However, in experiments, the failure zone may still extend to the ground surface for loose sand with cover ratio greater than 2.0, resulting in underestimated soil pressures (Di et al., 2022a).
In this paper, based on the numerical models, a new collapse model for shallow tunnel in sand is proposed. The analytical solutions are derived using the limit analysis method. The proposed theoretical model is compared with numerical models and existing models to validate its applicability and accuracy. Finally, using the proposed model, the influence of various factors on stability of tunnel face is analyzed, and the mechanism of collapse of tunnel face is revealed.
The finite difference software FLCA3D is used to study limit support pressure σT and failure zone for shallow tunnel in this section. A total of 16 cases were considered in Table 1 to investigate the effect of cover ratio C/D and friction angle φ on tunnel face stability. The soil parameters are as described below: Unit weight γ = 18 kN/m³, Young’s modulus E = 20 MPa, Poisson’s ratio v = 0.35, and cohesion c = 0 kPa.
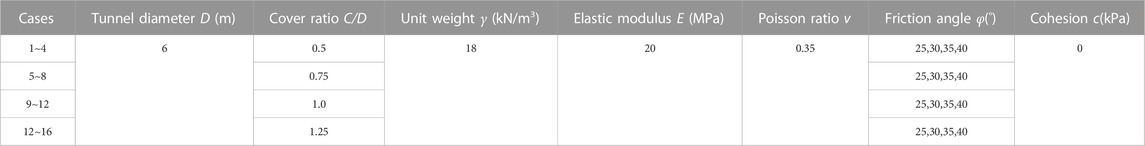
TABLE 1. Calculation parameters.
As shown in Figure 1, a semi-model approach was adopted, taking into account computational efficiency. The dimensions of the model are the following: width 3D, length 8D, height 6D + C, where D is tunnel diameter and C is the tunnel burial depth. The boundary conditions of the model are as follows: fixed at the bottom, constrained normal displacement at the sides, and free at the top. The soil material was modeled using solid elements, assuming it follows the Mohr-Coulomb criterion. To simulate the lining, shell elements with E = 20 GPa, v = 0.17 and a thickening of 0.35 m were used.
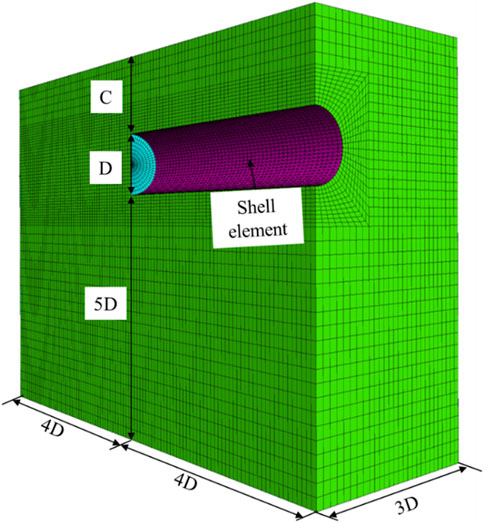
FIGURE 1. Numerical model.
To simulate, proceed as follows:
(1) Create soils layers and initialize the soil stress.
(2) To simplify the simulation process, a one-step excavation method is used, with lining applied simultaneously.
(3) Apply a support pressure (PT) to the tunnel face, where the value of the PT is equal to the horizontal stress in the center of the tunnel face.
(4) Reduce the PT and plot the curve of PT versus horizontal displacement (Δh) of the center of the excavation face.
(5) When the PT sharply increases, the corresponding support pressure is considered as the limit support pressure (σT) (Li et al., 2022).
In the simulation, when the support pressure sharply increases, the corresponding support pressure is considered as the limit support pressure. The double tangent method proposed by Li et al. (2019) is used to determine the limit support pressure. The specific method is as follows: make the curve of support pressure and excavation face displacement, make the tangent line of the descending section and the horizontal section respectively, and the intersection point of the two is the limit support pressure. Figures 2A–D shows the relationship between Δh and PT for varying cover ratios C/D. Under varying cover ratios, the support pressure gradually decreases with increasing φ. From the results shown in Figure 2A, it can be observed that at C/D = 0.5 and φ = 25°, the σT = 17.85 kPa. When the φ = 30°, 35°, and 40°, the σT = 12.75 kPa, 9.35 kPa, and 7 kPa, respectively. Figure 2B demonstrates that for C/D = 0.75, and φ = 25°, 30°, 35°, and 40°, the σT = 18.85 kPa, 13.50 kPa, 9.85 kPa, and 7.00 kPa, respectively. Similarly, from Figures 2C, D, the σT can be obtained for cover ratios of 1.0 and 1.25, respectively.
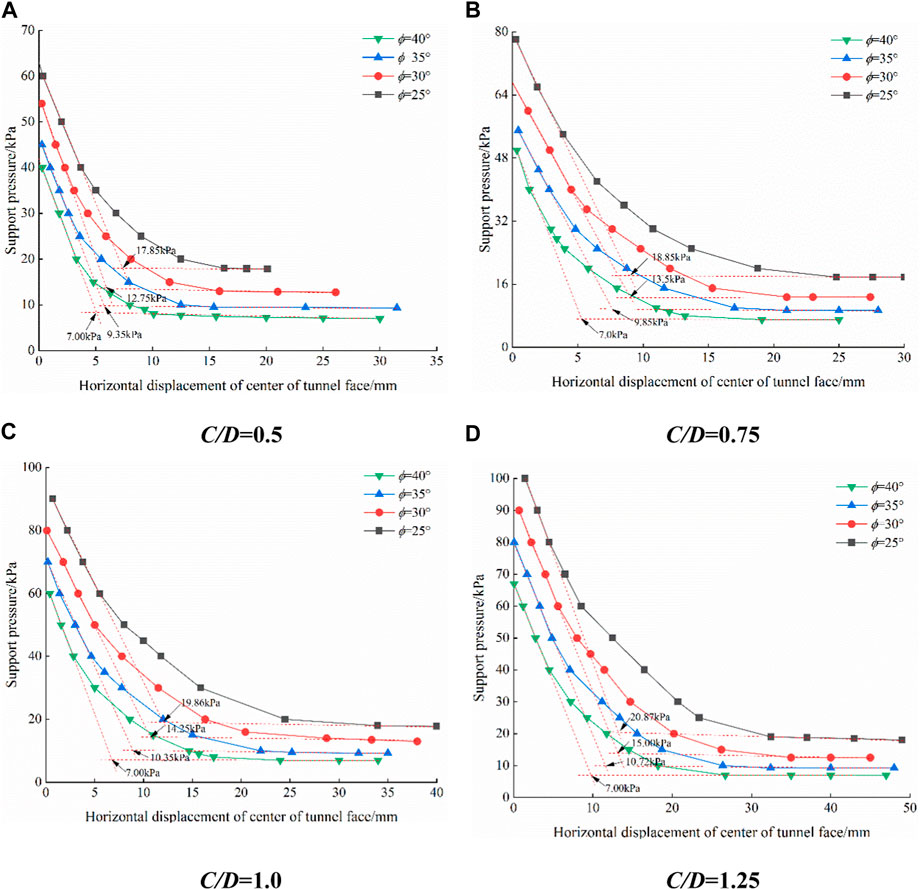
FIGURE 2. Relation curve of support pressure and horizontal displacement under different C/D. (A) C/D=0.5. (B) C/D=0.75. (C) C/D=1.0. (D) C/D=1.25.
Figure 3 illustrates the relationship between the σT and the φ (in radians) for different C/D. By comparing, it can be observed that there is an exponential relationship between the σT and the φ. The exponential function σT = ea+bφ+cφ2 was used to fit the data, resulting in the following relationships: for C/D = 0.5, σT = e4.91-5.32φ+1.54φ2, R2=0.995; for C/D = 0.75, σT = e4.50-3.47φ−0.25φ2, R2 = 0.992; for C/D = 1.0, σT=e4.11-1.74φ−1.94φ2, R2 = 0.987; for C/D = 1.25, σT=e3.88-0.561φ+3.15φ2, R2=0.981.
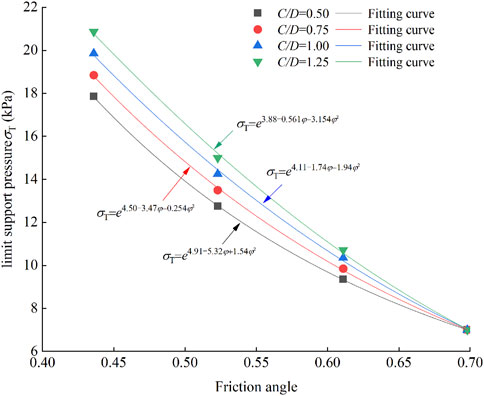
FIGURE 3. Relationship between limit support pressure and friction angle under different C/D.
The fitting results show that the coefficients a, b, and c have a strong linear relationship with the cover ratio C/D, as illustrated in Figure 4. The correlation between the coefficient a and the C/D can be expressed as a = 5.57–1.39C/D, R2=0.978. The correlation between the coefficient b and the C/D is as follows: b = −8.38 + 6.42C/D, R2=0.983. The correlation between coefficient c and C/D is as follows: c = 4.51–6.09C/D, R 2= 0.989. Therefore, the correlation between the σT and C/D and φ is as follows:
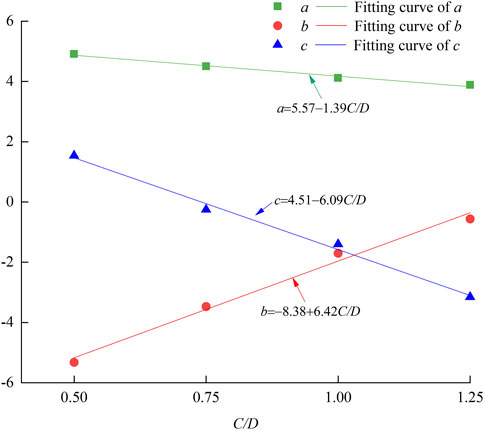
FIGURE 4. Relationship between coefficient (a,b,c) and C/D.
The validity range of Formula (1) is C/D ≤ 1.25 and friction angle 25° ≤ φ ≤40°.
Figure 5 shows the variation of σT with respect to the C/D. The solid line represents the results calculated based on Formula (1), while the dashed line presents the values obtained from numerical simulations. From the graph, it is obvious that in the range of C/D≤1.25, the σT obtained from the numerical simulations shows an approximately linear increase with the increase of the C/D. Similarly, the σT calculated based on the fitted equation also shows an approximately linear increase with the cover ratio. A comparison between the two reveals that the calculated results from the Formula (1) are larger than the numerical results, and the discrepancy between them increases as the C/D increases. For instance, when φ=25° and C/D = 0.5, the fitted result is approximately 1.62% higher than the numerical simulation result. When φ = 30° and C/D = 1.25, the fitted result is approximately 4.98% higher, and at φ=30° and C/D=1.25, the difference reaches a maximum of approximately 9.2%. It is worth noting that the results from Formula (1) are relatively conservative compared to the numerical calculation results, and the difference is within an acceptable range, indicating a relatively safe approach for engineering applications.
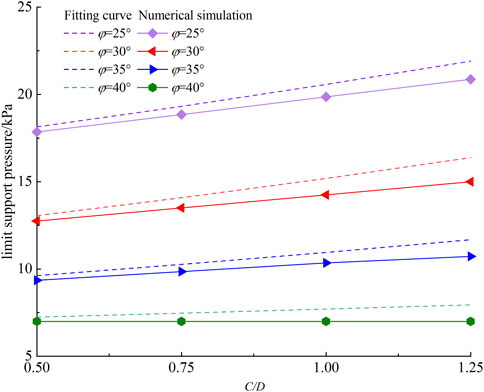
FIGURE 5. Relationship between limit support pressure and C/D.
Figure 6 illustrates the shapes of the failure zone under different cover ratios C/D for an internal friction angle of 35°. The boundary of the failure zone is defined by the abrupt change in the displacement gradient (Zhang et al., 2015). It is obvious that when the C/D≤1.0, the collapse zone extends to ground surface. The failure zone can be divided into two parts: the lower failure zone and the upper failure zone. The lower failure zone exhibits a logarithmic curve shape, while the upper failure zone can be considered as an inverted round table shape (although the numerical simulation results are not apparent due to the stronger lining parameters near the tunnel face). The inverted round table can be further divided into a cylindrical-shaped failure core and a disturbed zone, which is consistent with the findings of (Li et al., 2018). When C/D>1.0, The collapse zone no longer extends to the surface; its shape consists mainly of the logarithmic curve-shaped lower failure zone and the upper soil arch zone.
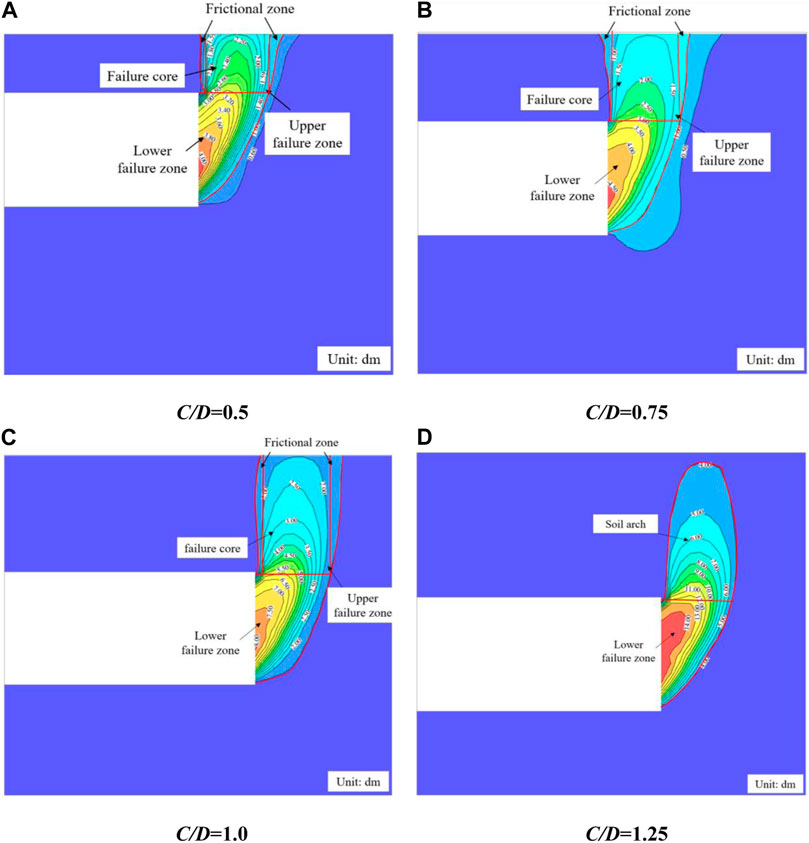
FIGURE 6. Failure zone under different C/D (φ = 35°unit:dm). (A) C/D=0.5. (B) C/D = 0.75. (C) C/D = 1.0. (D) C/D = 1.25.
Based on the numerical simulations, model tests (Di et al., 2022b), and engineering experience, a new 3D collapse model for shallow shield tunnels has been proposed. As shown in Figure 7, tunnel diameter is D, cover depth is C, and support pressure is applied uniformly on the tunnel face. The failure zone is divided into upper and lower parts. The lower part adopts the classical five-cone model (Soubra et al., 2008): it assumes that the lower part consists of five rigid truncated cones, with each cone having a vertex angle of 2φ. The cones move along the axis of the cone and are constrained by the associated flow rules. The first truncated cone is formed by a rigid cone whose axis is at an Angle of α to the tunnel axis and a plane I which is at an angle of β1 to the tunnel face. To ensure that the second cone completely coincides with the first cone at section I, the second cone is generated as a mirror image of the first cone and is cut by plane II, and so on for the third to fifth cones. The upper part of the collapse zone has a shape similar to an inverted round table. The core of the failure zone is in the shape of a cylinder, and the portion excluding the failure core is the disturbed zone. The boundary of the disturbed zone forms an angle θ with the horizontal direction. There is friction between the disturbed zone and the failure core, which reduces the vertical soil pressure.
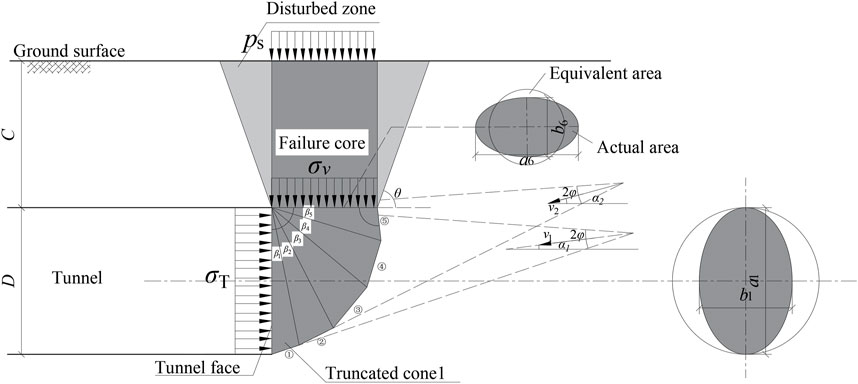
FIGURE 7. Proposed failure mechanism.
The effect of the upper collapse zone can be equivalently represented as a vertical earth pressure σv (Han et al., 2016). Based on geometric relationships, it is found that the intersection plane between the fifth truncated cone and the upper failure zone has an elliptical shape, with major axis a6 and minor axis b6. To simplify the calculation, we can approximate it as a circular shape with radius r, as proposed by (Li et al., 2020). The equivalent formula is given below:
As shown in Figure 8, the upper failure zone is considered as an inverted round table, where the failure core is a cylindrical shape with a radius of r, and the remaining part is the disturbed zone. During the occurrence of failure, the disturbed zone forms an angle θ with the horizontal plane, exhibiting a tendency to slide downward, resulting in friction along the slip surface. The core of collapse zone tends to move downward and is constrained by the disturbed zone. Here, Ps represents the surface overload, and σ'v represents the reactive force of σv.
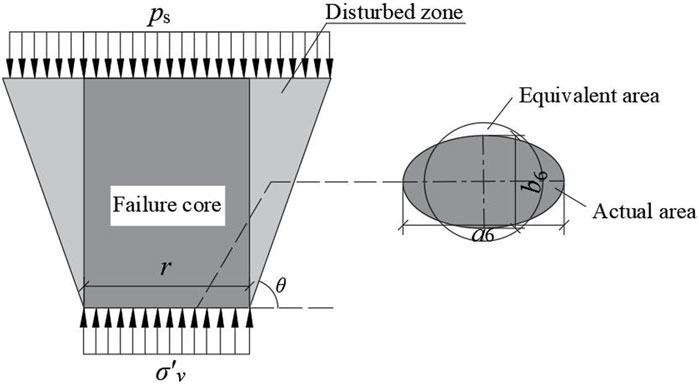
FIGURE 8. Upper failure mechanism.
To determine the magnitude of vertical soil pressure, we select any vertical plane passing through the axis of the truncated cone as the calculation diagram, such as Figure 9. The following assumptions are made: The soil follows the Mohr-Coulomb strength criterion. Coefficient of friction of the sliding surface AD and BE is tanφ. Due to soil disturbed, the friction angle between the failure core and the disturbed zone is given by η (η≤ φ). The ground overload Ps and the vertical soil pressure σs are both uniformly distributed loads.
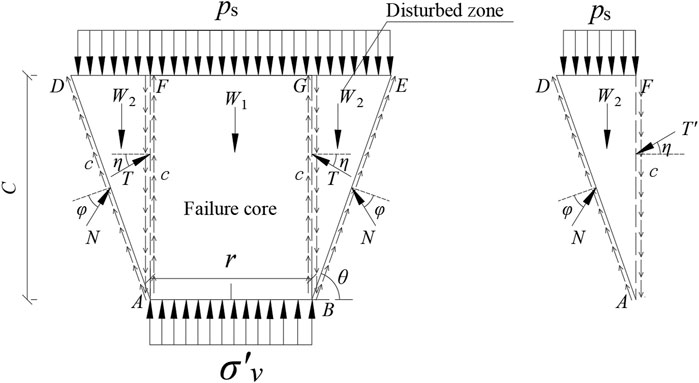
FIGURE 9. Calculation diagram of upper failure zone.
The ADF section is taken as the object of force analysis, and the vertical equilibrium equation and the horizontal equilibrium equation are formulated to obtain the following equations:
Where:
The vertical equilibrium equation is formulated for the ABFG section as the object of study, yielding the following equation.
Where:
When active failure occurs, the angle θ is given by θ = π/4 + φ/2 by the Mohr-Coulomb criterion. The friction angle η can be obtained from Table 2 (Li et al., 2018). For sandy soil classified as VI rock mass, its range of values is between 0.3φ and 0.5φ.

TABLE 2. η value of all grades of surrounding rock.
By simultaneously solving Eqs 3–6, the vertical soil pressure σv can be obtained.
The limit analysis method derives the limit load from an energy perspective. An upper bound estimate of such loads is found by considering a kinematically admissible failure mechanism for which the power of the loads applied to the system is larger than the power that can be dissipated inside the system during its movement (Chen, 1975). Thus, When the tunnel face is stable, the following equation should satisfy:
Where Pe is the power of external forces and Pv is the dissipated power in the failure zone.
To calculate the internal and external powers in the failure zone, it is necessary to derive the geometric relationships. Based on these relationships, the angle αi between the axis of the i-the truncated cone and the tunnel axis is given by Formula (8):
The angles δi are as follows:
Through analysis, it can be determined that the section obtained by the oblique intersection of each cone with the plane is an ellipse. The long axis, short axis, and area of the ellipse obtained by the i-th cone are denoted by ai, bi, and Ai, respectively, as given by Eqs 10–12.
The volumes of i-th cones, denoted as Vi, can be expressed by formula (13):
Where:
It is assumed that the velocity of each cone is parallel to its axis. The velocity of the i-th cone is denoted as vi, and the relative velocity between the i-th cone and the (i+1)-th cone is denoted as vi,i+1. The relationship between vi, vi+1, and vi,i+1 is illustrated in Figure 10. the vi, vi+1, and vi,i+1 can be expressed by formula (15) and (16).
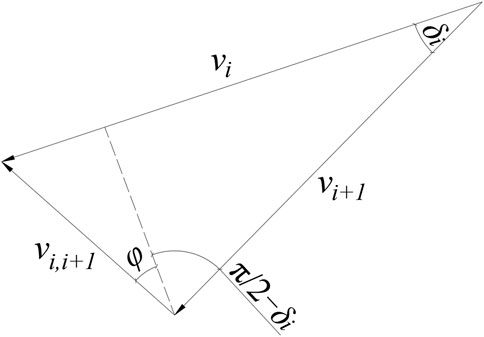
FIGURE 10. Velocity field of the proposed mechanism.
The Pe is mainly composed of three parts: the power of support pressure PT, the power of gravity in the failure zone Pγ, and the power of vertical load Pσv, which can be expressed as follows:
PT can be calculated using Eq. 18:
The power of gravity Pγ can be expressed using the following equation:
The power of equivalent vertical pressure Pσv can be expressed using the following equation:
The dissipated power occurs mainly at the boundary of the collapse zone and between the truncated cones, which can be expressed by Formula (21):
By substituting Eqs 17–21 into Eq. 7, the following expression can be derived:
Where:
Formula (23) reveals that the σT depends on the geometric characteristics of the failure model (α1, β1 to β5, C, D) and the soil parameters (c, φ). Therefore, the upper-bound method of the σT can be obtained through optimization theory. By considering the geometric characteristics of the failure model (α1, β1 to β5) as optimization variables and maximizing the σT as the optimization objective, the value of σT can be determined:
To verify the accuracy of the proposed model in the paper, it is compared with numerical models, classical analytical models, and model tests.
In Figure 11, a comparison is made between the proposed theoretical model, existing theoretical and numerical models, and model tests under the condition of an internal friction angle of 30° and η/φ = 0.5. From the graph, it can be observed that both the proposed model and the numerical model show an increase in the σT with an increase in the cover ratio, and the trends are similar. When the cover ratio reaches 1.25, the increase in the σT becomes less significant. (Soubra et al., 2008; Mollon et al., 2011a) also found that the σT does not change significantly beyond a cover ratio of 0.5. A comparison reveals that when the cover ratio is 0.5, the σT obtained from the proposed model is approximately 18% higher than the numerical results. As the cover ratio increases, the difference between the two approaches becomes smaller. When the cover ratio is 1.5, the proposed model yields approximately 8% higher results compared to the numerical simulation. The main reason for these discrepancies is that, based on model tests and engineering practice, the soil arch cannot form an arch for shallow tunnels, resulting in soil collapse to the ground and an increased vertical soil pressure. However, this phenomenon cannot be accurately simulated using a continuous medium model, leading to an underestimation of the vertical soil pressure. As the embedment ratio increases, the difference between the two models diminishes gradually due to the gradual emergence of the arching effect. Comparison with (Soubra et al., 2008; Mollon et al., 2011a), the proposed model yields approximately 13.7% and 25% higher results, respectively. The main reason for these differences is that (Soubra et al., 2008; Mollon et al., 2011a) prematurely assume the formation of an arching effect in soil with smaller friction angles, which contradicts experimental results and engineering practices.
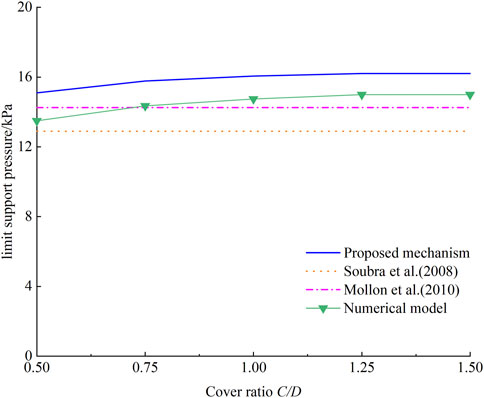
FIGURE 11. Comparison of proposed model with other models under different C/D.
In Figure 12, the results of different theoretical calculations for the variation of σT with φ are given for cover ratio C/D = 0.75 and η/φ = 0.5. It can be observed that all the results exhibit a nonlinear decrease with the increase of the φ. In terms of numerical values, when the φ = 25°, the differences in σT obtained by the four models are the largest, while the differences are the smallest when the φ = 40°. In addition, compared to the other models the proposed model gives higher σT. The main reason for these phenomena is that when the φ is small, the soil arch can’t be formed, resulting in a higher vertical soil pressure. As the φ increases, the formation of the soil arch becomes easier, and the limit support pressure calculated by different models tend to converge.
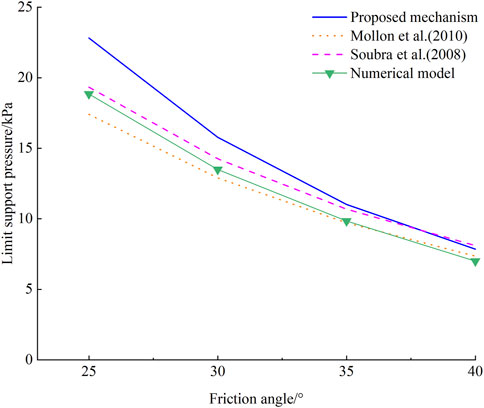
FIGURE 12. Comparison of proposed model with other models under different φ.
Centrifuge tests results conducted by (Chambon and Corte, 1994) using sand are shown in Table 3. The sand parameters are as follows: φ = 38°–42°, c = 0∼5 kPa. As shown in the table, when the φ = 38° and the c = 0 kPa, the σT proposed in the paper is significantly higher than that obtained experimentally. With an increase in cohesion, the reduction in ultimate support force becomes more pronounced. When the cohesive strength reaches 5 kPa, the excavation face can stabilize itself. It should be noted that the soil parameters provided by (Chambon and Corte, 1994) are given as ranges, making it difficult to make accurate comparisons. However, the calculated results in this study include the experimental values, which demonstrates the validity of the proposed model.
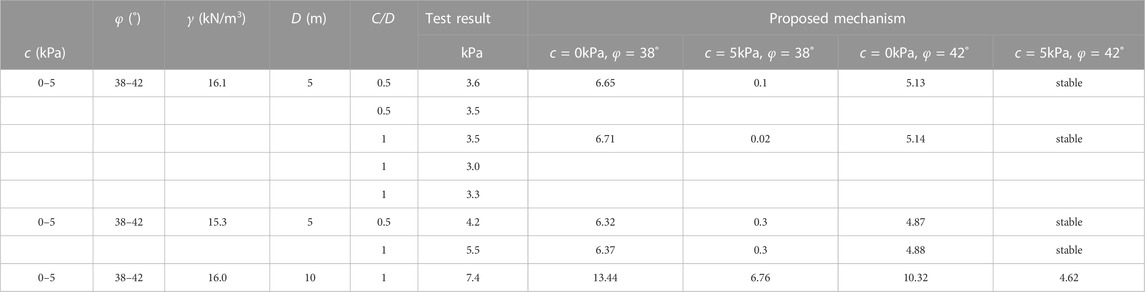
TABLE 3. Comparison between model test results and analytical solutions of limit support pressure.
By comparison, it is found that the proposed model in this study is agrees well with numerical models and classical models. Especially in terms of shallow tunnel in sand, this model can more accurately describe the failure mode and provide more precise solutions. This section focuses on analyzing the influence of various factors on the σT.
In the case of C/D = 0.5∼1.25, Figure 13 shows the variation of σT with φ. It can be observed that the σT increases gradually with the increase of C/D when the φ is low. However, as the φ increases, the effect of cover ratio on σT becomes insignificant. The reason for this phenomenon is due to the following: At small friction angle, the frictional effect along the sliding surface is not apparent, resulting in an increase in σT with increasing depth. As the φ gradually increases, the soil arch effect becomes more prominent, leading to a decrease in the effect of C/D on σT.
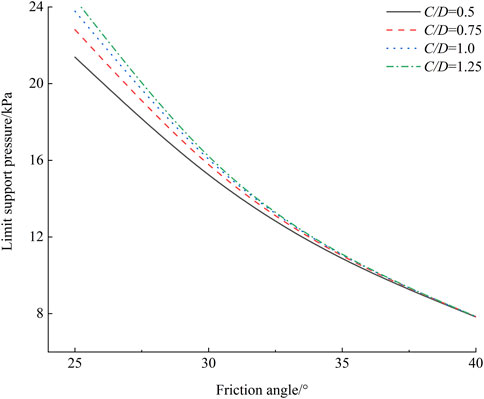
FIGURE 13. Influence of friction angle on limit support pressure under different C/D.
The influence of the c on the σT at different φ is illustrated in Figure 14. It can be seen that the σT decreases linearly with the increase of c, and the smaller the φ is, the more sensitive the σT is to the change of c. The main reasons for this phenomenon are as follows: Numerical simulations and theoretical studies have shown that the φ plays an important role in the area of collapse zone, and the smaller the φ, the larger the area of the collapse zone and the sliding surface. The energy dissipation of the cohesion occurs mainly at the sliding surface, so the larger the sliding surface area, the more obvious is the reduction of the σT as the cohesion increases.
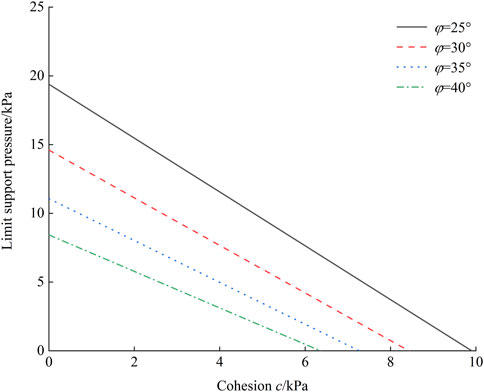
FIGURE 14. Influence of cohesion on limit support pressure under different φ.
The influence of the Ps on the σT for various φ is shown in Figure 15. It is apparent that the σT increases linearly as the Ps increases. The increase in the σT is small in comparison with the increase in the Ps, and the increase in the σT is smaller and smaller with the increase in the φ. At a friction angle of 35°, the surface load will have little effect on the σT due to the soil arch effect.
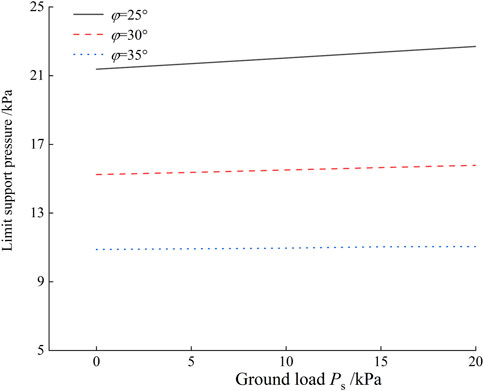
FIGURE 15. Influence of Ground load on limit support pressure under different.
The friction angle ratio η/φ is the ratio of the friction angle between the disturbed zone and failure core to the soil friction angle, which is important for the formation of the soil arch. The influence of η/φ on the σT is investigated in this section. As shown in Figure 16, for small η/φ the frictional effect of the disturbed zone on the failure core is less and the σv is closer to the vertical earth pressure, resulting in a larger σT. As η/φ increases, the σT gradually decreases. Beyond a certain value, the effect of η/φ on the σT is not apparent due to the soil arch effect.
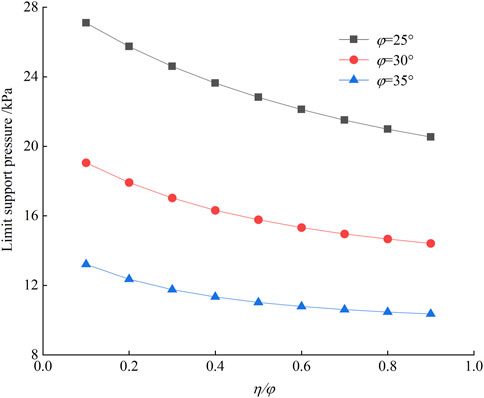
FIGURE 16. Influence of η/φ on limit support pressure under different φ.
Numerical simulation and theoretical Analysis are combined to study the face stability of shallow shield tunnel in sand. Firstly, numerical simulation is used to study the tunnel collapse in sand to obtain the σT and shape of collapse zone. The new failure model suitable for shallow tunnel is constructed based on numerical simulations, and the σT is solved by upper-bound method. The following conclusions are mainly obtained:
(1) Through numerical simulation, it is found that the σT decreases exponentially with the increase of the φ in the range of φ = 25°∼40° and C/D = 0.5∼1.25. The σT increases approximately linearly with the increase of the C/D. And the regression equation is obtained by regression analysis.
(2) Through numerical simulation, it is found that for the sandy soil layer, when the C/D≤1, the can zone can reach ground surface, and the shape of the collapse zone is an inverted round table, which includes a columnar failure core and the rest of the disturbed zone.
(3) A new failure model based on five truncated cones with inverted circular table is proposed. By comparison, it is found that the proposed model is consistent with the numerical model and exiting modes. In addition, the proposed model is more accurate in describing the phenomenon that no soil arch can be formed for shallow tunnel in sand, and it has higher accuracy in solving the σT of shallow shield tunnel in sand.
(4) Through the theoretical analysis, it is found that the σT decreases nonlinearly with the increase of the φ, and the larger φ is, the more obvious soil arch effect is, and the smaller the effect of C/D on the σT is. In addition, the σT decreases linearly with the increase of cohesion c, and the smaller φ, the more σT sensitive is to the cohesion. The increase of PS will cause the σT to increase, but when the soil arch forms, the effect of Ps on the σT is smaller.
The original contributions presented in the study are included in the article/Supplementary Material, further inquiries can be directed to the corresponding author.
SQ: Project administration, Resources, Writing–original draft. LZ: Conceptualization, Investigation, Writing–original draft. XW: Data curation, Investigation, Writing–original draft. XL: Investigation, Project administration, Writing–original draft. FW: Data curation, Writing–original draft, Writing–review and editing.
The authors declare financial support was received for the research, authorship, and/or publication of this article. The authors declare financial support was received for the research, authorship, and/or publication of this article. Youth Fund Project of Shanxi Provincial Science and Technology Department, “Research on Flexibility Regulation Mechanism and Engineering Application of NPR Anchor Cables in High Geostress Soft Rock Tunnels.
Authors SQ, LZ, XW, and XL were employed by 5TH Engineering LTD. of the First Highway Engineering Bureau CCCC.
Author FW was employed by Shanxi Transportation Technology Research and Development Co., Ltd.
The authors declare that this study received funding from the Science and Technology Project of Shanxi Province Transportation Holding Group Co., Ltd, “Research on Disaster-Causing Mechanism of Coal Mine Subsidence and Prevention and Control of NPR Anchor Cables for Operating Tunnels in Mountainous Areas”, Project No.: 2022-JKKJ-6. The funder had the following involvement in the study: decision to publish and preparation of the manuscript.
All claims expressed in this article are solely those of the authors and do not necessarily represent those of their affiliated organizations, or those of the publisher, the editors and the reviewers. Any product that may be evaluated in this article, or claim that may be made by its manufacturer, is not guaranteed or endorsed by the publisher.
Anagnostou, G., and Kovári, K. (1994). The face stability of slurry-shield-driven tunnels. Tunn. Undergr. space Technol. 9 (2), 165–174. doi:10.1016/0886-7798(94)90028-0
Arthur, L., Darby, A., Rafoneke, B., Daws, G., MacDonald, D., Innaurato, N., et al. (July, 1994). “Face support for a large mix-shield in heterogeneous ground conditions,” in Tunnelling’94: Papers presented at the seventh international symposium,‘Tunnelling’94’ (Springer), London, UK, 531–550.
Atkinson, J., Potts, D., and Schofield, A. (1977). Centrifugal model tests on shallow tunnels in sand. Tunn. Tunnlng. 9 (1), 59–64
Chambon, P., and Corte, J.-F. (1994). Shallow tunnels in cohesionless soil: stability of tunnel face. J. geotechnical Eng. 120 (7), 1148–1165. doi:10.1061/(asce)0733-9410(1994)120:7(1148)
Chen, R., Tang, L., Ling, D., and Chen, Y. (2011). Face stability analysis of shallow shield tunnels in dry sandy ground using the discrete element method. Comput. Geotechnics 38 (2), 187–195. doi:10.1016/j.compgeo.2010.11.003
Chen, R., Yin, X., Tang, L., and Chen, Y. (2018). Centrifugal model tests on face failure of earth pressure balance shield induced by steady state seepage in saturated sandy silt ground. Tunn. Undergr. Space Technol. 81, 315–325. doi:10.1016/j.tust.2018.06.031
Chen, R.-P., Li, J., Kong, L.-G., and Tang, L.-J. (2013). Experimental study on face instability of shield tunnel in sand. Tunn. Undergr. Space Technol. 33, 12–21. doi:10.1016/j.tust.2012.08.001
Chen, W. F. (1975). Limit analysis and soil plasticity. Amsterdam, The Netherlands: Elsevier Science, 1–15.
Di, Q., Li, P., Zhang, M., and Cui, X. (2022a). Influence of relative density on deformation and failure characteristics induced by tunnel face instability in sandy cobble strata. Eng. Fail. Anal. 141, 106641. doi:10.1016/j.engfailanal.2022.106641
Di, Q., Li, P., Zhang, M., and Cui, X. (2022b). Investigation of progressive settlement of sandy cobble strata for shield tunnels with different burial depths. Eng. Fail. Anal. 141, 106708. doi:10.1016/j.engfailanal.2022.106708
Funatsu, T., Hoshino, T., Sawae, H., and Shimizu, N. (2008). Numerical analysis to better understand the mechanism of the effects of ground supports and reinforcements on the stability of tunnels using the distinct element method. Tunn. Undergr. Space Technol. 23 (5), 561–573. doi:10.1016/j.tust.2007.10.003
Han, K., Zhang, C., and Zhang, D. (2016). Upper-bound solutions for the face stability of a shield tunnel in multilayered cohesive–frictional soils. Comput. Geotechnics 79, 1–9. doi:10.1016/j.compgeo.2016.05.018
Horn, N. (1961). “Horizontal earth pressure on perpendicular tunnel face,” in Proceedings of the Hungarian National Conference of the Foundation Engineer Industry. Budapest
Idinger, G., Aklik, P., Wu, W., and Borja, R. I. (2011). Centrifuge model test on the face stability of shallow tunnel. Acta Geotech. 6, 105–117. doi:10.1007/s11440-011-0139-2
Kirsch, A. (2010). Experimental investigation of the face stability of shallow tunnels in sand. Acta Geotech. 5, 43–62. doi:10.1007/s11440-010-0110-7
Leca, E., and Dormieux, L. (1990). Upper and lower bound solutions for the face stability of shallow circular tunnels in frictional material. Géotechnique 40 (4), 581–606. doi:10.1680/geot.1990.40.4.581
Li, H., Li, X., Fu, J., Zhu, N., Chen, D., Wang, Y., et al. (2023). Experimental study on compressive behavior and failure characteristics of imitation steel fiber concrete under uniaxial load. Constr. Build. Mater. 399, 132599. doi:10.1016/j.conbuildmat.2023.132599
Li, H., Tian, X., Song, Z., Wang, J., and Zhou, G. (2018). Study on calculaiton method of digging length for shallow tunnel based on Xie Jiajie's Sourrounding Rock Pressure Formula. J. Xi'an Univ. Arch. Tech. Nat. Sci. Ed. 50 (05), 662–667. doi:10.15986/j.1006-7930.2018.05.007
Li, P., Chen, K., Wang, F., and Li, Z. (2019). An upper-bound analytical model of blow-out for a shallow tunnel in sand considering the partial failure within the face. Tunn. Undergr. Space Technol. 91, 102989. doi:10.1016/j.tust.2019.05.019
Li, P., Wei, Y., Zhang, M., Huang, Q., and Wang, F. (2022). Influence of non-associated flow rule on passive face instability for shallow shield tunnels. Tunn. Undergr. Space Technol. 119, 104202. doi:10.1016/j.tust.2021.104202
Li, P., Zou, H., Wang, F., and Xiong, H. (2020). An analytical mechanism of limit support pressure on cutting face for deep tunnels in the sand. Comput. Geotechnics 119, 103372. doi:10.1016/j.compgeo.2019.103372
Liao, S.-M., Liu, J.-H., Wang, R.-L., and Li, Z.-M. (2009). Shield tunneling and environment protection in Shanghai soft ground. Tunn. Undergr. Space Technol. 24 (4), 454–465. doi:10.1016/j.tust.2008.12.005
Liu, H., Li, X., Yu, Z., Tan, Y., Ding, Y., Chen, D., et al. (2023a). Influence of hole diameter on mechanical properties and stability of granite rock surrounding tunnels. Phys. Fluids 35 (6). doi:10.1063/5.0154872
Liu, S., and Li, X. (2023). Experimental study on the effect of cold soaking with liquid nitrogen on the coal chemical and microstructural characteristics. Environ. Sci. Pollut. Res. 30 (13), 36080–36097. doi:10.1007/s11356-022-24821-9
Liu, S., Sun, H., Zhang, D., Yang, K., Li, X., Wang, D., et al. (2023b). Experimental study of effect of liquid nitrogen cold soaking on coal pore structure and fractal characteristics. Energy 275, 127470. doi:10.1016/j.energy.2023.127470
Meguid, M., Saada, O., Nunes, M., and Mattar, J. (2008). Physical modeling of tunnels in soft ground: a review. Tunn. Undergr. Space Technol. 23 (2), 185–198. doi:10.1016/j.tust.2007.02.003
Messerli, J., Pimentel, E., and Anagnostou, G. (2010). “Experimental study into tunnel face collapse in sand,” in Physical modelling in geotechnics, two volume set (CRC Press), Boca Raton, FL, USA, 601–606.
Mollon, G., Dias, D., and Soubra, A. H. (2011a). Rotational failure mechanisms for the face stability analysis of tunnels driven by a pressurized shield. Int. J. Numer. Anal. Methods Geomechanics 35 (12), 1363–1388. doi:10.1002/nag.962
Mollon, G., Phoon, K. K., Dias, D., and Soubra, A.-H. (2011b). Validation of a new 2D failure mechanism for the stability analysis of a pressurized tunnel face in a spatially varying sand. J. Eng. Mech. 137 (1), 8–21. doi:10.1061/(asce)em.1943-7889.0000196
Murayama, S., Endo, M., Hashiba, T., Yamamoto, K., and Sasaki, H. (August, 1996). “Geotechnical aspects for the excavating performance of the shield machines,” in The 21st annual lecture in meeting of Japan Society of Civil Engineers). Japan.
Senent, S., Mollon, G., and Jimenez, R. (2013). Tunnel face stability in heavily fractured rock masses that follow the Hoek–Brown failure criterion. Int. J. Rock Mech. Min. Sci. 60, 440–451. doi:10.1016/j.ijrmms.2013.01.004
Soubra, A.-H., Dias, D., Emeriault, F., and Kastner, R. (March, 2008). “Three-dimensional face stability analysis of circular tunnels by a kinematical approach,” in GeoCongress 2008: characterization, monitoring, and modeling of GeoSystems, New Orleans, LA, USA, 894–901.
Wang, F. N., Guo, Z., Qiao, X., Fan, J., Li, W., Mi, M., et al. (2021a). Large deformation mechanism of thin-layered carbonaceous slate and energy coupling support technology of NPR anchor cable in Minxian Tunnel: a case study. Tunn. Undergr. Space Technol. 117, 104151. doi:10.1016/j.tust.2021.104151
Wang, F. N., Yin, S., Guo, A., Wang, Z., Mi, M., Qi, G., et al. (2021b). Frame structure and engineering applications of the multisource system cloud service platform of monitoring of the soft rock tunnel. Geofluids 2021, 1–15. doi:10.1155/2021/6672732
Yu, L., Zhang, D., Fang, Q., Cao, L., Zhang, Y., and Xu, T. (2020). Face stability of shallow tunnelling in sandy soil considering unsupported length. Tunn. Undergr. Space Technol. 102, 103445. doi:10.1016/j.tust.2020.103445
Zhang, J., Li, X., Qin, Q., Wang, Y., and Gao, X. (2023). Study on overlying strata movement patterns and mechanisms in super-large mining height stopes. Bull. Eng. Geol. Environ. 82 (4), 142. doi:10.1007/s10064-023-03185-5
Zhang, X., Wang, M., Wang, Z., Li, J., Tong, J., and Liu, D. (2020). A limit equilibrium model for the reinforced face stability analysis of a shallow tunnel in cohesive-frictional soils. Tunn. Undergr. Space Technol. 105, 103562. doi:10.1016/j.tust.2020.103562
Zhang, C., Han, K., and Zhang, D. (2015). Face stability analysis of shallow circular tunnels in cohesive-frictional soils. Tunn. Undergr. Space Technol. 50, 345–357.
Keywords: shallow tunnel, sand stratum, tunnel face stability, limit analysis method, sand
Citation: Qiang S, Zhao L, Wang X, Li X and Wang F (2023) Analysis of face stability for shallow shield tunnels in sand. Front. Earth Sci. 11:1287151. doi: 10.3389/feart.2023.1287151
Received: 01 September 2023; Accepted: 19 October 2023;
Published: 28 December 2023.
Edited by:
Xuelong Li, Shandong University of Science and Technology, ChinaReviewed by:
Jinbo Miao, Hebei University of Engineering, ChinaCopyright © 2023 Qiang, Zhao, Wang, Li and Wang. This is an open-access article distributed under the terms of the Creative Commons Attribution License (CC BY). The use, distribution or reproduction in other forums is permitted, provided the original author(s) and the copyright owner(s) are credited and that the original publication in this journal is cited, in accordance with accepted academic practice. No use, distribution or reproduction is permitted which does not comply with these terms.
*Correspondence: Fengnian Wang, d2FuZ2ZuX2JqQDE2My5jb20=
Disclaimer: All claims expressed in this article are solely those of the authors and do not necessarily represent those of their affiliated organizations, or those of the publisher, the editors and the reviewers. Any product that may be evaluated in this article or claim that may be made by its manufacturer is not guaranteed or endorsed by the publisher.
Research integrity at Frontiers
Learn more about the work of our research integrity team to safeguard the quality of each article we publish.