 Xue-Jun Zhang
 Xin-Bao Gu
94% of researchers rate our articles as excellent or good
Learn more about the work of our research integrity team to safeguard the quality of each article we publish.
Find out more
ORIGINAL RESEARCH article
Front. Earth Sci., 28 December 2023
Sec. Geohazards and Georisks
Volume 11 - 2023 | https://doi.org/10.3389/feart.2023.1284243
The risk assessment of rockburst intensity is significant for tunnel construction safety. First, the depth of the rockburst (X1), the uniaxial compressive strength of the rocks (X2), the brittleness coefficient of the rocks (X3), the stress coefficients of the rocks (X4), and the elastic energy index (X5) are adopted as the evidence body, and their essential certainty and reliability is determined using the entropy-gray correlation theory. Second, the synthetic certainty reliability of other samples is calculated based on the evidence theory. Relatively to the traditional gray extension model, it can improve the predictive accuracy and determine the certainty and reliability of different evidence bodies. The difference of importance between other evidence bodies can be reflected; and an interval scale can be taken into consideration in the evaluation process, so the proposed theory can reasonably predict the grade criterion which is interval form. Conclusion demonstrated that the suggested approach is entirely consistent with the actual investigation. The proposed model not only considers the unreliability or reliability of the problem but also solves some degrees of uncertainty and ambiguity of the datum; it enhances the predictive efficiency and provides a new way and thought for future risk assessment of rockburst intensity.
When the energy accumulated at the high-stress position in deep rock mass is greater than the energy consumed by rock failure, the stress field redistributes in the rock mass due to the excavation and unloading of rock mass engineering, so hard or brittle rock masses suddenly release large amounts of energy; this phenomenon is called rockburst (Zhou et al., 2021). If a rockburst occurs, it will bring economic loss to underground engineering, such as mines, highways, railways, nuclear power, and so on, and even bring disastrous consequences (Gu et al., 2021a). For example, Western Gold Mine is a typical deep gold mine in South Africa; the mortality rate of workers caused by rockburst reached 0.1%/a, which accounted for 46% of the mortality rate of the mine (Gu and Wu, 2019); the depth of the ore body in the Hongtoushan copper mine, Liaoning province, China reaches 1047 m. From 1995 to 2004, there were 49 rock burst monitoring records. Therefore, it is essential to forecast the rockburst intensity to reduce the damage caused by rock bursts and diminish the threat to construction personnel and equipment (Gu et al., 2021b).
Since the first rock burst occurred in a Laibixi coal mine in 1738, foreign and domestic scholars alike have discussed the problem of rockburst classification prediction from different viewpoints (Gu et al., 2021c). For example, (Fujii et al., 1997), analyzed the three-dimensional elastic stress, and realized the prediction of rock burst based on the micro-crack of ore and rock; (Wang and Park, 2001); put forward that the accumulation of strain energy in rock mass is one of the critical factors affecting the occurrence of rock burst, and analyzed the strain energy, ultimately leading to rock burst prediction with the aid of a numerical analysis model; (Chen and Li, 2008); combined the systems engineering decision-making method with the fuzzy mathematics evaluation method and put forward the analytic hierarchy process-fuzzy mathematics method for comprehensive prediction of rockburst; (Chang-ping, 2008); established the attribute recognition model of rockburst prediction and intensity classification based on the theory of attribute mathematics; (Zhu et al., 2008); found a rock burst prediction method based on an improved Support vector machine algorithm; (Xie and Chang-liang, 2007); regard the relationship between rockburst and its influencing factors as a gray system, and propose a gray whitening weight function clustering method to predict rock burst disasters; (Gong et al., 2007); established a distance discriminant analysis model for tunnel rockburst prediction; (Chen et al., 2002); established an artificial neural network model for rock burst prediction; (Fu and Dong, 2009); applied Bayes discriminant theory to predict rock bursts of deep hard rock mass; (Zhou and Gu, 2004); established a fuzzy self-organizing neural network analysis model of rock burst tendency based on GIS; the optimal support vector machine is provided by (Zhou et al., 2012) to prove the higher accuracy of SVM on the prediction of rockburst intensity; the theory of intelligent rock mechanics is suggested by (Feng, 2000) based on the artificial intelligence methods combined to investigate the rockburst phenomenons systematically. (Gu et al., 2022). performed a risk assessment of rockburst intensity in a hydraulic tunnel based on an intuitionistic fuzzy sets-TOPSIS model; (Wang, 2023); predict the intensity level of rockburst using the SSA-BP neural network, and predictive accuracy was improved; (Long-fei, 2023); analyzed the reliability grade of rockburst intensity in the highway tunnel based on entropy-LGBM algorithm. These methods promote the development of predictive theory about rockburst intensity.
Although the above methods predict rock bursts from different viewpoints and have achieved a specific prediction effect, they still need to be improved (Dong et al., 2022; Dong et al., 2023; Song et al., 2023). For example, they suffer variously from complex calculation processes, neglected randomness, and low efficiency, etc. To overcome the insufficiency of the above methods, the evidence-entropy weight gray incidence theory is introduced to assess the risk level of rock burst intensity; the technique applies the entropy weight method to determine the weights of each evaluation index, and then the gray comprehensive correlation method is used to calculate the certainty and uncertainty reliability of each index. Finally, a fundamental probable distribution function matrix is constructed, and the rock burst intensity risk level is determined. Its results have higher reliability and efficiency than the above method, so it has much room for application in civil engineering.
The paper is organized as follows: in Section 2, the engineering overview is first introduced; in Section 3, theory and methodology based on the Evidence-Entropy weight gray incidence theory are presented; in Section 4, the assessment model of the rock burst intensity is constructed, and the assessment results are analyzed; in Section 5, discussions and comparative analysis are performed; in Section 6, conclusions are drawn.
Daxiangling Tunnel is the control project of the Ya’an-Lugu section of the Beijing-Kunming expressway in Sichuan, China; its location is plotted in Figure 1. It is distributed in the northeast direction and separated across the northwest-southeast ridge. The distance between the tunnel’s left and right lines is approximately 40 m, the length of the left line is 9946 m, and one of the right lines is 10,007 m. The maximum buried depth of the tunnel crossing section is 1701 m; it belongs to the deep-buried and super-long crossing-ridge tunnel. The landform of the tunnel site is characterized by significant undulation, steep terrain, and vast differences in elevation, and it is called a high Zhongshan landform.
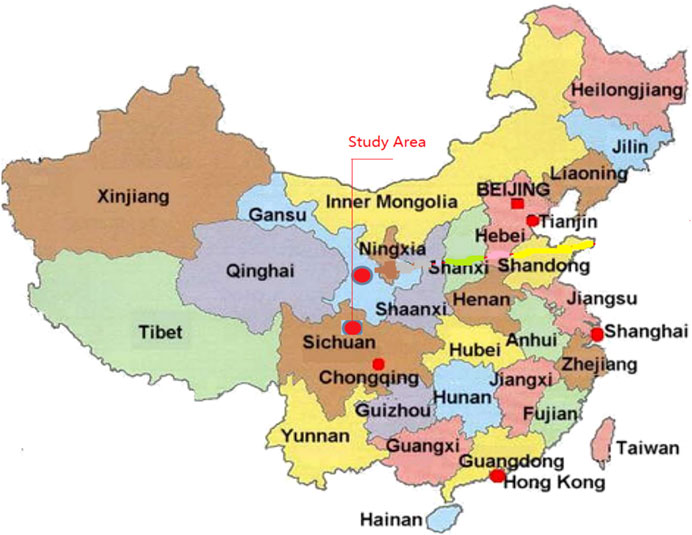
FIGURE 1. The location of the survey area.
In this area, the gully is well-developedand narrow, with an average slope of 30°∼45°, and the gully bed is large. Many cliff falls and small waterfalls can be found. The stratum of the tunnel site is complex, including Sinian, Cambrian, and Quaternary. The surrounding rock of the tunnel is mainly volcanic rock (rhyolite, andesite); only the outlet section has clastic rock and carbonate rock, and the cover thickness of the export surface is more significant. Daxiangling is a natural climate boundary, and the climate difference between the south and north slopes is noticeable. The annual rainfall is approximately 1,650 mm at the north and 650 mm at the south slopes. The specific picture of the tunnel is shown in Figure 2.
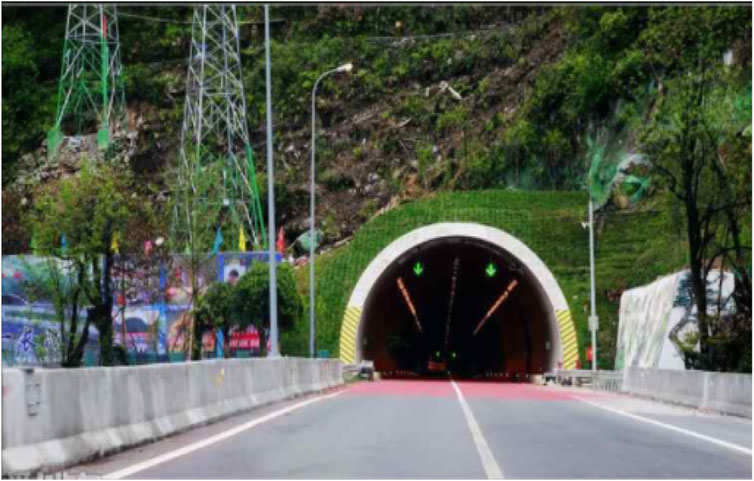
FIGURE 2. A picture of the tunnel.
Based on the problem of rock burst in deep-buried tunnel engineering, a thorough analysis of the mechanism of rock burst and a correct understanding of the main controlling factors, the depth of rock burst
According to the relevant specifications, the five evaluation indexes can be classified into four levels in Table 1; they are respectively level I (no rockburst intensity), level II (weak rockburst intensity), level III (medium rockburst intensity), and level IV (strong rockburst intensity). The monitoring value of rock burst samples in the Daxiangling tunnel is shown in Table 2.
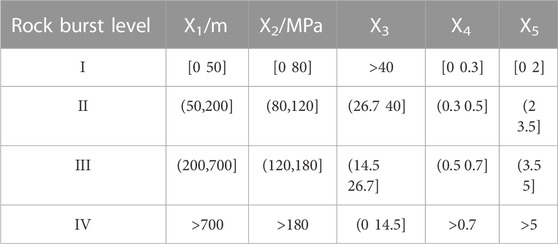
TABLE 1. Level classification of rock burst.
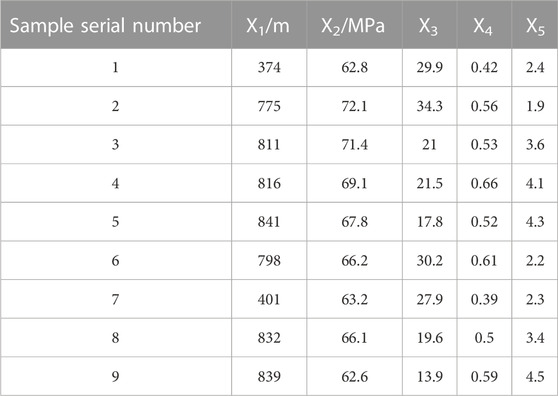
TABLE 2. The monitoring value of rock burst samples.
If the questions to be assessed are
So the basic reliability
Where,
Where,
The reliability of the evidence body is influenced by the reliability of the information source and its value. The reliability of the information source can be reflected based on its certainty reliability
Suppose there are
Let
Where, the corresponding positive indicator is
The corresponding inverse index is
By substituting the corresponding indexes at the critical points of the classification grades in Eq. 3 and Eq. 4 into Eq. 5, the reliability of the classification limits of the indexes
All row vectors and uncertainty reliability
Finally, the subjects were classified according to the different intervals of the synthetic reliability of q.
The entropy weight gray correlation method is used to determine its reliability objectively and reasonably. Firstly, the weight of each index is calculated by entropy theory, and then the reliability of each index is determined by the gray correlation method.
(1) The determination of weight coefficients
The membership index
The entropy of index
The weight of indicator
Where,
(2) Determination of basic reliability distribution function
Let
The optimal correlation coefficient
The worst correlation coefficient
Where,
Substituting
The
Where,
The basic reliability distribution function for different targets of each index is
Where,
A new suggested model is constructed to evaluate the rock burst intensity in the Daxiangling tunnel; its schematic diagram is plotted in Figure 3. At first, the different evidence body of classification standard is collected, then according to the above evidence body, the essential reliability can be determined by using the Entropy-Weight gray theory; secondly, according to the relevant basic reliability, the synthetic rule of evidence theory is performed, their results are regarded as the identification framework; thirdly, the actual monitoring data is analyzed, and the decision making is performed in the identification framework; finally, the model of rock burst prediction is established and evaluation results are obtained.
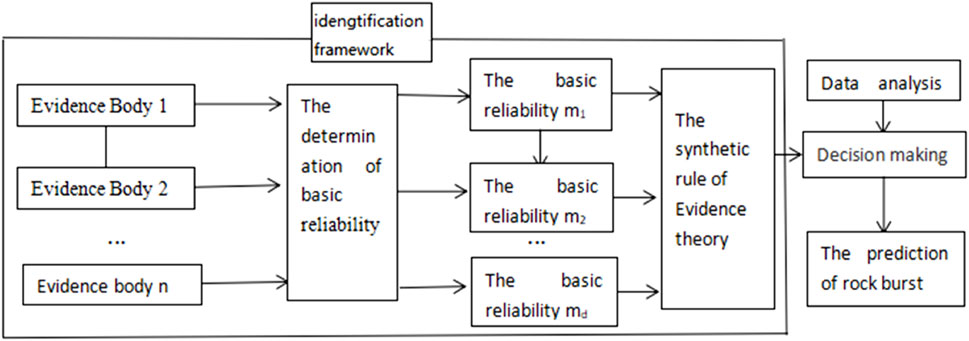
FIGURE 3. Schematic diagram of rock burst prediction based on the suggested model.
It can be found in Table 1 that the rock burst intensity increases gradually as the magnitude of
Based on Table 2, and in combination with the Eqs. (10–12), the weight coefficients of different indicators can be obtained as:
According to Eq. 13, the weighted membership degree matrix can be expressed as
The ideal optimal sequence is
The ideal worst sequence is
The maximum difference and minimum difference respectively are:
Based on Eq. 16, the gray correlation coefficient matrix can be obtained as follows:
According to Eq. 17, the uncertainty reliability of different indices is
Obtained as
According to Eq. 18, the
Based on Eq 19 and Eq.20, the total certainty and uncertainty reliability can be shown in Table 3.
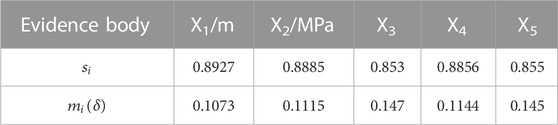
TABLE 3. The reliability of evidence body.
Substituting the data in Table 1 and the index value in the classification boundary into Eq. 5, the distribution function of basic reliability is constructed, and then the synthesis between different confidence intervals is performed. Their results are shown in Table 4.
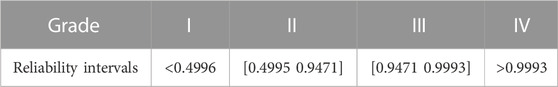
TABLE 4. Classification standard of identification frame.
The data of 1# sample is adopted as an example, substituting this datum into Eq. 1 and Eq 2, the basic reliability distribution of 1# gully can be shown in Table 5.
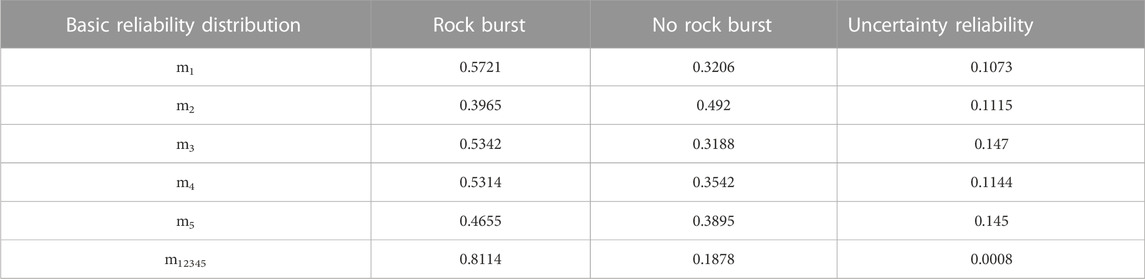
TABLE 5. The basic reliability distribution of 1# sample.
Similarly, the synthetic reliability of the 2–5# sample can be calculated in Table 6, respectively.
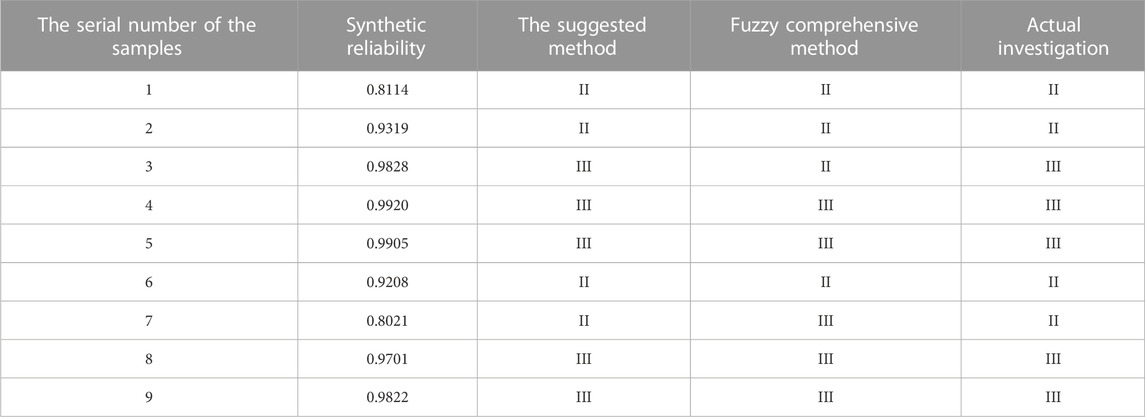
TABLE 6. The predicted result of rockburst
The Evidence-Entropy weight gray incidence theory is applied to evaluate the rock burst intensity. The assessment results are respectively depicted in Table 6. It can be found from Table 6 that the risk levels of the rock burst intensity from 1 to 9# samples are different. The risk level of rockburst intensity at 1#, 2#, 6#, and 7# samples is II; one of the rest samples is III. It means that the risk level of rock burst intensity at 1#, 2#, 6#, and 7# samples is weak. One of the remaining samples is medium, and the qualified rate of rock burst intensity in all gullies is 56%. So for 3–5# and 8–9# samples, the necessary consolidation measurement should be taken to prevent the occurrence of rock burst intensity; for example, the rock bolt should be fixed in the surrounding rocks, etc.
According to the comparative results of the assessment model in Table 6, conclusions can be drawn that the results obtained by the suggested method are entirely consistent with the investigation for five different samples. Its accuracy reaches 100% for the proposed approach, which is higher than the results from the fuzzy comprehensive method (78%) (Zhang et al., 2022). So, the conclusion demonstrates that it is feasible to estimate rockburst intensity using the Evidence-Entropy weight gray incidence theory model. The method can provide more details for assessing rockburst intensity; for example, the depth of rock burst of the 3# sample is 811, which should belong to level IV based on Table 2. In addition, the basic reliability distribution of the other indicators obtained using the suggested model belongs to level III, so the quality level probability of the 3# sample at level III is higher than that of groups I, II, and IV. So, the rock burst intensity of the 3# sample only belongs to level III and almost impossibly to levels I, II, and IV. Furthermore, the risk level of the 4# sample is more likely to be level III than that of the 3# gully because the synthetic reliability (0.9920) of the 4# sample for level III is higher than that of the 3# sample (0.9828). The results obtained using the suggested model accurately demonstrate the risk level of rockburst intensity and further determine the risk grade ranking for different samples at the same level.
The evidence theory is applied to fuse the evidence body of different information resources; the assessment results demonstrate the interaction of other factors. Relatively to the gray extension model, it can improve the predictive accuracy and determine the certainty reliability of different evidence bodies; the difference of importance between other evidence bodies can be reflected. An interval scale can be taken into consideration in the evaluation process, the proposed theory can well predict the grade criterion which is in interval form. The proposed model not only considers the unreliability or reliability of the problem but also solves some degrees of uncertainty and ambiguity of the datum. So, the suggested model enhances the predictive efficiency of rock burst intensity.
Considering the depth of rock burst (X1), the uniaxial compressive strength of rocks (X2), the brittleness coefficient of rocks (X3), the stress coefficients of rocks (X4), as well as the elastic energy index (X5), a new evaluation method is introduced in this paper to assess the risk level of rockburst intensity based on the Evidence-Entropy weight gray incidence theory. The five different evidence bodies are determined at first. Then, the entropy weight-gray correlation method calculates other evidence bodies’ certainty reliability. Finally, the synthetic reliability of rock burst intensity is calculated using the evidence theory, and the risk level of rock burst intensity is determined.
The proposed method is applied to assess the risk level of rock burst intensity; final conclusions can be drawn that the results obtained by the suggested method are entirely consistent with the actual investigation for five different samples. Its accuracy reaches 100% for the proposed method, which is higher than the results from the fuzzy comprehensive approach. The final risk level of rock burst intensity at 1#, 2#, 6#, and 7# samples is II; one of the rest samples is III. It means that the risk level of rockburst intensity at 1#, 2#, 6#, and 7# samples is weak. One of the remaining samples is medium, and the qualified rate of rockburst intensity in all gullies is 60%. So for samples 3–5# and 8–9#, the necessary consolidation measurement should be taken to prevent the occurrence of rockburst intensity. Relatively to the traditional fuzzy comprehensive method, its assessment result has higher reliability and efficiency, and an interval scale can be taken into consideration in the evaluation process. Therefore, the suggested theory can well predict the grade criterion which is interval form.
In total, the results obtained using the suggested model not only demonstrate the risk level of rockburst intensity accurately but also further determine the risk grade ranking for different samples at the same level.
However the provided model still has some shortcomings, such as complicated calculation, and multiple variable parameters with the degree of difference that needs to be considered, which limit its application. Due to the comprehensiveness of assessment indexes, the assessment method strongly relies on actual data. In future work, gray incidence theory should be updated, only a small amount of data is required to predict the assessment results accurately. Therefore, the method still has great room for improvement in the future.
The raw data supporting the conclusion of this article will be made available by the authors, without undue reservation.
X-JZ: Funding acquisition, Formal Analysis, Project administration, Writing–review and editing. X-BG: Writing–original draft, Conceptualization, Investigation.
The author(s) declare financial support was received for the research, authorship, and/or publication of this article. This work is supported by Regional Innovation Cooperation Programs of Sichuan province (2021YFQ0050), the Opening Project of Sichuan Province University Key Laboratory of Bridge Non-destruction Detecting and Engineering Computing (2022QYJ02,2022QYY02), Key scientific research projects of colleges and universities in Henan province (23B560019).
The authors declare that the research was conducted in the absence of any commercial or financial relationships that could be construed as a potential conflict of interest.
All claims expressed in this article are solely those of the authors and do not necessarily represent those of their affiliated organizations, or those of the publisher, the editors and the reviewers. Any product that may be evaluated in this article, or claim that may be made by its manufacturer, is not guaranteed or endorsed by the publisher.
Chang-ping, W. (2008). Application of attribute synthetic evaluation system in prediction of possibility and classification of rock burst. Eng. Mech. 35 (6), 153–158.
Chen, H. J., Neng-hui, L., and Yue-quan, S. (2002). A model for prediction of rock burst by artificial neural network. Chin. J. Geotechnical Eng. 24 (2).
Chen, J. W., and Zhou, X. P. (2019). The enhanced extended finite element method for the propagation of complex branched cracks. Eng. Analysis Bound. Elem. 104, 46–62. doi:10.1016/j.enganabound.2019.03.028
Chen, X. T., and Li, L. (2008). Prediction of tunnel rockburst based on AHP-FUZZY method. J. China Coal Soc. 33 (11), 1230–1234.
Dong, L., Chen, J., Song, D., Wang, C., Liu, X., Liu, M., et al. (2022). Application of long-range cross-hole acoustic wave detection Technology in geotechnical engineering detection: case studies of tunnel-surrounding rock, foundation and subgrade. Sustainability 14, 16947. doi:10.3390/su142416947
Dong, L., WangSongChe, H. D. J., and Liu, C. (2023). Analysis of the catastrophe mechanism and treatment countermeasures of a sudden water inrush disaster in a long and deeply buried tunnel in the karst area. J. Perform. Constr. Facil. 37 (6). doi:10.1061/jpcfev.cfeng-4349
Feng, X. T. (2000). Introduction of intelligent rock mechanics. Beijing, China: Publishing House of Science.
Fu, C. H., and Dong, L. J. (2009). Bayes discriminant analysis model and its application to the prediction and classification of rock burst. J. China Univ. Min. Technol. 38 (4), 56–64.
Fujii, Y., Ishijima, Y., and Deguchi, G. (1997). Prediction of coal face rockbursts and microseismicity in deep longwall coal mining. Int. J. Rock Mech. Min. Sci. 34 (1), 85–96. doi:10.1016/s1365-1609(97)80035-4
Gong, F. Q., Li, X. B., and Lin, H. (2007). Model of distance discriminant analysis for rock burst prediction in tunnel engineering and its application. China Railw. Sci. 28 (4), 25–28.
Gu, X. B., Ma, Y., Wu, Q. H., Ji, X. J., and Bai, H. (2021a). The risk assessment of landslide hazards in Shiwangmiao based on intuitionistic fuzzy sets-Topsis model. Nat. Hazards 111, 283–303. doi:10.1007/s11069-021-05053-5
Gu, X. B., Shao, J. L., Wu, S. T., Wu, Q. H., and Bai, H. (2021b). The risk assessment of debris flow hazards in zhouqu based on the projection pursuit classification model. Geotechnical Geol. Eng. 8, 4–17.
Gu, X. B., Wang, L., and Wu, Q. H. (2022b). The risk assessment of debris flow in the duba river watershed using intuitionistic fuzzy sets: TOPSIS model. Math. Problems Eng. 2022, 1–12. doi:10.1155/2022/2031907
Gu, X. B., and Wu, Q. H. (2016). The application of nonordinary, state-based peridynamic theory on the damage process of the Advances in Materials Science and Engineering rock-like materials. Math. Problems Eng. 3 (8), 1–9.
Gu, X. B., and Wu, Q. H. (2019). Seismic stability analysis of waterfront rock slopes using the modified pseudodynamic method. Geotech. Geol. Eng. 37 (3), 1743–1753. doi:10.1007/s10706-018-0718-1
Gu, X. B., Wu, Q. H., and Ma, Y. (2022a). Risk assessment of the rockburst intensity in a hydraulic tunnel using an intuitionistic fuzzy sets-TOPSIS model. Adv. Mater. Sci. Eng. 2022, 1–14. doi:10.1155/2022/4774978
Gu, X. B., Wu, S. T., Ji, X. J., and Zhu, Y. H. (2021c). The risk assessment of debris flow hazards in Banshanmen gully based on the entropy weight normal cloud method. Adv. Civ. Eng. 2021, 1–11. doi:10.1155/2021/8841310
Long-fei, Z. (2023). Study on prediction model of rockburst intensity level based on entropy weight method-LGBM algorithm. INDUSTRIAL MINERALS Process. 52 (10), 39–45.
Song, D., Chen, Z., Guo, Z., Liu, M., Tang, J., and Jiang, X. (2023). Numerical investigation of the dynamic response characteristics of rock mass slopes containing double-hole tunnels subject to seismic excitation. Arab. J. Geosci. 16, 430. doi:10.1007/s12517-023-11554-3
Wang, J. A., and Park, H. D. (2001). Comprehensive prediction of rock burst based on analysis of strain energy in rocks. Tunneling Undergr. Space Technol. 41, 49–57. doi:10.1016/s0886-7798(01)00030-x
Wang, L., Xue, Y., Cao, Z., Kong, H., Han, J., and Zhang, Z. (2023b). Experimental study on mode I fracture characteristics of granite after low temperature cooling with liquid nitrogen. Water 15, 3442. doi:10.3390/w15193442
Wang, L., Zhang, W., Cao, Z., Xue, Y., Liu, J., Zhou, Y., et al. (2023a). Effect of weakening characteristics of mechanical properties of granite under the action of liquid nitrogen. Front. Ecol. Evol. 11, 1249617. doi:10.3389/fevo.2023.1249617
Wang, W. T. (2023). Prediction of rock burst intensity based on SSA-BP neural network. Non-ferrous Metal. 76 (1), 79–86. doi:10.3969/j.issn.1671-4672.2024.01.001
Wei, L., Dang, F., Ding, J., Wu, X., Li, J., and Cao, Z. (2023). An analysis of thixotropic micropore variation and its mechanism in loess. Front. Ecol. Evol. 11, 1242462. doi:10.3389/fevo.2023.1242462
Xie, X. B., and Chang-liang, P. (2007). Rock burst prediction method based on grey whitenization weight function cluster theory. J. Hunan Univ. Nat. Sci. 34 (8).
Zhang, S., Dai, L., and Xiaohu, Y. (2022). Fuzzy comprehensive prediction model of rock burst disaster in deep underground engineering. J. Luoyang Inst. Sci. Technol. 32 (3), 17–21.
Zhou, J., Li, X., and Shi, X. (2012). Long-term prediction model of rockburst in underground openings using heuristic algorithms and support vector machines. Saf. Sci. 50 (4), 629–644. doi:10.1016/j.ssci.2011.08.065
Zhou, K. P., and Gu, D. S. (2004). Application of GIS based on neural network with FUZZY self-organization to assessment of rock burst tendency. Chin. J. Rock Mech. Eng. 23 (18), 3093–3097.
Zhou, R., Wei, Z. Y., Zhang, Y. B., and Zhang, S. (2017). A prediction of reference crop evapotranspiration based on generalized regression neural network and particle swarm optimization algorithm. China Rural Water Hydropower 6, 1–7.
Zhou, X. P., Gu, X. B., and Qian, Q. H. (2016). Seismic bearing capacity of shallow foundations resting on rock masses subjected to seismic loads. KSCE J. Civ. Eng. 20 (1), 216–228. doi:10.1007/s12205-015-0283-6
Zhou, X. P., Pan, X. K., and Cheng, H. (2021). The nonlinear creep behaviors of sandstone under the different confining pressures based on NMR Technology. Rock Mech. Rock Eng. 54 (9), 4889–4904. doi:10.1007/s00603-021-02557-1
Keywords: assessment, rockburst intensity, evidence-entropy, weight gray incidence theory, risk level
Citation: Zhang X-J and Gu X-B (2023) The application of evidence-entropy weight gray incidence theory on the risk assessment of rockburst intensity in the Daxiangling tunnel. Front. Earth Sci. 11:1284243. doi: 10.3389/feart.2023.1284243
Received: 28 August 2023; Accepted: 17 November 2023;
Published: 28 December 2023.
Edited by:
Yi Xue, Xi’an University of Technology, ChinaReviewed by:
Danqing Song, South China University of Technology, ChinaCopyright © 2023 Zhang and Gu. This is an open-access article distributed under the terms of the Creative Commons Attribution License (CC BY). The use, distribution or reproduction in other forums is permitted, provided the original author(s) and the copyright owner(s) are credited and that the original publication in this journal is cited, in accordance with accepted academic practice. No use, distribution or reproduction is permitted which does not comply with these terms.
*Correspondence: Xin-Bao Gu, MTU4MjM0MDU5NTJAMTYzLmNvbQ==
Disclaimer: All claims expressed in this article are solely those of the authors and do not necessarily represent those of their affiliated organizations, or those of the publisher, the editors and the reviewers. Any product that may be evaluated in this article or claim that may be made by its manufacturer is not guaranteed or endorsed by the publisher.
Research integrity at Frontiers
Learn more about the work of our research integrity team to safeguard the quality of each article we publish.