
94% of researchers rate our articles as excellent or good
Learn more about the work of our research integrity team to safeguard the quality of each article we publish.
Find out more
ORIGINAL RESEARCH article
Front. Earth Sci., 20 December 2023
Sec. Solid Earth Geophysics
Volume 11 - 2023 | https://doi.org/10.3389/feart.2023.1280414
This article is part of the Research TopicAdvanced Methods for Interpreting Geological and Geophysical DataView all 36 articles
 Mohamed Moustapha Ndam Njikam1*Mbida Yem2Alessandra Ribodetti3
 Ahmed Mohamed4*Aboubacar Soumah5Moaboulou Prosper Junior2Saad S. Alarifi6
 Ahmed Abdelrady7*
The present work used the electrical resistivity approach to conduct a three-dimensional modeling and initial volume estimation of the limestone layer in the Mintom region located in southern Cameroon. In order to achieve the objectives of the study, a total of 21 electrical soundings spaced 250 m were first collected in the field using the Schlumberger array. These soundings were conducted along three profiles oriented in an east–west direction, spaced 500 m. Additionally, a geological survey was conducted to identify and emphasize the presence of limestone formations within the designated study region. The interpretation of the sounding data was conducted based on the analysis of the sounding curves. The interpretation outcomes, specifically resistivity and thickness, were compared with the geological field data, resulting in the development of lithostratigraphic logs for each sounding. The geological sections were constructed using the logs of the designated profile. The lithological logs were utilized to establish a lithological interface model and calculate the volume of the limestone layer at 260 ± 13 × 106 m3, utilizing the inverse distance method built into RockWorks software. A resistivity value is assigned to each geological layer in a sounding curve, allowing for the development of a resistivity variation model specific to the limestone layer. The proposed model facilitates the categorization of limestone layers based on their resistivity variations, thus serving as a fundamental reference for prospective exploratory activities within the designated study region. Our integrated approach provides a replicable model for a better understanding of the limestone reserve and effective management of this valuable resource.
Limestone serves as a primary constituent in the production of cement. Additionally, it has the potential for utilization in the production of asphalt filler, ceramics, flux in glass manufacturing, fertilizer filler, and various other applications (Fatoye and Gideon, 2013). Generally, carbonate rocks are well recognized as significant host rocks for hydrocarbon reserves on a regional scale. According to the work of Carrera et al. (2018), carbonate reservoirs are estimated to have approximately 60% of the global oil reserves and 40% of the gas reserves. Furthermore, it should be noted that carbonates, specifically limestone, are known to constitute some of the most highly productive groundwater aquifers found on earth. The unusually high transmissivity of the phenomenon can be attributed to the development of secondary porosity and permeability, as discussed by Fryar (2021). Limestone and marble serve as primary constituents to produce cement and represent vital resources for nations experiencing rapid growth (Anakwuba et al., 2018). Several African countries are making positive efforts to promote the rapid growth in the mineral and non-oil sectors and expand agricultural activities. Many research investigations have been conducted to examine the reserves, purity, engineering characteristics, and economic importance of limestone, owing to its significant global economic significance. According to the work of Gusman et al. (2019), limestone is a primary and predominant constituent in the cement manufacturing process, requiring appropriate quality to ensure the production of high-quality cement products. In another recent study, Osman et al. (2022) employed a comprehensive approach that incorporated many datasets and methodologies to investigate the detailed structural, petrophysical, and facies properties of the Brown Limestone formation located in the Geisum oil field of the Gulf of Suez. Their aim was to precisely determine the complicated geometry of these features in a three-dimensional context. Mallick et al. (2020) employed the inverse square distance weighting and standard kriging techniques to estimate the limestone reserve for the mining business. Hassan (2022) made an assessment to determine the limestone reserve in the Nfayil Formation, with the purpose of evaluating its potential utilization in engineering projects, construction, and industrial applications. Hence, the research collectively demonstrates the significant economic value associated with limestone deposits worldwide.
The Mintom limestone basin, also known as the upper Dja series, holds significant importance as a valuable reservoir of raw materials, particularly for enterprises specializing in the manufacturing of cement and other derivatives derived from limestone. Nevertheless, there is a lack of documentation or reports that provide an estimation of the quantity of limestone resources present in the study region. Considering the significant commercial importance of the mining sector, it is important to conduct an initial assessment of the quantity of this resource. This evaluation is crucial not only to facilitate the accessibility of limestone, a vital raw material for various industries, but also to promote the further exploration and exploitation of the mining potential in this specific region of the country. However, the assessment of this occurrence cannot be simply dependent on geological field work; it requires the incorporation of modern methodologies like geophysics. Geological field observations, in reality, rely mostly on exposed geological formations, making them inadequate for an initial evaluation of resources due to their inability to provide insights into the resource’s continuity at depth or in places with significant alteration or overgrowth. The integration of the geophysical methodology with geological observations offers valuable additional information through the examination of geophysical responses at various depths. Geophysical exploration is employed within the mining industry to locate zones characterized by substantial concentrations of mineral substances and quarries (Šumanovac and Weisser, 2001; Hodlur et al., 2006; Sikandar et al., 2010; Abraham et al., 2013; Akpan et al., 2014; Aizebeokhai and Oyeyemi, 2015; Adebiyi et al., 2018; Rusydy et al., 2020; Hibi et al., 2021; Taha et al., 2021; Yu et al., 2021; Ren et al., 2022; Peng et al., 2022; Liu et al., 2023; Mohamed et al., 2023; Liu et al., 2023; Chen et al., 2023). Various geophysical methods, such as gravity, magnetometry, electrical, and seismic techniques, are accessible for exploration purposes. The selection of a specific method is dependent on various factors, including the project’s objectives, the characteristics and depth of the mineralization zone, the project’s environmental conditions, and the available resources (Akpan et al., 2015a; Ekwok et al., 2020, 2021; Ebong, 2021a., 2021b; Melouah et al., 2021; Zhou et al., 2021). The study region is situated within a sedimentary basin characterized by predominantly horizontal layers comprising the terrain. In light of this reason, the present study employed the vertical electrical sounding (VES) approach. Indeed, Chouteau (2006) and Marescot (2008) indicate that this method (VES) is only really useful for studying geological levels that are close to each other in sedimentary areas where geological layers can be continuous over several meters or kilometers. The utilization of this technique is regarded as beneficial owing to its cost efficiency in carrying out studies and its straightforward implementation (Ebong et al., 2014; Akpan et al., 2016; Ebong et al., 2021b). The methodology involves measuring the apparent resistivity of the subsurface in relation to depth by systematically changing the distance between the electrodes during each measurement. This methodology is frequently employed in several studies to estimate the thickness of geological formations within sedimentary regions and for the investigation and evaluation of hydrogeological resources (Song et al., 2007; Balkaya et al., 2009; Sikandar et al., 2010; Asfahani, 2013; Ndougsa-Mbarga et al., 2014; Asfahani, 2016; Njueya et al., 2016; Arsène et al., 2018; Hu et al., 2023). The objective of this work is to establish the feasibility of utilizing the vertical electrical sounding approach for three-dimensional modeling and initial volume estimation of a resource within a sedimentary region characterized by horizontal and relatively homogeneous strata. The scope of this study will encompass a specific region inside the Mintom limestone basin, namely, Dja-et-Lobo in southern Cameroon.
The geographical location of the study area is situated in Mintom, which is within the Dja-et-Lobo division in southern Cameroon. It lies between meridians 13°20′-13°26′ East and parallels 02°42′-02°46′ North. The study site covers approximately 11 km2 and exhibits a gently sloping topography with varying altitudes ranging from 560 to 605 m (Figure 1). These altitudes are typical of the minimal topographical fluctuations commonly reported in the Mintom region as a whole (Figure 2). The analysis of prior research indicates that the geographical region under investigation is situated within the Mintom limestone basin (Figure 3). This basin is delimited to the north by the Pan-African nappe and to the south by the Congo Craton (Lassere, 1961; Viguier, 1990; Vicat, 1998; Toteu et al., 2008; Caron et al., 2010; Caron et al., 2011; Philémon et al., 2016; Engon et al., 2017; Sadrac et al., 2021).
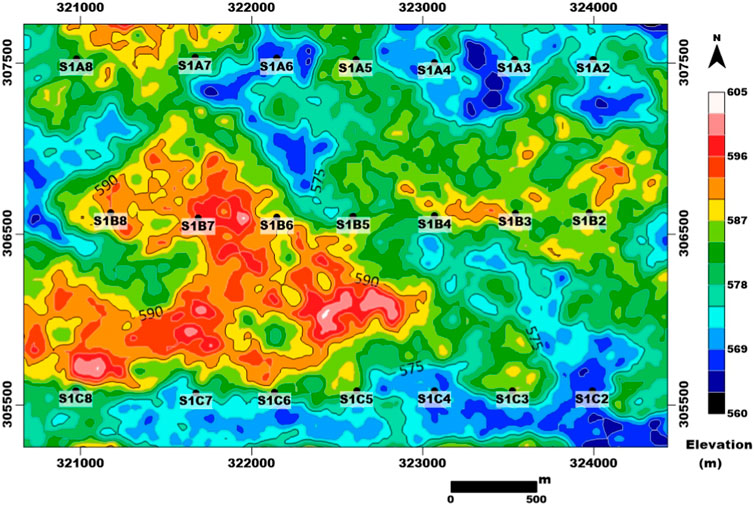
FIGURE 1. Topographic variation in the study area and distribution of electrical sounding points.
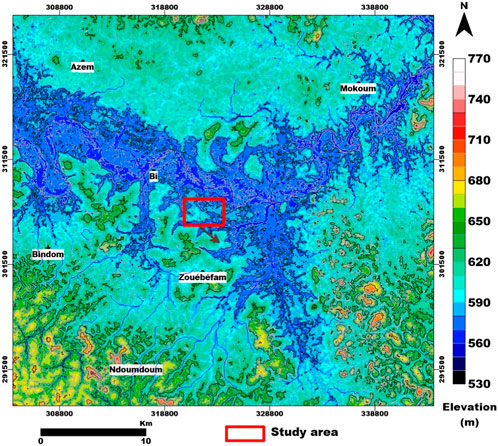
FIGURE 2. Orohydrographic model showing the location of the study area in the large Mintom watershed.
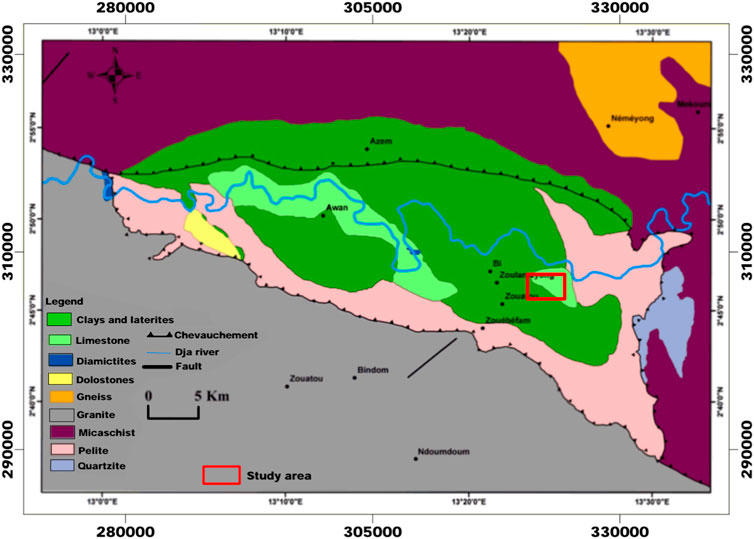
FIGURE 3. Geological map of Mintom (modified according to the work of Viguier 1990).
The Mintom sedimentary basin was initially observed and documented in Cameroon by an Anonyme (1939). In Bruet 1951 made an attempt to establish the boundaries of this particular sedimentary basin. The upper Dja series, which refers to the basin under investigation in this geological study, has been further examined by other scientists. Their findings indicate that the basin is bounded to the north by the Pan-African nappe and to the south by the Congo Craton (Lassere, 1961; Viguier, 1990; Vicat, 1998; Toteu et al., 2008; Caron et al., 2010; Caron et al., 2011) (see Figure 3). Based on the findings of these studies, it has been determined that the upper Dja series has an unconformable nature. Furthermore, in its northern region, it is observed to be overlapped by the Pan-African Yaoundé nappe. The southward movement of the Yaoundé nappe is believed to have impacted the succession, resulting in deformation along its northern boundary (Caron et al., 2011). The correlation can be observed with the schisto-limestone formation of the West Congolian Supergroup, which has been dated to the Neoproterozoic period spanning from 650 to 630 Ma, as indicated by Caron et al. (2011).
Vanhoutte et al. (1986) conducted a study to assess the Mintom limestone. The study reveals that the Mintom sedimentary basin mostly consists of limestones, dolomites, and pelites, which are the prominent rock formations. The basin exhibits a maximum thickness of 183 m. The evaporitic succession exhibits a distinctive feature in the form of reddish-purple pelites. The pelites are situated in an unconformable relationship with the underlying granitic basement. This contact is characterized by a silicified aureole. The transition from pelites to limestones is progressive and passes to marl-clay facies, then marl-limestone, and finally, limestone. Studies carried out by Caron et al. (2011) led to the upper Dja series being divided into four lithological units, which are, from bottom to top, Kol unit, which is made of diamictite at the bottom and pelite at the top; Metou unit, which is formed of massive dolomite; Mominbolé unit, which is composed of alternating layers of pelitic limestone and clay; and Atog Adjap unit, which is made up of light limestone and a yellowish gray band. Other sedimentological and paleoenvironmental studies have been carried out in this basin (Caron et al., 2010, 2011; Ekomane, 2010); petrological and physico-mechanical characterizations of the rocks in this basin have also been studied with a view toward industrial use (Anonyme, 2008; Anonymous, 2012; Moussango et al., 2012; Zo’o Zame, 2013). According to these authors and based on various observations made at outcrops and interpretations of data from boreholes and wells, the sedimentary basin of Mintom presents the following stratigraphic succession from top to bottom: a detrital ± clayey layer, friable and sticky; a layer of carbonate rocks, followed by a pelitic layer; and the granodioritic basement.
The carbonate layers exhibit three primary facies: a dense limestone abundant in CaO, which has potential as a raw material for cement or hydraulic lime production; a stratified limestone characterized by alternating light and dark beds, commonly employed in ceramics; and lastly, a dolomite variant utilized as a soil amendment for the purpose of fertilizing acidic soils. The observed geological formations consist of many manifestations, including escarpments and slabs located along the banks and within the riverbed, as well as isolated blocks that have been colonized by mosses. According to the studies conducted by Bekoa (1994), Bitom (1998), and Nyeck (2005), it has been observed that the predominant geological formations within this basin consist of shales, dolomites, and limestones. These formations are found to be covered by clays and laterites. According to Viguier’s (1990) findings, the primary geological formations observed in the research region predominantly comprise clays, laterites, and limestones, which are situated above a granito-gneissic basement (Figure 3).
The Mintom limestone basin has been attributed to tectonic subsidence, as shown by Lassere (1961), Viguier (1990), Vicat (1998), and Toteu et al. (2008). This subsidence is believed to be related to two fault systems: one aligned between N0°E and N45°E and the other between N90°E and N150°E. The observed deformation on the basin scale is indicative of block collapse, which is accompanied by significant displacements that are preserved by the creation of sigmoidal bands and soil erosion processes (Figure 3). An analysis of the structural connections between the two fault systems reveals that the geodynamic development of the Mintom limestone basin has experienced two distinct deformation patterns. These include a distensional strike–slip regime occurring in the later stages of Pan-African tectonic events and a compressional strike–slip regime observed during the reactivation phases in the Late Cretaceous and Tertiary periods. This observation matches the findings of Vicat (1998).
The vertical electrical sounding technique is a method of electrical sounding that relies on the measurement of electrical resistivity (ρ) in Ohm.m (Ω.m). This parameter represents the material’s capacity to impede the flow of electrical current. The resistivity, denoted as the inverse of the electrical conductivity σ (measured in Siemens/m), is derived from the principles of Ohm’s law (Telford et al., 1990). The process of electrical prospecting involves the injection of an electric current into the subsurface using two electrodes, namely, A and B, which are referred to as current electrodes. This current induces the formation of an electric field, the characteristics of which are dependent on the spatial arrangement of the subterranean topography (Figure 4A). Two additional electrodes, M and N, referred to as potential electrodes, are utilized to measure the voltage difference (∆V) generated by the electric field. By utilizing the known current intensity (I) and measuring the potential difference (∆V), it becomes possible to determine the apparent resistivity (ρa) of the soil. The resistivity (ρa), which is dependent on the specific measurement array employed, can be computed using Eq. 1 (Telford et al., 1990). The resistivity values acquired will consequently be dependent on the geological formations encountered, while the depth of investigation achieved by the current networks will be dependent on the electrode design and quadripole dimension (Chouteau, 2006; Marescot, 2008; Akpan et al., 2015b; Ebong et al., 2017; Akpan et al., 2018; Geotomo, 2018; Ndubueze et al., 2019).
where ρa is expressed in Ω.m and K (in m) refers to the geometric or form factor, depending on the array used. K can be calculated using the following equation:
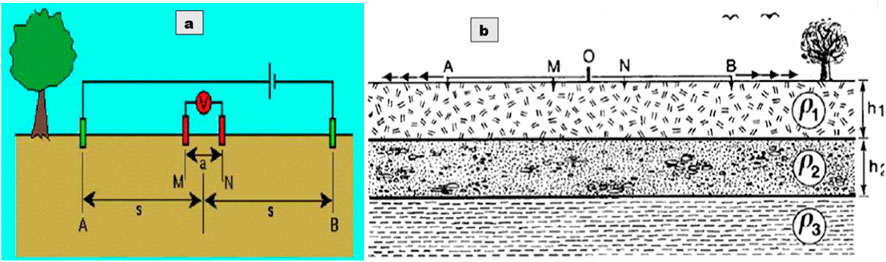
FIGURE 4. (A) Electrode configuration in the Schlumberger array (Abraham et al., 2013); (B) implementation of electrical soundings using the Schlumberger array (Chouteau, 2006).
The VES method is a specific approach employed in the field of electrical prospecting. During electrical sounding implementation, an examination is conducted to determine the vertical variation of subsoil resistivity at a certain location on Earth’s surface. In order to accomplish this, a series of measurements is conducted at a fixed location, progressively expanding the array’s dimensions with each iteration. Consequently, the depth of research also increases proportionally, as depicted in Figure 4B. At this point, a more substantial section of the ground is being examined, allowing for the identification of variations in geological composition along the vertical axis. Various types of classical arrays, such as Schlumberger, Wenner, and dipole–dipole, can be employed for conducting measurements. However, for the purposes of this investigation, the Schlumberger array was specifically employed (Figure 4B). It is important to acknowledge that the VES method is typically employed with precision only in cases where the topography comprises predominantly horizontal and laterally consistent strata (Chouteau, 2006; Marescot, 2008; Egbai, 2011; Mahammed, 2012; Ndougsa-Mbarga et al., 2014; Almeida et al., 2021). In order to accurately capture the depth-dependent fluctuations in resistivity during an electrical survey, it is imperative to ensure that the results remain unaffected by horizontal variations. This approach is particularly well suited for sedimentary terrain, as sedimentary layers can maintain a consistent uniformity across extended horizontal distances, as observed in this study.
The resistivity data used in this investigation were acquired using geophysical surveys that employed electrical sounding techniques conducted in the subject area. The measurements were performed along three profiles oriented in the east–west direction and separated at regular intervals of 500 m (see Figure 1). The decision to choose a 250-m spacing between sounding stations was made after significant consideration, taking into account the distinctive features of the research area, predominantly composed of sedimentary terrain. The data collection process was conducted utilizing the Abem SAS 300 resistivity meter along with a Schlumberger array. A total of 21 soundings were performed, wherein each profile encompassed seven sounding stations (Figure 1). The geographical coordinates, including longitude, latitude, and elevation, for each sounding point were documented using a Garmin GPS device.
Concurrently with the acquisition of electrical survey data, a geological survey was conducted both within and in the neighboring region of the designated research area. The primary aim was to collect an extensive range of geological data to provide an adequate basis for the analysis and interpretation of various geophysical observations.
The processing and analysis of the electrical sounding data were conducted using “IPI2win” software. The underlying principle of this software lies in the observation that the characteristics of curves derived from electrical sounding across stratified layers are influenced by the resistivity, thickness of the layers, and configuration of the measuring array. The fundamental strategy involves graphing the observed apparent resistivity (ρa) against the half distance between the current electrodes (AB/2) on a bi-logarithmic paper and then analyzing the resulting curve using several interpretive methods. These interpretative approaches are based on the geological context and existing resistivity charts (Chouteau, 2006; Marescot, 2008). The application of quantitative interpretation allows for the reconstruction of a geoelectric section of the subsurface based on the provided sounding curve. In this process, each formation is defined by its thickness and resistivity. The nomenclature assigned to each layer will be established by careful analysis of geological field observations. The generation of lithostratigraphic logs will be conducted using the data obtained from the interpretation of sounding curves. Geological sections were built for each profile utilizing the logs acquired from the selected profile in August 2004. A three-dimensional model was created to depict the interfaces of lithological layers. This model was developed by correlating the boundaries of geological formations using several interpreted logs. The modeling procedure will be executed using the deterministic inverse distance technique, which will be integrated into the RockWorks program. The application of this methodology will enable RockWorks to generate an approximation of the volume associated with the specified limestone layer. The software program automatically provides the estimation error. It employs a calculation method that determines inaccuracy by comparing the true and estimated values at a certain point X. The resistivity values entered into the database are regarded as accurate representations of the real resistivity values at each specified point X, as per the software’s interpretation. The inverse distance procedure is utilized by the software to estimate a new resistivity value for each point X. The estimation error at point X is determined by calculating the difference between the actual and estimated values at point X. The estimation error for the volume under consideration is determined by calculating the average error. A three-dimensional resistivity model was constructed to represent the limestone layer under study, wherein each layer inside the model was assigned a unique resistivity value. The implementation of a discretization technique to partition the model into distinct resistivity zones will significantly improve the feasibility of forthcoming limestone exploration efforts within the designated study area.
The main limestone outcrops encountered during field work were observed approximately 650 m downstream of the study area at the confluence of the Dja and Ebe rivers (Figure 5A). These massive outcrops have a gray color and are sometimes laminated (Figure 5B). In the study area, only clays (Figure 5C) and laterites (Figure 5D) were observed, along with a thick layer of soil that was darkened by dead plants. Both structures are covered with a layer of black soil, so you have to dig to get a sample. The absence of limestone outcrops within the study area can be justified by its location (upstream) from the main outcrops identified downstream. This seems to show that the main layers above the limestone layer in the study area are clays and laterites. Based on the subdivisions of the upper Dja series by Caron et al. (2011), this analysis shows that the study area is in the Mominbolé unit. All of these facts were important in deciphering the information revealed by the electrical sounding shapes.
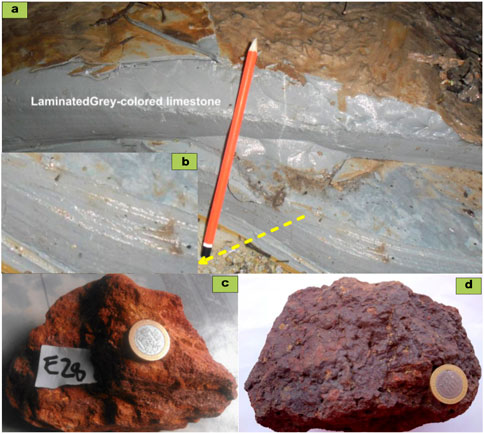
FIGURE 5. (A) Limestone outcrop; (B) laminated facies; (C) solid clay sample; and (D) laterite sample.
After recognizing the existence of the limestone formations on the surface and in order to understand their vertical and horizontal extensions, the sounding data were processed using IPI2win software. The processing consisted mainly in elaborating the different sounding curves by representing in the bi-logarithmic space proposed by this program the various values of resistivity according to the half distance between the current electrodes (AB/2). In reality, the resistivity measured in the field is not the real resistivity but corresponds to the combination of the resistivities of the different layers investigated according to the depth of investigation. The sounding curve was the base data used to determine the terrain model associated with each of the 21 soundings by incremental adjustment of a fixed initial model. The result of figuring out how each sounding curve should be interpreted is a resistivity/thickness (or depth) model (Figures 6A, B). Each thickness layer was named based on the existing resistivity charts and geological observations made in the field.
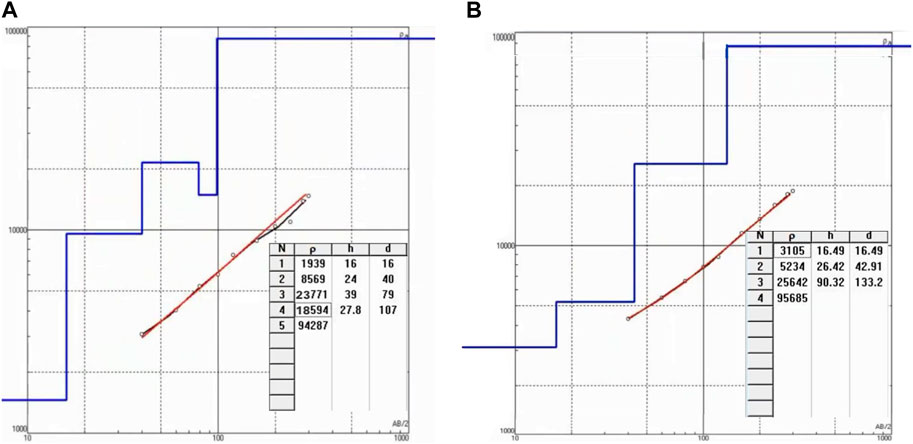
FIGURE 6. Example of interpreted resistivity/depth model for S1A8 (A) and S1C2 (B) electrical soundings corresponding to a succession of five layers (S1A8) and four layers (S1C2).
By integrating the findings from the interpretation of the 21 sounding curves with geological field observations, we were able to develop two sequential models of geological formations in the study area. These models, depicted in Figure 7, illustrate the vertical arrangement of the formations. The first model demonstrates the limestone layer overlaying a fractured bedrock (Figure 7A), while the second model depicts the limestone layer resting on an unchanged bedrock (Figure 7B). In each of these models, the limestone substrate is covered by a comprehensive layer of clays and lateritic shells, in addition to a layer of weathered limestone (Figure 7). The geometry of each of the interpreted sounding curves, as depicted in Figures 6A, B, has a distinct pattern resembling stair steps. This shape is indicative of sedimentary zones. The fractured bedrock exhibits a notable decline in resistivity following the limestone layer, as depicted in Figures 6A, 7A. The interpretation outcomes are aligned with either of the two geological layer succession scenarios depicted in Figure 7. By acquiring knowledge of the vertical arrangement of geological formations associated with each of the 21 sounding points, it becomes possible to generate a choice of alternative models.
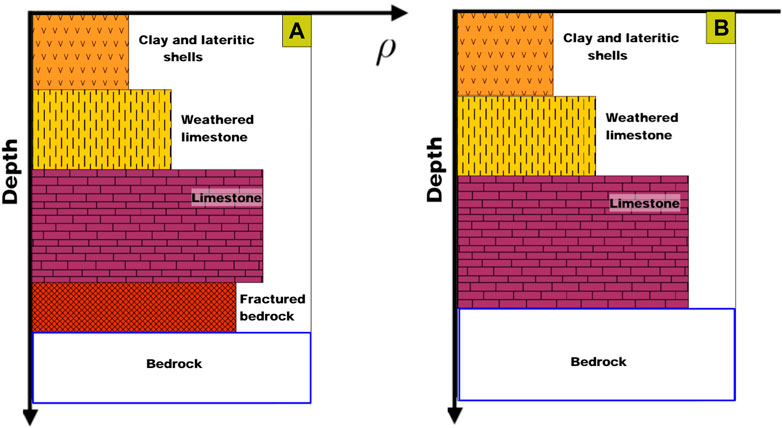
FIGURE 7. Succession of layers in the study area obtained from the interpretation of the sounding curves: (A) five-layer model; (B) four-layer model.
Based on the analysis of the sounding curves, the vertical arrangement of the geological formations at each sounding location has been determined, enabling the development of distinct lithostratigraphic logs (Figures 8–10). A careful methodology was employed to perform a lateral correlation of the lithostratigraphic logs for each sounding profile, taking into account the georeferenced location and known topography of each sounding point (Figures 8–10). In the context of analyzing survey data, it is essential to adhere to the two fundamental principles outlined in the August 2004 logs. These principles govern the relationships between various components and are crucial for accurate interpretation. First, within a model, a horizon (representing a lithological layer) cannot have a free edge, whereas a fault can. Second, it is essential to ensure that the boundaries of lithological layers do not intersect with each other. While analyzing the isolated sounding data, it is not possible to definitively interpret the many interfaces between the formations that were crossed. The principle of interpretation employed in this work for delineating the various geological horizons depends on two distinct criteria:
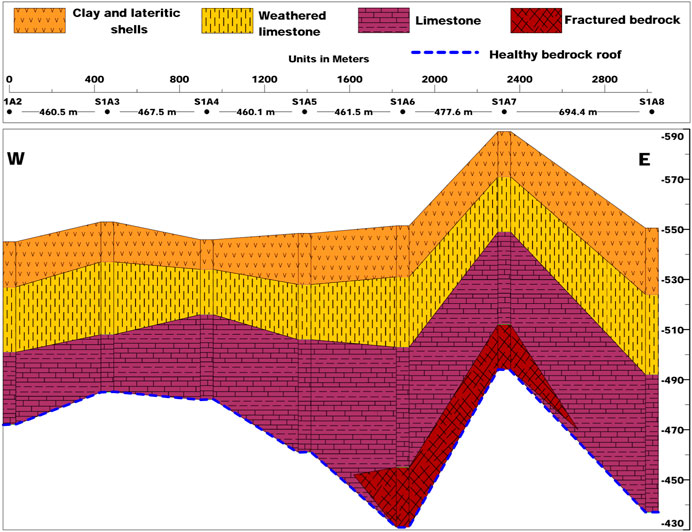
FIGURE 8. Lithostratigraphic section of line A.
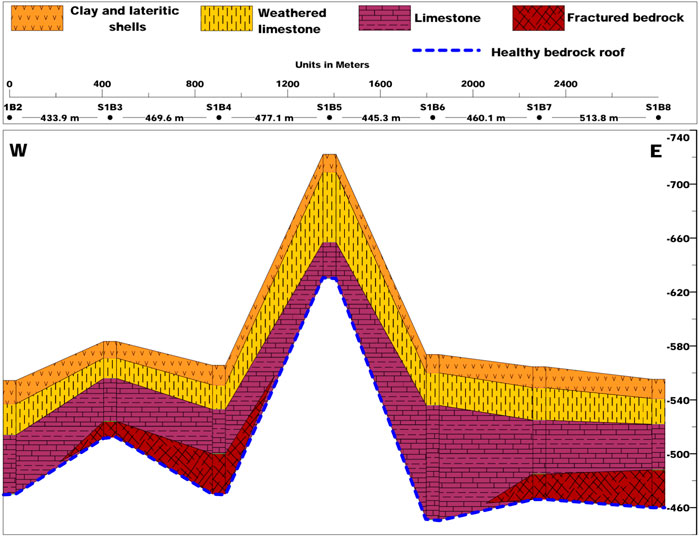
FIGURE 9. Lithostratigraphic section of line B.
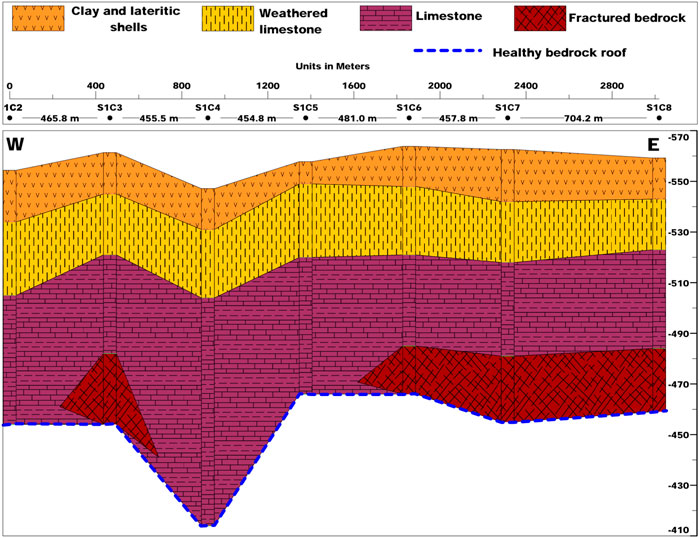
FIGURE 10. Lithostratigraphic section of line C.
The sequential arrangement of geological strata as inferred from the sounding curves.
The study focuses on the topological relationships among the different components comprising the stratigraphic sequence.
Two distinct types of surfaces are identified in this context: the erosional surface (EROD) and the overlaying or depositional surface (ONLAP). To achieve a comprehensive interpretation of the lithologic pile, it is essential to initially establish the boundaries outlining the uppermost surfaces of the erosion surfaces (EROD). Subsequently, the placement of the overlying layers (ONLAP) should be carefully executed, ensuring strict adherence to the principle that the ONLAP and EROD formations must not intersect (as stated by rule number 2, as previously mentioned).
By georeferencing the sounding curves and analyzing their 3D distribution (Figure 11), the lithostratigraphic logs can be interpreted to provide a 3D correlation of the boundaries between different lithological layers. Therefore, the utilization of this volumetric model enables the estimation of the volume of the required limestone layer. The RockWorks program was utilized to apply the modeling approach to all the logs within the research region. The volume model obtained is depicted in Figure 12, and the limestone layer’s volume, determined using the deterministic inverse distance technique integrated into this software, is estimated to be 260 ± 13 × 106 m3. This is based on an average error of 5% between the true and estimated resistivity values at each point X. Furthermore, by analyzing the sounding curves, a resistivity value was attributed to every fresh limestone layer in each sounding. This enabled the creation of a model that represents the fluctuation in resistivity corresponding to the fresh limestone layer (Figure 13). The final model holds significant importance as it can be utilized for the classification of limestone compartments based on the desired minimum composition of the limestone, particularly during the sampling and analysis stages. The modeling approach employed in this work demonstrates the utility of electrical soundings in investigating geological environments of this nature. When there is minimal lateral variation of geological formations in sedimentary terrain, the survey technique developed in this study can be utilized effectively. The primary benefits are the reduction of fieldwork expenses, the rapid identification of potential drilling targets, and the estimation of the volume of these targets. This technique can be applied to similar geological and lithological conditions worldwide. This methodology has the potential to be utilized in comparable geological and lithological environments on a global scale. The availability of borehole data will facilitate the validation and verification of the resistivity measurements’ outcomes.
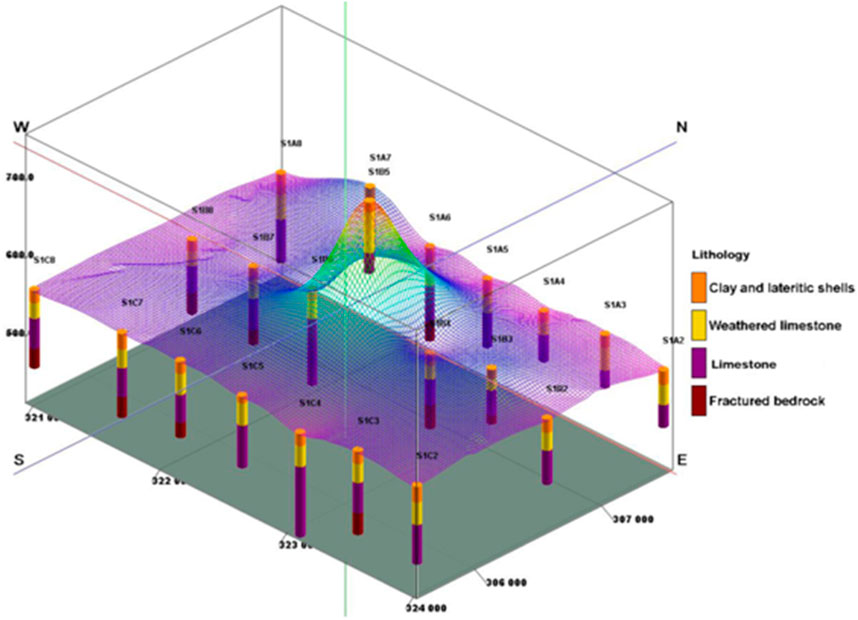
FIGURE 11. 3D distribution of lithostratigraphic logs in the study area.

FIGURE 12. 3D model of lithostratigraphic interfaces in the study area.
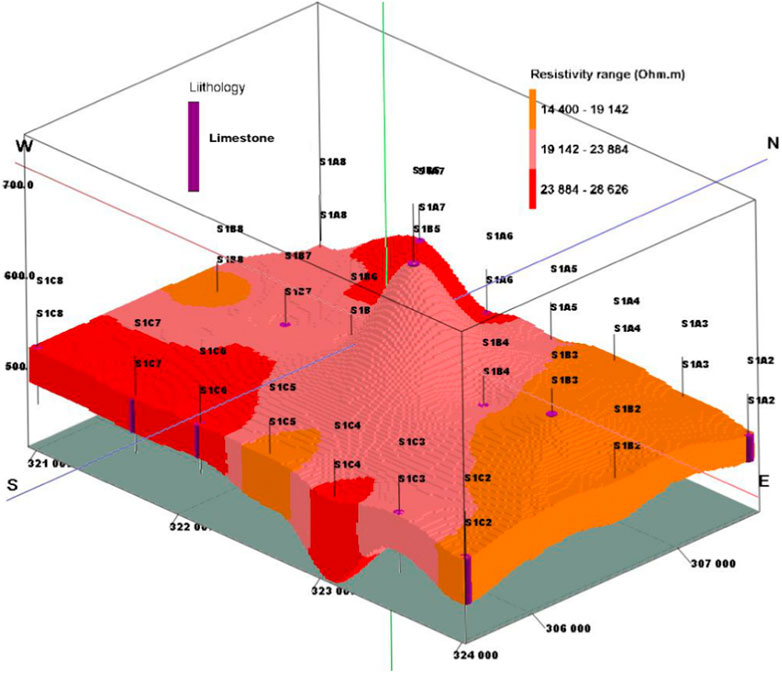
FIGURE 13. Model of resistivity variation associated with the limestone layer.
The present work integrates geological survey data with vertical electrical sounding data to perform 3D modeling and provide an initial calculation of the volume of the limestone layer inside a specific portion of the Mintom limestone domain. In the present investigation, a total of 21 electrical soundings were conducted along three E–W profiles in order to collect data. Simultaneously with the collection of the sounding data, a geological survey was conducted within and in the surrounding area of the research region, which revealed the presence of limestone formations. The sounding curves were utilized to analyze the collected sounding data. Analyzing each sounding curve results in the development of a resistivity/thickness model. The names for each thickness layer were determined by referencing existing resistivity charts and incorporating geological observations conducted in the field. The lithological sections of each profile were subsequently constructed based on the lithographic logs of the respective profile. A volume model of the lithological interfaces was constructed based on the 3D distribution of the various logs. Utilizing the inverse distance approach, the estimated volume of the limestone layer was determined to be 260 ± 13 × 106 m3. A 3D model depicting the fluctuation of resistivity associated with the fresh limestone layer has been constructed, utilizing the sounding curves to assign a resistivity value to each layer of sounding. The presented model illustrates the distinct compartments of limestone and can, therefore, serve as a reference model for sampling missions. This research demonstrates the success of the electrical sounding technique for conducting geological surveys in sedimentary zones in general, with a specific focus on limestone terrains. The acquired results have significantly enhanced our understanding of the limestone horizons in the studied area. The developed model could potentially serve as a foundational point of reference for future research efforts in the Mintom region. Additionally, it could contribute to the creation of reproducible models that can be easily implemented in similar regions across the globe.
The raw data supporting the conclusion of this article will be made available by the authors, without undue reservation.
MN: visualization, writing–review and editing, data curation, investigation, project administration, and writing–original draft. MY: visualization, writing–original draft, conceptualization, formal analysis, and supervision. AR: formal analysis, writing–original draft, investigation, methodology, and resources. AM: conceptualization, supervision, validation, visualization, and writing–review and editing. AS: conceptualization, resources, supervision, and writing–original draft. MJ: conceptualization, data curation, validation, visualization, and writing–original draft. SA: methodology, resources, software, and writing–review and editing. AA: conceptualization, formal analysis, methodology, resources, and writing–original draft.
The authors declare financial support was received for the research, authorship, and/or publication of this article.
This research was funded by Researchers Supporting Project number (RSP2023R496), King Saud University, Riyadh, Saudi Arabia.
The authors declare that the research was conducted in the absence of any commercial or financial relationships that could be construed as a potential conflict of interest.
All claims expressed in this article are solely those of the authors and do not necessarily represent those of their affiliated organizations, or those of the publisher, the editors, and the reviewers. Any product that may be evaluated in this article, or claim that may be made by its manufacturer, is not guaranteed or endorsed by the publisher.
Abraham, B., Yirgale, G. H., and Gebrehiwot, G. H. (2013). Application of vertical electrical sounding and horizontal profiling methods to decipher the existing subsurface stratification at river Segen dam site, Tigray, Northern Ethiopia. Int. J. Phys. Sci. 8, 922–933. doi:10.5897/IJPS2013.3896
Adebiyi, A. D., Ilugbo, S. O., Ajayi, C. A., Ojo, O. A., and Babadiya, E. G. (2018). Evaluation of pavement instability section using integrated geophysical and geotechnical methods in a sedimentary terrain. South. Niger. 14. doi:10.9734/AJOGER/2018/45647
Aizebeokhai, A. P., and Oyeyemi, K. D. (2015). Application of geoelectrical resistivity imaging and VLF-EM for subsurface characterization in a sedimentary terrain, Southwestern Nigeria. Arab. J. Geosci. 8, 4083–4099. doi:10.1007/s12517-014-1482-z
Akpan, A. E., Ebong, E. D., and Ekwok, S. E. (2015a). Assessment of the state of soils, shallow sediments and groundwater salinity in Abi, Cross River State, Nigeria. J. Environ. Earth Sci. 73, 8547–8563. doi:10.1007/s12665-015-4014-6
Akpan, A. E., Ebong, E. D., Ekwok, S. E., and Sackey, J. (2014). Geophysical and geological studies of the spread and industrial quality of Okurike Barite deposit. Am. J. Environ. Sci. 10 (6), 566–574. doi:10.3844/ajessp.2014.566.574
Akpan, A. E., Ebong, E. D., and Emeka, C. N. (2015b). Exploratory assessment of groundwater vulnerability to pollution in Abi, southeastern Nigeria, using geophysical and geologic techniques. J. Environ. Monit. Assess. 187 (4), 4380. doi:10.1007/s10661-015-4380-2
Akpan, A. E., Ekwok, S. E., and Ebong, E. D. (2016). Seasonal reversals in groundwater flow direction and its role in the recurrent Agwagune landslide problem: a geophysical and geological appraisal. J. Environ. Earth Sci. 75, 429. doi:10.1007/s12665-015-5043-x
Akpan, A. E., Ekwok, S. E., Ebong, E. D., George, A. M., and Okwueze, E. E. (2018). Coupled geophysical characterization of shallow fluvio-clastic sediments in Agwagune, southeastern Nigeria. J. Afr. Earth Sci. 143, 67–78. doi:10.1016/j.jafrearsci.2018.03.012
Almeida, A., Maciel, D. F., Sousa, K. F., Nascimento, C. T. C., and Koide, S. (2021). Vertical electrical sounding (VES) for estimation of hydraulic parameters in the porous aquifer. Water 13, 170. doi:10.3390/w13020170
Anakwuba, E. K., Ajaegwu, N. E., Ejeke, C. F., Onyekwelu, C. U., and Chinwuko, A. I. (2018). Sequence stratigraphic interpretation of parts of Anambra Basin, Nigeria using geophysical well logs and biostratigraphic data. J. Afr. Earth Sci. 139, 330–340. doi:10.1016/j.jafrearsci.2017.12.018
Anonyme, , 1939. Esquisse Géologique Provisoire De La Région Comprise Entre Bangui Et La Frontière Du Cameroun. Arch. géologiques French 164 p.
Anonymous, (2012). Prospection géologique des calcaires de Mintom, Sud-Est Cameroun. Institute for Geological and Mining Research. Madrid, Spain, Unpublised Reports I & II, 44.
Arsène, M., Wassouo Elvis, B. W., Daniel, G., Théophile, N. M., Kelian, K., and Daniel, N. J. (2018). Hydrogeophysical investigation for groundwater resources from electrical resistivity tomography and self-potential data in the méiganga area, adamawa, Cameroon. Int. J. Geophys. 2018, 1–14. doi:10.1155/2018/2697585
Asfahani, J. (2013). Groundwater potential estimation using vertical electrical sounding measurements in the semi-arid Khanasser Valley region, Syria. Hydrological Sci. J. 58, 468–482. doi:10.1080/02626667.2012.751109
Asfahani, J. (2016). Hydraulic parameters estimation by using an approach based on vertical electrical soundings (VES) in the semi-arid Khanasser valley region, Syria. J. Afr. Earth Sci. 117, 196–206. doi:10.1016/j.jafrearsci.2016.01.018
Aug, C. (2004).Modélisation géologique 3D et caractérisation des incertitudes par la méthode du champ de potentiel Thèse de doctorat/PHD. Paris-France: École Nationale Supérieure des Mines de Paris.
Balkaya, Ç., Kaya, M. A., and Göktürkler, G. (2009). Delineation of shallow resistivity structure in the city of Burdur, SW Turkey by vertical electrical sounding measurements. Environ. Geol. 57, 571–581. doi:10.1007/s00254-008-1326-9
Bekoa, E. (1994).Etude pétrologique et géochimique d’une couverture pédologique sur gneiss en zone forestière de l’Extrême Sud Cameroun: relation avec la dynamique du fer Thèse 3ème cycle. Univ. de Yaoundé, Cameroon, Yaoundé, 187.
Bitom, D. (1998).Organization and evolution of ferralitic coverage in the humid tropics (Cameroon). Genesis and set transformation ferruginous deep indurated Thesis. Poitiers, France: University of Poitiers, 164.
Bruet, E. (1951). Exploration géologique dans le Cameroun Oriental. Compte Rendu Académie Des. Sci. 233, 754–756.
Caron, V., Ekomane, E., Mahieux, G., Moussango, P., and Ndjeng, E. (2010). The Mintom formation (new): sedimentology and geochemistry of a neoproterozoic, paralic succession in south-east Cameroon. J. Afr. Earth Sci. 57, 367–385. doi:10.1016/j.jafrearsci.2009.11.006
Caron, V., Mahieux, G., Ekomane, E., Moussango, P., and Babinski, M. (2011). One, two or no record of late neoproterozoic glaciation in South-East Cameroon? J. Afr. Earth Sci. 59, 111–124. doi:10.1016/j.jafrearsci.2010.09.004
Carrera, M. F. L., Barbier, M., and Ravalec, M. L. (2018). Accounting for diagenesis overprint in carbonate reservoirs using parametrization techniques and optimization workflow for production data matching. J. Pet. Explor Prod. Technol. 8, 983–997.
Chen, J., Wen, L., Bi, C., Liu, Z., Liu, X., Yin, L., et al. (2023). Multifractal analysis of temporal and spatial characteristics of earthquakes in Eurasian seismic belt. Open Geosci. 15 (1). doi:10.1515/geo-2022-0482
Chouteau, M. B. (2006) Géophysique appliquée II: Méthodes électriques (Notes de cours). http://cbrosson.free.fr/Public/Divers/Master2pro/Cours_Doc/Univ_Laval/Cours_GeophyApp/Electrique.pdf.
Ebong, E. D., Abong, A. A., Ulem, E. B., and Ebong, L. A. (2021a). Geoelectrical resistivity and geological characterization of hydrostructures for groundwater resource appraisal in the obudu plateau, southeastern Nigeria. J. Nat. Resour. Res. 30 (3), 2103–2117. doi:10.1007/s11053-021-09818-4
Ebong, E. D., Akpan, A. E., Emeka, C. N., and Urang, J. G. (2017). Groundwater quality assessment using geoelectrical and geochemical approaches: case study of Abi Area, southeastern Nigeria. J. Appl. Water Sci. 7 (5), 2463–2478. doi:10.1007/s13201-016-0439-7
Ebong, E. D., Akpan, A. E., and Onwuegbuche, A. A. (2014). Estimation of geohydraulic parameters from fractured shales and sandstone aquifers of Abi (Nigeria) using electrical resistivity and hydrogeologic measurements. J. Afr. Earth Sci. 96, 99–109. doi:10.1016/j.jafrearsci.2014.03.026
Ebong, E. D., George, A. M., Ekwok, S. E., Akpan, A. E., and Asfahani, J. (2021b). 2D electrical resistivity inversion and ground penetrating radar investigation of near surface cave in New Netim area, southeastern Nigeria. Acta Geod. Geophys. 56, 765–780. doi:10.1007/s40328-021-00364-2
Egbai, J. C. (2011). Vertical electrical sounding for the investigation of kaolin deposits in ozanogogo area of ika south local government area of delta state, Nigeria. J. Emerg. Trends Eng. Appl. Sci. 2, 147–151. doi:10.10520/EJC156662
Ekomane, E. (2010).Etudes sédimentologique et paléoenvironnentale des roches carbonatées et pélitiques de la formation de Mintom (SE Cameroun) PhD Thesis, Cameroon, Yaoundé, Univ. of Yaounde I, 189.
Ekwok, S. E., Akpan, A. E., and Ebong, E. D. (2021). Assessment of crustal structures by gravity and magnetic methods in the Calabar Flank and adjoining areas of Southeastern Nigeria—a case study. Arabian J. Geosciences 14, 308. doi:10.1007/s12517-021-06696-1
Ekwok, S. E., Akpan, A. E., Kudamnya, E., and Ebong, E. D. (2020). Assessment of groundwater potential using geophysical data: a case study of parts of Cross River, south-eastern Nigeria. J. Appl. Water Sci. 10, 144.
Engon, T. C., Abane, M. A., Zo’o Zame, P., Ekomane, E., Bekoa, E., Mvogo, K., et al. (2017). Morphological, physico-chemical and geochemical characterization of two weathering profiles developed on limestone from the Mintom Formation in the tropical humid zone of Cameroon. J. Afr. Earth Sci. 131, 198–212. doi:10.1016/j.jafrearsci.2017.03.026
Fatoye, F. B., and Gideon, Y. B. (2013). Geology and mineral resources of the Lower Benue Trough, Nigeria. Adv. Appl. Sci. 4 (6), 21–28.
Fryar, A. E. (2021). Chapter 2 - groundwater of carbonate aquifers, editor(s): abhijit mukherjee, bridget R. Scanlon, alice aureli, simon langan, huaming guo, andrew A. McKenzie, global groundwater. Elsevier, Amsterdam, Netherlands, 23–34.
Geotomo, S. S. B. (2018) Rapid 2-D Resistivity & IP inversion using the least-squares method: Wenner, dipole-dipole, inline pole-pole, poledipole, equatorial dipole-dipole, offset pole-dipole, Wenner-Schlumberger, gradient and non-conventional arrays. https://www.academia.edu/39226833/Rapid_2_D_Resistivity_and_IP_inversion_using_the_least_squares_method.
Gusman, M., Muchtar, B., Syah, N., Akbar, M. D., and Deni, A. V. (2019). Estimations of limestone resources using three dimension block krigingmethod, a case study: limestone sediment at PT Semen Padang. IOP Conf. Ser. Earth Environ. Sci. 314, 12069. doi:10.1088/1755-1315/314/1/012069
Hassan, S. F. (2022). Limestone reserve calculation for engineering purposes for the Nfayil Formation (middle miocene) in bahr Al-najaf depression, Iraq. Iraqi J. Sci. 63 (8), 3533–3543. doi:10.24996/ijs.2022.63.8.26
Hibi, A., Gouaidia, L., and Guefaifia, O. (2021). Investigation of groundwater potential using remote sensing and hydro-geophysical techniques: a case study of the telidjene basin (eastern Algeria). EREM 77, 99–121. doi:10.5755/j01.erem.77.4.29560
Hodlur, G. K., Dhakate, R., and Andrade, R. (2006). Correlation of vertical electrical sounding and borehole-log data for delineation of saltwater and freshwater aquifers. GEOPHYSICS 71, G11–G20. doi:10.1190/1.2169847
Hu, D., Li, Y., Yang, X., Liang, X., Zhang, K., Liang, X., et al. (2023). Experiment and application of NATM tunnel deformation monitoring based on 3D laser scanning. Struct. Control Health Monit. 2023, 1–13. doi:10.1155/2023/3341788
Lassere, M. (1961). “Carte géologique de reconnaissance à l'échelle 1/500 000 du territoire du Cameroun, Ngaoundéré Est,” in Yaoundé: dir. Mines géol (French: Cameroun).
Liu, C., Peng, Z., Cui, J., Huang, X., Li, Y., and Chen, W. (2023). Development of crack and damage in shield tunnel lining under seismic loading: refined 3D finite element modeling and analyses. Thin-Walled Struct. 185, 110647. doi:10.1016/j.tws.2023.110647
Liu, Y., Li, J., and Lin, G. (2023). Seismic performance of advanced three-dimensional base-isolated nuclear structures in complex-layered sites. Eng. Struct. 289, 116247. doi:10.1016/j.engstruct.2023.116247
Mahammed, D. M. (2012).Utilisation des dispositifs de géophysique électrique non classiques pour l’étude des couches géologiques profondes: cas des chotts El Gharbi et Chergui Thèse de doctorat/PHD. Algérie, Africa: Université d’Oran.
Mallick, M. K., Choudhary, B. S., and Budi, G. (2020). Geological reserve estimation of limestone deposit: a comparative study between ISDW and OK. Model. Meas. Control C 81 (1-4), 72–77. doi:10.18280/mmc_c.811-413
Marescot, L. (2008)Imagerie électrique pour géologues: acquisition, traitement, interprétation. https://www.academia.edu/27049692/IMAGERIE_ELECTRIQUE_POUR_GEOLOGUES_acquisition_traitement_interpr%C3%A9tation.
Melouah, O., Eldosouky, A., and Ebong, E. D. (2021). Crustal architecture, heat transfer modes and geothermal energy potentials of the Algerian Triassic provinces. Geothermics 96, 102211. doi:10.1016/j.geothermics.2021.102211
Mohamed, A., Othman, A., Galal, W. F., and Abdelrady, A. (2023). Integrated geophysical approach of groundwater potential inWadi ranyah, Saudi arabia, using gravity, electrical resistivity, and remote-sensing techniques. Remote Sens. 15, 1808. doi:10.3390/rs15071808
Moussango, P., Zo’o Zame, P., Ekomane, E., Bitom, D., and Mahieux, G. (2012). The Pan-african tectonics of the Mintom proglacic formation, Cameroon. Ann. Fac. Sci. (Univ.Ydé Série Sci. Terre 39 (1), 1–16.
Ndougsa-Mbarga, T., Joseph, Q. Y., Assatsé, W. T., Meying, A., and Stéphane, P. A. (2014). Geoelectrical inversion study of limestone attributes at mayo boki area (northern Cameroon). IJG 05, 816–825. doi:10.4236/ijg.2014.58072
Ndubueze, D. N., Igboekwe, M. U., and Ebong, E. D. (2019). Assessment of groundwater potential in Ehime Mbano, southeastern Nigeria. J. Geosciences 7 (3), 134–144. doi:10.12691/jgg-7-3-4
Njueya, A. K., Kengni, L., Fonteh, M. F., Dongmo, A. K., Ntankouo, R. N., and Nkouathio, D. G. (2016). Apport des sondages électriques verticaux à la localisation et la caractérisation des aquifères en zone volcanique au cameroun: cas d’ebone et ses environs 13. European Journal of Scientific Research 138(1):54-65.
Nyeck, B. (2005). Organization of ferralitic coverage nsimi-zoetele watershed forest in southern Cameroon plateau central africa: the role of the pore space and water dynamics in its transfor mation. Yaounde, Cameroon: Doctor Thesis, University of Yaoundé I, 434.
Osman, M., Sadoun, M., and Fathy, M. (2022). A static modeling approach to the Brown Limestone carbonate reservoir, Geisum Oilfield, Gulf of Suez, Egypt. Arab. J. Geosci. 15, 1588. doi:10.1007/s12517-022-10850-8
Peng, J., Xu, C., Dai, B., Sun, L., Feng, J., Huang, Q., et al. (2022). Numerical Investigation of Brittleness Effect on Strength and Microcracking Behavior of Crystalline Rock. Int. J. Geomech. 22 (10), 4022178. doi:10.1061/(ASCE)GM.1943-5622.0002529
Philémon, Z. Z., Grelle, M. H., and Philippe, S. A. (2016). Physico-Chemical and petrographic characterization of carbonated rocks of Mintom (south-Cameroon) and their potential uses. Int. J. Geosciences 7, 775–783. doi:10.4236/ijg.2016.75059
Ren, C., Yu, J., Liu, S., Yao, W., Zhu, Y., and Liu, X. (2022). A plastic strain-induced damage model of porous rock suitable for different stress paths. Rock Mech. Rock Eng. 55 (4), 1887–1906. doi:10.1007/s00603-022-02775-1
Rusydy, I., Ikhla, S. B., Zainal, M., Idris, S., Basyar, K., and Putra, Y. A., (2020). Integration of borehole and vertical electrical sounding data to characterise the sedimentation process and groundwater in Krueng Aceh basin, Indonesia. Groundw. Sustain. Dev. 10, 100372. doi:10.1016/j.gsd.2020.100372
Sadrac, O. O. J., Emile, E., Solange, I. A., William, E. Y. R., Christian, B. E. G., and Dieudonné, B. (2021). Petrological characterization of pelites from the Mintom basin and their weathering mantle. J. Geosciences Geomatics 9, 66–73. doi:10.12691/jgg-9-2-3
Sikandar, P., Bakhsh, A., Arshad, M., and Rana, T. (2010). The use of vertical electrical sounding resistivity method for the location of low salinity groundwater for irrigation in Chaj and Rachna Doabs. Environ. Earth Sci. 60, 1113–1129. doi:10.1007/s12665-009-0255-6
Song, S. H., Lee, J. Y., and Park, N. (2007). Use of vertical electrical soundings to delineate seawater intrusion in a coastal area of Byunsan, Korea. Environ. Geol. 52, 1207–1219. doi:10.1007/s00254-006-0559-8
Šumanovac, F., and Weisser, M. (2001). Evaluation of resistivity and seismic methods for hydrogeological mapping in karst terrains. J. Appl. Geophys. 47, 13–28. doi:10.1016/S0926-9851(01)00044-1
Taha, A. I., Al Deep, M., and Mohamed, A. (2021). Investigation of groundwater occurrence using gravity and electrical resistivity methods: a case study from Wadi Sar, Hijaz Mountains, Saudi Arabia. Arab. J. Geosci. 14, 334. doi:10.1007/s12517-021-06628-z
Telford, W. M., Geldart, L. P., and Sheriff, R. E. (1990). Applied Geophysics. 2nd. Cambridge University Press. Cambridge, UK, doi:10.1017/CBO9781139167932
Toteu, S. F., Penaye, J., Deschamps, Y., Maldan, F., Nyama Atibagoua, B., Bouyou Houketchang, M., et al. (2008). Géologie et ressources minérales du Cameroun. Oslo, Norway: 33rd International Geological Congres.
Vanhoutte, M., and Salley, P. (1986). “Reconnaissance des calcaires de Mintom - projet de recherches minières,” in Sud-est cameroun (United Nations Development Program, Unpublished Report), New York, NY, USA, 91, 59.
Vicat, J. (1998). “Esquisse géologique du Cameroun. Géosciences au Cameroun,” in Collect. Géocam. Editors J. P. Vicat et, and P. Bilong éds (Press. Univ. de Yaoundé), Cameroon, Yaoundé, 1–11.
Viguier, J. M. (1990). Le bassin versant expérimental et représentatif (B.V.R.E.) du Peissonel (Var, France) avancement des recherches. Orléans, France: Recherches Géologiques et Minières, 45p.
Yu, J., Zhu, Y., Yao, W., Liu, X., Ren, C., Cai, Y., et al. (2021). Stress relaxation behaviour of marble under cyclic weak disturbance and confining pressures. Measurement 182, 109777. doi:10.1016/j.measurement.2021.109777
Zhou, G., Zhou, X., Song, Y., Xie, D., Wang, L., Yan, G., et al. (2021). Design of supercontinuum laser hyperspectral light detection and ranging (LiDAR) (SCLaHS LiDAR). Int. J. remote Sens. 42 (10), 3731–3755. doi:10.1080/01431161.2021.1880662
Keywords: electrical sounding, modeling, estimation, inverse distance, limestone layer
Citation: Ndam Njikam MM, Yem M, Ribodetti A, Mohamed A, Soumah A, Junior MP, Alarifi SS and Abdelrady A (2023) Application of the electrical resistivity method and the estimation of limestone volume: a case study. Front. Earth Sci. 11:1280414. doi: 10.3389/feart.2023.1280414
Received: 20 August 2023; Accepted: 04 December 2023;
Published: 20 December 2023.
Edited by:
Ahmed M. Eldosouky, Suez University, EgyptReviewed by:
Ebong D. Ebong, University of Calabar, NigeriaCopyright © 2023 Ndam Njikam, Yem, Ribodetti, Mohamed, Soumah, Junior, Alarifi and Abdelrady. This is an open-access article distributed under the terms of the Creative Commons Attribution License (CC BY). The use, distribution or reproduction in other forums is permitted, provided the original author(s) and the copyright owner(s) are credited and that the original publication in this journal is cited, in accordance with accepted academic practice. No use, distribution or reproduction is permitted which does not comply with these terms.
*Correspondence: Mohamed Moustapha Ndam Njikam, bmRhbW5qaWthbW1AZ21haWwuY29t; Ahmed Mohamed, YWhtZWRtb2hhbWVkQGF1bi5lZHUuZWc=; Ahmed Abdelrady, YS5yLmEubWFobW91ZEB0dWRlbGZ0Lm5s
Disclaimer: All claims expressed in this article are solely those of the authors and do not necessarily represent those of their affiliated organizations, or those of the publisher, the editors and the reviewers. Any product that may be evaluated in this article or claim that may be made by its manufacturer is not guaranteed or endorsed by the publisher.
Research integrity at Frontiers
Learn more about the work of our research integrity team to safeguard the quality of each article we publish.