 Ying Ying Song
 Chao Li
94% of researchers rate our articles as excellent or good
Learn more about the work of our research integrity team to safeguard the quality of each article we publish.
Find out more
ORIGINAL RESEARCH article
Front. Earth Sci., 08 January 2024
Sec. Interdisciplinary Climate Studies
Volume 11 - 2023 | https://doi.org/10.3389/feart.2023.1280132
This article is part of the Research TopicExtreme Hydro-Meteorological Events in a Changing Climate: Monitoring, Risk Assessment, and Early WarningView all 7 articles
Rural Loudspeaker Systems (RLS) are interrelated with the management of typhoons in Guangdong Province, China. The study aims to determine the effectiveness of RLS devices in reducing injuries, fatalities, and house damage caused by typhoons. Additionally, it examines the role of Typhoon Warning Signals (TWS) level, which can indicate the severity of typhoon that people are alerted about, in conveying typhoon intensity and their impact on disaster outcomes. The analysis used multiple datasets, including RLS coverage, TWS-level, and typhoon disaster records. Poisson regression models are used to estimate the impact of RLS coverage on injuries, fatalities, and house damage. The results reveals that an increase in RLS coverage by one percentage point is associated with an 3% reduction in injury events and an 1% reduction in casualty (injury and fatality) events, highlighting the importance of the RLS as a dissemination tool to inform individuals and guide their behavior during typhoon events. However, house damage, a fixed asset, is not significantly influenced by RLS coverage but is more affected by the severity of the typhoon or TWS-level. These findings enhance the understanding of the influence of RLS devices on mitigating typhoon disasters and underscore the crucial need for implementing effective early warning systems in areas prone to vulnerabilities.
The increasing frequency of meteorological disasters, coupled with the challenges posed by climate change, highlights the importance of establishing effective early warning systems (EWS) (Chen et al., 2022). The “Early Warning for All” initiative, launched by the UN Secretary-General in November 2022 at the COP27 meeting, claims to ensure that everyone in the world is protected from hazardous weather, water, or climate events through lifesaving EWS by the end of 2027. EWS consists of four pillars: disaster risk knowledge, observations and forecasting, dissemination and communication, and preparedness and response (UNDRR, 2016; WMO, 2018). Various case studies and household surveys have explored the impact of different pillars of EWS in reducing economic losses and casualty (injury and fatality), highlighting the substantial return on EWS initiatives (Simmons and Sutter, 2005; Healy and Malhorta, 2009; Meng et al., 2016; Lyu et al., 2021; Brian, 2022).
Dissemination and communication of early warning information encompass the distribution of warning and preparedness information in a clear and accessible manner to those responsible for taking action and those at risk, including vulnerable populations (UNDP, 2018). In short, dissemination is how the information reaches the end-users, while communication refers to its content (Brian, 2022). The dissemination mainly based on the radios, Internet, mobile phones, satellites, broadcasting and so on. There are limited studies examined the response to and impact of specific warning dissemination method on disaster reduction. Ferris and Newburn (2017) studied the effect of the Wireless Emergency Alert (WEA) system for extreme weather on daily car traffic conditions based on a sample of flash flood events from counties located in Virginia between 2011 and 2013. WEA system was adopted nationally in the US since 2012 to issue warnings directly to mobile devices in case of extreme weather. Results show wireless alert messages for flash flood warnings reduced car accidents by 15.9% relative to the counterfactual with nonwireless alert protocols. Miller (1958) used conditional variation in the initial broadcast dates of the US National Oceanic and Atmospheric Administration’s Weather Radio All Hazards (NWR) transmitters to study the impact of expanding the NWR transmitter network. Results show that introducing of NWR transmitters in a county was associated with an almost 40% reduction in tornado injuries and as much as a 50% reduction in tornado fatalities. Douvinet et al. (2021) analyzed the effectiveness of siren in France using a geographical information system, questionnaires, and surveys. Results show surveyed members of the population identify sirens as the most effective alert system over other alternatives such as cell-phone-based alerting tools. Also, Siren location is not related to the number of risks, past disasters, or prevention plans.
Compared with other dissemination methods, the Rural Loudspeaker System (RLS) installations are typically found in rural villages where the inhabitants are scattered (Ma et al., 2008). In China, RLS is an essential parts of the disaster defense system, which is specially designed for rural communities by meteorological agencies. Before disaster occurs, residents can get warnings and emergency notifications through RLS, and then take actions to keep them safe. A set of RLS systems consists of a management platform and an RLS terminal. The RLS terminal consists of an audio processor, power amplifier, and loudspeaker. An early warning text message is sent to the terminal through the management platform and translated into an audio signal. A power amplifier is then responsible for amplifying the audio signal. Finally, the audio is broadcasted to the individuals through loudspeakers. The advantage of the RLS is its ability to deliver warning information simultaneously to a larger population in an audible manner, providing extensive coverage and practicality (Qi et al., 2021). Furthermore, one management platform can manage multiple RLS terminals, which are affordable and easy to maintain, with a cost of approximately RMB 1,000 CNY and an annual maintenance cost of approximately RMB 500 CNY. Additionally, the RLS can effectively convey warning messages through voice announcements, reaching individuals who may not be able to read or operate digital devices. In remote areas, many aged are illiterate, and it is difficult for them to gain access to notifications and news. The RLS offers a friendly and understandable method for aged people, especially as the warning information can be translated into dialects. However, beyond anecdotes, there is little robust statistical evidence about whether and to what extent the RLS mitigates disaster losses.
There has been a rapid drop in typhoon fatalities in China, from 498 (1991–2000) to 301 (2001–2010) and 90 (2011–2017) (Lyu et., 2021). In some cases, severe typhoons have resulted in few fatalities, highlighting the potential impact of early warning information dissemination. As an example, records indicate that two individuals lost their lives in Deqing County, Guangdong Province during super Typhoon Vicente in 2012, whereas there were no fatalities in the same county during super Typhoon Mangkhut in 2018, which is ranked second landed in China since 1949 (China Meteorological Administration CMA, 2013; CMA, 2019). However, the reason for such a phenomenon has not been statistically examined. Guangdong Province, located in the southeastern coastal region of China, covers an area of approximately 179,725 km2 and has an estimated population of 104.3 million as of 2022. The province has a long and narrow coastline and is frequently affected by typhoons in the Northwest Pacific. The region is the most active area for typhoon generation globally, accounting for 36% of all typhoons worldwide (Kelvin, 2011). A study on the impact of the RLS on typhoon disaster prevention and mitigation in Guangdong Province is therefore representative.
This study sheds light on the question of RLS’s contribution to disaster reduction, using variations in the location and broadcast dates of RLS terminal. We began by exploring the distribution and changes in RLS device coverage across Guangdong Province, highlighting the importance of these devices in rural areas. We then delves into the relationship between Typhoon Warning Signal (TWS) level and typhoon intensity, as well as the color-coded severity levels used to classify typhoon warnings in China. Finally, we examined the relationship between RLS coverage, TWS-level, and disaster losses.
The linear relationship between RLS device coverage and disaster losses (injury events, fatal events and house damage) is described in Eq. (1).
The dependent variable Y represents disaster losses, i.e., injury events, fatal events, casualty (injury and fatality) events and, house damage.
The independent variable
The independent variables
This study organizes the coverage rate of the RLS, TWS-level data, and disaster data to form three unbalanced panel datasets: the injury panel, fatality panel, and house damage panel. A Poisson regression analysis provides consistent estimates, even in the presence of overdispersion, as long as the functional form is appropriately specified (Li, 2016). The injury and fatality data has a large number of zero values and exhibited significant dispersion. To address these characteristics, Poisson regression models are conducted in this study.
This study uses four datasets: administrative division data from the National Bureau of Statistics, RLS device data from the Guangdong Early Warning Center (GEWC), TWS-level data from the GEWC, and typhoon disaster data from the National Meteorological Center. Eighty percent of the dataset is randomly selected for fitting, and the remaining 20% for verifying.
The administrative division data includes hierarchical relationships within the administrative system. In Guangdong Province, by 2021, there are 21 city-level divisions, 122 county-level divisions (districts or counties), 1,609 township-level divisions (streets or towns), and 26,500 administrative village-level divisions, including approximately 16,700 villages and 9,800 communities. County-level divisions comprise districts and counties, with districts generally having higher population densities and located in city centers. Counties, however, are typically situated on the outskirts of cities, covering larger areas but with lower population densities. Similarly, the township-level categories correspond to the administrative hierarchy. A district consists of multiple streets, and each street is composed of multiple committees. A county comprises multiple towns, and each town consists of multiple administrative villages. Some districts also include towns. Figure 1 illustrates the organizational structure of the administrative divisions.
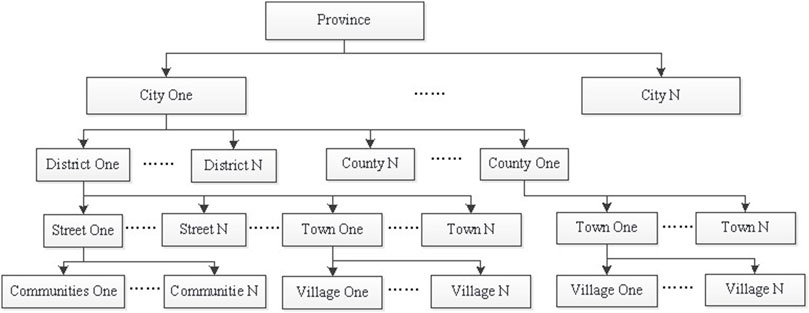
FIGURE 1. The organizational structure of the administrative division.
In 2015, Guangdong Province started to use RLS devices to disseminate warning signals, particularly in rural areas. Figure 2 shows how the distribution of RLS terminals across Guangdong province has changed over time, starting after 2015. By 2021, 8,538 RLS devices have been installed in Guangdong Province and are distributed across 54 county-level divisions. Owing to the nature of sound broadcasting, these devices are primarily installed in village areas rather than in communities. RLS devices have achieved coverage in over 51% of the village divisions.
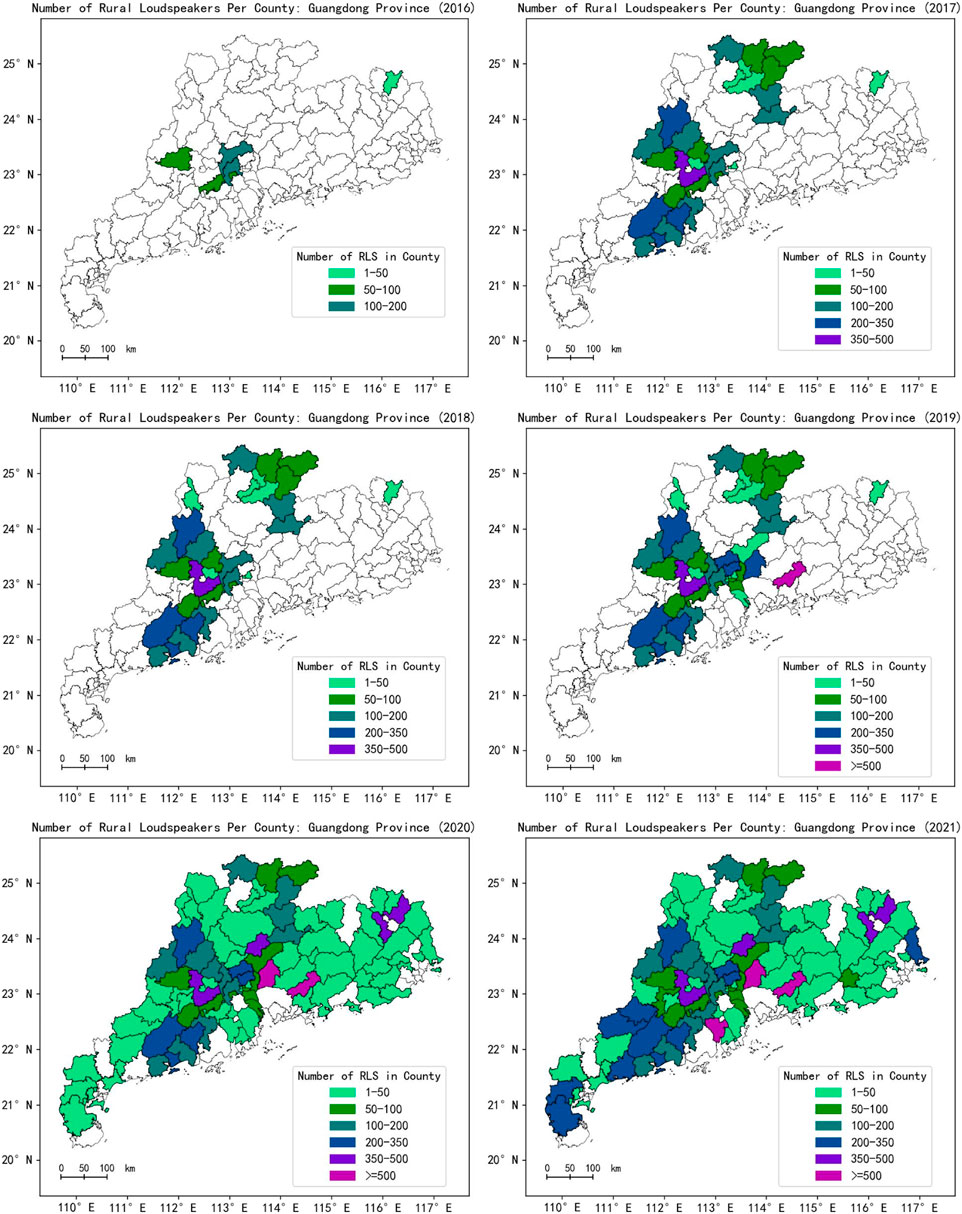
FIGURE 2. Annual distribution statistics of RLS devices in Guangdong province.
Figure 3 shows the percent of typhoon with RLS coverage. In 2015, RLS began to be applied from Deqing County, and in 2016, it was increased to six counties, but none of these counties suffered typhoon disasters. By 2021, the RLS coverage of typhoons is 40%, and there are still many affected areas that have not installed loudspeakers.
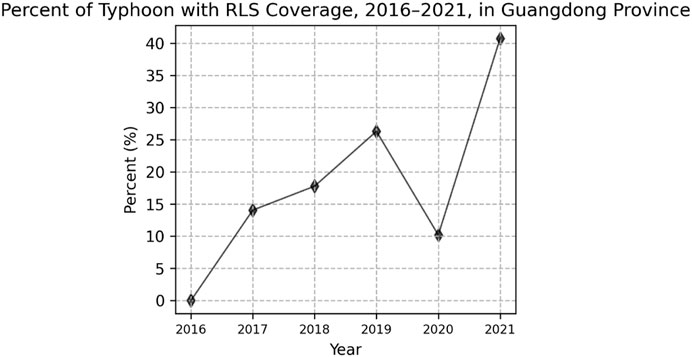
FIGURE 3. Percent of typhoons with RLS terminal coverage.
Typhoon disaster data is reported by various organizations at different levels, with county reporting organizations providing the most detailed information. This study uses the county-reporting data from the sample. The records in this dataset span 2010-2021 and capture 362 typhoon events. The annual losses regarding injuries, fatalities and house damage are shown in Figure 4, Figure 5 and Figure 6 respectively. The red line is the 3-year moving average. As can be seen, after 2015, the trends of both fatality and house damage have significantly decreased.
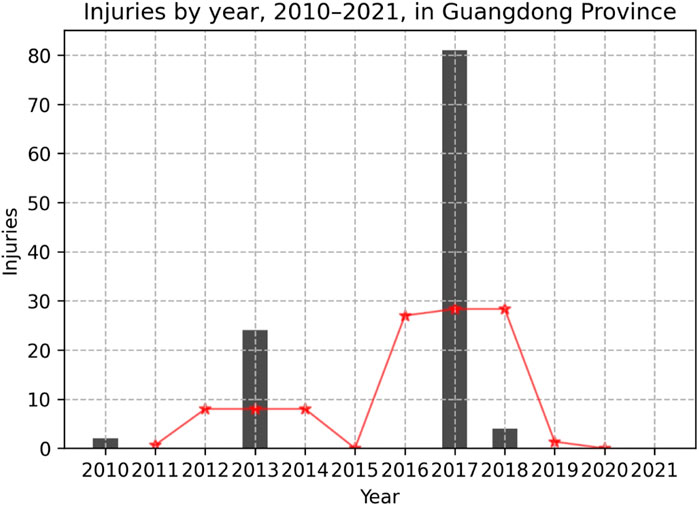
FIGURE 4. Number of injuries reported.
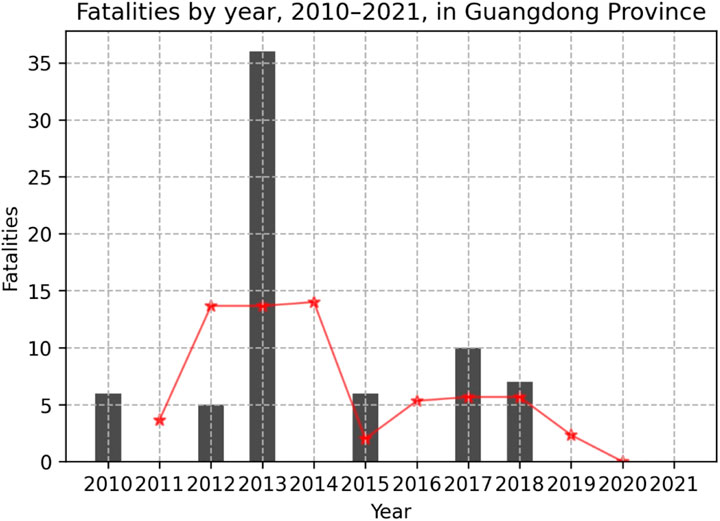
FIGURE 5. Number of fatalities reported.
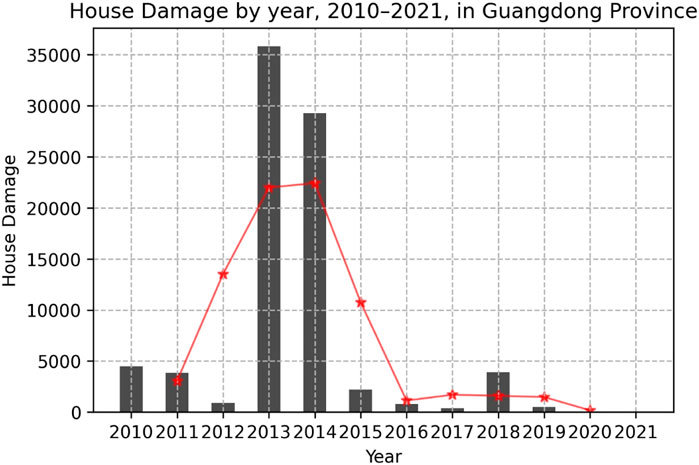
FIGURE 6. Number of house damage reported.
The data are unbalanced. The reporting time and frequency of typhoons are random and varied across counties. Observations are available only when a typhoon disaster occurs, resulting in some counties having multiple observations, whereas others have few or no observations. The annual data reported are shown in the Figure 7, Figure 8 and Figure 9 respectively. The duplicate records are thus deleted. Notably, a significant number of counties have reported zero injuries or fatalities caused by typhoons. To address these characteristics, we employs a fixed-effects regression model using an unbalanced panel approach.
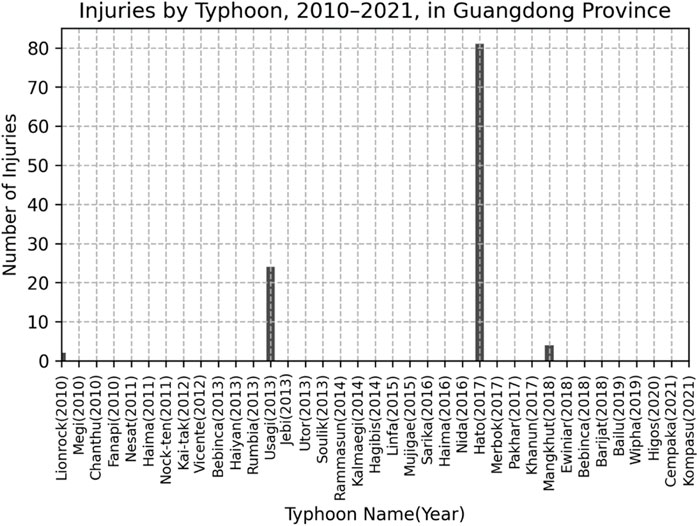
FIGURE 7. Number of injuries by typhoon.
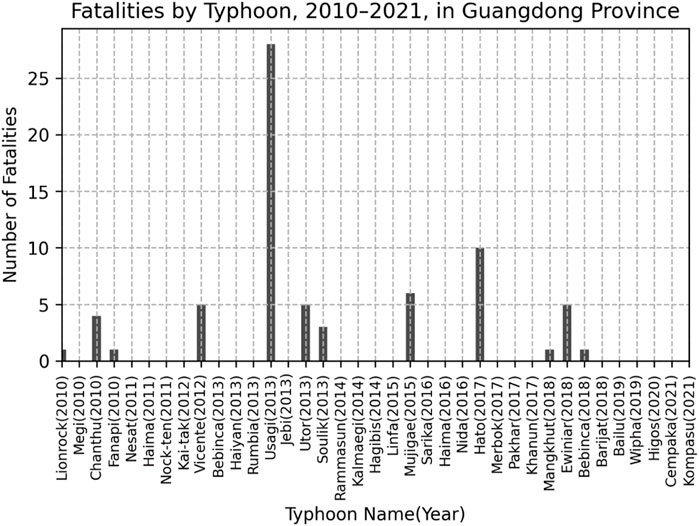
FIGURE 8. Number of fatalities by typhoon.
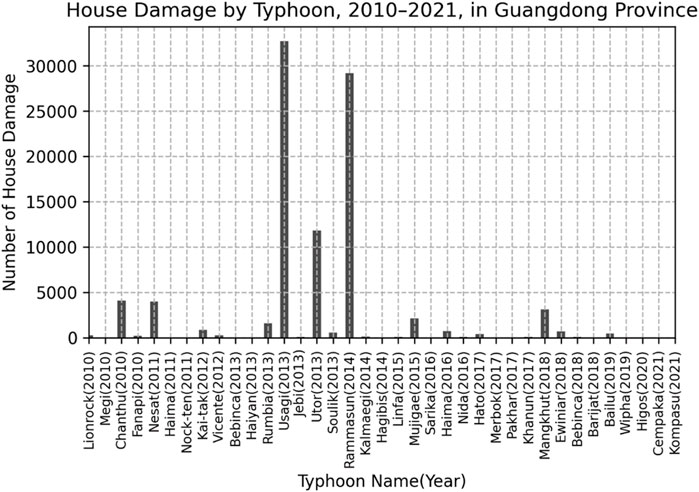
FIGURE 9. Number of house damage by typhoon.
In annual statistics, severe typhoons have resulted in fewer fatalites year by year, highlighting the potential impact of early warning information dissemination. To be specific, Typhoon Usagi (2013), Typhoon Hato (2017) and Typhoon Mangkhut (2018) are the same Beaufort scale (Grade 14–15, (41.5–50.9 m/s)). Typhoon Usagi (2013) killed 28 people and hurt 24 people, Typhoon Hato (2017) killed 10 people and hurt 81 people. Typhoon Hato did brought more injuries, as the strongest typhoon in Guangdong, since 1949. Typhoon Mangkhut (2018) killed 1 people and hurt 4 people which is the second strongest typhoon landed.
The strength of a typhoon’s wind magnitude is commonly characterized using the Beaufort scale (Miller B I, 1958; Emanuel K A, 1987). In China, there is a correlation between the Typhoon Beaufort wind magnitude and the TWS-level, with different levels represented by different colors according to the Weather Hazard Warning Issuing Method proclaimed by the Central Meteorological Observatory. Table 1 show the relationship. The Common Alert Protocol (CAP) (WMO, 2018), an internationally recognized standard format for emergency alerts and public warnings, is adopted where a code called “severity” indicates the severity of the event that people are alerted about. In the case of typhoons, we refer to these data as the TWS-level data. There are five levels: extreme, severe, moderate, minor, and unknown. TWS unknown is issued when a tropical cyclone that may affect within 48 h. Its central sustained wind speed is less than 17.2 m per second. It is the state of the typhoon notice. The study here mainly focuses on the warnings that lead to disasters. Thus, TWS unknown is not considered.
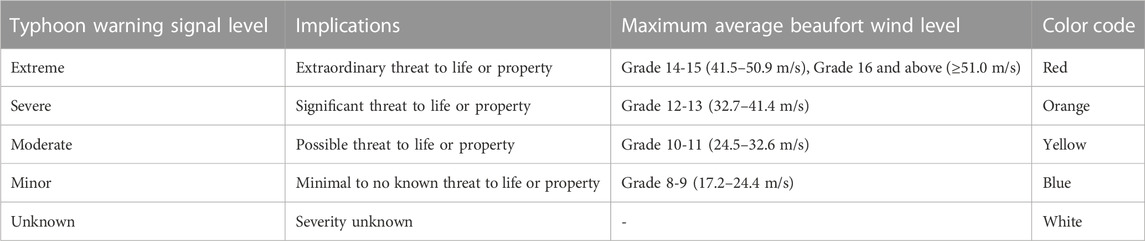
TABLE 1. The typhoon warning signal levels in China.
The data before 2016 is not adequately stored. From 2016 to 2021, across Guangdong Province, county weather observatories issued 66,785 typhoon warning records. These included 2,219 extreme warning signals, 12,034 severe warning signals, 44,032 moderate warning signals, 7,048 minor warning signals, and 1,452 unknown warning signals. Warning signals are typically issued 48 h before the typhoon’s landfall and are aimed to alert people to defend themselves against potential disasters. The warning signal dataset is thus filtered where the disaster losses data are reported. Thus, the data used in analysis have 595 recorded data, including 40 extreme warning signals, 96 severe warning signals, 163 moderate warning signals, and 178 minor warning signals.
The fitting results are presented in Table 2 (injuries), 3 (casualties), and 4 (house damages). The correlation coefficient indicates the relationship between the dependent variable and the logarithm of its mean. The incidence rate ratios (IRRs) are employed to offer a more logical interpretation of this relationship. Given specific control factors, the null hypothesis states that there is no direct correlation between the number of injuries, fatalities, casualties, and house damage caused by typhoons and the amount of RLS coverage and TWS-level issued during a typhoon. To determine whether the null hypothesis is true, we utilize the P>|z| value. The null hypothesis can be rejected if this value is less than 0.05.
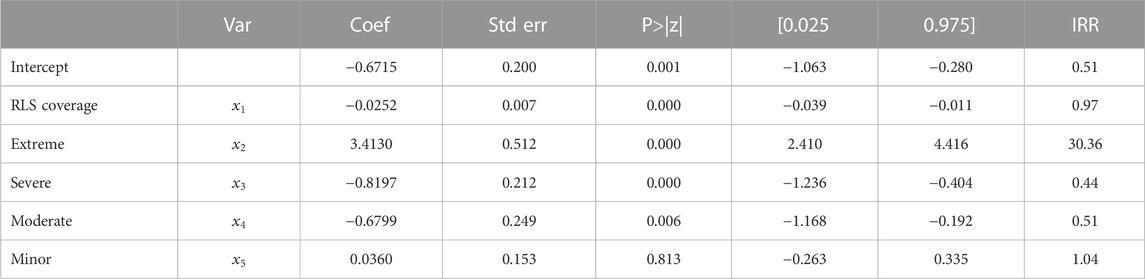
TABLE 2. The statistical relationship between injuries, rural loudspeaker system coverage and the Typhon warning signal levels.
Regarding injury events in Table 2, P>|z| value estimations indicate that the independent variables RLS coverage and TWS-level (except TWS minor) passed the significance test (p < 0.05). A decreasing effect is indicated by the RLS coverage’s negative correlation coefficient. According to the IRR of RLS coverage, which is 0.97, a 1% increase in RLS coverage is linked to a 3% decrease in injury incidents. TWS moderate and severe are negative factors, and TWS extreme has an enhanced impact on injury events.
There is no clear association between RLS coverage and fatality events, as evidenced by the RLS coverage failing the significance test (p < 0.05) with regard to fatality events. Yu (2004) evaluated disasters by adding together fatalities and injuries. It supports decision-makers in their efforts to prevent and mitigate disasters. Motivated by this, we employ casualty (injury and fatality) events to merge injury and fatality events.
There is a decrease effect, as evidenced by the negative correlation coefficient between casualty events and RLS coverage in Table 3. With an IRR index of 0.99 for RLS coverage, there is a 1% reduction in casualty events for every 1% increase in RLS coverage. All other TWS-level pass the importance test, with the exception of TWS minor. A negative correlation has been observed between the occurrence of casualty events and TWS severe and TWS moderate. A positive correlation has been observed between the occurrence of casualty events and TWS extreme. That is, the super typhoon (wind strength greater than 14 or above), which is an increased impact on the casualty events.
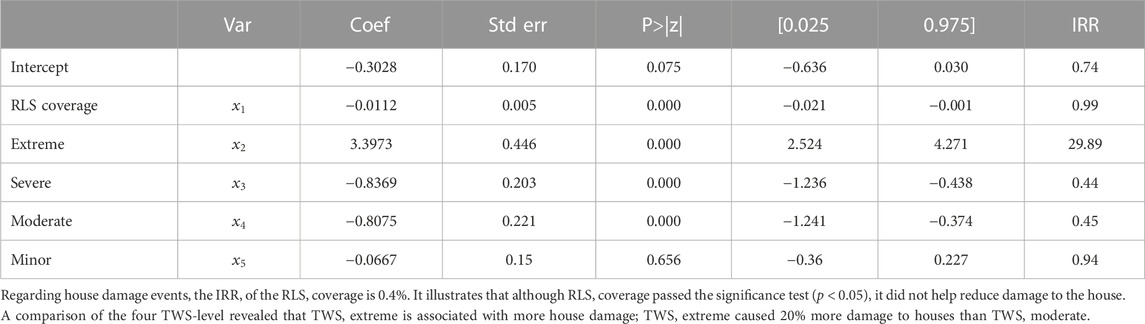
TABLE 3. The Statistical Relationship Between casualty (injury and fatality), Rural Loudspeaker System Coverage and the Typhon Warning Signal Level Injury & Fatality.
Regarding house damage events in Table 4, the IRR of the RLS coverage is 0.4%. It illustrates that although RLS coverage passed the significance test (p < 0.05), it did not help reduce damage to the house. A comparison of the four TWS-level revealed that TWS extreme is associated with more house damage. TWS extreme caused 20% more damage to houses than TWS moderate. Furthermore, the regression model of injury is verified using dependent data. When we round these estimated values, 88.5% of the estimated sample values match the real values. The RMSE value is 0.203.
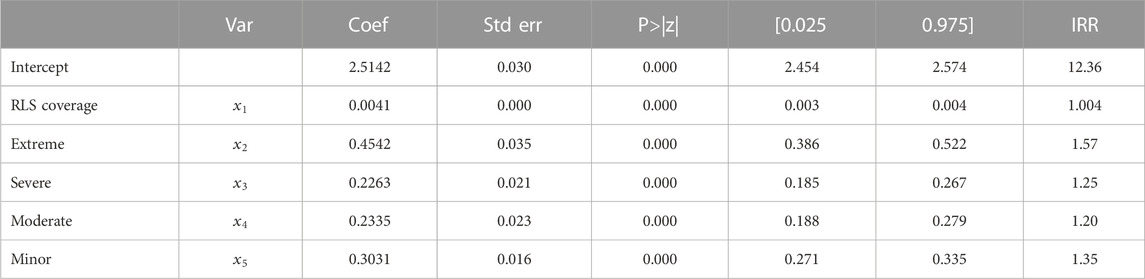
TABLE 4. The statistical relationship between house damages, rural loudspeaker system coverage and the Typhon warning signal level.
RLS coverage expansion contributes to decrease in injury events. Normally, typhoon landed bring potential injury events, but negative of correlation coefficient suggests TWS severe and moderate play a notice role in reducing injuries. As of yet, there is no experimental evidence linking RLS coverage to fatalities. Fatality events also vary considerably based on the time of day. KEVIN M. (2011) shows that disasters often occur in the late afternoon, evening, and overnight. Residents may have to be in danger while the morning and late afternoon periods encompass rush hours. Residents are likely asleep during the overnight hours, which could explain this vulnerability.
The RLS primarily serves as a means of disseminating warnings and guiding individuals to adopt appropriate measures to avoid risks. Not particularly helpful for immovable items and fixed buildings. House is a kind of immovable assets. There suggests a 0.4% increase in house damage events. An increasing of house dwellings would explain it, due to the population increased by 6.7% from 2016 to 2021.
The estimated number of injuries may higher than the record reported when TWS extreme is issued. In 2018, during the Mangkhut typhoon, Grade 14–15 (41.5–50.9 m/s), we evaluate approximately 1.8 injured people in Gaozhou county; but, no injuries are reported. Most likely, this is a result of the government being more aware of impending super typhoons. It is likely because when an over-size super typhoon is approaching, the Government issues an order to suspend classes and jobs. It can deter the public from taking risks. The public also pay more attention to it and publicize it more strongly through various media.
This study provides quantitative evidence supporting the use of RLS devices to disseminate typhoon warnings and enhance public safety by investigating the relationships among RLS coverage, TWS-level, and typhoon disasters.
First, the results indicate that a one-percentage increase in RLS coverage leads to an 3% reduction in injury events, an 1% reduction in casualty events. This emphasizes the role of the TWS-level in conveying typhoon intensity and the importance of considering multiple factors in assessing disaster outcomes. Second, the results reveals that RLS coverage did not have a significant impact on house damage. Instead, the severity of the typhoon and the TWS-level are found to be more influential in determining the extent of house damage.
The study shows the ability of RLS in overcome the Last mile obstacle in warning information dissemination. With the popularity of television, mobile phone, networks, new media, etc., the RLS, is not so high-tech but effective, especially in rural areas, especially when the warning signal is severe or moderate. Our study could help in developing a better dissemination strategy for TWS-level in China.
At present, the RLS network is not related to the number of past disasters, or prevention plans. To improve the effectiveness of the RLS, we recommend relocating loudspeaker to optimize their efficiency. Future studies may explore the optimal network of RLS according to hazard risk, population density and so on.
The data analyzed in this study is subject to the following licenses/restrictions: All data in the current study was stored in the PI’s affiliation, and is available from the corresponding authors on reasonable request and with completion of data user agreement.. Requests to access these datasets should be directed to lichao@cma.gov.cn.
YS: Writing–original draft, Methodology, Software, Visualization. CL: Writing–original draft, Conceptualization, Data curation, Funding acquisition, Project administration, Resources, Supervision, Validation, Writing–review and editing.
The author(s) declare financial support was received for the research, authorship, and/or publication of this article. China Meteorological Administration Youth Innovation team plan (CMA2023QN02). The Joint Research Project for Meteorological Capacity Improvement (No. 23NLTSQ014).
The authors declare that the research was conducted in the absence of any commercial or financial relationships that could be construed as a potential conflict of interest.
All claims expressed in this article are solely those of the authors and do not necessarily represent those of their affiliated organizations, or those of the publisher, the editors and the reviewers. Any product that may be evaluated in this article, or claim that may be made by its manufacturer, is not guaranteed or endorsed by the publisher.
Chen, Y., Wang, L., Zhao, J. H., Zhang, Y. X., Zhao, S. S., Li, W., et al. (2022). Climatic characteristics and major meteorological events over China in 2021. Meteorol. Mon. 48 (4), 470–478. doi:10.7519/j.issn.1000-0526.2022.022501
China Meteorological Administration (2013). China meteorological disaster year book 2013. Beijing: Meteorological Press. (in Chinese).
China Meteorological Administration (2019). China meteorological disaster year book 2019. Beijing: Meteorological Press. (in Chinese).
Common alerting protocol (2023). Common alerting protocol (CAP 1.2). Available at: https://www.itu.int/en/ITU-D/Emergency-Telecommunications/Documents/2020/T-REC-X.1303bis-201403-.pdf (Accessed June 27, 2023).
Douvinet, J., Serra-Llobet, A., Bopp, E., and Kondolf, G. M. (2021). Are sirens effective tools to alert the population in France? Nat. Hazards Earth Syst. Sci. 21, 2899–2920. doi:10.5194/nhess-21-2899-2021
Emanuel, K. A. (1987). The dependence of hurricane intensity on climate. Nature 326 (6112), 483–485. doi:10.1038/326483a0
FerrisNewburn, J. S. D. A. (2017). Wireless alerts for extreme weather and the impact on hazard mitigating behavior. J. Environ. Econ. Manag. 82, 239–255. MAR. doi:10.1016/j.jeem.2016.11.002
Golding, B. (2022). Towards the “perfect” weather warning brian golding. Cham: Springer. ISBN 978-3-030-98988-0/ISBN 978-3-030-98989-7 (eBook).
Healy, A., and Malhorta, N. (2009). Myopic voters and natural disaster policy. Amer. Polit. Sci. Rev. 103, 387–406. doi:10.1017/S0003055409990104
Kevin, M. (2011). Simmons and daniel sutter. Economic and societal impacts of tornadoes. American Meteorological Society.
Li, R., Chen, L., and Wang, P. X. (2016). Simulation study and analysis of overdispersion data. J. Quantitative Econ. 33 (01), 72–75. doi:10.16339/j.cnki.hdjjsx.2016.01.011
Lu, Y., Zhao, H. H., Zhao, D., and Li, Q. Q. (2021). Spatial-temporal characteristic of tropical cyclone disasters in China during 1984 – 2017. Haiyang Xuebao 43 (6), 45–61. doi:10.12284/hyxb2021080
Lyu, M. H., Zhao, H. X., Zhang, X. M., Wang, L. J., and Yang, L. (2021). Preliminary study on benefit evaluation of disaster reduction of typhoon based on integrated disaster risk governance model. J. Catastrophology 36 (1), 157–163. doi:10.3969/j.issn.1000-811X.2021.01.030
Ma, C. P., Yang, R. F., Liu, J. W., and Zhao, J. M. (2008). Meteorological disaster warning dissemination system in rural area. Meteorol. Mon. 34 (9), 112–116. doi:10.7519/j.issn.1000-0526.2008.009.015
Meng, R., Zheng, W. W., Hu, J. B., Huang, Z. Q., and Meng, K. (2016). Evaluation method of geological hazard meteorological risk early warning service benefit in hanzhong city. J. Anhui Agric. Sci. 44 (36), 210–212. doi:10.13989/j.cnki.0517-6611.2016.36.070
Miller, B. I. (1958). On the maximum intensity of hurricanes. J. Meteorology 15 (2), 184–195. doi:10.1175/1520-0469(1958)015<0184:otmioh>2.0.co;2
Ng, K. S., and Leckebusch, G. C. (2021). A new view on the risk of typhoon occurrence in the western North Pacific. Nat. Hazards Earth Syst. Sci. 21 (2), 663–682. doi:10.5194/nhess-21-663-2021
Qi, Y. F., and Zhang, Y. C. (2021). Rural wire broadcasting and epidemic prevention and control: the duplex presence as rural media and audio media. Guizhou Ethn. Stud. 42 (5), 89–96. doi:10.13965/j.cnki.gzmzyj10026959.2021.05.014
Simmons, K. M., and Sutter, D. (2005). WSR-88D radar, tornado warnings, and tornado casualties. Weather Forecast. 20 (3), 301–310. doi:10.1175/WAF857.1
UNDP (2018). UNDP annual report 2017. Available at: https://annualreport.undp.org/2017/.
UNDRR (2016). Report of the open-ended intergovernmental expert working group on indicators and terminology relating to disaster risk reduction. New York: United Nations. Available at: https://www.unisdr.org/we/inform/publications/51748 (Accessed 1 3, 2023).
WMO (2018). WMO statement on the state of the global climate in 2018. Available at: https://public.wmo.int/en/resources/library/wmo-statement-state-of-global-climate-2018.
Keywords: rural loudspeaker systems, typhoon disaster, early warning system (EWS), Guangdong Province China, disaster mitigating measures
Citation: Song YY and Li C (2024) The impact of rural loudspeaker systems on typhoon disasters: Guangdong Province of China. Front. Earth Sci. 11:1280132. doi: 10.3389/feart.2023.1280132
Received: 19 August 2023; Accepted: 07 December 2023;
Published: 08 January 2024.
Edited by:
Miaoni Gao, Nanjing University of Information Science and Technology, ChinaReviewed by:
Jianhua Xiao, Chinese Academy of Sciences (CAS), ChinaCopyright © 2024 Song and Li. This is an open-access article distributed under the terms of the Creative Commons Attribution License (CC BY). The use, distribution or reproduction in other forums is permitted, provided the original author(s) and the copyright owner(s) are credited and that the original publication in this journal is cited, in accordance with accepted academic practice. No use, distribution or reproduction is permitted which does not comply with these terms.
*Correspondence: Chao Li, bGljaGFvQGNtYS5nb3YuY24=
Disclaimer: All claims expressed in this article are solely those of the authors and do not necessarily represent those of their affiliated organizations, or those of the publisher, the editors and the reviewers. Any product that may be evaluated in this article or claim that may be made by its manufacturer is not guaranteed or endorsed by the publisher.
Research integrity at Frontiers
Learn more about the work of our research integrity team to safeguard the quality of each article we publish.