
95% of researchers rate our articles as excellent or good
Learn more about the work of our research integrity team to safeguard the quality of each article we publish.
Find out more
ORIGINAL RESEARCH article
Front. Earth Sci. , 07 September 2023
Sec. Environmental Informatics and Remote Sensing
Volume 11 - 2023 | https://doi.org/10.3389/feart.2023.1274142
This article is part of the Research Topic Advanced Methods for Interpreting Geological and Geophysical Data View all 36 articles
 Musaab A. A. Mohammed1,2*Fuat Kaya3
 Ahmed Mohamed4
 Saad S. Alarifi5
 Ahmed Abdelrady6*Ali Keshavarzi7Norbert P. Szabó1,8Péter Szűcs1,8
Agriculture is considered one of the primary elements for socioeconomic stability in most parts of Sudan. Consequently, the irrigation water should be properly managed to achieve sustainable crop yield and soil fertility. This research aims to predict the irrigation indices of sodium adsorption ratio (SAR), sodium percentage (Na%), permeability index (PI), and potential salinity (PS) using innovative machine learning (ML) techniques, including K-nearest neighbor (KNN), random forest (RF), support vector regression (SVR), and Gaussian process regression (GPR). Thirty-seven groundwater samples are collected and analyzed for twelve physiochemical parameters (TDS, pH, EC, TH, Ca+2, Mg+2, Na+, HCO3−, Cl, SO4−2, and NO3−) to assess the hydrochemical characteristics of groundwater and its suitability for irrigation purposes. The primary investigation indicated that the samples are dominated by Ca-Mg-HCO3 and Na-HCO3 water types resulted from groundwater recharge and ion exchange reactions. The observed irrigation indices of SAR, Na%, PI, and PS showed average values of 7, 42.5%, 64.7%, and 0.5, respectively. The ML modeling is based on the ion’s concentration as input and the observed values of the indices as output. The data is divided into two sets for training (70%) and validation (30%), and the models are validated using a 10-fold cross-validation technique. The models are tested with three statistical criteria, including mean square error (MSE), root means square error (RMSE), and correlation coefficient (R2). The SVR algorithm showed the best performance in predicting the irrigation indices, with the lowest RMSE value of 1.45 for SAR. The RMSE values for the other indices, Na%, PI, and PS, were 6.70, 7.10, and 0.55, respectively. The models were applied to digital predictive data in the Nile River area of Khartoum state, and the uncertainty of the maps was estimated by running the models 10 times iteratively. The standard deviation maps were generated to assess the model’s sensitivity to the data, and the uncertainty of the model can be used to identify areas where a denser sampling is needed to improve the accuracy of the irrigation indices estimates.
Groundwater is one of the primary providers of irrigation water for agriculture, offering a dependable and sustainable source of irrigation water (Li et al., 2022). The utilization of groundwater for irrigation offers various benefits, including dependability and regularity. Unlike surface water, which can be impacted by floods and droughts, groundwater is generally consistent and can ensure a continuous supply of irrigation water (Mohammed et al., 2022c). This is crucial in areas with insufficient or unstable surface water supplies (Osta et al., 2022). Additionally, groundwater can be used in combination with surface water to create a more dependable and long-lasting source of irrigation water (Mohamed et al., 2023). Farmers can lessen their reliance on surface water and improve the effectiveness of their irrigation systems by employing both surface water and groundwater. However, aquifers need to be managed and protected to ensure the long-term sustainability of groundwater as a source of irrigation water (Docheshmeh Gorgij et al., 2022). The eastern Nile River region is mostly dependent on groundwater for irrigation because it is agricultural terrain (Mohammed et al., 2023d). The high reliance on groundwater for irrigation is due to the absence of surface water transporting systems and the high cost of delivering Nile water to agricultural lands (Farah et al., 2000). As a result, and due to the expanding agricultural lands and over-pumping of groundwater aquifers, the groundwater quality for domestic and agricultural purposes is declining (Eyankware et al., 2022). The quality of groundwater for irrigation purposes is crucial since it determines crop yields, soil fertility and permeability (El Bilali et al., 2021). In order to produce crops sustainably, this project aims to assess the suitability of groundwater for irrigation using advanced computational artificial intelligence (AI) systems.
Irrigational water quality might vary greatly based on the quantity and quality of soluble salts. Other parameters, such as variations in climatic conditions, may significantly influence the irrigational groundwater (Sattari et al., 2018). For instance, groundwater quality is poorer during the dry seasons compared to rainy seasons due to delusion by groundwater recharge. Therefore, water quality evaluations should be made during each irrigation cycle. Some physiochemical parameters are present in all irrigation water, which can have major impacts even with tiny concentrations. The type of salt present in the water and its overall concentration affects the suitability of the irrigation water. Salt can harm soil and plants regardless of its form or quantity. Consequently, several water quality indices were proposed considering different physiochemical parameters on groundwater or the impact of the irrigational water on the soil (Wilcox, 1948; Richards, 1954; Doneen, 1964; Kelly and Reiter, 1984). For instance, sodium percentage (Na%) and sodium adsorption ratio (SAR) determine the amount of sodium relative to the other cations and thus detect the effect of the cation exchange process on soil permeability (Chidambaram et al., 2022). Permeability index (PI) directly measures the influence of a particular water quality type on the soil (Kouadra and Demdoum, 2020), while potential salinity (PS) indicates the suitability of irrigational water for particular plants (Masoud et al., 2022). Usually, in assessing irrigational water quality, these parameters are combined for comprehensive evaluation. Irrigation indices are effective instruments for determining whether groundwater is suitable for agricultural use. However, the calculation of these indices is often lengthy and time-consuming (Nouraki et al., 2021); therefore, AI techniques are proposed to reduce the calculation time and avoid calculation errors (Nabiollahi et al., 2021). Because AI models can evaluate vast amounts of data and produce precise forecasts, their usage in irrigation water management has increased recently (Yu et al., 2022; Masoudi et al., 2023).
Groundwater and/or water quality studies have extensively used AI and machine learning (ML) approaches (Ahmed et al., 2019; Abdel-Fattah et al., 2021; Mohammed et al., 2022b, 2022a; Docheshmeh Gorgij et al., 2022; Najafzadeh et al., 2022; Nasir et al., 2022; Nong et al., 2023). This paper aims to introduce the application of AI techniques in irrigation water management, with a focus on the prediction of irrigation water indices. Recently, the use of AI techniques for the prediction of irrigation indices has been growing due to the high non-linearity and complexity of these indices (Pipia et al., 2019; Rahnama et al., 2020; Sattari et al., 2020; Dimple et al., 2022; Trabelsi and Ali, 2022). For instance, Mokhtar et al. (2022) used support vector regression (SVR) and random forest (RF) to model the irrigation water quality of potential salinity, sodium percentage and permeability index in Bahr El-Baqr, Egypt. They indicated the robustness of these algorithms to support the decision-making process for sustainable crop yield. Yahyaoui et al. (2023) conducted a comparative study to examine the capabilities of several ML algorithms, including K-nearest neighbor (KNN), support vector machine (SVM) and decision trees in predicting irrigational water quality indices (IWQI) in Cap-Bon, Tunisia. Their study revealed the efficiency of KNN techniques over the others. Singh (2020) employed SVM and Gaussian process regression (GPR) for the simulation of SAR in three sub-watersheds in Iran. These studies demonstrated the potential of AI and ML as a tool for predicting various water quality indices in irrigation systems and highlighted the importance of such predictions in improving water management practices and ensuring sustainable agriculture. However, these studies rely only on the prediction of the observed values without examining the capabilities of AI techniques in detecting the spatial distribution of the predicted indices. In this research, we proposed a geospatial prediction methodology based on integrating geographical information systems (GIS) with ML algorithms. Other techniques, such as Remote sensing and geostatistics, are widely used for monitoring urban water supplies and assessing their potential for future advancements (Liu et al., 2023). In addition, an adaptive model was constructed for the purpose of correcting water depth bias correction (Zhou et al., 2023).
This paper aims to examine the capability of several geospatial AI algorithms, including KNN, RF, SVR, and GPR integrated with GIS to predict the spatial distribution of irrigational water quality indices of Na %, SAR, PS and PI. The results of this research improve irrigation water management and the efficiency and sustainability of agricultural production.
This study explores the suitability of groundwater for irrigation purposes in the eastern Nile River area, Khartoum state, Sudan. The study area lies between longitude 32° 30′ and 32° 47′ and latitude 15° 34′ and 15° 55′ (Figure 1). The area is characterized by a hot climate in summer, cold and dry in winter, and associated with an annual average precipitation of 115.7 mm/year in the fall season. The main geomorphological features are the Nile and Blue Nile Rivers, which bound the study area from the west. In general, the topography of the study area is flat, with an elevation range from 227 m above mean sea level (a.m.s.l) in the western and central parts to more than 497 m in the eastern part of the area (Figure 1).

FIGURE 1. The primary geomorphological features are depicted by the research area’s location.
Geologically, the area is located in the Blue Nile rift basin, where three geological units dominate. Figure 2 illustrates the primary geological units observed in the study area. The Pan African basement rocks of the Precambrian age form the bottom of the Blue Nile basin (Idriss et al., 2011; Mohammed et al., 2023e). These rocks are dominated by biotite granite, gneiss, and schist mainly observed near Khartoum’s northern and eastern boundaries (Awad, 1994). The Precambrian basement rocks are overlain by mudstone, sandy mudstone, conglomerates, and sandstone, which have been consolidated by limestone, siliceous, and ferrous minerals (Mohammed et al., 2023a). This rock accumulation is known as Cretaceous Nubian Formation (Mohammed et al., 2023f). This formation also comprises evaporite deposits formed in a braided environment and dispersed throughout the Nile and Blue Nile Rivers (Hussein, 1992). The recent deposit of Quaternary age is observed in the surroundings of the Blue and Nile Rivers and the eastern part of the study area. This geological unit is also known as the Gezira formation and comprises unconsolidated sand, gravel, and silts (Whiteman, 1971).
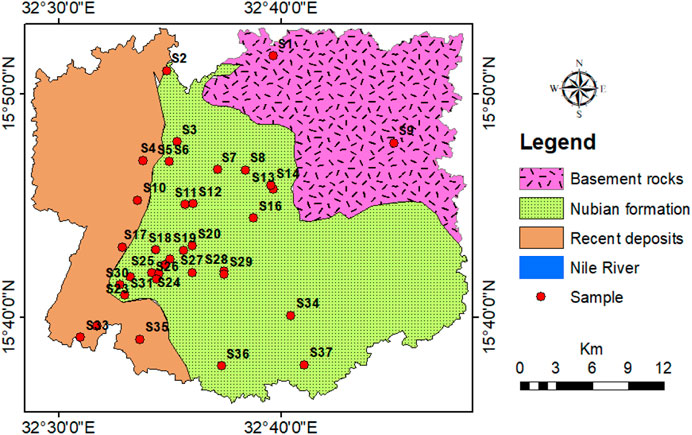
FIGURE 2. Geological map illustrates the main geological units in the study area.
The Nubian sandstone, with an average thickness of 300 m, serves as a primary groundwater aquifer in the study area (Köhnke et al., 2017). This aquifer is classified as highly productive, with an average transmissivity of 700 m2/day (Elkrail and Adlan, 2019; Mohammed M. et al., 2023). Given that there is relatively minimal recharge from rainfall, the Nile River and ephemeral streams are the primary sources of groundwater recharge to the Nubian formation (Mohammed et al., 2023c). As a result, groundwater levels range from 366.6 m in the western parts near Nile River to 294 m in the eastern part (Figure 3). Consequently, groundwater flows mainly from the western to the eastern part of the region.
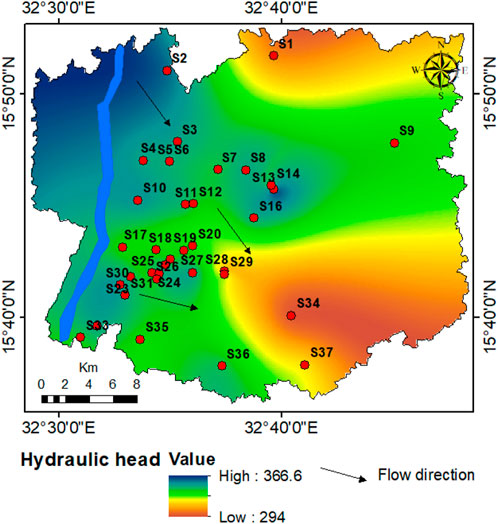
FIGURE 3. The groundwater flow map shows the areal variation in groundwater levels.
As part of the “zero thirsty” program administered by the Sudanese government, the Khartoum State Water Corporation collected 37 groundwater samples in December 2020. The aim of the zero thirsty project was to avail a clean and sustainable water supply in the Sudanese states. Khartoum state, as the most populated, was part of this project in which the suitability of groundwater for drinking purposes needs to be determined. The groundwater samples were collected from public and privately owned groundwater wells with a depth ranging from 100 to 250 m (Mohammed et al., 2023f). The sampling protocol is followed during the data collection. The groundwater wells are pumped for 30 min before the sample collection, and the samples are preserved in a polyethylene bottle washed with deionized water. The containers were transferred to the lab in an ice-filled box after being packed securely. The groundwater samples were analyzed in the labs of Groundwater and Wadies Directorate for eleven (11) physiochemical parameters. The parameters include total dissolved solids (TDS), hydrogen ion activity (pH), electrical conductivity (EC), total hardness (TH), calcium (Ca), magnesium (Mg), sodium (Na), bicarbonate (HCO3), chloride (Cl), sulfate (SO4), and nitrate (NO3). EC, TDS, and pH was determined shortly after sample collection using a portable multi-parameter equipment. While for Cl, SO4, NO3, Ca, Mg, Na, ion chromatography (IC) is used to analyze these parameters by separating ions based on their charge and affinity to the stationary phase.
Since groundwater fulfills the principle of electrical equilibrium, the electrical balance (EB) between the major cations and anions in meq/L is calculated using Appelo and Postma (2005) formula (Eq. 1) to examine the accuracy of the hydrochemical analysis. In this investigation, the EB for all the analyzed samples ranged between +10 and −10, which indicates acceptable accuracy.
The quality of irrigation water and its suitability for various crops are assessed using irrigation water quality indices (Mallik et al., 2022). There are several different irrigation water indicators; however, in this research, four indices are used for the management of irrigation water, including sodium adsorption ratio (SAR), sodium percentage (Na%), permeability index (PI), and potential salinity (PS). The sodium adsorption ratio (SAR) indicates the amount of sodium in water and how it could impact crops and soil (Richards, 1954). Low SAR levels are often regarded as acceptable for irrigation, whereas high SAR values can cause soil dispersion and poor crop development. The overall amount of sodium in the water is also determined by the sodium percentage (Na %) (Wilcox, 1948). The capacity of irrigation water to infiltrate into the soil is measured by the permeability index (PI), which highly influences plant growth by affecting the absorption of water by plants (Falowo et al., 2017). The total amount of dissolved salts in the water is measured by potential salinity (PS) (Doneen, 1964). High PS values can cause the soil to become salinized, which can harm crop development. The following formulas with the physiochemical parameters measured in meq/L can be used to determine the irrigation indices.
Four machine learning models were used in this study to predict irrigation indices: KNN, GPR, SVR, and RF. The dataset was separated into two parts: 70% for calibrating the machine learning models and 30% for validating the models. The analysis of the ML algorithms was conducted using the R Core Environment version 4.2.1 (Team, 2009). Evaluations specific to each algorithm are presented in separate sections, and the parameters used in the model application process are presented in tables in the following part.
The KNN tries to identify the k-nearest instances in the training set and assigns the instance to the label that occurs most frequently within that k-subset. If the values are continuous, the target can be calculated by computing the mean. Nearest-neighbor methods utilize the observations in the calibration set that is closest in input space to
where
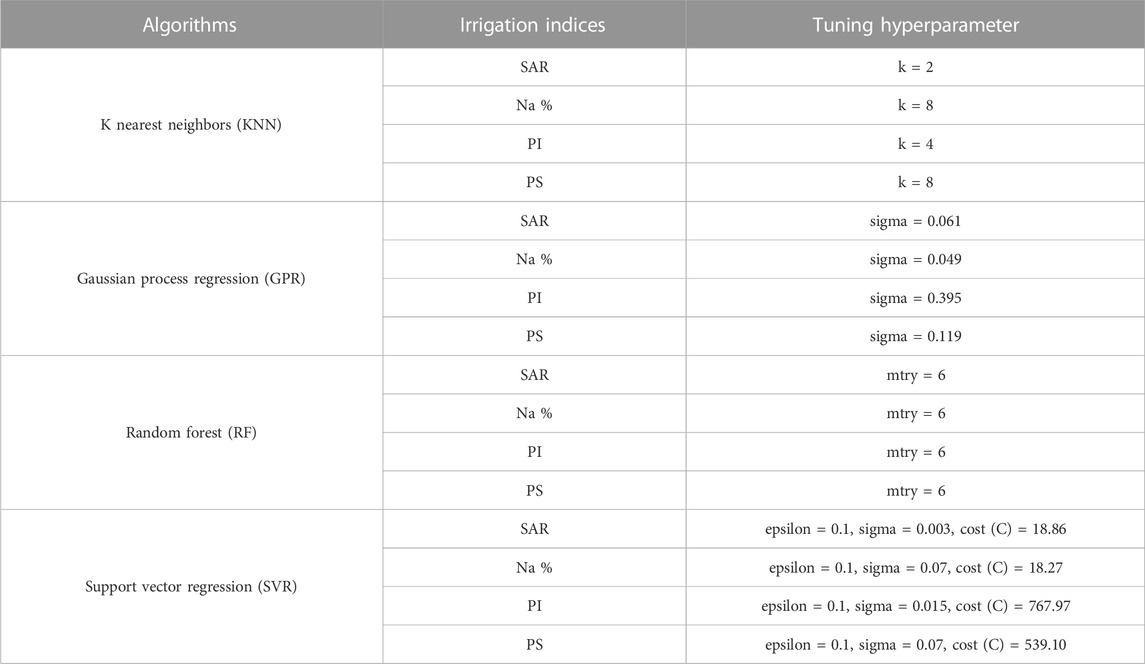
TABLE 1. Machine learning algorithm parameters used to model irrigation indices.
The RF (Breiman, 2001) is an enhanced version of bagging that involves constructing a large number of uncorrelated trees and combining their predictions. For a more detailed understanding of the Random Forest method, one can consult Biau and Scornet, (2016). The “randomForest” package by Liaw et al. (2002) was used in this study. The optimal value of the parameter “mtry” was determined through a parameter tuning process using the “train” function in the “caret” package in the R Core Environment software (Version 4.2.1). In this study, the default settings were used for the other parameters (etc., ntree) in the “randomForest” package. The optimal number of mtry was determined through a parameter searching process and the results for the irrigation indices models are presented in Table 1.
In this study, GPR (Rasmussen et al., 2006) was employed to examine the relationship between water quality parameters and spatial distribution of irrigation indices. GPR was used for both inference and mapping purposes. GPR aims to reconstruct the underlying signal f by removing the contaminating noise ε. For a deeper understanding of the GPR method, can refer to the publication by Rasmussen et al. (2006) and Ballabio et al. (2019). The Gaussian radial basis function (RBF) kernel is one of the most popular kernels used in Gaussian Process Regression, and it can model non-linear relationships between the input variables and the target variable. By using the “gaussprRadial” method in the “train” function of the “caret” package, the GPR algorithm was implemented using the Gaussian RBF kernel in the R Core Environment software (Version 4.2.1). The parameter of the GPR models were optimized by using a repeated 10-fold cross-validation method to prevent overfitting and presented in Table 1.
The SVR is a machine-learning technique that utilizes kernels to map the input space to a high-dimensional feature space, allowing for non-linear mapping (Drucker et al., 1996). The goal of SVR is to reduce both prediction errors and model complexity simultaneously. The optimization problem is solved using Lagrange multipliers and results in a set of support vectors that define the boundary. The prediction for a new data point is then made based on the support vectors and their weights. In this study, the SVR method was implemented using the “e1071” package (Meyer et al., 2020) in the R Core Environment software (Version 4.2.1). The model’s parameters, including the choice of kernel function and the value of parameter c, were determined through a parameter tuning process using a random search method. The optimal values for these parameters are reported in Table 1. For a more detailed understanding of the SVR method, one can consult Hastie et al. (2009).
The KNN, GPR, SVR, and RF algorithms require the setting of several user-defined hyper-parameters. To find the optimal values for these parameters, the “caret” package (Kuhn et al., 2020) via R software (Team, 2009) was employed in this study. This tuning process computed a 10-fold cross-validation and random search method to determine the optimal values (Table 1). Subsequently, Kriging method is used to visualize and model the predicted parameters. It offers a valuable tool for generating spatially continuous maps that accurately represent the distribution of a irrigational indices across an area. It is particularly effective when data is sparse or irregularly distributed and when capturing spatial trends and correlations is crucial for analysis.
In this study, the accuracy of the predicted and observed data was evaluated using three widely metrics: root mean square error (RMSE), mean absolute error (MAE), and coefficient of determination (R2). To accurately reflect the overall accuracy of the machine learning models, only the evaluation metrics for the validation set are calculated.
where Oi and Pi are, respectively, the observed and predicted values, with their average values represented by Oave and Pave, respectively, and n is the sample size in validation set. Most previous studies have aimed to enhance the performance of data-based models in estimating irrigation indices. However, the overall spatial uncertainty of the models used for modeling irrigation indices has not been assessed yet. Therefore, uncertainty was calculated as the standard deviation of the predictions of irrigation indices in each pixel over 10 iterations, which represents the spread of predicted values around the mean in each pixel (Yigini et al., 2018).
A number of eleven parameters are used to investigate the hydrochemical characteristics of the groundwater samples. The concentration of the parameters resulting from the hydrochemical analysis is illustrated in Table 2, while Table 3 summarizes the descriptive statistics of the analyzed parameters. The comparison of between the concentration of the parameters and the standard of the World Health Organization (WHO) (Edition, 2011) indicated that the maximum concentration of most parameters exceeded the permissible limit. The amount of the TDS ranged from 190.2 to 1742 mg/L, with the highest concentration observed in S27. TDS is considered the most important parameter in studying groundwater salinity (Freeze and Cherry, 1979; Mohammed et al., 2022c). Since groundwater with TDS higher than 1,000 mg/L is considered as brackish water (Carroll, 1962), 8% of the samples were classified as brackish, while the remaining percentage is considered freshwater. The pH of groundwater samples varied between 6.5 and 8.59 with a mean value of 7.6, denoting that most of the groundwater samples are neutral to alkaline, with one sample (S17) above the acceptable limit of WHO (Edition, 2011). The range of the EC content in groundwater samples is from 317 to 2,620 μS/cm. Three samples, including S2, S6, and S27, exceeded the EC standard limit of 1,500 μS/cm. The concentration of TH ranged from 124 to 890 mg/L. The maximum concentration is recorded in S6, and the minimum is in S29. According to Sawyer and McCarty (1967) classification, 78.3% of the groundwater samples are considered hard water (TH 150–300 mg/L), while the remaining 21.6% are very hard water (TH > 300). With an average value of 47 mg/L, the Ca+2 concentration ranged from 11 to 101 mg/L. while for Mg+2 concentrations ranged from 5.8 mg/L in the S12 location to 82.6 mg/L in the S16. Na+ concentration varied between 10 and 640 mg/L, with S1 showing the lowest concentration and S27 the highest. Only 5.4% (S16 and S27) exceeded the WHO-allowable level (Edition, 2011). The HCO3− concentration ranges from 98 to 620 mg/L, with an average of 302. Eleven samples had HCO3− concentration higher than the WHO recommendations. Since the Cl− concentration ranges from 4 to 193 mg/L, all groundwater samples exhibit Cl− contents below guidelines. The concentration of SO4−2 in groundwater samples ranges from 3 mg/L in S31 to 650 mg/L in S27. Samples in the study area had NO3− contents ranging from 0.0012 to 70 mg/L. S34 shows the highest concentration, whereas S10 shows the lowest. Only one sample (S34) had NO3− levels that were above WHO standards.
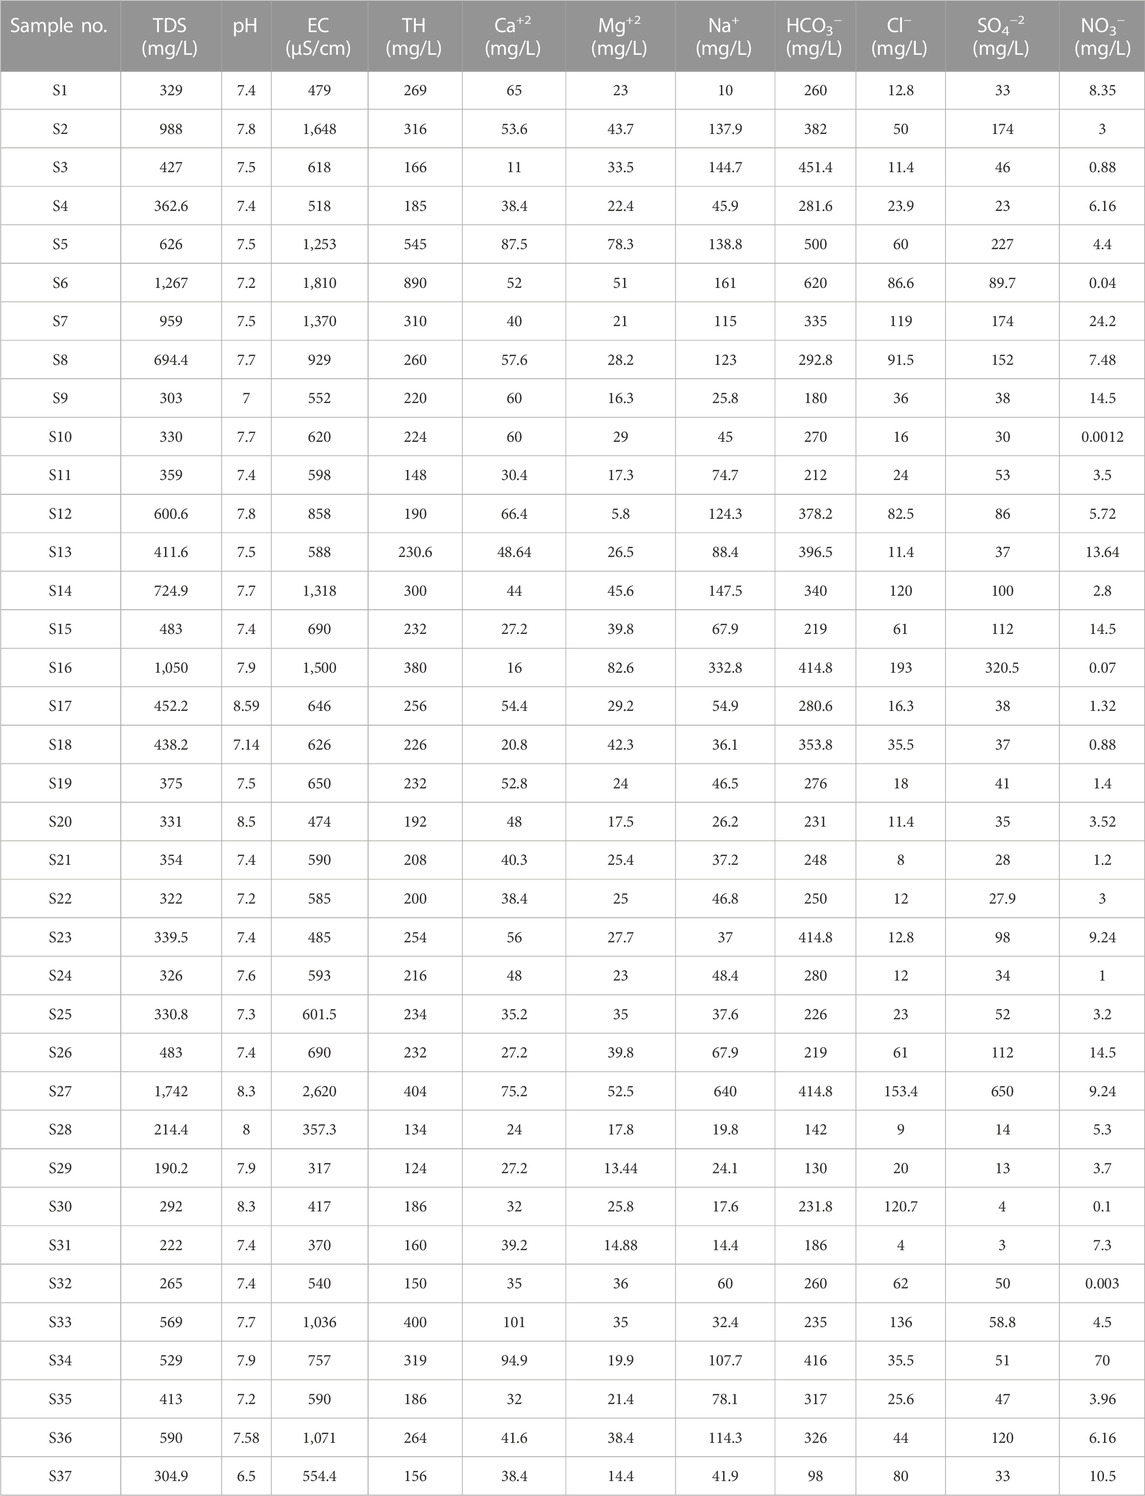
TABLE 2. The findings derived from the hydrochemical study conducted on the gathered groundwater samples.
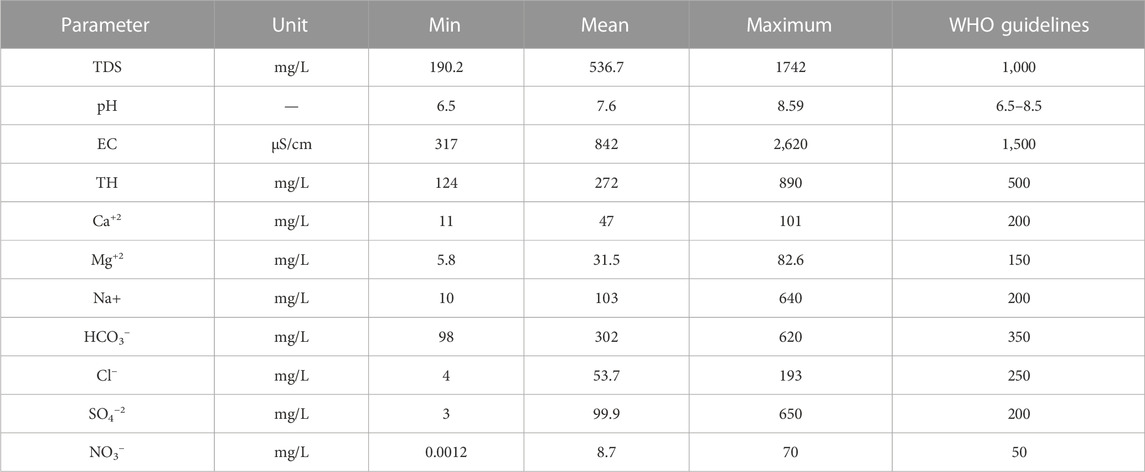
TABLE 3. The descriptive statistics of the measured parameters compared to WHO guidelines (Edition, 2011).
The regional distribution of these factors is depicted in Figure 4. The majority of the parameters demonstrate a consistent pattern as the concentration progressively increases from the western to the eastern region of the research area. Unlike most of the parameters HCO3− and Ca+2, the most significant concentration is situated in the western region of the research area, which is likely an indication of the impact of Nile water infiltration, which is likely to be highly concentrated with HCO3− and Ca+2 (Mohammed et al., 2022b). The change in the hydrochemical facies is also studied with the aid of Chadha (1999) diagram. In this diagram, the difference between major cations (Ca+2 + Mg+2) - (Na+ + K+) and anions [HCO3 - (SO4−2 + Cl−)] is used to detect the groundwater types (Figure 5). Consequently, four groundwater facies are revealed as Na-Cl, Ca-Mg-SO4/Cl, Na-HCO3, and Ca-Mg-HCO3. Most of the groundwater samples (67.5%) fall in Ca-Mg-HCO3 water type, which indicates the influence of groundwater recharge on groundwater chemistry. The locations of these samples are within the influence of the Nile River, which is 12 km (Farah et al., 2000). The groundwater type gradually changes from the western to the eastern parts of the study area from Ca-Mg-HCO3 to Na-HCO3 water type. This change is likely due to ion exchange or the replacement of Ca+2 and Mg+2 with Na+. As a result, 16.2% of groundwater samples are identified as Na-HCO3 water type. 8.1% of the samples are classified as Ca-Mg-SO4/Cl resulting from reverse anion exchange in which HCO3− is replaced by Cl− in groundwater. The continuation of cation and reverse anion exchange leads to the Na-Cl facies (Abdelsalam et al., 2016). In this study, 8.1% are classified as saline water. The hydrochemical attributes of groundwater in the eastern Nile River region are predominantly governed by the processes of groundwater recharge and ion exchanges.
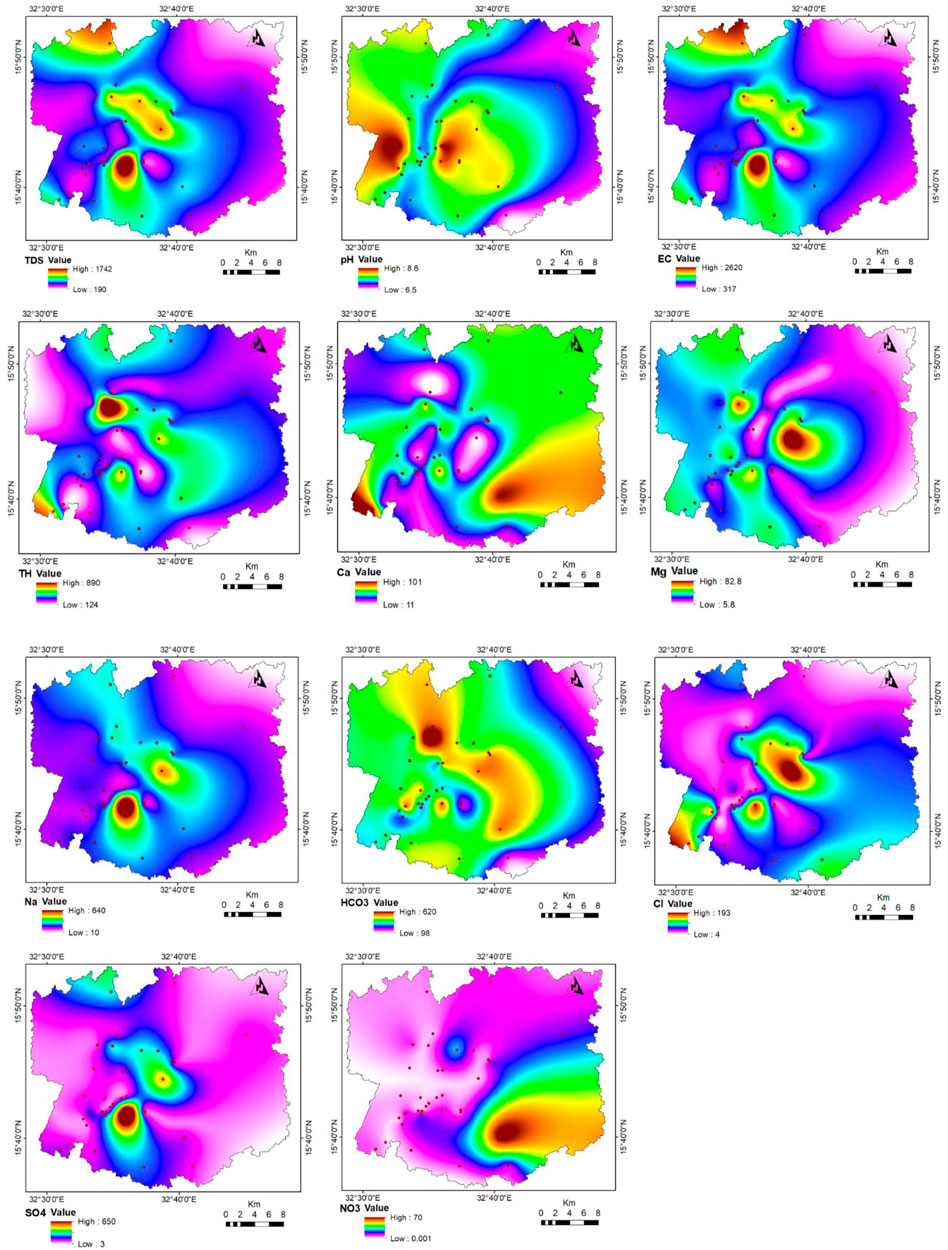
FIGURE 4. The areal variation of the analyzed parameters used for groundwater quality evaluation.
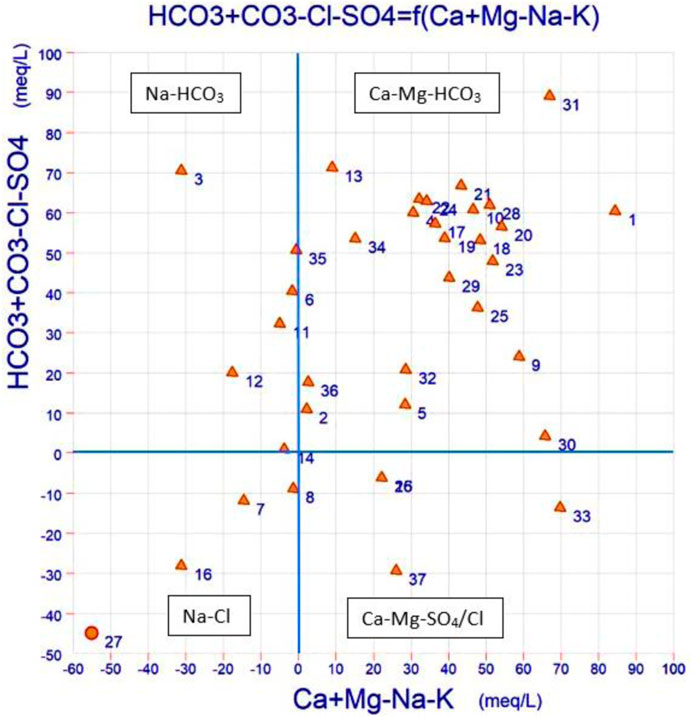
FIGURE 5. Chadha diagram showing the hydrochemical facies of the groundwater samples.
Agricultural activities are one of the primary proficient in central Sudan, and groundwater is considered a primary source for irrigation. The quality of groundwater used for irrigation is highly influencing soil fertility and crop growth; as a result, the suitability of irrigational water must be assessed. In this research, four indices are used to evaluate the quality of groundwater for irrigation, including SAR, Na+ %, PI and PS. The estimated indices of the groundwater samples utilized in this study are presented in Table 4.
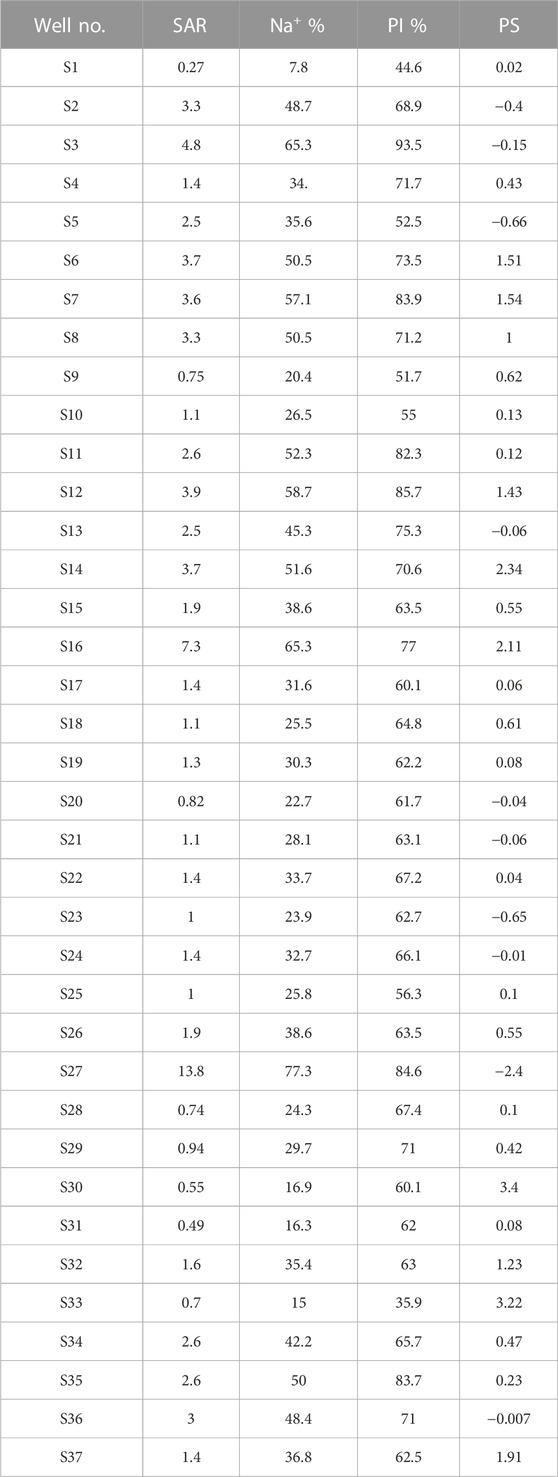
TABLE 4. The observed irrigation indices of the groundwater samples used in this study.
The SAR ranged from 0.27 to 13.8. The classification of groundwater samples is represented in Figure 6A (USSL diagram). Groundwater is divided into four groups based on SAR: excellent with SAR < 10 (S1); good [SAR ranges from 10 to 18 (S2)]; doubtful, in which SAR ranges from 18 to 26 (S3); and unsuitable with SAR > 26 (S4) (Richards, 1954). In general, SAR is influenced by the concentration of Na+ relative to the other cations such as Ca+2, Mg+2 and K+ (Rawat et al., 2018). In practice, groundwater is usually classified by conjugation of SAR with EC, since irrigation water with high salinity stimulates the ion exchange process and thus affects the adsorption of water by plants. Salinity. Based on EC, groundwater is classified as water with low (C1), medium (C2), high (C3), and very high (C4) salinity hazard. As a result, 59.4% of the groundwater samples are associated with low SAR (S1) and medium salinity hazard (C2). This class is considered excellent for irrigation purposes. 35% of the samples are projected in S1C3 class with low alkali and high salinity hazard. This class might not affect the soil permeability however, high salinity may influence the growth of salinity-sensitive plants and thus reduces the crops yield. One sample (S16) is plotted in S2C3 class with medium alkali and high salinity hazards. S27 is classified as unsuitable for irrigation since it is associated with high alkali and high salinity hazards (S4C4). This persistent use of this sample for irrigation will damage the soil permeability by incorporating Na+ within the soil particles and affect the growth of plants.
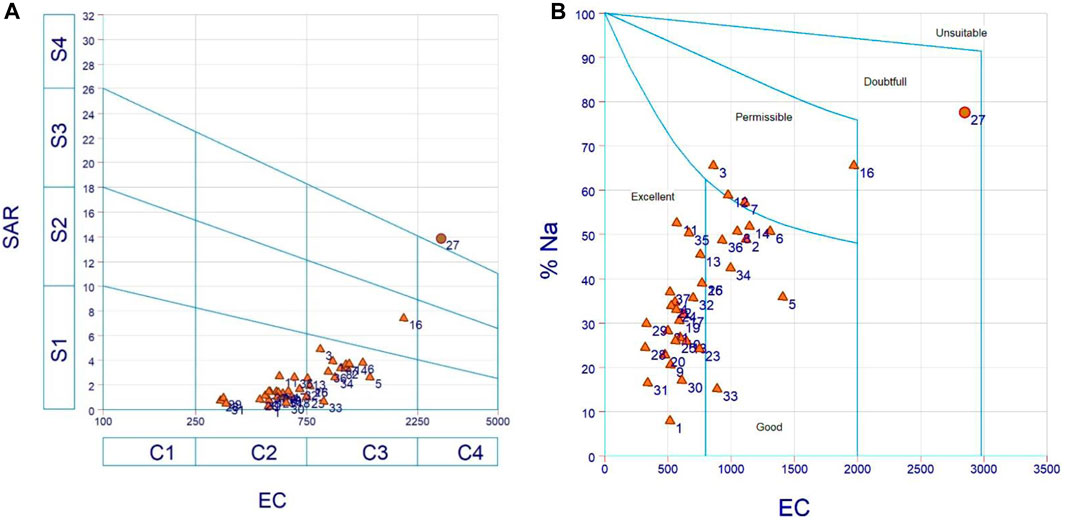
FIGURE 6. Classification of groundwater samples based on (A) SAR and (B) Na+%.
The principle of Na% is almost similar to that of SAR in which the percentage of Na+ relative to the cations of Ca+2 and Mg+2 is measured. Na+ is incorporated into the clay minerals sheets while the other cations are removed, which affects the infiltration of water to the plants root. The exchange results in two types of soils, saline soils formed when Na+ reacted with Cl− while the alkaline soil when Na+ reacted with HCO3− in the irrigation water (Eyankware et al., 2022). In this study, Na+%varied between 7.8% and 77.3%. On the basis of Na+%, groundwater is classified as excellent for irrigation (Na+% less than 20%), good (20%–40%), acceptable (40%–60%), doubtful (60%–80%), and unsuitable (Na+% greater than 80%) (Khodapanah et al., 2009). The groundwater samples are plotted in Wilcox (1948) diagram (Figure 6B). Accordingly, 64.8% of the groundwater samples are projected in the excellent class zone. This class is associated with low salinity and alkali hazard. 21.6% of the samples are classified as good for irrigation with relatively high salinity and low alkali hazard. The permissible water class included 10.8% of the groundwater samples with high alkali hazard and relatively low salinity. The groundwater in this class is mostly influenced by the rock type. Only one sample is described as doubtful for irrigation purposes, and this sample is highly influenced by salinity.
PI is used to show the influence of irrigation water on the soil and thus evaluate the suitability of water for irrigation. PI is based on the concentrations of the alkali ions in the groundwater. In this research, PI ranged from 35.9% to 93.5%. Generally, based on PI, groundwater is categorized into three classes as class I (PI greater than 75%), class II (PI ranges from 25% to 75%), and class III (PI less than 25%) (Singh et al., 2020). The groundwater samples in class I and Class II are excellent and good, while in class III are unsuitable for irrigation. In this investigation, 18% of the groundwater samples are projected in class I and classified as excellent for irrigation, while 82% of the samples are classified as good for irrigation.
PS varied from −2.4 to 3.4, with a mean value of 0.5. In general, groundwater with PS greater than 5 is considered injurious to unsuitable for irrigation, PS between 3 and 5 is regarded as good, while PS less than 3 considered excellent for agricultural purposes (Raghunath, 1987). The negative values of PS have resulted from high concentration of SO4−2 compared to Cl−. This situation is mainly due to the dissolution of sulphate minerals along the groundwater flow path. Mohammed et al. (2022b) calculated the saturation indices of groundwater in the study area and indicated that gypsum (CaSO4) is precipitated in most groundwater samples. This is likely to be the cause of high SO4−2. Based on the obtained values of PS, most groundwater samples are classified as excellent to good for irrigation, with some samples exhibiting negative values of PS. Even though the PS rated the majority of the samples as satisfactory for irrigation, a thorough examination of the water quality parameters is necessary to determine the suitability for irrigation. In some cases, some ions might have greater than reference values which leads to changing soil characteristics or influencing plant growth (Maia and Rodriguesda, 2012). As a result, it can be indicated that the groundwater samples with too low negative values can be considered injurious for irrigation since a high concentration of SO4−2 is remarkably affecting plant growth (Papadopoulos, 1986).
In conclusion, evaluating groundwater use for agricultural purposes is comprehensively achieved by considering several combined indices. It can also be said that the use of a certain type of water depends on the type of plant and its tolerance to salinity or its sensitivity to a certain parameter. The type of soil, whether it is acidic or alkaline, is also influencing plant growth. The quantity of water that a particular plant needs for growth may be related to one index rather than the other. For example, a low permeability index reduces the amount of water that can be absorbed by the plant and thus may affect the growth of plants.
In this study, the SAR, Na%, PI, and PS values were estimated using the KNN, GPR, RF, and SVR models, and the performance of each model was evaluated based on the R2, MAE, RMSE, and testing stages, as shown in Table 5. In general, the developed models, except for SVR did not provide adequate modeling of the SAR parameter in groundwater and did not produce satisfactory SAR estimates based on the performance criteria used. However, the results for SAR estimation showed that the SVR model was the best performer, with the highest R2 value of 0.83 and the lowest error performance values, including MAE=0.76 and RMSE = 1.45, in the validation phase (Table 5). For clarity, the prediction of SAR parameter by the best-performing model, which is the SVR, will be shown in scatter plots as seen in Figure 7. The results of the modeling for the Na% parameter in groundwater showed that the SVR model was the best performer among the models tested, with the highest R2 value of 0.84 and the lowest error performance values including MAE = 5.16 and RMSE = 6.70 in the validation phase. The RF model was the second-best performer, with an R2 value of 0.79 and error performance values of MAE = 4.72 and RMSE = 7.71 in the validation phase. The scatter plots of the Na% parameter prediction by the best-performing models, the SVR and RF, are shown in Figure 7. The other models tested did not provide adequate modeling of the Na% parameter and did not produce satisfactory Na% estimates based on the performance criteria used.
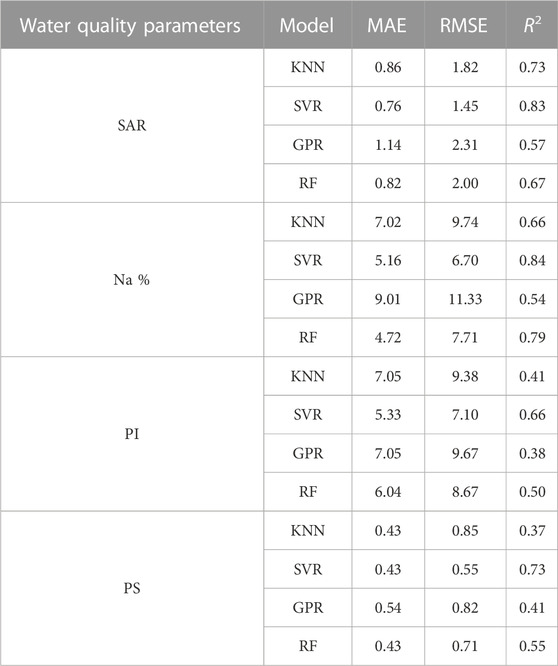
TABLE 5. Machine Learning Algorithms assessments criteria of validation set for water quality parameters, root mean square error (RMSE), mean absolute error (MAE), and r squared (R2) values.
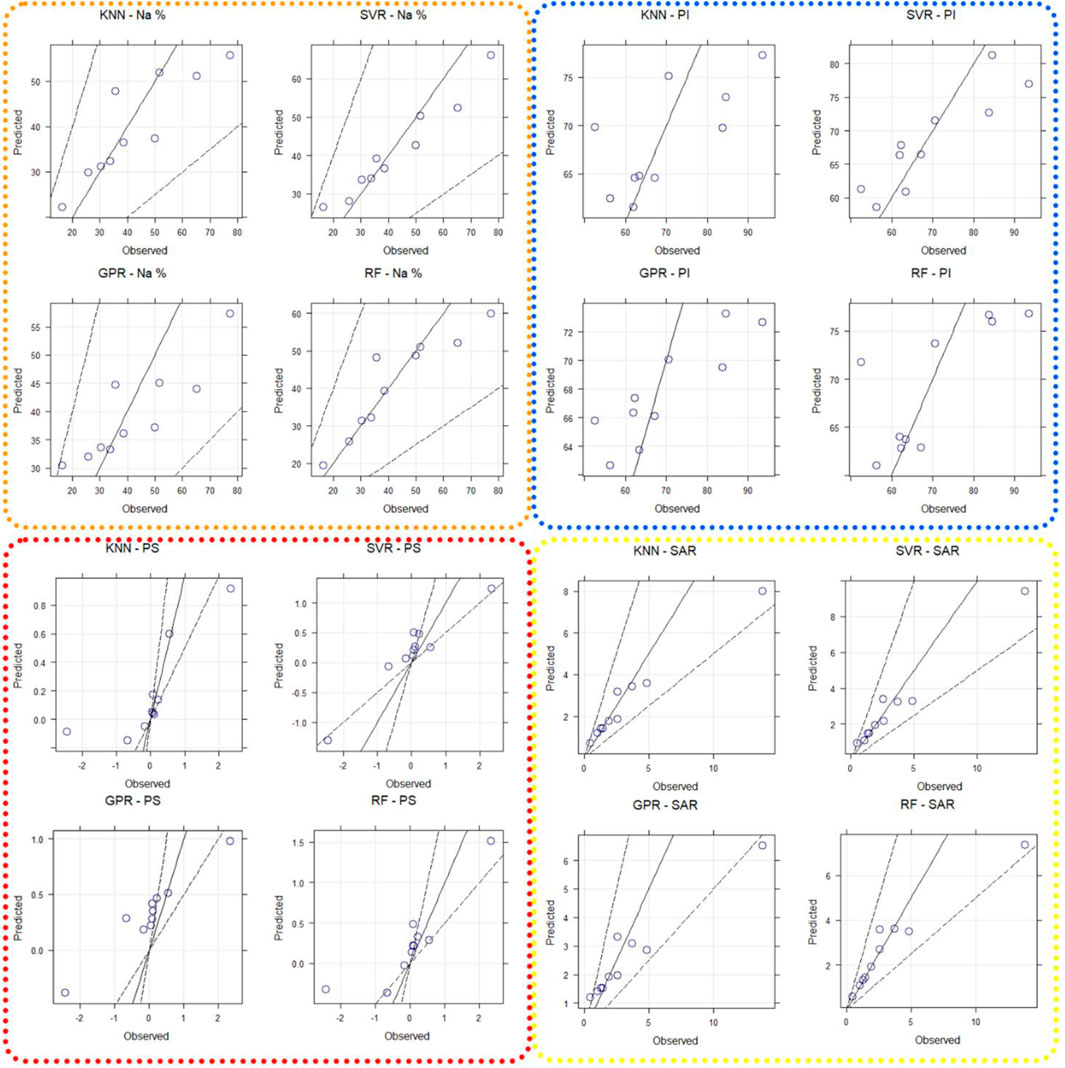
FIGURE 7. Scatter plots of observed irrigation indices and estimated irrigation indices by different machine learning models for the validation period. Abbreviations: KNN, k-nearest neighbors; GPR, Gaussian process regression; SVR, support vector regression; RF, random forest.
The results of the analysis showed that all the machine learning algorithms used in the modeling process performed below an R2 value of 0.70 for the PI indicator in the validation set. The SVR algorithm was found to be the best performer for the PI parameter, with the lowest values for both RMSE (7.10) and MAE (5.33) in the validation phase. The results indicate that the SVR algorithm performed best in predicting the PS parameter in groundwater, with the highest R2 value of 0.73 and the lowest error performance values, including RMSE = 0.55, in the validation phase. Other developed models did not perform well in modeling the PS parameter and did not produce satisfactory PS estimates based on the performance criteria used. The prediction of the PS parameter by the best performing SVR model will be shown in scatter plots in Figure 7. The box plots of the predicted irrigation indices using different machine learning models are shown in Figure 8. According to the one-way ANOVA analysis performed in the validation set and the results of the Tukey’s test (with a significance level of p < 0.05), there was no statistically significant difference in the estimation of irrigation indices among the different models. However, this suggests that among the compared models, the SVR model provides the best performance in terms of the estimation of irrigation indices (Table 5 and Figure 7).

FIGURE 8. Box plot showing the distribution of the predicted indices using different ML algorithms.
A continuous digital map of SAR (Figure 9), Na % (Figure 10), PI (Figure 11) and PS (Figure 12) for the study area was produced from the results of the four different machine learning models using the predictor variables raster stack of the training dataset.
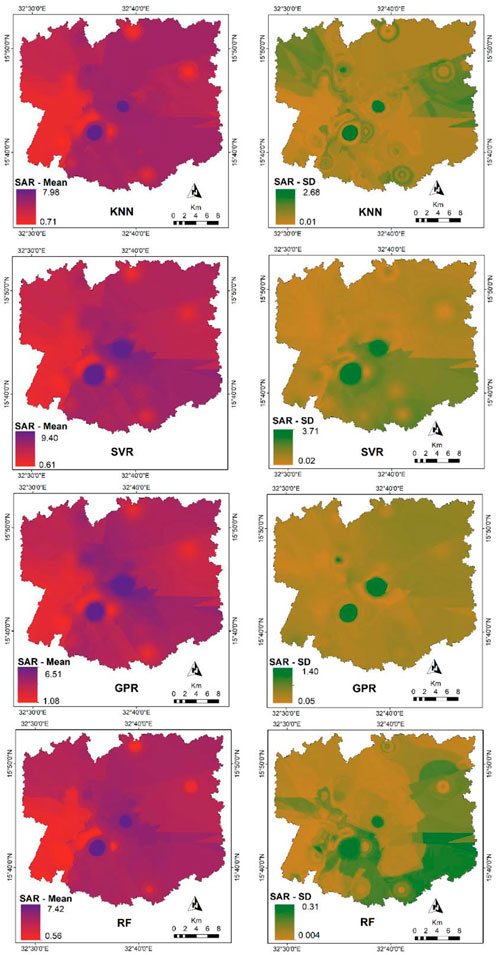
FIGURE 9. Mean and standard deviation maps of the predicted SAR derived from 10 times different machine learning models on a 100 m × 100 m grid-map.
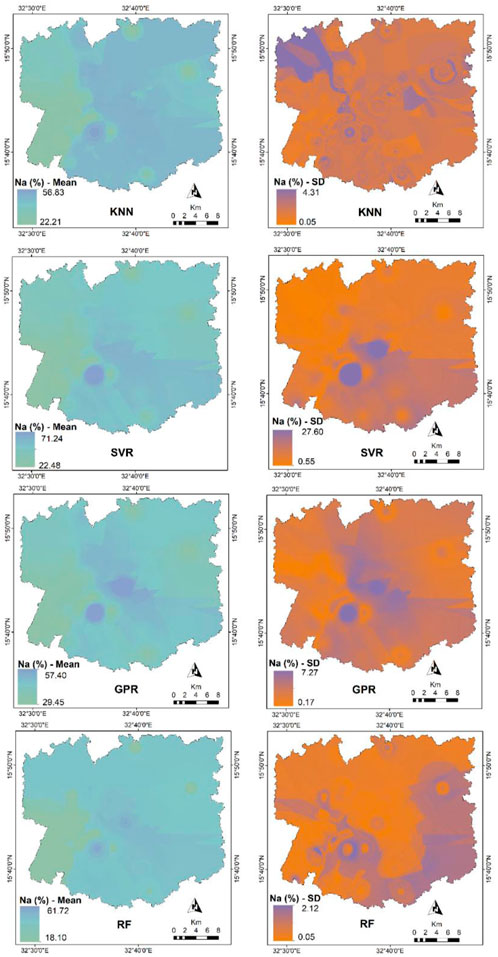
FIGURE 10. Mean and standard deviation maps of the predicted Na (%) derived from 10 times different machine learning models on a 100 m × 100 m grid-map.
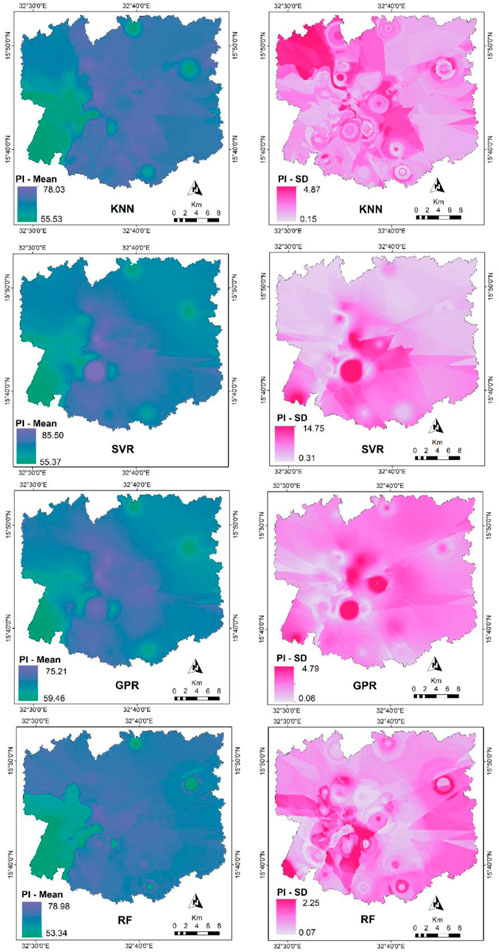
FIGURE 11. Mean and standard deviation maps of the predicted PI derived from 10 times different machine learning models on a 100 m × 100 m grid-map.
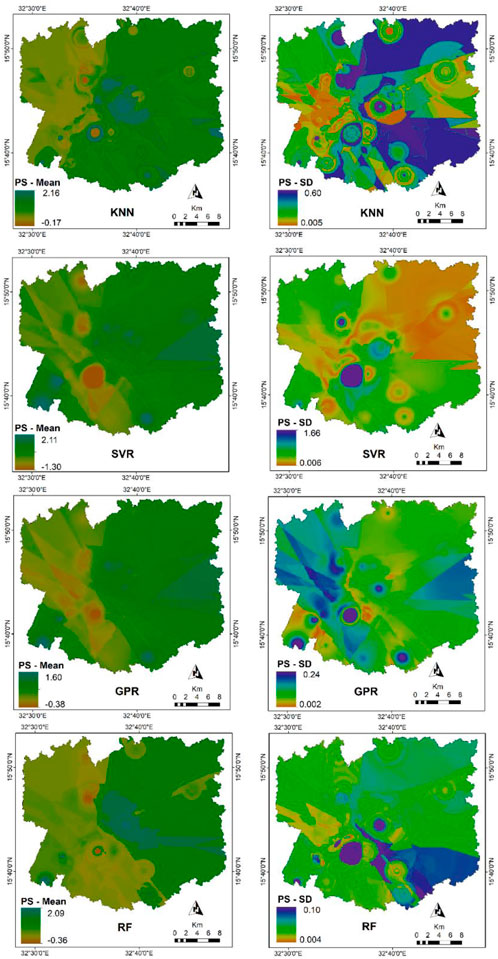
FIGURE 12. Mean and standard deviation maps of the predicted PS derived from 10 times different machine learning models on a 100 m × 100 m grid-map.
The spatial distribution of SAR concentrations in groundwater are predicted with all four models for the eastern Nile River region, Khartoum state, Sudan (Figure 9). In general, all four models show similar patterns for the spatial SAR distribution that only differ locally from each other. The western parts of the study area are associated with low values of SAR, likely due to the influence of groundwater recharge on groundwater samples. The highest values in the southern and central parts are generally due to the high mineralization of groundwater samples due to the dissolution of halite minerals within the Nubian formations (Abdelsalam et al., 2016; Mohammed et al., 2023b). The values of predicted SAR recorded in the KNN model ranged from 0.71 to 7.98, while in the SVR model they ranged from 0.61 to 9.40. The GPR model had a range of 1.08–6.51, and the RF model had a range of 0.56–7.42 (Figure 9). Overall, the minimum estimated SAR values were comparable among all models, except for the GPR. However, the maximum values varied among the models. The maximum uncertainty was the smallest in the RF model, ranging from 0.004 to 0.31, while in all other models, the uncertainty varied from 0.01 to 3.71. Uncertainty in the SAR estimation was particularly high in areas with low sampling density, but SAR prediction uncertainty was higher in the southeast of the study area.
The results of the spatial distribution prediction for Na % using all four models in the eastern Nile River area, Khartoum state, Sudan, are presented in Figure 10. The performance of each model in predicting the Na % concentrations in groundwater can be compared based on the accuracy and uncertainty of the maps produced. The maps can be used to identify areas where the concentrations are high or low and to understand the spatial distribution patterns of Na % in groundwater. The variation of Na+ % shows a similar trend to that of SAR as the central and southern parts depict high concentrations relative to the rest of the study area. The results of the predicted sodium percentage (Na%) from the KNN, SVR, GPR, and RF models are presented in Figure 10. The range of Na% values predicted by the KNN model was between 22.21 and 56.83, while the SVR model had a range of 22.48–71.24. The GPR model had a range of 29.45–57.40 and the RF model had a range of 18.10–61.72. Overall, the highest estimated Na% values were similar across all models, except for the SVR model. The minimum values, however, differed among the models. The RF model had the smallest uncertainty range, between 0.05 and 2.12, while in all other models, the uncertainty varied between 0.05 and 27.60. The uncertainty of Na% estimation was particularly high in areas with low sample density, with higher uncertainty observed in the southeast, east, and northwest regions of the study area.
We employed four models (KNN, SVR, GPR, and RF) to predict the spatial distribution of PI concentrations in groundwater in the Eastern Nile River area of Khartoum state, Sudan (Figure 11). Results indicated that all four models generated similar patterns of PI distribution, albeit with some local differences. The lowest PI is indicated in S33 location in the southwestern part of the study area however these samples showed low SAR and Na+%. This can be explained by two factors. The groundwater recharge from Nile River which increase the HCO3− concentration in the groundwater samples and therefore reduce the PI. Alternatively, it might be affected by clay nature of the quaternary deposits. The soil properties including compaction and organic contents may also influence the soil permeability (Khalaf and Hassan, 2013). In this case, the SAR and Na+ will eventually be increased due to the ongoing ion exchange reactions. The predicted values of PI obtained from the four models ranged from 53.34 to 85.50, with the highest estimated values being recorded in the SVR model and the lowest in the RF model (Figure 11). The RF model exhibited the lowest level of uncertainty in its predictions, with a range of 0.07–2.25, while in the other models, the uncertainty ranged from 0.06 to 14.75. The uncertainty in PI predictions was higher in areas with low sampling density and in the central and northwest regions of the study area.
The prediction of PS concentrations in groundwater using four models (KNN, SVR, GPR, and RF) in the eastern Nile River area, Khartoum state, Sudan is presented in Figure 12. In general, all models show similar spatial patterns of PS distribution, with only minor differences in some areas. The values of predicted PS recorded by the KNN model range from −0.17 to 2.16, by the SVR model from −1.30 to 2.11, by the GPR model from −0.38 to 1.60, and by the RF model from −0.36 to 2.09. Although the maximum estimated PS values are comparable among all models, the minimum estimated values vary, with the exception of the GPR model. The maximum uncertainty was the lowest in the RF model, ranging from 0.004 to 0.10, while in all other models, the uncertainty varies from 0.006 to 1.66. Areas with low sampling density had high uncertainty in PS estimation, and areas in the central, southeast, and northeast had higher PS prediction uncertainty.
Overall findings indicate that the four models have similar capabilities in predicting the spatial distribution of irrigation indices in groundwater. However, as these models use different mathematical basis, small differences in their predictions can still exist. These differences may be due to the different weightings given to the input variables, the type of algorithm used, and other factors. In this study, the GPR model had difficulty accurately spatially predicting the minimum and maximum values for all irrigation indices. This means that the GPR model, which is based on a normal distribution, may have trouble accurately representing data points that are significantly different from the average or have extreme values, known as outliers. This suggests that in datasets with outliers, the GPR model may not perform as well compared to other models. This suggests that the GPR model might not be suitable for modeling datasets with outliers or data that do not follow a Gaussian distribution. As supported by our results, it could be beneficial to consider other models such as RF or SVR, that can handle these types of datasets better. The findings of this study support the difficulty of the GPR model in representing the minimum and maximum values in the data set when outliers are present. This highlights the limitations of the GPR model, especially in the context of datasets with varying data distribution and outliers, such as the groundwater data in the eastern Nile River region, Khartoum state, Sudan. Additionally, it might be worth exploring ways to transform the data to make it more Gaussian-like before using the GPR model to see if this improves the model’s performance. Overall, the models can provide useful information for understanding the spatial distribution of irrigation indices in groundwater, but further validation and analysis are needed to determine the most accurate and reliable model for this purpose. This means that the overall distribution of irrigation indices in the study area, as predicted by the four models, is similar but with some slight variations in specific locations. Overall, the models produce similar results, indicating that the distribution of irrigation indices values in the study area is relatively consistent.
In this study, an approach was presented to assess the sensitivity of the model to the available data (rasters of predicted variables) and the uncertainty of the model (Figures 9–12). Complex areas like the study area, with deltas and adjacent uplifting regions, often have strong multifactor interactions, non-linearity, and non-stationary relationships, leading to highly heterogeneous groundwater properties spatially. However, the uncertainty maps (Figures 9–12) present some conflicting results in revealing the spatial variation of irrigation indices with limited predictive variables and several water samples. To provide insight into the reliability of the irrigation indices estimates, areas with high standard deviation values should be emphasized. Other researchers have also noted the significance of uncertainty maps in mapping irrigation indices for local areas with high groundwater heterogeneity or small sample sizes (Taşan et al., 2022). It should be acknowledged that the representation and application of uncertainty maps in machine learning predictions still require improvement.
In this research, four computational machine learning (ML) algorithms (KNN, SVR, GPR, and RF) integrated with GIS were used to evaluate the suitability of groundwater for irrigation purposes based on four irrigational indices (SAR, Na%, PI, and PS). This approach is followed to overcome the limitations of the conventional assessment of groundwater quality parameters. Based on the modeling results, the conclusions can be summarized as follows:
• The initial analysis revealed that the groundwater samples are dominated by Ca-Mg-HCO3 and Na-HCO3 water types resulted from groundwater recharge and ion exchange processes.
• The observed irrigational indices indicated that the majority of the groundwater samples (60%) are excellent agricultural purposes. The remaining samples are mostly influenced by high salinity resulted from rock-water interactions.
• The GIS-based statistical approach allows the estimation of groundwater irrigation indices derived only from spatially mapped physiochemical parameters. The use of machine learning models is trained with a point data set of groundwater physiochemical parameters with exclusively spatial predictors.
• All four model types resulted in reasonable to good predictions for the spatial distribution of irrigation indices in groundwater. However, the SVR algorithm showed the best performance in predicting the irrigation indices, with the lowest RMSE value of 1.45 for SAR. The RMSE values for the other indices, Na%, PI, and PS, were 6.70, 7.10, and 0.55 in the test data set, respectively.
• The determination of the actual contributing area of the monitoring sites through a process-based representation of the groundwater flow conditions could probably improve the predictive performance of the models. However, the inclusion of locally specific groundwater flow conditions is challenging on even larger scales due to a lack of information.
The original contributions presented in the study are included in the article/supplementary material, further inquiries can be directed to the corresponding authors.
MM: Data curation, Formal Analysis, Investigation, Methodology, Project administration, Resources, Software, Supervision, Visualization, Writing–original draft, Writing–review and editing. FK: Formal Analysis, Investigation, Methodology, Resources, Writing–original draft. AM: Conceptualization, Data curation, Project administration, Software, Supervision, Validation, Visualization, Writing–review and editing. SA: Conceptualization, Funding acquisition, Investigation, Methodology, Project administration, Writing–original draft. AA: Investigation, Methodology, Visualization, Writing–review and editing. AK: Investigation, Methodology, Project administration, Resources, Writing–original draft. NS: Conceptualization, Methodology, Resources, Software, Validation, Writing–review and editing. PS: Data curation, Investigation, Project administration, Resources, Writing–review and editing.
This research was supported by Researchers Supporting Project number (RSP2023R496), King Saud University, Riyadh, Saudi Arabia.
The authors declare that the research was conducted in the absence of any commercial or financial relationships that could be construed as a potential conflict of interest.
All claims expressed in this article are solely those of the authors and do not necessarily represent those of their affiliated organizations, or those of the publisher, the editors and the reviewers. Any product that may be evaluated in this article, or claim that may be made by its manufacturer, is not guaranteed or endorsed by the publisher.
Abdel-Fattah, M. K., Mokhtar, A., and Abdo, A. I. (2021). Application of neural network and time series modeling to study the suitability of drain water quality for irrigation: a case study from Egypt. Environ. Sci. Pollut. Res. 28, 898–914. doi:10.1007/s11356-020-10543-3
Abdelsalam, Y. E., Ea, E. M., and Elhadi, H. El (2016). “Problems and factors which retard the development and the utilization of groundwater for drinking purposes in the Khartoum state-Sudan,” in 7th international conference on environment and engineering geophysics \& summit forum of Chinese academy of engineering on (Dordrecht: Engineering Science and Technology), 449–451.
Ahmed, U., Mumtaz, R., Anwar, H., Shah, A. A., and Irfan, R. (2019). E ffi cient water quality prediction using supervised. Water 11, 1–14
Appelo, C. A. J., and Postma, D. (2005). Geochemistry, groundwater and pollution. 2nd. Rotterdam: Balkema.
Awad, A. Z. (1994). Stratigraphic palyloical and paleoclogical studies in east Central Sudan (Khartoum–Kosti Basin) Late Jurassic to mid tertiary.
Ballabio, C., Lugato, E., Fernández-Ugalde, O., Orgiazzi, A., Jones, A., Borrelli, P., et al. (2019). Mapping LUCAS topsoil chemical properties at European scale using Gaussian process regression. Geoderma 355, 113912. doi:10.1016/j.geoderma.2019.113912
Biau, G., and Scornet, E. (2016). A random forest guided tour. Test 25, 197–227. doi:10.1007/s11749-016-0481-7
Carroll, D. (1962). Rainwater as a chemical agent of geologic processes. A Review-Geological Surv. water-supply 1535, 1–16.
Chadha, D. K. (1999). A proposed new diagram for geochemical classification of natural waters and interpretation of chemical data. Hydrogeology J. 7, 431–439. doi:10.1007/s100400050216
Chidambaram, S., Prasanna, M. V., Venkatramanan, S., Nepolian, M., Pradeep, K., Panda, B., et al. (2022). Groundwater quality assessment for irrigation by adopting new suitability plot and spatial analysis based on fuzzy logic technique. Environ. Res. 204, 111729. doi:10.1016/j.envres.2021.111729
Dimple, D., Rajput, J., Al-Ansari, N., and Elbeltagi, A. (2022). Predicting irrigation water quality indices based on data-driven algorithms: case study in semiarid environment. J. Chem. 2022, 1–17. doi:10.1155/2022/4488446
Docheshmeh Gorgij, A., Askari, G., Taghipour, A. A., Jami, M., and Mirfardi, M. (2022). Spatiotemporal forecasting of the groundwater quality for irrigation purposes, using deep learning method: long short-term memory (lstm). SSRN Electron. J. 277, 108088. doi:10.2139/ssrn.4192344
Doneen, L. D. (1964). Notes on water quality in agriculture published as a water science and engineering. Department of Water Sciences and Engineering, University of California. paper 4001.
Drucker, H., Burges, C. J., Kaufman, L., Smola, A., and Vapnik, V. (1996). Support vector regression machines. Adv. neural Inf. Process. Syst. 9.
Edition, F., and Ozolins, G. (2011). WHO guidelines for drinking-water quality. WHO Chron. 38, 104–108.
El Bilali, A., Taleb, A., and Brouziyne, Y. (2021). Groundwater quality forecasting using machine learning algorithms for irrigation purposes. Agric. Water Manag. 245, 106625. doi:10.1016/j.agwat.2020.106625
Elkrail, A. B., and Adlan, M. (2019). Groundwater flow assessment based on numerical simulation at omdurman area, Khartoum state, Sudan. Afr. J. Geosciences 2, 59–65.
Eyankware, M. O., Akakuru, O. C., and Eyankware, O. E. (2022). Hydrogeophysical delineation of aquifer vulnerability in parts of Nkalagu area of Abakaliki, se. Nigeria. Sustain. Water Resour. Manag. 8, 39–19. doi:10.1007/s40899-022-00603-6
Falowo, O. O., Akindureni, Y., and Ojo, O. (2017). Irrigation and drinking water quality index determination for groundwater quality evaluation in Akoko Northwest and Northeast areas of Ondo State, Southwestern Nigeria. Am. J. Water Sci. Eng. 3, 50–60. doi:10.11648/j.ajwse.20170305.11
Farah, E. A., Mustafa, E. M. A., and Kumai, H. (2000). Sources of groundwater recharge at the confluence of the Niles, Sudan. Environ. Geol. 39, 667–672. doi:10.1007/s002540050479
Hastie, T., Tibshirani, R., Friedman, J., Hastie, T., Tibshirani, R., and Friedman, J. (2009). “Overview of supervised learning,” in The elements of statistical learning: Data mining, inference, and prediction, 9–41.
Hussein, M. T. (1992). On the depositional framework of the cretaceous omdurman formation in Khartoum area, Sudan. J. Afr. Earth Sci. 14, 559–566. doi:10.1016/0899-5362(92)90088-T
Idriss, H., Salih, I., and Sam, A. (2011). Study of radon in ground water and physicochemical parameters in Khartoum state. J. Radioanalytical Nucl. Chem. 290, 333–338. doi:10.1007/s10967-011-1295-4
Kelly, W. E., and Reiter, P. F. (1984). Influence of anisotropy on relations between electrical and hydraulic properties of aquifers. J. hydrology 74, 311–321. doi:10.1016/0022-1694(84)90021-0
Khalaf, R. M., and Hassan, W. H. (2013). Evaluation of irrigation water quality index (iwqi) for Al-dammam confined aquifer in the west and southwest of karbala city, Iraq. Int. J. Civ. Eng. (IJCE) 2, 21–34.
Khodapanah, L., Sulaiman, W. N. A., and Khodapanah, N. (2009). Groundwater quality assessment for different purposes in Eshtehard District, Tehran, Iran. Eur. J. Sci. Res. 36, 543–553.
Köhnke, M., Skala, W., and Erpenstein, K. (2017). “Nile groundwater interaction modeling in the northern Gezira plain for drought risk assessment,” in Geoscientific research in northeast africa (CRC Press), 705–711.
Kouadra, R., and Demdoum, A. (2020). Hydrogeochemical characteristics of groundwater and quality assessment for the purposes of drinking and irrigation in Bougaa area, Northeastern Algeria. Acta Geochim. 39, 642–654. doi:10.1007/s11631-019-00393-3
Kuhn, M., Wing, J., Weston, S., Williams, A., Keefer, C., Engelhardt, A., et al. (2020). caret: classification and Regression Training. R package version 6.0-86.
Li, J., Chen, J., He, P., Chen, D., Dai, X., Jin, Q., et al. (2022). The optimal irrigation water salinity and salt component for high-yield and good-quality of tomato in Ningxia. Agric. Water Manag. 274, 107940. doi:10.1016/j.agwat.2022.107940
Liu, Z., Xu, J., Liu, M., Yin, Z., Liu, X., Yin, L., et al. (2023). Remote sensing and geostatistics in urban water-resource monitoring: a review. Mar. Freshw. Res. 74, 747–765.doi:10.1071/MF22167
Mohammed, M. A. A., Eltijani, A., Szabó, N. P., and Szűcs, P. (2023b). Multi-criterion approach for assessment of hydrochemical characteristics and human health risk of groundwater in Khartoum State, Sudan. Res. Square. doi:10.21203/rs.3.rs-2481210/v1
Maia, C. E., and Rodrigues, K. K. (2012). Proposal for an index to classify irrigation water quality: a case study in northeastern Brazil. Rev. Bras. Ciência do Solo 36, 823–830. da P. doi:10.1590/s0100-06832012000300013
Mallik, S., Chakraborty, A., Mishra, U., and Paul, N. (2022). Prediction of irrigation water suitability using geospatial computing approach: a case study of agartala city, India. Environ. Sci. Pollut. Res. doi:10.1007/s11356-022-21232-8
Masoud, M., El Osta, M., Alqarawy, A., Elsayed, S., and Gad, M. (2022). Evaluation of groundwater quality for agricultural under different conditions using water quality indices, partial least squares regression models, and GIS approaches. Appl. Water Sci. 12, 244–322. doi:10.1007/s13201-022-01770-9
Masoudi, R., Mousavi, S. R., Rahimabadi, P. D., Panahi, M., and Rahmani, A. (2023). Assessing data mining algorithms to predict the quality of groundwater resources for determining irrigation hazard. Environ. Monit. Assess. 195, 319. doi:10.1007/s10661-022-10909-9
Meyer, D., Dimitriadou, E., Hornik, K., Weingessel, A., Leisch, F., Chang, C., et al. (2020). Misc functions of the department of statistics, probability theory group (formerly: E1071). TU Wien. Avialable at: https://cran.r-project.org/web/packages/e1071.
Mohammed, M. A. A., Khleel, N. A. A., Szabó, N. P., and Szűcs, P. (2022b). Modeling of groundwater quality index by using artificial intelligence algorithms in northern Khartoum State, Sudan. Model. Earth Syst. Environ. 9, 2501–2516. doi:10.1007/s40808-022-01638-6
Mohamed, A., Asmoay, A., Alarifi, S. S., and Mohammed, M. A. A. (2023). Simulation of surface and subsurface water quality in hyper-arid environments. Hydrology 10, 86. doi:10.3390/hydrology10040086
Mohammed, M. A. A., Abdelrahman, M. M. G., Szabó, N. P., and Szűcs, P. (2023a). Innovative hydrogeophysical approach for detecting the spatial distribution of hydraulic conductivity in bahri city, Sudan: a comparative study of csókás and heigold methods. Sustain. Water Resour. Manag. 4, 107–116. doi:10.1007/s40899-023-00885-4
Mohammed, M. A. A., Khleel, N. A. A., Szabó, N. P., and Szucs, P. (2022a). Development of Artificial intelligence model with aid of statistical methods for simulation of water quality indices in north Khartoum area, Sudan. Reaserch Sq. doi:10.21203/rs.3.rs-1679487/v1
Mohammed, M. A. A., Szabó, N. P., and Szűcs, P. (2023c). Assessment of the Nubian aquifer characteristics by combining geoelectrical and pumping test methods in the Omdurman area, Sudan. Model. Earth Syst. Environ. doi:10.1007/s40808-023-01767-6
Mohammed, M. A. A., Szabó, N. P., and Szűcs, P. (2023d). Characterization of groundwater aquifers using hydrogeophysical and hydrogeochemical methods in the eastern Nile River area, Khartoum State, Sudan. Environ. Earth Sci. 82, 219. doi:10.1007/s12665-023-10915-1
Mohammed, M. A. A., Szabó, N. P., and Szűcs, P. (2023e). Delineation of groundwater potential zones in northern Omdurman area using electrical resistivity method. IOP Conf. Ser. Earth Environ. Sci. 1189, 012012. doi:10.1088/1755-1315/1189/1/012012
Mohammed, M. A. A., Szabó, N. P., and Szűcs, P. (2023f). Exploring hydrogeological parameters by integration of geophysical and hydrogeological methods in northern Khartoum state, Sudan. Groundw. Sustain. Dev. 20, 100891. doi:10.1016/j.gsd.2022.100891
Mohammed, M. A. A., Szabó, N. P., and Szűcs, P. (2022c). Multivariate statistical and hydrochemical approaches for evaluation of groundwater quality in north Bahri city-Sudan. Heliyon 8, e11308. doi:10.1016/J.HELIYON.2022.E11308
Mohammed, M., Kovács, B., Szabó, N. P., and Szűcs, P. (2023g). Steady-state simulation of groundwater flow in Khartoum state, Sudan. Pollack Period. 1–7. doi:10.1556/606.2023.00758
Mokhtar, A., Elbeltagi, A., Gyasi-Agyei, Y., Al-Ansari, N., and Abdel-Fattah, M. K. (2022). Prediction of irrigation water quality indices based on machine learning and regression models. Appl. Water Sci. 12, 76. doi:10.1007/s13201-022-01590-x
Nabiollahi, K., Taghizadeh-Mehrjardi, R., Shahabi, A., Heung, B., Amirian-Chakan, A., Davari, M., et al. (2021). Assessing agricultural salt-affected land using digital soil mapping and hybridized random forests. Geoderma 385, 114858. doi:10.1016/j.geoderma.2020.114858
Najafzadeh, M., Homaei, F., and Mohamadi, S. (2022). Reliability evaluation of groundwater quality index using data-driven models. Environ. Sci. Pollut. Res. 29, 8174–8190. doi:10.1007/s11356-021-16158-6
Nasir, N., Kansal, A., Alshaltone, O., Barneih, F., Sameer, M., Shanableh, A., et al. (2022). Water quality classification using machine learning algorithms. J. Water Process Eng. 48, 102920. doi:10.1016/j.jwpe.2022.102920
Nong, X., Lai, C., Chen, L., Shao, D., Zhang, C., and Liang, J. (2023). Prediction modelling framework comparative analysis of dissolved oxygen concentration variations using support vector regression coupled with multiple feature engineering and optimization methods: A case study in China. Ecol. Indic. 146, 109845. doi:10.1016/j.ecolind.2022.109845
Nouraki, A., Alavi, M., Golabi, M., and Albaji, M. (2021). Prediction of water quality parameters using machine learning models: a case study of the karun river, Iran. Environ. Sci. Pollut. Res. 28, 57060–57072. doi:10.1007/s11356-021-14560-8
Osta, M. E., Masoud, M., Alqarawy, A., Elsayed, S., and Gad, M. (2022). Groundwater suitability for drinking and irrigation using water quality indices and multivariate modeling in makkah Al-mukarramah province, Saudi arabia. WaterSwitzerl. 14, 483. doi:10.3390/w14030483
Papadopoulos, I. (1986). Effect of high sulfate irrigation waters on soil salinity and yields 1. Agron. J. 78, 429–432. doi:10.2134/agronj1986.00021962007800030006x
Pipia, L., Muñoz-Marí, J., Amin, E., Belda, S., Camps-Valls, G., and Verrelst, J. (2019). Fusing optical and SAR time series for LAI gap fillingwith multioutput Gaussian processes. Remote Sens. Environ. 235, 111452. doi:10.1016/j.rse.2019.111452
Rahnama, E., Bazrafshan, O., and Asadollahfardi, G. (2020). Application of data-driven methods to predict the sodium adsorption rate (SAR) in different climates in Iran. Arabian J. Geosciences 13, 1160. doi:10.1007/s12517-020-06146-4
Rawat, K. S., Singh, S. K., and Gautam, S. K. (2018). Assessment of groundwater quality for irrigation use: a peninsular case study. Appl. Water Sci. 8, 233. doi:10.1007/s13201-018-0866-8
Sattari, M. T., Farkhondeh, A., and Patrick Abraham, J. (2018). Estimation of sodium adsorption ratio indicator using data mining methods: a case study in urmia lake basin, Iran. Environ. Sci. Pollut. Res. 25, 4776–4786. doi:10.1007/s11356-017-0844-y
Sattari, M. T., Feizi, H., Colak, M. S., Ozturk, A., Apaydin, H., and Ozturk, F. (2020). Estimation of sodium adsorption ratio in a river with kernel-based and decision-tree models. Environ. Monit. Assess. 192, 575. doi:10.1007/s10661-020-08506-9
Singh, B. (2020). Prediction of the sodium absorption ratio using data-driven models: a case study in Iran. Geol. Ecol. Landscapes 4, 1–10. doi:10.1080/24749508.2019.1568129
Singh, K. K., Tewari, G., and Kumar, S. (2020). Evaluation of groundwater quality for suitability of irrigation purposes: a case study in the udham singh nagar, uttarakhand. J. Chem. 2020, 1–15. doi:10.1155/2020/6924026
Taşan, M., Taşan, S., and Demir, Y. (2022). Estimation and uncertainty analysis of groundwater quality parameters in a coastal aquifer under seawater intrusion: a comparative study of deep learning and classic machine learning methods. Environ. Sci. Pollut. Res. 30, 2866–2890. doi:10.1007/s11356-022-22375-4
Team, R. D. C. (2009). A language and environment for statistical computing. Avialable at: http://www.R-project.org.
Trabelsi, F., and Ali, S. B. H. (2022). Exploring machine learning models in predicting irrigation groundwater quality indices for effective decision making in medjerda river basin, Tunisia. Sustain. Switz. 14, 2341. doi:10.3390/su14042341
Yahyaoui, N., Neji, M., Kallel, M., Wali, A., and Hajji, S. (2023). A comparative approach of ML algorithms to rank irrigation water quality: case of oriental-coast shallow aquifer in cap-bon, northeastern of Tunisia. Model. Earth Syst. Environ. 9, 3733–3746. doi:10.1007/s40808-023-01694-6
Yigini, Y., Olmedo, G. F., Reiter, S., Baritz, R., Viatkin, K., and Vargas, R. (2018). Soil organic carbon mapping: cookbook.
Yu, H., Wen, X., Wu, M., Sheng, D., Wu, J., and Zhao, Y. (2022). Data-based groundwater quality estimation and uncertainty analysis for irrigation agriculture. Agric. Water Manag. 262, 107423. doi:10.1016/j.agwat.2021.107423
Keywords: Nubian aquifer system, artificial intelligence, spatial uncertainty, irrigation, groundwater quality, Khartoum, Sudan
Citation: Mohammed MAA, Kaya F, Mohamed A, Alarifi SS, Abdelrady A, Keshavarzi A, Szabó NP and Szűcs P (2023) Application of GIS-based machine learning algorithms for prediction of irrigational groundwater quality indices. Front. Earth Sci. 11:1274142. doi: 10.3389/feart.2023.1274142
Received: 07 August 2023; Accepted: 24 August 2023;
Published: 07 September 2023.
Edited by:
Ahmed M. Eldosouky, Suez University, EgyptReviewed by:
Ahmed Asmoay, National Research Centre, EgyptCopyright © 2023 Mohammed, Kaya, Mohamed, Alarifi, Abdelrady, Keshavarzi, Szabó and Szűcs. This is an open-access article distributed under the terms of the Creative Commons Attribution License (CC BY). The use, distribution or reproduction in other forums is permitted, provided the original author(s) and the copyright owner(s) are credited and that the original publication in this journal is cited, in accordance with accepted academic practice. No use, distribution or reproduction is permitted which does not comply with these terms.
*Correspondence: Musaab A. A. Mohammed, bXVzYWIyMDUwMUBnbWFpbC5jb20=; Ahmed Abdelrady, YS5yLmEubWFobW91ZEB0dWRlbGZ0Lm5s
Disclaimer: All claims expressed in this article are solely those of the authors and do not necessarily represent those of their affiliated organizations, or those of the publisher, the editors and the reviewers. Any product that may be evaluated in this article or claim that may be made by its manufacturer is not guaranteed or endorsed by the publisher.
Research integrity at Frontiers
Learn more about the work of our research integrity team to safeguard the quality of each article we publish.