 Haijun Xie
 Wanlu Li
 Jin Li4
95% of researchers rate our articles as excellent or good
Learn more about the work of our research integrity team to safeguard the quality of each article we publish.
Find out more
TECHNOLOGY AND CODE article
Front. Earth Sci. , 14 September 2023
Sec. Solid Earth Geophysics
Volume 11 - 2023 | https://doi.org/10.3389/feart.2023.1273698
This article is part of the Research Topic Advanced Methods for Interpreting Geological and Geophysical Data View all 36 articles
Ensuring the safety of coal mine production requires accurate forecasting of coal road heading faces in advance. Because of its high resistance to electromagnetic interference, the mine direct current (DC) method has been widely utilized in the advanced detection and prediction of coal mines. The layout of the field source significantly influences the detection outcomes obtained through this method. In this study, a variety of full-space three-dimensional geoelectric models were established based on the fundamental principle of DC resistivity, and the response features of geological anomalies located in various positions in front of a roadway were studied under different field source conditions using finite element numerical simulation. The electrical response characteristics were analyzed with the electrodes positioned in different directions and two-point to seven-point current sources located on the floor and side of the roadway, respectively. The electrical response of the geological anomalies was characterized with varying positions of the multi-point current source in the roadway and the pole distance of the power supply electrode. Furthermore, the electrical response characteristics of the mine DC method in advanced detection were compared for geological anomalies placed differently across the entire space. The results indicate that the response effect of the geological anomaly in front of the roadway is greater when the field source is placed on the shorter side of the roadway cross-section, with the number of field sources showing a positive correlation with the product of the pole distance and low-resistance amplitude. In advanced detection by DC method, the existence of geological anomalies on the side will affect the recognition of anomalies in front of the roadway.
Worldwide energy consumption has been rising steadily each year, driven by rapid advancements in industrial technology. Consequently, coal continues to serve as the primary energy source in most developing countries. Currently, the coal resources in some of these countries have been extensively mined, leading to more complicated geological and hydrogeological conditions. In the coal mine production process, a critical concern is determining the location of hidden water-bearing geological anomalies ahead of the roadway (Li, 2021). Moreover, with the advancement of coal mine production techniques, comprehensive mechanized mining has replaced the original blast mining technique, greatly improving the working face development and recovery rate. Thus, the application of mine geophysical techniques to predict geological anomalies has risen in prominence (Xue et al., 2019).
Since the 1990s, mine electrical prospecting has undergone various stages of evolution, including coal seam roof and floor detection, small structure detection, advanced prediction of tunneling working face, and dynamic monitoring of stopes. Eventually, it has developed into a detection system primarily relying on mine resistivity, DC (Cao et al., 2017; Taha et al., 2021), transient electromagnetic method (Chang et al., 2019; Chen et al., 2020), frequency domain electromagnetic method (Xue et al., 2018), induced polarization method (Liu et al., 2022) and electromagnetic wave tomography (Yue et al., 2023). However, during the during the detection process, the limited underground space makes it challenging to avoid interference sources that affect the detection distance and accuracy (Liu, 2014), such as energized cables, anchor rods, anchor nets, rails, and road headers. In this regard, the DC method—widely employed in mines (Luo, 2017) owing to its excellent resistance to alternating current (AC) interference—has emerged as a major technique for advanced detection of mine roadways (Qiu, 2022; Mohamed et al., 2023).
Notably, the DC method is one of the earliest geophysical approaches for water-rich exploration (Xie et al., 2022; Mohamed et al., 2023). This technique is advantageous in terms of offering a wide range of choices on the construction and layout devices (Yu et al., 2023), making it suitable for anomaly detection under various geological conditions (Epov et al., 2016; Jerbeson and Walter, 2016). However, a notable drawback of the commonly used DC method is its low signal-to-noise ratio for deep detection, which impacts detection accuracy (Qiang et al., 2004; Xie et al., 2021). Researchers have found potential solutions to enhance the performance of this technique. Switching from a single-electrode to a multi-electrode power supply, or even to a limited long-line current source (Lu and Lv, 2014), has proven effective in improving signal intensity and compensating for the drawbacks of the typical electrical technique (Jamal et al., 2020). Moreover, Han et al. (2010) proposed a DC method for the advanced detection of water-conducting structures in coal mine excavation roadways by using the geometric intersection method; their approach improved the interpretation accuracy of the mine DC method for advanced detection.
Furthermore, numerical simulations using the DC method have also been instrumental in exploring the spatial distribution characteristics of the potential (Yang et al., 2013; Liu and Wu, 2016), thereby providing valuable guidance for practical fieldwork (Barker, 1989). In this regard, Li et al. (2019) compared the distribution characteristics of potential changes between the long-electrode and the point power supplies through numerical simulation, concluding that the long-electrode power supply is more conducive to detecting the location of low-resistance anomalies. Moreover, Liu (2014) simulated the impact of anomaly position changes on its response characteristics when the mine DC method is used for three-dimensional advanced detection. The side effect can be reduced by employing multiple point sources in the processing. However, the position of the electrodes in the roadway remains unexplored. Additionally, Ruan et al. (2010) simulated the advanced detection model by adding a shielding electrode adjacent to the original point power supply, thereby allowing the electric field to be focused and distributed in front of the roadway. Based on this concept, they proposed an advanced focusing detection device with the mine DC method and analyzed the anomalies in front of the roadway under different focusing strategies. Their results suggest that the anomalies can be better identified, regardless of whether a shielding electrode is used or not.
In the tunneling process involved in coal mines, sudden water-bearing geological anomalies will endanger the lives of miners. However, advanced geophysical prospecting technologies offer preventive measures against such accidents. Deng (2013) systematically analyzed the characteristics of geological anomalies and inversion interpretation methods by investigating the DC advanced detection technology of the focused electrode system. Moreover, Cheng et al. (2000) thoroughly described the acquisition and processing methods of the three-pole device in advanced detection and studied the resistivity response characteristics in the presence of a low-resistance anomaly in front of the roadway. Additionally, Li et al. (2020) simulated the electric field with the anomaly and the measuring electrode located at the opposite sides of the roadway in the point source field of the full space model; they discussed the resolution of the DC advanced detection. In particular, this detection technology has been extended beyond coal mining to tunnel engineering. Li et al. (2015) utilized the advanced detection technology of the homogeneous source array-focused resistivity method in tunnel engineering to predict the geological anomaly in front of the tunnel. Additionally, they analyzed the applicability of the advanced detection technology of the mine DC method in tunnel engineering.
Presently, the power supply used in the mine DC method for advanced detection typically comprises three power supply current sources. If the current source is improperly located in the roadway, the overall signal will be weak, and the collected signal at far advanced prediction distance will be severely distorted and cannot be interpreted accurately (Grigorev et al., 2021). In this study, we applied numerical simulations to evaluate the response characteristics of the geological anomaly in front when applying the multi-point power supply of the mine DC method for advanced detection at different points in the roadway. The influence of the number of power supply electrodes and the spacing of power supply electrodes on the detection accuracy was studied, and the resolution ability of mine DC method to the abnormal body was analyzed when the number of field sources was different.
Based on the field theory, the differential form of Ohm’s law, and the current continuity equation, the relationship between the potential and the charge distribution density in the space steady current field can be defined as follows (Gao, 2021; Huang, 2021):
where
As the charge density is difficult to measure, the Dirac function and the current intensity are introduced to obtain the differential relationship between the potential and the current, thereby transforming Eq. 1 into
Where
The aforementioned formula represents the relationship between potential and current in DC prospecting, serving as the foundation for numerical simulation. Given that the studied space is a homogeneous medium, σ is a constant and Eq. 2 can be simplified to Poisson’s equation. If the space is a passive field, Eq. 2 can be simplified to Laplace’s equation (Li, 1986).
Based on the field theory, the potential of a point power supply at any point in a homogenous space (U) is determined as
where x, y, and z are the coordinates of the observation point.
For an electric field with multiple point current sources, the potential at any point (UM) is the scalar sum of the potentials of multiple point sources at this point based on the field source superposition principle, as follows:
where
According to the potential field superposition theory, the potential variation under the multi-point source electric field can be equivalent to the accumulation of multi-point power source potential variations. The variation of multi-point source anomalous potential is defined as (Dai et al., 2012; Biswas and Sharma, 2020)
where
To solve the equations through the finite element method, we start by discretizing the three-dimensional research area into small units (Wang et al., 2022). As the tetrahedral subdivision yields a better performance compared to the hexahedral subdivision within the boundary range, we implemented a free tetrahedral element to subdivide the research area by meshing, as shown in Figure 1.
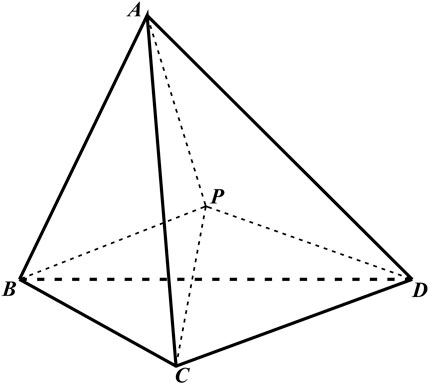
FIGURE 1. Sketch of the free tetrahedral element.
After meshing, the potential at any point in the free tetrahedral element was calculated by an interpolation function. The linear interpolation function used in this work is
The interpolation function was introduced to integrate and solve the functional terms in each free tetrahedral element. Followed by a complete synthesis, the function was extended to a matrix composed of all nodes in the entire space, as follows:
where
Upon defining the variation of Eq. 8 as 0, the linear equation is obtained as follows:
The anomalous potential
The background field of Model 1 is a sphere measuring 100 m in radius
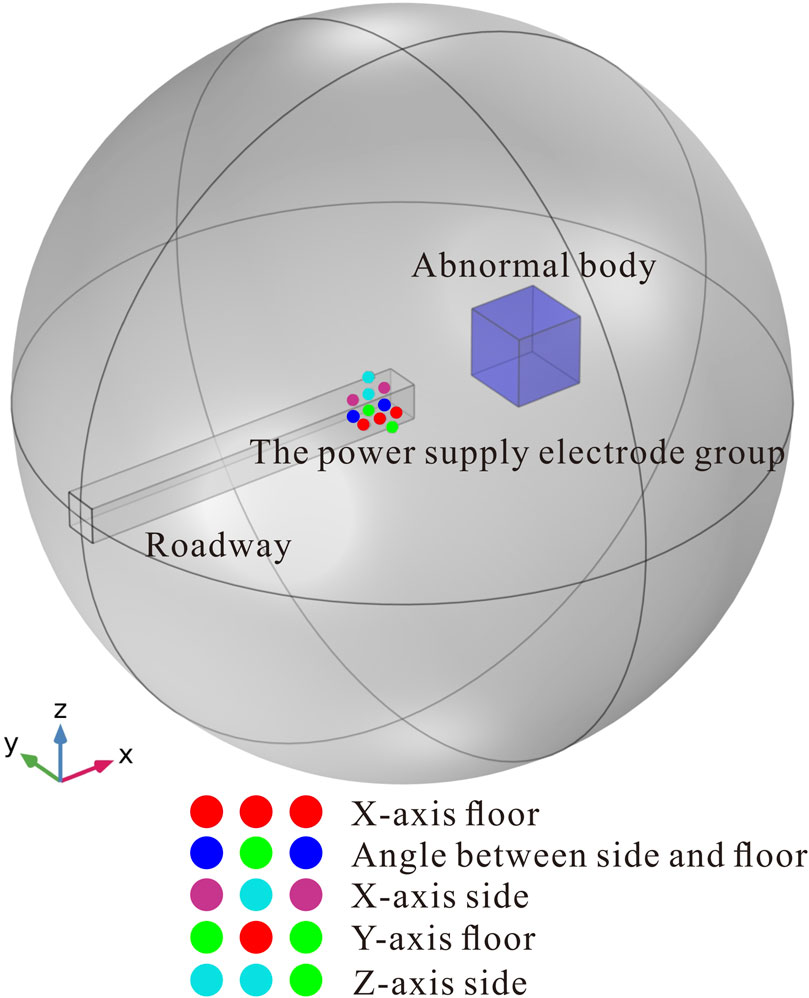
FIGURE 2. Schematic diagram of the full-space roadway model.
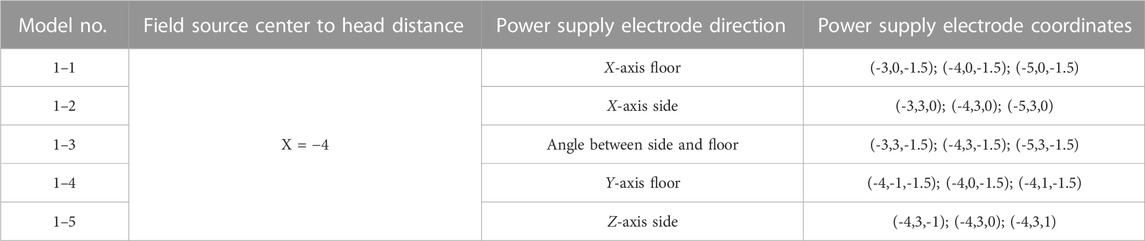
TABLE 1. Placement of power supply electrode in Model 1.
Figure 3 presents the apparent resistivity curves generated based on the forward modeling results. When the power supply electrode group is placed on the side of the roadway, the amplitude of the apparent resistivity curve near the low-resistance anomaly is relatively large, and the position of the apparent resistivity extremum matches with the position of the low-resistance anomaly. However, when the power supply electrode group is at the angle between the roadway side and floor, the amplitude of the apparent resistivity is weakened. The lowest amplitude of the apparent resistivity line graph is observed near the low-resistance anomaly when the power supply electrode group is located on the roadway floor. This investigation reveals that the power supply electrode group on the shorter side of the roadway can better identify and discriminate low-resistance anomaly compared to that on the longer side of the roadway cross-section.
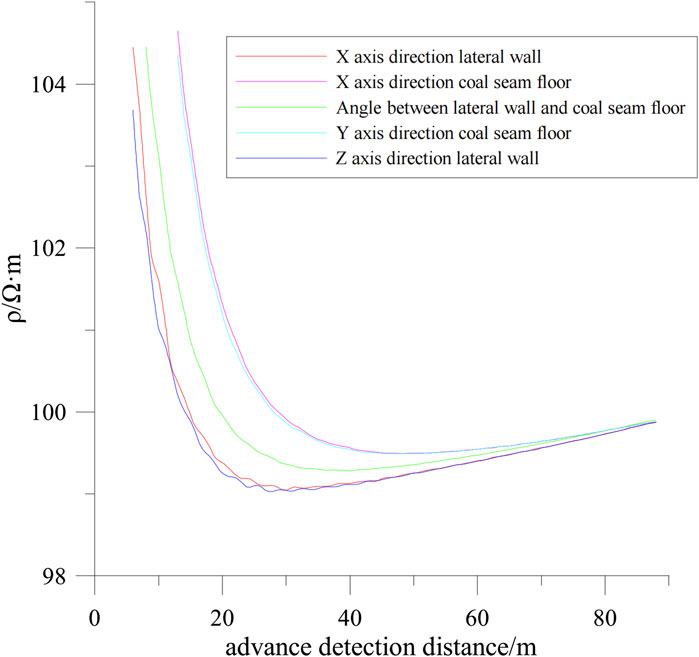
FIGURE 3. Comparison of the response characteristics of three-point sources in advanced detection.
Model 2 is established based on the different response laws of the field source position to the anomaly shown in Figure 3, in which the power supply electrode group is positioned along the Z-axis direction of the roadway side and along the Y-axis direction of the floor, with an altered number and distance of the electrodes. The Table 2 depicts the placements of the power supply electrodes.

TABLE 2. Placement of power supply electrode in Model 2.
Figure 4 illustrates the apparent resistivity curves plotted using the forward modeling results of Model 2. The dashed lines indicate the field source along the Z-axis side, whereas the solid lines indicate the field source along the Y-axis floor. Different colors indicate a difference in the number of point sources and the pole distance of the power supply electrodes. Notably, the power supply electrode group along the Z direction of the roadway side performs better at identifying anomalies compared to the group along the Y direction of the roadway floor. This feature is evidenced by the apparent resistivity minimum value closely matching the position of the anomaly, and the amplitude of the curve near the low-resistance anomaly is consistent with the resistivity value of the model. Presumably, the difference in response to the low-resistance anomaly is attributed to the variable length and width of the roadway cross-section. When the power supply electrode group is on the shorter side of the roadway, the electric field distribution is less impacted by the roadway. We developed Model 3 to investigate the response characteristics of the mine DC method in the advanced detection of geological anomalies at various points in front of the roadway, as shown in Figure 5.
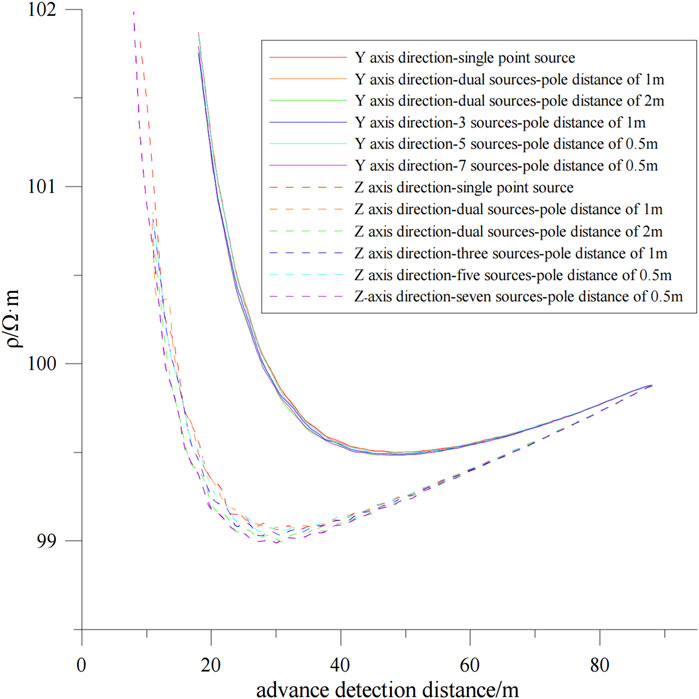
FIGURE 4. Comparison of the response characteristics of multi-point source advanced detection in Y- and Z-directions.
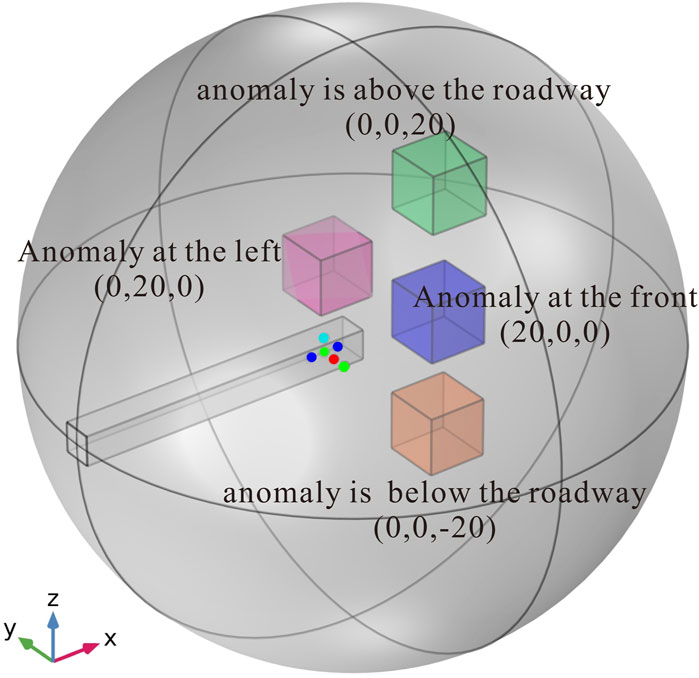
FIGURE 5. Schematic diagram of the anomaly locations in Model 3.
The roadway cavity (
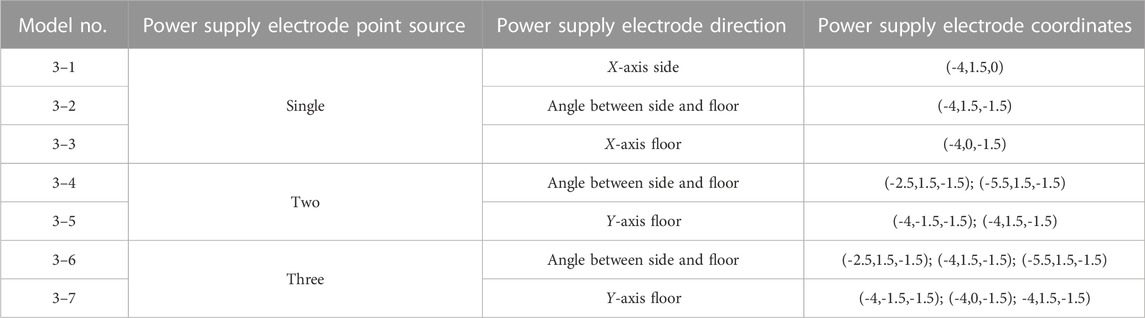
TABLE 3. Placement of power supply electrode in Model 3.
Figure 6 depicts the apparent resistivity curve plotted based on the forward modeling results of Model 3, with the abscissa representing the advanced detection distance and the ordinate representing the apparent resistivity. Figures 6A–C depict the apparent resistivity curves of the single-point current source located in the center of the roadway floor, the angle between the floor and the side, and the center of the roadway side, respectively. When the point source is at the center of the roadway floor, the response to the bottom anomaly is the strongest, followed by the response to the left anomaly, with the responses to the upper and front anomalies being the weakest. Moreover, when the point source is located at the angle between the roadway floor and side, the responses to the left and bottom anomalies are the strongest, followed by the top and the front anomalies. The left anomaly responds most strongly when the point source is at the center of the roadway side, followed by the bottom and top anomalies, with the front one eliciting the weakest response.
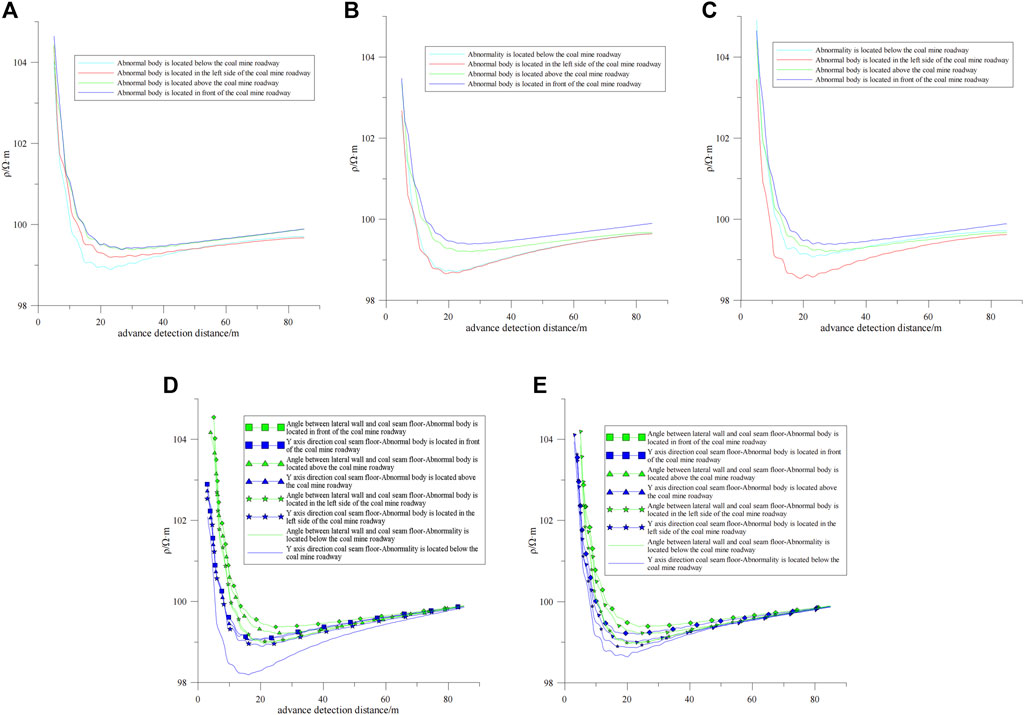
FIGURE 6. (A–E) Apparent resistivity of Model 3.
Figures 6D, E exhibit the apparent resistivity curves of the two-point and three-point current sources, respectively. The response amplitude to the anomaly is greater when the power supply electrode group is along the Y-axis of the floor (perpendicular to the roadway side roadway) than when it is along the angle between the roadway side and floor. Furthermore, when the power supply electrode group is positioned along the roadway angle, the response amplitude to the bottom and left anomaly is stronger, whereas the front anomaly generates a weaker response. Similarly, when the power supply electrode group is positioned along the Y-axis of the roadway floor, the bottom anomaly elicits the strongest response amplitude, with the left and the front responses being the weakest. This is similar to the response under the single-point current source.
The discrepancy in response to anomalies, generated by the varied placements of the field source, is speculated to be caused by the high-resistance shielding of the tunnel cavity. When the field source on the floor is influenced by the high-resistance shielding of the roadway, the current density along the bottom and both sides of the roadway is greater than that in other directions, leading to a stronger response to the bottom and left anomalies. Similarly, when the field source is at the angle between the roadway side and floor, the responses to the left and bottom anomalies are the strongest. Ultimately, the field source at the roadway side exhibits the strongest response to the left anomaly.
Through the above research, it can be found that the closer the field source is to the anomalous body, the more drastic the field intensity change and the better the detection effect. The response of the power supply electrode to the abnormal body is more obvious when the electrode is arranged in the vertical position of the side than in the horizontal position of the floor. If the distance between the power supply electrodes is fixed, the number of field sources determines the detection frequency of the target position. The more times of detection, the more obvious the physical properties of the target abnormal body are in the field intensity distribution, and the higher the accuracy of the delineated abnormal position. When the number of field sources is constant, the larger the electrode distance is within a reasonable range, the better the detection effect. When the mode of field source is fixed, the response of geological anomaly body under the floor of tunnel head is the most obvious.
In this study, we employed the finite element method to perform three-dimensional forward modeling of the multi-point source mine DC method, investigating the influences of different geoelectric models and roadways on the response characteristics of the DC method in advanced detection. The key findings of our research are as follows:
(1) The geometry of the roadway cross-section significantly influences the electric field distribution when using the mine DC method for advanced detection. The power supply electrodes located on the shorter side of the roadway cross-section can better distinguish the front anomalies.
(2) In the presence of the roadway, increasing the number and distance of power supply electrodes enhances the amplitude of the apparent resistivity near the low-resistance anomalies. This observation indicates a positive correlation between the low-resistance amplitude and the product of the number and the pole distance of power supply electrodes. Moreover, enhancing both the number and pole distance of power supply electrodes improves the positioning accuracy of anomalies.
(3) Optimization of field source parameters, including the number, position, and pole distance of the power supply electrodes, facilitates enhanced identification of low-resistance anomalies in front. However, the presence of low-resistance anomalies on the side will interfere with this identification process.
The insights obtained from this study hold potential practical implications for the field of geophysical exploration in mines. Researchers and practitioners can leverage this knowledge to develop more effective and efficient advanced detection techniques, leading to safer and more reliable mining operations. As the field of geophysics continues to evolve, further investigations could be undertaken to explore additional aspects and refine the application of the multi-point source DC method in real-world scenarios.
The raw data supporting the conclusion of this article will be made available by the authors, without undue reservation.
HX: Writing–original draft, Conceptualization, Data curation, Funding acquisition, Project administration, Resources, Supervision. WL: Writing–original draft, Formal Analysis, Writing–review and editing. JL: Project administration, Software, Supervision, Visualization, Writing–review and editing. YG: Formal Analysis, Writing–review and editing. YY: Writing–review and editing. RL: Investigation, Writing–review and editing. JC: Methodology, Project administration, Writing–review and editing.
The authors declare financial support was received for the research, authorship, and/or publication of this article. Foundation item: Natural Science Basic Research Plan in Shaanxi Province of China (2021JLM-11) (Shaanxi Province of China).
Author JL was employed by Xi’an Research Institute China Coal Technology and Engineering Group Corp.
The remaining authors declare that the research was conducted in the absence of any commercial or financial relationships that could be construed as a potential conflict of interest.
All claims expressed in this article are solely those of the authors and do not necessarily represent those of their affiliated organizations, or those of the publisher, the editors and the reviewers. Any product that may be evaluated in this article, or claim that may be made by its manufacturer, is not guaranteed or endorsed by the publisher.
Barker, R. D. (1989). Depth of investigation of collinear symmetrical four-electrode arrays. J. Geophys. 54 (8), 1031–1037. doi:10.1190/1.1442728
Biswas, A., and Sharma, S. (2020). Advances in modeling and interpretation in near surface geohysics. M. Springer International Publishing.
Cao, Q., Yan, S., Xue, G., and Zhu, N. (2017). High resolution resistivity detecting and remote internet monitoring of coalfield fire. J. Chin. J. Geophys. 60 (1), 424–429. doi:10.ssss/j.issn.0001-5733.2017.1.034
Chang, J., Xue, G., and Malekian, R. (2019). A comparison of surface-to-coal mine roadway TEM and surface TEM responses to water-enriched bodies. R. IEEE Access. 7, 167320–167328. doi:10.1109/ACCESS.2019.2953844
Chen, W., Han, S., Muhammad, Y. K., Chen, W., He, Y., Zhang, L., et al. (2020). A surface-to-borehole TEM system based on grounded-wire sources: synthetic modeling and data inversion. J. Pure Appl. Geophys. 177, 4207–4216. doi:10.1007/s00024-020-02477-1
Cheng, J., Wang, Y., Yu, S., and Li, D. (2000). The principle and application of advance surveying in roadway excavation by resistivity method. J. Coal Geol. Explor. 28 (04), 60–62. doi:10.3969/j.issn.1001-1986.2000.04.019
Dai, Q., Chai, X., and Chen, D. (2012). 3D DC resistivity inversion based on damped gauss-Newton method. J. Chin. J. Eng. Geophys. 9 (04), 375–379. doi:10.3969/j.issn.1672-7940.2012.04.001
Deng, X. (2013). Research of DC focusing resistivity advanced detection in tunnel. D. Central South University.
Epov, M. I., Molodin, V. I., Manshtein, A. K., Balkov, E. V., Dyad’Kov, P. G., Matasova, G. G., et al. (2016). Integrated archeological and geophysical studies in West Siberia. J. Russ. Geol. Geophys. 57 (03), 473–482. doi:10.1016/j.rgg.2016.03.009
Gao, S. (2021). Three-dimensional forward and inversion of direct current resistivity method for finite volume target. D. China University of Geosciences. doi:10.27493/d.cnki.gzdzy.2021.000973
Grigorev, G. S., Salishchev, M. V., and Senchina, N. P. (2021). On the applicability of electromagnetic monitoring of hydraulic fracturing. J. Min. Inst. 250, 492–500. doi:10.31897/PMI.2021.4.2
Han, D., Li, D., Cheng, J., and Wang, P. (2010). DC method of advanced detecting disastrous water-conductingor water-bearing geological structures along same layer. J. J. China Coal Soc. 35 (04), 635–639. doi:10.13225/j.cnki.Jccs
Huang, C. (2021). Application of resistivity CPTU technology in soil and water pollution investigation in soft soil area. J. Chin. J. Eng. Geophys. 18 (3), 330–335. doi:10.3969/j.issn.1672-7940
Jerbeson, M., and Walter, E. (2016). Automatic approximate mapping of the subsurface resistivity from apparent resistivity data using geostatistics. J. Geophys. 81 (02), 177–186. doi:10.1190/GEO2015-0189.1
Li, F., Zhang, Y., Lian, H., Wang, S., Qi, L., and Zheng, G. (2020). Discussion on problems of direct current advance detection method in roadway driving face. J. Coal Sci. Technol. 48 (12), 250–256. doi:10.13199/j.cnki.cst.2020.12.032
Li, J. (2021). Numerical simulation of finite element forward madeling of multi-point current source mine with direct current method for advanced detection. D. Xi’an university of science technology. doi:10.27397/d.cnki.gxaku.2021.000518
Li, S., Nie, L., Liu, B., Tian, M., Wang, C., Song, J., et al. (2015). Advanced detection and physical model test based on multi−electrode sources array resistivity method in tunnel. J. Chin. J. Geophys. 58 (4), 1434–1446. doi:10.6038/cjg20150429
Li, X., Bi, Z. Q., and Huang, Q. Y. (1986). Discussion on verticat linear sonrce resistivity method. J. Oil Geophys. Prospect. 21 (02), 197–199, 252. doi:10.13810/j.cnki.issn.1000-7210.1986.02.011
Li, X., Yang, Z., Yun, M., and Liu, Y. (2019). FEM numerical simulation of long electrode DC geophysical method for landslide monitoring. J. J. Henan Polytech. Univ. Nat. Sci. 38 (1), 61–67. doi:10.16186/j.cnki.1673-9787.2019.1.9
Liu, Y. (2014). Study on the application effect of mine transient electromagnetic technology under the metal interference. D. Xuzhou: China University of Mining and Technology.
Liu, Y., and Wu, X. (2016). Parallel Monte Carlo method for advanced detection in tunnel incorporating anisotropic resistivity effect. J. Chin. J. Geophys. Chin. 59 (11), 4297–4309. doi:10.6038/cjg20161130
Liu, Z., Xue, G., and Zhang, X. (2022). The feasibility of monitoring lagging water inrush by using parameter of polarizability. J. Chin. J. Geophys. 65 (08), 3186–3197. doi:10.6038/cjg2022P0280
Lu, J., and Lv, Y. (2014). The 3D FEM of vertical line source borehole-ground resistivity method. J. Chin. J. Eng. Geophys. 11 (03), 406–411. doi:10.3969/j.issn.1672-7940.2014.03.024
Luo, G. (2017). Effectiveness of DC resistivity trielectrode advanced prospecting. J. Coal Geol. China 29 (03), 72–75. doi:10.3969/j.issn.1674-1803.2017.03.15
Mohamed, A., Othman, A., Galal, W. F., and Abdelrady, A. (2023). Integrated geophysical approach of groundwater potential in wadi ranyah, Saudi arabia, using gravity, electrical resistivity, and remote-sensing techniques. J. Remote Sens. 15, 1808. doi:10.3390/rs15071808
Mohamed, Z. A., Abdellatif, Y., Hany, S., and Mahmoud, I.I.M (2021). Integration of geophysical methods for groundwater exploration: A case study of el sheikh marzouq area. Farafra Oasis, Egypt. J. Egypt. J. Aquatic Res. doi:10.1016/j.ejar.2021.03.001
Naziya, J., and Nagendra, P. S. (2020). Electrical resistivity in the delineation of groundwater potential zones: A case study from kota, Rajasthan, India. J. Arabian J. Geosciences 13 (15), 697–698. doi:10.1007/s12517-020-05464-x
Qiang, J., Ruan, B., Xiong, B., and Mao, Y. D. (2004). The influence of shallow inhomogeneous body on object resistivity anomoly. J. Chin. J. Geophys. 47 (03), 619–626. doi:10.1002/cjg2.528
Qiu, S. (2022). Research on joint processing technology of mine seismic and transient electromagnetic advanced detection data. D. Huainan: Anhui University of Science and Technology. doi:10.26918/d.cnki.ghngc.2022.000191
Rasskazova, Yu. I., Shkabarnyab, N. G., and Shkabarnya, G. N. (2013). Electrical tomography exploration of sliding-hazardous pitwall rock masses. J. J. Min. Sci. 49 (05), 772–778. doi:10.1134/S1062739149050110
Ruan, B., Deng, X., Liu, H., Zhou, L., and Zhang, L. (2010). Influential factors and optimum survey method of advanced focus detection with DC resistivity in tunnels. J. Prog. Geophys. 25 (04), 1380–1386. doi:10.3969/j.issn.1004-2903.2010.04.029
Taha, A. I., Al Deep, M., and Mohamed, A. (2021). Investigation of groundwater occurrence using gravity and electrical resistivity methods: A case study from wadi sar, hijaz mountains, Saudi arabia. J. Arabian J. Geosciences 14, 334. doi:10.1007/S12517-021-06628-Z
Wang, Z., Fang, S., Jiang, K., Ma, W., and Lu, X. (2022). Research on 3D hole-to-surface resistivity forward modeling and anomaly based on unstructured meshes. J. Prog. Geophys. (Chin.) 37 (4), 1620–1630. doi:10.6038/pg2022FF0237
Xie, H., Li, J., Dong, Y., Li, G., and Han, Z. (2021). Fast Fisher discrimination of water-rich burnt rock based on DC electrical sounding data. J. Mine Water Environ. 40 (02), 539–546. doi:10.1007/s10230-020-00747-x
Xie, H., Li, L., Li, Z., Li, J., Li, G., and Li, W. (2022). Comparison of terrain corrections based on the point source and line source DC methods. J. Front. Earth Sci. 10. doi:10.3389/feart.2022.1004442
Xue, G., Chen, K., Chen, W., and Tian, Z. (2018). The determination of the burial depth of coal measure strata using electromagnetic data. J. J. Environ. Eng. Geophys. 23 (1), 125–134. doi:10.2113/JEEG23.1.125
Xue, G., Chen, W., Cheng, J., Liu, S., Yu, J., Lei, K., et al. (2019). A review of electrical and electromagnetic methods for coal mine exploration in China. R. IEEE Access. 7, 177332–177341. doi:10.1109/ACCESS.2019.2951774
Yang, H., Hu, X., and Zhang, P. (2013). Numerical simulation of advanced detection by direct current electrical method in tunnel. J. Chin. J. Eng. Geophys. 10 (02), 200–204. doi:10.3969/i.issn.1672-7940.2013.02.015
Keywords: mine direct current method, multi-point current source, advanced detection, finite element method, forward modeling
Citation: Xie H, Li W, Li J, Guo Y, Yan Y, Liu R and Cheng J (2023) A finite element numerical simulation analysis of mine direct current method’s advanced detection under varied field sources. Front. Earth Sci. 11:1273698. doi: 10.3389/feart.2023.1273698
Received: 07 August 2023; Accepted: 04 September 2023;
Published: 14 September 2023.
Edited by:
Ahmed M. Eldosouky, Suez University, EgyptReviewed by:
Ahmed Mohamed, Assiut University, EgyptCopyright © 2023 Xie, Li, Li, Guo, Yan, Liu and Cheng. This is an open-access article distributed under the terms of the Creative Commons Attribution License (CC BY). The use, distribution or reproduction in other forums is permitted, provided the original author(s) and the copyright owner(s) are credited and that the original publication in this journal is cited, in accordance with accepted academic practice. No use, distribution or reproduction is permitted which does not comply with these terms.
*Correspondence: Wanlu Li, MTUzNTM1OTA4NzJAMTYzLmNvbQ==
Disclaimer: All claims expressed in this article are solely those of the authors and do not necessarily represent those of their affiliated organizations, or those of the publisher, the editors and the reviewers. Any product that may be evaluated in this article or claim that may be made by its manufacturer is not guaranteed or endorsed by the publisher.
Research integrity at Frontiers
Learn more about the work of our research integrity team to safeguard the quality of each article we publish.