
95% of researchers rate our articles as excellent or good
Learn more about the work of our research integrity team to safeguard the quality of each article we publish.
Find out more
ORIGINAL RESEARCH article
Front. Earth Sci. , 11 October 2023
Sec. Geohazards and Georisks
Volume 11 - 2023 | https://doi.org/10.3389/feart.2023.1273352
This article is part of the Research Topic Prevention, Mitigation, and Relief of Compound and Chained Natural Hazards View all 10 articles
 Xueliang Wang1,2,3*
 Juanjuan Sun1,2,3
 Yong Zhang4Qisong Jiao5
 Shengwen Qi1,2,3Ran Wang6Haiyang Liu7Mengjie Zhang1,2,3
A rare study on the quantitative relationship between the energetic impact of debris flows on the intensity and duration of growth disturbances of tree rings was carried out, partly due to a lack of feasible approaches and detailed field evidence. In this study, we first used a dendrogeomorphic technique to determine the age of a recent debris flow derived from historic landslide deposits at Qingyang Mountain (QYM) on the northeastern Tibet plateau. We acquired the quantitative data on the annual widths of tree rings in history and confirmed the influence of the debris flow rather than other factors (e.g., climatic events and inset outbreaking) in disturbing the growth of tree rings in a specific year. Using this approach, we determined that the age of the debris flow at QYM occurred in 1982, which was speculated to be triggered by the high monthly precipitation registered during July 1982. Subsequently, based on the boundaries of historic debris flow identified on remote sensing images before and after 1982 and the depth-integrated continuum model, we reconstructed the process of the 1982 debris flow and obtained the kinematic energy of the debris flow impacting the sampled trees. Based on the study, we observed that two growth disturbance patterns of tree rings influenced by the reconstructed 1982 debris flow were revealed, including growth suppression and asymmetric growth. We obtained a raw logarithm relationship between duration (i.e., lasting time for the disturbed tree rings to recover the initial width) and intensity of growth disturbances (i.e., growth suppression ratio of disturbed tree rings). We concluded that there is a negative exponential relationship between the simulated kinematic energy of debris flow impacting the disturbed trees and the time to recover the initial width of corresponding tree rings.
Different kinematic energy of debris flow impacting trees can lead to different failure characteristics and growth disturbances (Wistuba et al., 2013). Previous studies mostly focused on the relationships of kinematic energy of rockfall with morphological characteristics of trees (e.g., diameter at breast height and stand density) (Perret et al., 2004; Dorren and Berger, 2006; Woltjer et al., 2008). A rare study on the quantitative relationship between the impact of debris flows and the intensity and duration of growth disturbances in tree rings was carried out. For such a study, first, large amounts of tree ring samples disturbed by the same debris flow event are needed, but it is difficult for many trees to remain well preserved on-site for a long period. Second, the criterion to quantify the growth suppression or other disturbed characteristics in tree rings of different tree species influenced by debris flow is still limited for clarifying such a relationship. The last and most difficult factor is how to monitor or acquire the kinematic energy of debris flow impacting different disturbed trees. Recent studies that focus on dynamic process and kinematic energy of landslides and debris flow have been carried out with the help of the development of simulation approaches (Ouyang et al., 2019a; Ouyang et al., 2019b; Wu and ping-Hsuan Hsieh, 2021; Bao et al., 2023a; Bao et al., 2023b). For example, Ouyang et al. (2019a) adopted a depth-integrated continuum method to analyze the dynamic process of two large sequential landslides that occurred in Baige village along the Jinsha River. The authors concluded that the evaluation of potentially landslide-prone areas simulated by the method is feasible. Wu and Ping-Hsuan Hsieh (2021) applied three-dimensional (3D) numerical modeling code 3DEC to numerically model the debris movement and deposition of the Chiu-fen-erh-shan landslide under the impact of the Chi-Chi earthquake, showing that post-failure configuration generated by the 3DEC simulations is similar to that observed in the field. Focusing on the same Baige village landslide, Bao et al., 2023a; Bao et al., 2023b) used a three-dimensional model based on the finite-discrete element method-smoothed particle hydrodynamics (FDEM-SPH) coupling approach to reconstruct the dynamic process of the landslide. The results of the landslide deposit area and the impulse wave-affected area were consistent with the results of field investigations. In this study, considering the characteristics of debris observed in the field and others simulated by previous studies (Ouyang et al., 2019a; Sun et al., 2021; Bao et al., 2023a), kinematic energy of debris flow was simulated through the numerical approach of mass flow that was used for debris flow dynamic propagation process modeling (Ouyang et al., 2013).
Although new geochronological methods increase the number of dated geohazards (e.g., landslides and debris flows), absolute dating methods (e.g., cosmic ray exposure, optically stimulated luminescence, thermoluminescence, and uranium-series (234U/230Th) dating) are still less developed for geohazards occurred on the centennial or millennial timescales (Crosta and Clague, 2009; Pánek, 2015). The dendrogeomorphic technique (tree ring-based) has been developed to constrain the ages of geohazards that were recorded as growth disturbances in tree rings on a centennial or millennial scale (Butler et al., 1986; Stoffel et al., 2005; Stoffel, 2006; Šilhán et al., 2016; Noguchi et al., 2021). Frequent geohazards impact local trees, leading to growth disturbances in tree rings (e.g., wider or narrower rings, and missing rings), which are used to determine the time and frequency of geohazards (Stoffel et al., 2005; Schneuwly and Stoffel, 2008; Lopez Saez et al., 2012; Šilhán, 2017; Zhang et al., 2019; Šilhán, 2021). However, there are also some other factors, such as earthquakes, temperature, precipitation, and inset outbreaking, that lead to growth disturbances in tree rings, which hinder the identification of landslide events (Carrara and O’Neill, 2003; Ciervo et al., 2017; Zhang et al., 2019). Meanwhile, random events around a tree, such as single block hitting and water flowing around tree roots, could also disturb the growth of a tree. Until now, studies of specific characteristics and index values of growth disturbances in tree rings of different tree species influenced by geohazards, especially debris flows, are still limited, impeding the timing of debris flows by dendrogeomorphic techniques.
With the development of remote sensing, images and the Digital Elevation Model (DEM) obtained by satellite methods, unmanned aerial vehicles (UAV), and terrestrial lidar systems were used to identify debris flows and to analyze the geometric characteristics of debris flows (Loye et al., 2009; Ma et al., 2019; Wang et al., 2021). Regional spatial distribution of geohazards has been widely mapped using the images obtained by satellite methods (Qi et al., 2010; Wang et al., 2021). One of the obvious merits of satellite methods is that satellite images provide clear visible evidence of debris flows that occurred in a location during a period. However, because of their strict application conditions for acquiring images (e.g., available satellite, suitable weather conditions, and acritical data acquiring setting), time series of past global satellite images rarely continue yearly or monthly focusing on an area, limiting the application of satellite images for reconstructing the evolution process of geohazards.
In a previous study, Zhang et al. (2019) reconstructed the centennial-scale process activity of landslides at QYM using dendrogeomorphic techniques. They mainly focused on an approach to determine the time series of landslides. Here, we further explore an approach to determine the age of a landslide by combining the dendrogeomorphic technique with remote sensing because the evidence to define the occurrence of a landslide or debris flows solely by dendrogeomorphic technique is not sufficient due to uncertain complex factors. More importantly, after determining the age, we studied the specific characteristics and index values of growth disturbance in tree rings (e.g., growth suppression ratio and lasting time for tree rings to recover their normal width) in the year of the debris flow. Furthermore, to reveal the kinematic energy of debris flows impacting the disturbed trees at QYM and their rarely studied relationship, we attempted to use numerical simulation of a depth-integrated continuum model and remote sensing images to reconstruct the evolution process, including spatial distribution of kinematic energy of the dated debris flow.
Qingyang Mountain (QYM) is located in the northeastern Qilian Shan range. Because of tectonic faults and long-term weathering, landslides and rockfalls occurred frequently with widely distributed landslide deposits on the mountains (Figure 1). There were small landslides that occurred in the middle section of QYM before 1970 (Zhang et al., 2019). The landslides were located at elevations ranging from 3,375 to 3,450 m a.s.l. (Figure 1B). Through fieldwork, we observed that historical landslide deposits were transformed as the initiation zone of typical debris flow, followed by the channel of propagation (with a channel depth of ∼1.9 m) and accumulation zone (Figure 1). After the debris flow, recent smaller debris flows have been occurring on-site since 2012 (Figure 1A), which partly verifies the dynamic evolution of historic debris flows in the study area. The grain size of the deposits mostly ranges from 0.001 to 0.04 m³, which falls into the small rock blocks class according to the International Society for Rock Mechanics (ISRM, 1979). Based on topographic analysis and field investigation, it was estimated that the total volume of the deposits of the accumulation zone is 4.9×10⁴ m3, with an average depth of 5.5 m.
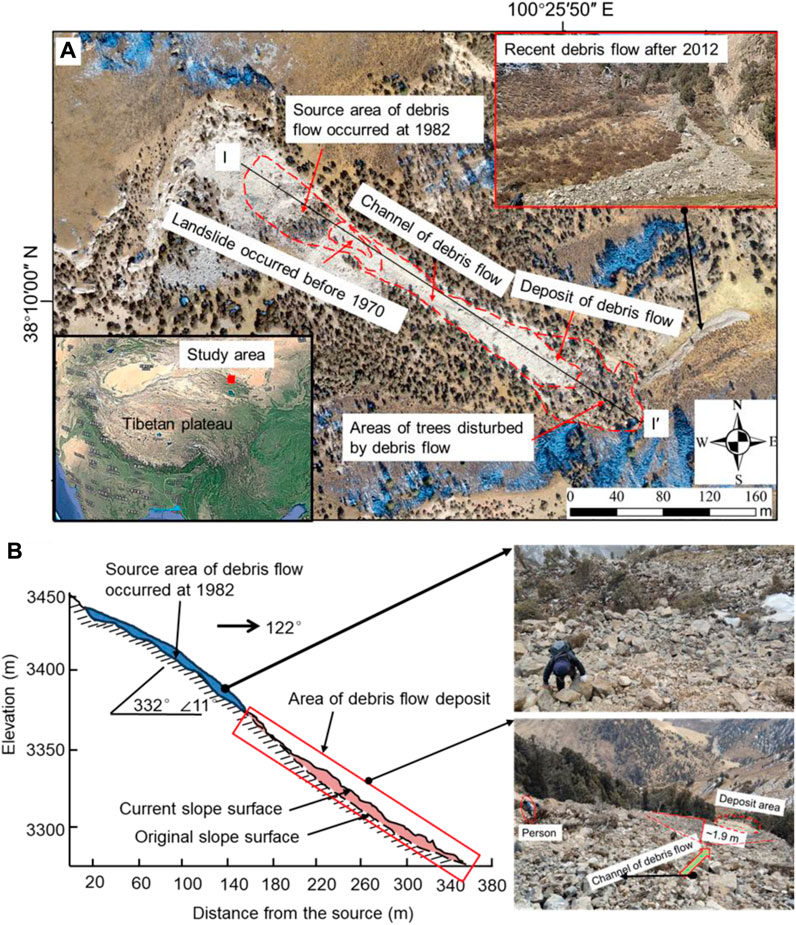
FIGURE 1. (A) Location of the landslide and debris flow in Qingyang Mountain and (B) topographic profile of I-I′ in Figure 1A.
The trees of Qilian junipers mostly grow on sunny slopes at elevations from 3,000 to 3,600 m a.s.l. at QYM (Zhang et al., 2019). The debris flow destroyed some trees that grew on the slope. Based on the site work, we noticed that more than 20 trees were hit (i.e., disturbed) by the debris on the accumulation zone, which was demonstrated by tree scars, injuries on the stem, and inclined trees on the deposit (Figure 2).
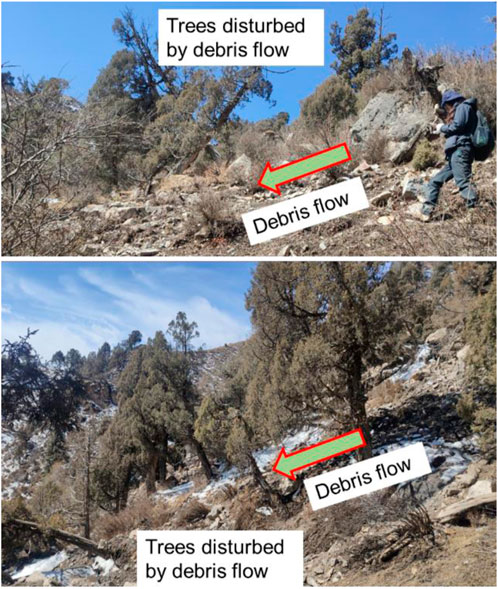
FIGURE 2. Trees disturbed by debris flow on the accumulation zone in QYM.
We collected 1970 satellite images from the KH4B satellite (number DS1108-2184DA088) with a resolution of 1.83 m (Figure 3A), which was the oldest source of imagery with high resolution in the study area. With the most advanced cameras on board, the KH4A and KH4B satellites (imagery resolution of 2.74 and 1.83 m) collected global-scale, high-resolution imagery as one important part of the CORNOA program from 1960 to 1972 (Casana, 2020). The images in 2012 (Figure 3B) and 2019 (Figure 1A) were obtained from Google Earth and UAV. We obtained 476 photographs taken over an area of approximately 10 km2 by UAV in 2019, which was used to create a 0.3-m-resolution DEM with the structure from the motion photogrammetry technique (Johnson et al., 2014). The images and DEM were used to analyze the temporal evolution of landslides in QYM and to simulate the debris flow as basic data by numerical modeling.
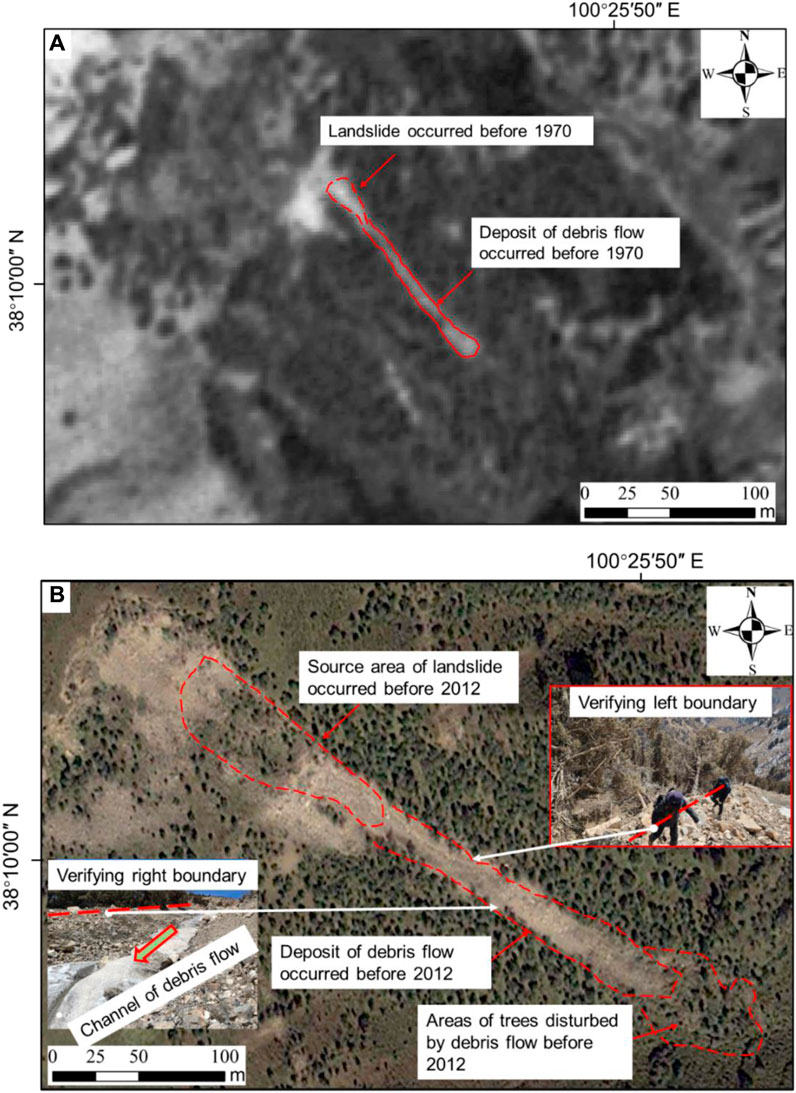
FIGURE 3. (A) Distribution of the landslide and debris flow occurred before 1970 from imagery obtained by the KH4B satellite in 1970; (B) Distribution of the landslide and debris flow that occurred before 2012 from imagery obtained by Google Earth in 2012.
Although the boundaries of landslides and former debris flows occurred before 1970 (i.e., the year of the imagery obtained) on KH4B satellite imagery were difficult to exactly check on-site, we could still roughly verify the identification by comparing the white color boundary on the imagery (Figure 3A) and the exposure of rock mass on-site. In contrast, the clear image from 2012 and the currently well-preserved boundary and characteristics of deposits on-site helped us to easily verify the boundary of recent debris flow (Figure 3B).
To collect the core samples of tree rings, we chose the trees with obvious injuries or trees that were inclined on or near the debris flow deposit. A total of two or three increment cores were extracted per tree using increment borers from two directions including the scar direction (i.e., the direction of debris flowing) and the opposite one (Stoffel et al., 2013). If there were no obvious scars on the trees, we collected cores in the supposed direction of the debris flow movement (i.e., upslope and downslope cores) (Stoffel et al., 2005). We sampled all Qilian junipers on the deposit body with diameters at breast height exceeding 20 cm (the highest measured 110 cm) with increment borers. We marked the locations of the core samples on the topographic map created from our 0.3-m-resolution DEM. Ultimately, a total of 52 increment cores were extracted from 23 Qilian juniper trees.
In reference to previous studies (Stokes and Smiley, 1968; Stoffel et al., 2013), we dealt with the collected samples in a lab based on standard dendrogeomorphical techniques. First, the samples were left to air dry, and then we used glue to attach the dried samples to wood grooves. The firmed samples were polished using fine sandpaper to make the cells of increment cores clear to be observed by microscope. Finally, we measured the annual widths of tree rings using a LINTAB™ instrument (Figure 4) whose maximum resolution was 1/1,000 mm (http://www.rinntech.de/content/view/16/47/lang,english/index.html). The measured data were automatically recorded by the TSAP-Win™ software platform for tree ring analyses (http://www.rinntech.de/content/view/17/48/lang,english/index.htm).
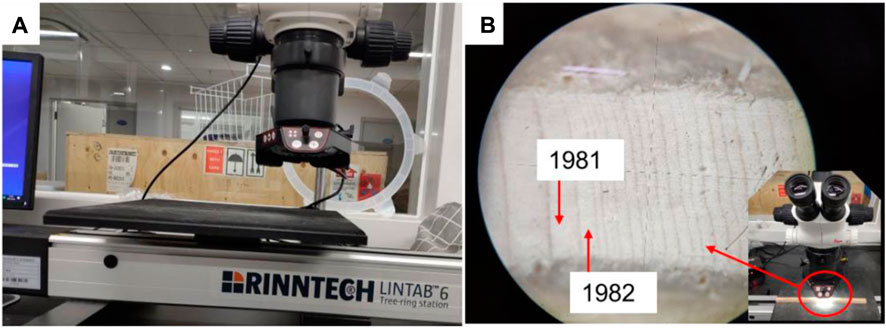
FIGURE 4. (A) The LINTAB™-6 instrument used for measuring the annual width of the tree rings; (B) The image of increment core observed with LINTAB™-6.
After measuring the annual widths of tree rings, we used a previously built reference chronology in the same area for precise cross-dating and age corrections of the core samples disturbed by the debris flow using COFECHA (Cook and Kairiukstis, 1990; Zhang et al., 2019). The verification of cross-dating accuracy was based on the value of the correlation coefficient between the measured annual width of tree rings and reference chronology larger than 0.4 (Grissino-Mayer, 2001).
The mass flow was based on the depth-integrated continuum model, transforming the 3D description of the dynamic process of debris flow into a simple 2D problem by integrating the Navier–Stokes equations in the depth direction (Iverson and Ouyang, 2015). Under the depth integral condition, Leibniz’s law and dynamic boundary conditions were used to simplify the mass and momentum conservation equations as follows (Ouyang et al., 2019a; Sun et al., 2021):
where
where φ and δ represent the internal friction angle and basal friction angle of the moving material, respectively.
The basal friction stress of debris flow was assumed to obey the Coulomb failure criterion (Eq. 5). For the Coulomb friction model available in mass flow, three dominant parameters were needed for simulation, namely, cohesion, friction angle, and pore water pressure parameters. Usually, it is difficult or even impossible in some cases to carry out field tests to obtain the values of parameters used for debris flow simulation. Hence, the parameters used in mass flow simulation are commonly obtained from back analysis of historic events (Ouyang et al., 2013; Sun et al., 2021). Luckily, the historic debris flow event in QYM provided us with a good chance to back analyze the parameters by optimizing the simulated debris flow characteristics to fit the occurred ones (e.g., the farthest range and depth of the debris flow deposit).
where c and ψ are the cohesion and friction angle of the mass, respectively.
Based on the 1970 satellite image, we plotted the boundary of the debris flow that occurred once or more times before 1970 (Figure 3A), which was used as the comparable characteristics with the simulated ones for back analysis. To simulate the dynamic propagation process of debris flow by mass flow, the source area and its thickness should be calculated first, including three dominant steps as follows:
(1) Build the current DEM of the calculation area. We clipped the specific area of DEM for calculation from the whole DEM of QYM, which was obtained before.
(2) Reconstruct the pre-slide topographic lines of the calculation area. Based on the field investigation and the 1970 satellite image, we adjusted the current topographic lines according to the contour lines of the surrounding terrain to build the approximately original topographic lines before the debris flow in ArcMAP.
(3) Create the area and thickness files of the debris flow source area. Using the two DEMs of the original and current ones, we created the source area using the tool of grid subtraction in ArcMAP. Hence the area and thickness of the source area could be extracted directly.
Using the source area data and given parameters, we simulated debris flow in the mass flow platform.
Using the satellite images from 1970 to 2012, we obtained in ArcGIS the different boundaries of the debris flows at different stages. The boundary in 1970 was small, indicating that a small debris flow of approximately 6.1×10³ m3 occurred at that time or before (Figure 3A). The length and width of the debris flow presented in the image from 2012 were approximately 288 and 31 m (Figure 3B), both of which were about twice the measurement of the 1970 debris flow. Hence, a large debris flow occurred during the period from 1970 to 2012. The geometric features of the debris flow after 2012 do not have significant differences (e.g., from the debris flow image from 2019 in Figure 1A), indicating a relatively stable state of the debris flow body on the whole in the last 10 years (i.e., from 2013 to 2022).
Considering the possibility that the debris flow occurred between 1970 and 2012 and disturbed the annual width of tree rings, we analyzed the variation of annual widths of sampled tree rings (Figure 5). From the trees collected on the debris flow deposit, we observed 19 trees with synchronous growth disturbance in tree rings occurring in 1982. The growth disturbance included two patterns. One pattern was the growth suppression of width in tree rings in 1982, which was demonstrated by 13 trees (Figure 5A). Another pattern was the asymmetric growth of rings in 1982, as demonstrated by 6 trees (Figure 5B). For the second pattern, two core samples collected on opposite sides grew almost equally before a sudden disturbance. After the disturbance, one side grew faster or slower, while the other side did not grow synchronously. Hence, the difference in widths on the two opposite sides became larger and was influenced by the disturbance in the second pattern.
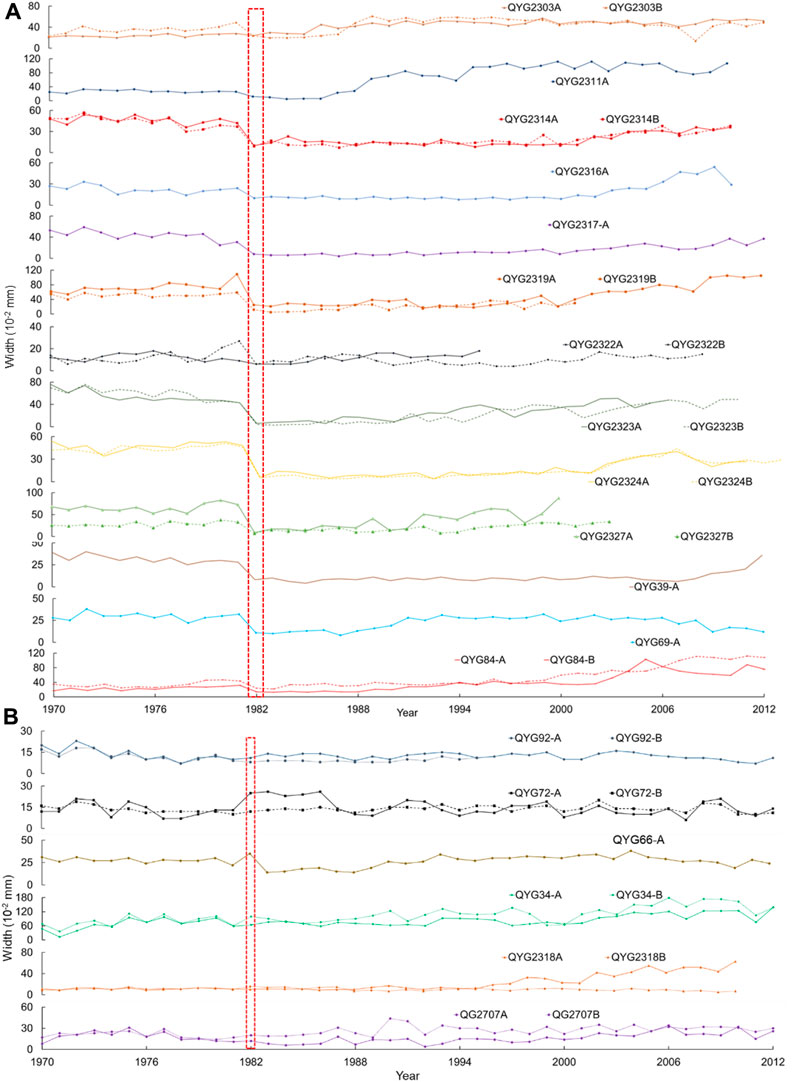
FIGURE 5. Tree-ring annual widths of sampled Qilian junipers demonstrating growth suppression (A) and asymmetric growth (B) in 1982 as a result of debris flow (red dotted box).
Two patterns of growth disturbance in tree rings, namely, growth suppression and asymmetric growth, could be observed not only from 19 trees, as occurring in 1982, but also from growth disturbances in the history of a single tree. For example, the annual widths of tree rings in samples QYG2314A and QYG2314B revealed several significant growth disturbance events (e.g., rockfall or landslide) in 1710 (i.e., asymmetric growth), 1860 (i.e., growth suppression), and 1982 (i.e., growth suppression) (Figure 10A). Meanwhile, the annual widths of tree rings of samples QYG2324A and QYG2324B revealed growth disturbance events in different years: 1742 (i.e., asymmetric growth) and 1810 (i.e., growth suppression) besides the same year of the 1982landslide (i.e., growth suppression) (Figure 10B). Hence, besides the synchronous growth disturbance in tree rings by the same large debris flow event, there were also some random growth disturbances of different trees. Meanwhile, there were random growth disturbances in some specific tree rings rather than in all of them, as seen in Figure 5 (e.g., reduction in 2007 of QYG2303B and increment in 2000 of QYG2707A). The missing width data of some tree rings (e.g., QYG 2322A after the year 1996, QYG2324A after the year 2000, and QYG2324A after the year 2003) is due to artificial causes destroying the core samples. We did not note the obvious effect of the positions of samples on the patterns of growth disturbance.
Hence, considering the same debris flow event disturbing the growth of trees at the same time, we attributed the synchronous disturbance in 1982 of the width of 32 tree rings to a large debris flow. Combining the visible evidence, provided by satellite images, that a debris flow occurred between 1970 and 2012 with the data revealed by the synchronous growth disturbance in 1982 in tree rings, we determined the age of the debris flow in QYM as having occurred in 1982.
By comparing the annual widths of tree rings in 1981 and 1982, we calculated the index of growth suppression ratio to be equal to the width of the disturbed tree rings in a year (i.e., 1982) divided by the width of undisturbed tree rings on the year before (i.e., 1981) using the data with obvious growth suppression pattern in our study (Figure 5A and Figure 6). Meanwhile, previous studies proposed that if the width of a tree ring in year t is reduced by more than 40% or 50% (i.e., growth suppression ratio in our study) of the width in year t-1, and the reduction of width lasts more than 5 years, year t is defined as the year of debris flow (Carrara and O’Neill, 2003; Zhang et al., 2019). Similarly, in our study, the maximum growth suppression ratio was 91% (QYG2323B), while the minimum was 51% (QYG2303B), with an average value of 73% (σ=0.16). The lasting time of growth suppression is an important index to reveal the influence of debris flow on the growth of tree rings (Van Den Eeckhaut et al., 2009). Based on our data, the lasting time for the disturbed tree rings to recover the initial width by the 1982 debris flow in QYM ranges from 5 to 26 years, with an average of 12 (σ=0.46) years. We observed that the larger the growth suppression ratio influenced by debris flow, the longer the lasting time for tree rings to recover, which is consistent with previous studies (Carrara and O’Neill, 2003; Van Den Eeckhaut et al., 2009). Meanwhile, a raw logarithm relationship between lasting time (y) (i.e., time to recover the initial width) and growth suppression ratio (x) (y=17.56ln(x)-63.34,σ=0.32) was obtained in our study (Figure 6).
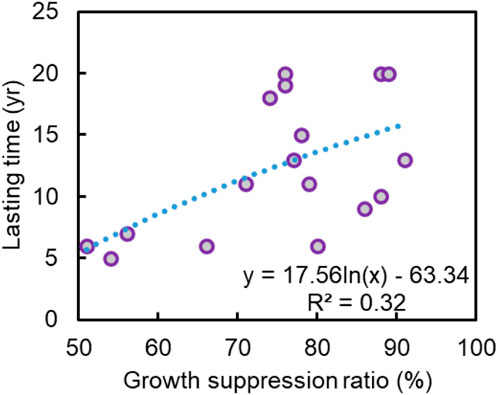
FIGURE 6. The relationship between lasting time and growth suppression ratio of tree rings disturbed by the 1982 debris flow.
Precipitation is important in triggering geohazards, especially debris flows (Ouyang et al., 2013; Ouyang et al., 2019a; Zhang et al., 2019). To analyze the effect of precipitation on the 1982 debris flow in QYM, we obtained monthly precipitation data from 1957 to 1982. We observed that the precipitation in July was the highest in the whole year averaged by the data of the last 25 years (Figure 7A), while the value in July 1982 (i.e., 1,299 mm) was 1.34 times that of the average value (i.e., 972 mm). Meanwhile, the monthly precipitation in July 1982 was the third highest of the previous 26 years, followed by that of 1981 (i.e., 1,374 mm) (Figure 7B). However, we also know that debris flows are commonly triggered by intense short-term precipitation events, sometimes preceded by high antecedent moisture conditions. Hence, because of a lack of more acute hourly precipitation in QYM, we just speculated that the high monthly precipitation observed in July 1982 played an important role in the evolution of the 1982 debris flow.
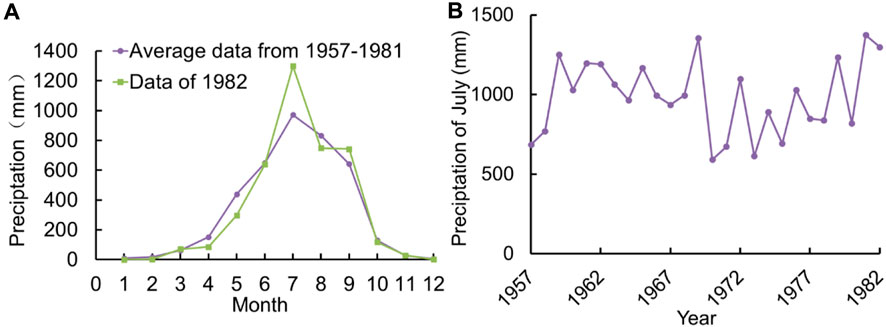
FIGURE 7. (A) Average monthly precipitation from 1957 to 1981 and monthly data in 1982 for the QYM region. (B) Monthly precipitation of July from 1957 to 1981 for the QYM region.
To calibrate the parameters, we simulated the debris flow that occurred before 1970 for a series of scenarios with different values of coefficient, friction angle, and pore water pressure coefficients. Meanwhile, we collected parameters by back analysis from previous similar studies so that our results were more accurate (Ouyang et al., 2013; Ouyang et al., 2019b; Sun et al., 2021). Based on post-debris flow and reconstructed pre-debris flow 1x1 m topography DTMs, ∼6,130 m3 of mass was estimated as being detached from the source area (i.e., pre-occurred landslide) before 1970. The results obtained using the cohesion of 8 kPa, the friction coefficient of 0.43, and the pore water pressure coefficient of 0.3 showed relatively good consistency with the farthest range of the real debris flow deposit in 1970 (Figure 8).
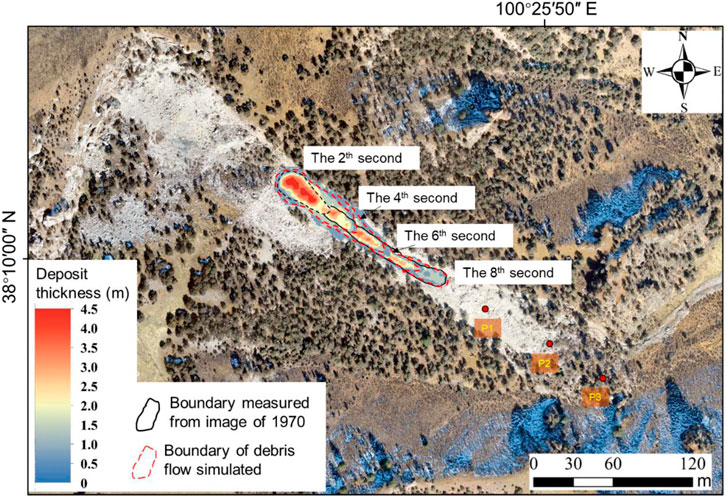
FIGURE 8. The evolution of debris flow depositing occurred before 1970, as calculated by numerical simulation.
The deposit thickness contours of the debris flow before 1970 at times t = 2, 4, 6, and 8 s are shown in Figure 8. Based on the simulated results, we observed that the debris flow moved fast forward from the source area from the beginning to the fourth second. The debris flow material deposited more in the back and front areas than in the middle area, forming a long-strip shape deposit. From the fourth to the eighth second, the debris flow extended further and finished moving during this second period, controlled by the reduction of material supplied from the source area and the frictional resistance of the deposited material. Eventually, the debris flow deposited as presented in the simulation map (Figure 9). As seen in the image, the farthest range is consistent with the real range observed in the satellite image from 1970, considering the effect of the resolution of the satellite image (Figure 3A).
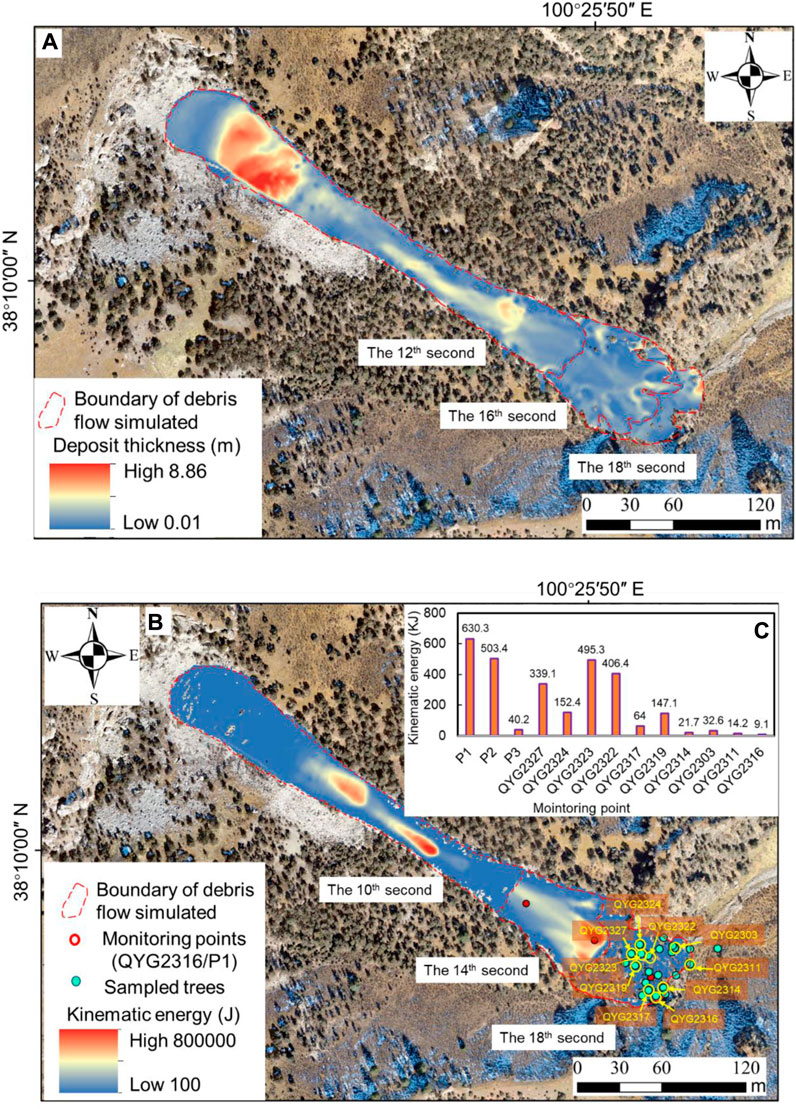
FIGURE 9. (A) The evolution of debris flow depositing and (B) kinematic energy of debris flow occurred in 1982 as calculated by numerical simulation. The locations of monitoring points for kinematic energy of debris flow impacting the sampled trees (C) are presented in (B).
We simulated the evolution of the 1982 debris flow by mass flow, obtaining the spatial distribution and kinematic energy of the debris flow deposit (Figure 9). Because of large amounts of materials detached from the source area, the debris flow was transported farther than those before 1970. The debris flow arrived at the top of the current dominant deposit area at the 10th second (Figure 9A). From the 10th to the 14th second, the material started to spread to a wider range and reached the area of the disturbed trees. From the 14th to the 18th second, the blocks involved in the debris hit the trees (Figure 9B), causing them to become injured, fall, and be destroyed. Lastly, the material was deposited with a final depth of 2–6 m in the front area.
In addition to the deposit depth varying spatially, the impacts were responsible for decreasing the kinematic energy of the debris flow. To analyze the energy variation after impacting the disturbed trees, three monitoring points (Figure 8 and Figure 9B) were set up along the debris flow transport direction during the simulation. The result shows that the kinematic energy was reduced from more than 630.3 KJ (P1) to ∼503.4 KJ (P2) before hitting the trees on the debris flow deposit. After hitting the sampled trees, the mass kinematic energy reduced spatially along the runout path, with the largest monitored value of 495.3 KJ located at QYG2323 and the smallest value of 9.1 KJ located at QYG2316.
It is very important to quantitatively obtain the dynamic growth process of trees (i.e., tree rings) disturbed by debris flows. Based on the relationship, we could predict the possible disturbance degree of trees by potential debris flows, which provides a reference for designing and maintaining bioengineering in debris flow-prone areas (Brang, 2001). Second, building the relationship provides us an additional approach to back analyze the evolution process and kinematic energy of historically occurred debris flows using the measurable growth disturbance in tree rings. Hence, based on the data, we attempted to build a relationship between the impact kinematic energy of debris flows and the time to recover the initial width in tree rings.
Although there was a lack of a real record of the debris flow process impacting the sampled trees in QYM, we used numerical simulation to reconstruct the evolution process including the kinematic energy of the 1982 debris flow. We observed a raw negative exponential function (R2=0.46) between the recovery time of disturbed tree rings (y, yr) and kinematic energy of debris flow (x, KJ) larger than 50 KJ in QYM (Figure 10A). This means that higher impact kinematic energy of debris flow leads to a larger growth suppression ratio and a longer recovery time. Meanwhile, we also noted that the growth suppression ratio almost remained constant with increasing kinematic energy after reaching the threshold value of ∼300 KJ (Figure 10B), which was the value inferred to the trees that were completely destroyed, with no more records of tree rings after that energy value.
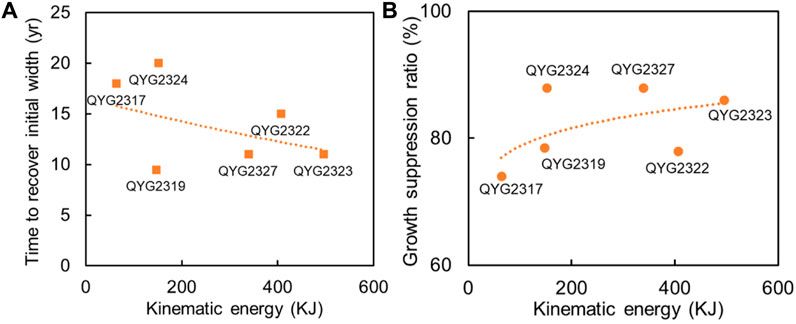
FIGURE 10. The relationship between the recovery time of disturbed tree rings (A) and the growth suppression ratio (B) and kinematic energy of debris flow (KJ) impacting the disturbed trees.
It is normal for tree rings to have one random growth disturbance pattern (growth suppression or asymmetric growth) influenced by water flow destroying the root systems or even local inset outbreaking (Figure 5 and Figure 11), rather than synchronous two patterns of growth disturbance as those influenced by the 1982 debris flow (Carrara and O’Neill, 2003; Ciervo et al., 2017; Zhang et al., 2019). Meanwhile, the influence of climatic events on the growth disturbance in tree rings should cover all the local trees rather than only the trees on the debris flow path. Hence, combined with satellite images, the growth disturbance in trees on the debris flow deposit from 1970 to 2012 was used to identify the debris flow that occurred in 1982.
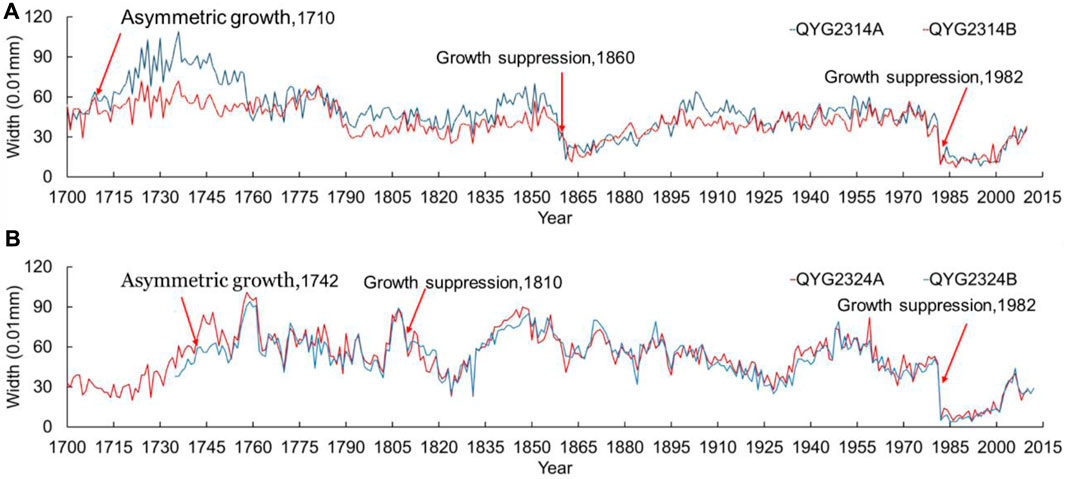
FIGURE 11. Tree-ring annual widths of sampled Qilian junipers QYG2314 (A) and QYG2324 (B). Red arrows point to the segments with abnormal growth (growth suppression and asymmetric growth) as a result of landslides, single block hitting, or some other factor.
The disturbance of 19 trees in 1982 was attributed to a relatively large debris flow. Considering several random growth disturbances occurred in specific years (i.e., the years 1710 and 1860 in QYG2314 in contrast to the years 1742 and 1810 in QYG2324) and their similar characteristics with those of 1982 (Figure 4), we suggest that the hitting of small blocks on the trees (or so-called rockfall) probably played an important role in those random disturbances because no large debris flow was observed around the sampled trees from the satellite image from 1970. However, we noted that there were some other random growth disturbances without typically identified characteristics in the sampled trees (e.g., 32 tree rings from 1970 to 2012 in Figure 5 and some unlabeled in Figure 11). We do not have enough confidence to attribute all of the growth disturbance events to rockfalls or landslides, instead of the fact possibly demonstrating that complex factors control the growth disturbance of tree rings in natural slopes (Carrara and O’Neill, 2003; Ciervo et al., 2017; Zhang et al., 2019). Research on the characteristics of growth disturbance controlled by different factors (e.g., geohazard, climatic forcing, or insect outbreaks) is a worthwhile future endeavor.
Our main objective in the study of the relationship between time to recover the initial width of disturbed tree rings and kinematic energy was to reveal the possible pattern of the relationship. Possible errors in the relationship dominate uncertainties in our numerical simulation of debris flow because we lacked precise topography data before 1982, which significantly controls the simulation results of debris flow. We tried to reduce the uncertainty by checking the 1970 satellite images and adjusting the current high-resolution DEM data from the surrounding terrains based on our previous experience (Sun et al., 2021). In addition, the errors due to uncertainties in debris flow simulation likely have more influence on the specific exponent value than the relationship pattern of the negative power function (Figure 11A). Accordingly, the degree of uncertainty in the numerical simulation of debris flow does not alter our conclusions about the possible coupling pattern of growth disturbance in tree rings and the kinematic energy of debris flow. Furthermore, because it is difficult to obtain sufficient data on disturbed tree rings to build a more convincing relationship, the negative power function obtained in this study is raw. This means that the relationship is full of so-called epistemic uncertainty compared with the real one (Wang et al., 2014).
In this study, we applied an approach for dating debris flow by a dendrogeomorphic technique and evidence of occurrence on remote sensing images, which was applied to identify the debris flow in QYM that occurred in 1982 in northeastern Tibet. Using clear boundaries of debris flow on remote sensing images before and after 1982 and a depth-integrated continuum model, we reconstructed the process of the 1982 debris flow and obtained the kinematic energy of the debris flow.
1. We observed two growth disturbance patterns in tree rings influenced by the 1982 debris flow, including growth suppression and asymmetric growth. By quantitative measurement of annual widths of tree rings in 1981 and 1982 from Qilian junipers, the maximum growth suppression ratio of tree rings influenced by the 1982 debris flow was 91%, while the minimum was 51%, with an average value of 73% (σ=0.16). The lasting time for disturbed tree rings by the 1982 debris flow to recover their initial width was from 5 to 26 years, with an average of 12 (σ=0.46) years.
2. Using simulated kinematic energy of the 1982 debris flow impacting the sampled trees, we obtained a raw negative exponential relationship between the kinematic energy of debris flow and time to recover the initial width of disturbed tree rings. The negative exponential relationship could be used to roughly estimate the time for specific trees to recover their initial state after an energy-calculated debris flow hazard.
By combining numerical simulation and remote sensing, the present study allows us to clarify the relationship between time to recover the initial width of disturbed tree rings and the kinematic energy of debris flows. However, field tests of how debris flow impacts trees and long-term monitoring of growth disturbance in tree rings are needed to build a more reliable relationship and revise the conclusion in our study in the future. Meanwhile, the monthly and annual resolution of precipitation data does not allow for a satisfactory explanation of the debris flow triggering conditions. More precise data on precipitation are needed to explore the effect of precipitation on the debris flow in QYM.
The raw data supporting the conclusion of this article will be made available by the authors, without undue reservation.
XW: Conceptualization, Data curation, Formal Analysis, Funding acquisition, Investigation, Methodology, Supervision, Writing–original draft, Writing–review and editing. JS: Data curation, Formal Analysis, Investigation, Methodology, Visualization, Writing–original draft, Writing–review and editing. YZ: Data curation, Investigation, Methodology, Software, Writing–original draft. QJ: Data curation, Investigation, Methodology, Writing–original draft. SQ: Funding acquisition, Resources, Supervision, Validation, Writing–original draft. RW: Data curation, Investigation, Methodology, Software, Writing–original draft. HL: Data curation, Investigation, Methodology, Software, Writing–original draft. MZ: Data curation, Project administration, Visualization, Writing–original draft.
The author(s) declare financial support was received for the research, authorship, and/or publication of this article. This research was supported by the Strategic Priority Research Program of the Chinese Academy of Sciences (Grant No. XDA23090402), the China Natural Science Foundation (Grant Nos 42172304 and 41977392), and the Second Tibetan Plateau Scientific Expedition and Research Program (STEP) (Grant No. 2019QZKK0904).
We thank Wenling An and Chenxi Xu for their help with the dendrogeomorphic technique.
The authors declare that the research was conducted in the absence of any commercial or financial relationships that could be construed as a potential conflict of interest.
All claims expressed in this article are solely those of the authors and do not necessarily represent those of their affiliated organizations, or those of the publisher, the editors and the reviewers. Any product that may be evaluated in this article, or claim that may be made by its manufacturer, is not guaranteed or endorsed by the publisher.
Bao, Y., Zhang, Y., Chen, J., Su, L. J., Li, Y. C., Zhang, X. D., et al. (2023b). Numerical investigation of river blocking process of Gangda paleolandslide at the upstream reaches of the Jinsha River, Tibentan Plateau. Landslides 20, 1865–1882. doi:10.1007/s10346-023-02078-8
Bao, Y. D., Su, L. J., Chen, J. P., Ouyang, C. J., Yang, T., Lei, Z. H., et al. (2023a). Dynamic process of a high-level landslide blocking river event in a deep valley area based on FDEM-SPH coupling approach. Eng. Geol. 319, 107108. doi:10.1016/j.enggeo.2023.107108
Brang, P. (2001). Resistance and elasticity: promising concepts for the management of protection forests in the European Alps. For. Ecol. Manag. 145, 107–119. doi:10.1016/S0378-1127(00)00578-8
Butler, D. R., Oelfke, J. G., and Oelfke, L. A. (1986). Historic Rockfall Avalanches, Northeastern Glacier National Park, Montana, U.S.A. U.S.A. Mt. Res. Dev. 6, 261. doi:10.2307/3673396
Carrara, P. E., and O’Neill, J. M. (2003). Tree-ring dated landslide movements and their relationship to seismic events in southwestern Montana, USA. Quat. Res. 59, 25–35. doi:10.1016/S0033-5894(02)00010-8
Casana, J. (2020). Global-Scale Archaeological Prospection using CORONA Satellite Imagery: automated, Crowd-Sourced, and Expert-led Approaches. J. Field Archaeol. 45, S89–S100. sup1. doi:10.1080/00934690.2020.1713285
Ciervo, F., Rianna, G., Mercogliano, P., and Papa, M. N. (2017). Effects of climate change on shallow landslides in a small coastal catchment in southern Italy. Landslides 14, 1043–1055. doi:10.1007/s10346-016-0743-1
Cook, E. R., and Kairiukstis, L. A. (1990). Methods of dendrochronology: applications in the environmental Sciences. Dorefrecht: Kluwer Academic Publishers.
Crosta, G. B., and Clague, J. J. (2009). Dating, triggering, modelling, and hazard assessment of large landslides. Geomorphology 103, 1–4. doi:10.1016/j.geomorph.2008.04.007
Dorren, L. K. A., and Berger, F. (2006). Stem breakage of trees and energy dissipation during rockfall impacts. Tree Physiol. 26, 63–71. doi:10.1093/treephys/26.1.63
Grissino-Mayer, H. D. (2001). Evaluating crossdating accuracy-a manual and tutorial for the computer program COFECHA. Tree-Ring Res. 2, 205–221.
ISRM (1979). Suggested methods for the quantitative description of discontinuities in rock masses. Int. J. Rock Mech. Min. Sci. Geomechanics Abstr. 16, 22. doi:10.1016/0148-9062(79)91476-1
Iverson, R. M., and Ouyang, C. (2015). Entrainment of bed material by Earth-surface mass flows: review and reformulation of depth-integrated theory. Rev. Geophys. 53, 27–58. doi:10.1002/2013RG000447
Johnson, K., Nissen, E., Saripalli, S., Arrowsmith, J. R., McGarey, P., Scharer, K., et al. (2014). Rapid mapping of ultrafine fault zone topography with structure from motion. Geosphere 10, 969–986. doi:10.1130/GES01017.1
Lopez Saez, J., Corona, C., Stoffel, M., Astrade, L., Berger, F., and Malet, J.-P. (2012). Dendrogeomorphic reconstruction of past landslide reactivation with seasonal precision: the Bois Noir landslide, southeast French Alps. Landslides 9, 189–203. doi:10.1007/s10346-011-0284-6
Loye, A., Jaboyedoff, M., and Pedrazzini, A. (2009). Identification of potential rockfall source areas at a regional scale using a DEM-based geomorphometric analysis. Nat. Hazards Earth Syst. Sci. 9, 1643–1653. doi:10.5194/nhess-9-1643-2009
Ma, S., Xu, C., Shao, X., Zhang, P., Liang, X., and Tian, Y. (2019). Geometric and kinematic features of a landslide in Mabian Sichuan, China, derived from UAV photography. Landslides 16, 373–381. doi:10.1007/s10346-018-1104-z
Noguchi, K., Tsou, C.-Y., Ishikawa, Y., Higaki, D., and Wu, C.-Y. (2021). Tree-Ring Based Chronology of Landslides in the Shirakami Mountains, Japan. Water 13, 1185. doi:10.3390/w13091185
Ouyang, C., An, H., Zhou, S., Wang, Z. W., Su, P. C., Wang, D. P., et al. (2019a). Insights from the failure and dynamic characteristics of two sequential landslides at Baige village along the Jinsha River, China. Landslides 16, 1397–1414. doi:10.1007/s10346-019-01177-9
Ouyang, C., He, S., Xu, Q., Luo, Y., and Zhang, W. (2013). A MacCormack-TVD finite difference method to simulate the mass flow in mountainous terrain with variable computational domain. Comput. Geosciences 52, 1–10. doi:10.1016/j.cageo.2012.08.024
Ouyang, C., Wang, Z., An, H., Liu, X., and Wang, D. (2019b). An example of a hazard and risk assessment for debris flows—A case study of Niwan Gully, Wudu, China. Wudu, China, Eng. Geol. 263, 105351. doi:10.1016/j.enggeo.2019.105351
Pánek, T. (2015). Recent progress in landslide dating. Prog. Phys. Geogr. Earth Environ. 39, 168–198. doi:10.1177/0309133314550671
Perret, S., Dolf, F., and Kienholz, H. (2004). Rockfalls into forests: analysis and simulation of rockfall trajectories ? considerations with respect to mountainous forests in Switzerland. Landslides 1. doi:10.1007/s10346-004-0014-4
Qi, S., Xu, Q., Lan, H., Zhang, B., and Liu, J. (2010). Spatial distribution analysis of landslides triggered by 2008.5.12 Wenchuan Earthquake, China. Eng. Geol. 116, 95–108. doi:10.1016/j.enggeo.2010.07.011
Schneuwly, D. M., and Stoffel, M. (2008). Spatial analysis of rockfall activity, bounce heights and geomorphic changes over the last 50 years – A case study using dendrogeomorphology. Geomorphology 102, 522–531. doi:10.1016/j.geomorph.2008.05.043
Šilhán, K. (2021). A new tree-ring-based index for the expression of spatial landslide activity and the assessment of landslide hazards. Geomatics, Nat. Hazards Risk 12 (1), 3409–3428. doi:10.1080/19475705.2021.2011790
Šilhán, K. (2017). Evaluation of growth disturbances of Picea abies (L.) Karst. to disturbances caused by landslide movements. Geomorphology 276, 51–58. doi:10.1016/j.geomorph.2016.10.005
Šilhán, K., Prokešová, R., Medveďová, A., and Tichavský, R. (2016). The effectiveness of dendrogeomorphic methods for reconstruction of past spatio-temporal landslide behaviour. CATENA 147, 325–333. doi:10.1016/j.catena.2016.07.035
Stoffel, M. (2006). A Review of Studies Dealing with Tree Rings and Rockfall Activity: the Role of Dendrogeomorphology in Natural Hazard Research. Nat. Hazards 39, 51–70. doi:10.1007/s11069-005-2961-z
Stoffel, M., Butler, D. R., and Corona, C. (2013). Mass movements and tree rings: A guide to dendrogeomorphic field sampling and dating. Geomorphology 200, 106–120. doi:10.1016/j.geomorph.2012.12.017
Stoffel, M., Schneuwly, D., Bollschweiler, M., Lièvre, I., Delaloye, R., Myint, M., et al. (2005). Analyzing rockfall activity (1600–2002) in a protection forest—a case study using dendrogeomorphology. Geomorphology 68, 224–241. doi:10.1016/j.geomorph.2004.11.017
Stokes, M. A., and Smiley, T. L. (1968). An introduction to tree-ring dating. China: University of Arizona Press.
Sun, J., Wang, X., Liu, H., and Yuan, H. (2021). Effects of the attitude of dominant joints on the mobility of translational landslides. Landslides 18, 2483–2498. doi:10.1007/s10346-021-01668-8
Van Den Eeckhaut, M., Muys, B., van Loy, K., Poesen, J., and Beeckman, H. (2009). Evidence for repeated re-activation of old landslides under forest. Earth Surf. Process. Landforms 34, 352–365. doi:10.1002/esp.1727
Wang, X., Frattini, P., Crosta, G. B., Zhang, L., Agliardi, F., Lari, S., et al. (2014). Uncertainty assessment in quantitative rockfall risk assessment. Landslides 11, 711–722. doi:10.1007/s10346-013-0447-8
Wang, X., Liu, H., and Sun, J. (2021). A new approach for identification of potential rockfall source areas controlled by rock mass strength at a regional scale. Remote Sens. 13 (5), 938. doi:10.3390/rs13050938
Wistuba, M., Malik, I., Gärtner, H., Kojs, P., and Owczarek, P. (2013). Application of eccentric growth of trees as a tool for landslide analyses: the example of Picea abies Karst. in the Carpathian and Sudeten Mountains (Central Europe). Catena111 111, 41–55. doi:10.1016/j.catena.2013.06.027
Woltjer, M., Rammer, W., Brauner, M., Seidl, R., Mohren, G. M. J., and Lexer, M. J. (2008). Coupling a 3D patch model and a rockfall module to assess rockfall protection in mountain forests. J. Environ. Manage 87, 373–388. doi:10.1016/j.jenvman.2007.01.031
Wu, J. H., and Ping-Hsuan Hsieh, P. H. (2021). Simulating the postfailure behavior of the seismically-triggered Chiu-fen-erh-shan landslide using 3DEC. Eng. Geol. 287, 106113. doi:10.1016/j.enggeo.2021.106113
Keywords: debris flow simulation, remote sensing, tree ring, mass flow, northeastern Tibet
Citation: Wang X, Sun J, Zhang Y, Jiao Q, Qi S, Wang R, Liu H and Zhang M (2023) Energetic impact of reconstructed debris flow on the intensity and duration of growth disturbances in tree rings. Front. Earth Sci. 11:1273352. doi: 10.3389/feart.2023.1273352
Received: 06 August 2023; Accepted: 21 September 2023;
Published: 11 October 2023.
Edited by:
Wentao Yang, University of Leeds, United KingdomReviewed by:
Yiding Bao, Key Laboratory of Mountain Hazards and Surface Processes, Institute of Mountain Hazards and Environment, Chinese Academy of Sciences (CAS), ChinaCopyright © 2023 Wang, Sun, Zhang, Jiao, Qi, Wang, Liu and Zhang. This is an open-access article distributed under the terms of the Creative Commons Attribution License (CC BY). The use, distribution or reproduction in other forums is permitted, provided the original author(s) and the copyright owner(s) are credited and that the original publication in this journal is cited, in accordance with accepted academic practice. No use, distribution or reproduction is permitted which does not comply with these terms.
*Correspondence: Xueliang Wang, d2FuZ3h1ZWxpYW5nQG1haWwuaWdnY2FzLmFjLmNu
Disclaimer: All claims expressed in this article are solely those of the authors and do not necessarily represent those of their affiliated organizations, or those of the publisher, the editors and the reviewers. Any product that may be evaluated in this article or claim that may be made by its manufacturer is not guaranteed or endorsed by the publisher.
Research integrity at Frontiers
Learn more about the work of our research integrity team to safeguard the quality of each article we publish.