 Yongsong Lu1
 Peifeng Li
95% of researchers rate our articles as excellent or good
Learn more about the work of our research integrity team to safeguard the quality of each article we publish.
Find out more
ORIGINAL RESEARCH article
Front. Earth Sci. , 02 November 2023
Sec. Geohazards and Georisks
Volume 11 - 2023 | https://doi.org/10.3389/feart.2023.1271355
This article is part of the Research Topic Geohazard Monitoring, Modeling, and Assessment in Harsh Environments View all 7 articles
Biaxial compression is a typical stress state experienced by the surrounding rock near the excavation boundaries under deep underground engineering, frequently resulting in engineering geological disasters (spalling and rockburst). The motivation to mitigate the risk and damage of these disasters has led us to compressively examine the evolutionary characteristics of acoustic signals [microseismic (MS) events, sound and acoustic emission (AEs)] produced by granite under biaxial compression with different intermediate principal stresses. These characteristics include time (activeness and b value) and frequency (main frequency and proportion of the advantage frequency bands) domains. The results suggest that: 1) the signal properties-driven order of activeness under low and high intermediate principal stresses for the initial stresses were as follows: AE accounted for 37.4% and 43.5% of σpeak, MS for 61.1% and 66% of σpeak, and sound for 81.8% and 85.5% of σpeak. 2) The notable distinction in precursors of different acoustic signals before granite failure was confirmed: the sequential relationship in the continuous decrease rate of the b value (AE < MS < sound), the occurrence (only existing in AE signals) of a few signals with extremely high amplitude (the “quiescent period”) and the different frequency-change rule in the proportion of the advantage frequency bands. 3) The strong influences of intermediate principal stress on the signal precursors were determined; these precursors in the activeness, b value, and proportion are negative to intermediate principal stress, whereas that of the main frequency shows a positive correlation. Consequently, these findings can contribute integrated usage of the multifrequency signals in the prediction and warning of geological disasters under deep underground engineering.
In deep underground engineering, after tunnel excavation, the equilibrium stress state of surrounding rocks near excavation boundaries is disturbed and broken due to the unloading effect of the excavation surface, and then a stress redistribution phenomenon occurs to generate a new balance in the stress state of the surrounding rocks. In this stress redistribution, referred to as stress adjustment, the minimum principal stress σ3 decreases to 0, the maximum principal stress σ1 increases, and the intermediate principal stress σ2 barely changes; thus, the stress state changes from a true triaxial stress state (σ1>σ2>σ3≠0) to a biaxial stress state (σ1>σ2>σ3≈0) (Cai, 2008). In addition, these redistribution-driven surrounding rocks frequently encounter the concentration of tangential stress (σ1) and then experience a spalling phenomenon with static failure distributed at a certain depth near the excavation boundary and are approximately parallel to the excavation surface (Cai, 2008; Chen et al., 2022; Feng et al., 2018; Sun et al., 2022), and even drive a rockburst phenomenon with dynamic ejection (Chen et al., 2023; Sun et al., 2022; Wang et al., 2020; Wang Q et al., 2021; Wang X R et al., 2021; Xia et al., 2022). With the increasing need for underground space and energy exploitation, the construction of deep underground engineering has been in full swing (the increasing construction depth), which leads to the two types of engineering geological hazards being more frequent and robust, seriously damaging the safety of infrastructure, equipment and workers (Cui et al., 2021; Su et al., 2020; Zhang et al., 2020; Zhao et al., 2023; Zheng et al., 2023a). However, due to the highly complex mechanisms of rock hazards (e.g., spalling and rockburst) resulting from deep underground engineering, effective prediction and warning technologies still cannot meet the prevention requirements in practical applications.
The progressive development of catastrophes in rock masses usually originates from crack initiation, extension and coalescence inside rock masses (Moradian et al., 2016), which are difficult to observe directly by the naked eye or with imaging instruments. Fortunately, the strain energy stored in rock masses is released in the form of cracking, which can create multiple acoustic signals with different frequency ranges, including MS, sound, and AE signals (Cai et al., 2007). AE and MS signals have been regarded as powerful tools for monitoring rock/rock-like material failures since their discovery in the last century (Blake et al., 1974; GOODMAN, 1963; Kourkoulis et al., 2015; Shiotani, 2006; Srinivasan et al., 1997; Triantis et al., 2022; Zhang et al., 2022; Zhao J S et al., 2022; Zheng et al., 2023b), and the nature of the signals determines that these techniques can support effective monitoring of the whole failure process without any damage to rock materials (referred to as nondestructive monitoring). In general, the approaches used in AE/MS signals mainly involve the analysis of time-series parameters (Colombo et al., 2003; Hloupis et al., 2016), fracture modes (Ohno and Ohtsu, 2010; Aggelis, 2011), fracture source location (Triantis et al., 2023), and material damage (Ohtsu et al., 2002). As one of the key routes in the time-series analysis, the b value proposed by Gutenberg and C. F. Richter in studying the G-R equation of the statistical relationship between the magnitude and frequency of worldwide earthquakes, is an indicator used in the description of seismic activity; a change (increase or decrease) in the b value is strongly associated with an increase in the types of fractures (large or small) and the development of the material failure process (Gutenberg and Richter, 1944). On the other hand, the AF (rise time/maximum amplitude)-RA (average frequency) method is also applied to identify fracture modes (tension, shear and mix-mode) in hard-brittle rocks and even reveal the pre-failure features of the rocks.
In addition, there is a significant difference in frequency (relating to the monitoring sensitivity to the cracking scales) between AE and MS signals; AE signals with a high-frequency range from 104 to 107 Hz are suitable for monitoring small-scale rock cracks, and MS signals with a low-frequency range from 10−1 to 103 Hz are suitable for monitoring large-scale rock cracks (Cai et al., 2007; Lei and Ma, 2014). However, the application of AE and MS techniques in engineering is hampered by the limitation of propagation depending on the rock masses and considerable signal attenuation caused by increasing distance, poor geological structures, and unreliable connections between sensors and rock masses (Li et al., 2023). In fact, the failure process of rock masses in deep underground engineering also generates a plethora of sound signals with frequencies ranging from 20 Hz to 20 kHz sensed by the human ears. Sound signals not only can travel in the air (contributing to the signal acquisition) but also have advantages over AE/MS signals in the attenuation degree of signal intensity [e.g., the logarithmic mode to sound signals in the air (Rossing, 2007), and the exponential mode to AE/MS signals in rock (Lei et al., 2019; Seo et al., 2019)], with the increasing distance between the cracking source and the instrument; these advantages attract practical workers to predict and warn of rock failure and instability using sound signals (Russenes, 1974; Tan, 1992). Therefore, monitoring techniques based on three acoustic signals have strong application prospects for the effective prediction and early warning of failure and instability in deep rock masses.
Research on the acoustic signal-based prediction and warning of rock failures under biaxial compression has received much attention, especially the evolutionary characteristics associated with the evolution of key fractures and failure processes in rocks. For high-frequency AE signals, research has mainly focused on experimental simulations in the laboratory based on small-scale rock samples. For instance, Du et al. (2021) confirmed the sudden increase in the AE hits and counts before the failure of hard rocks. Dong et al. (2022) discovered the distribution transition of AE events from scattered to clustered, nucleated, and finally to banded over time by applying the velocity-free AE source location method. Su et al. (2022) extracted a class of AE signals (an indicative precursor feature of hard rock instability) featuring ‘high rise time, high ring count, high energy and low peak frequency and low quantity’ by the clustering unsupervised learning method and then proposed a prediction method for the instability modes (e.g., spalling or rockburst) of hard rocks after the occurrence of the slabbing failure phenomenon by the integrated use of class and RA-AF value. For low-frequency MS signals, most studies have investigated the practical engineering monitoring of large-scale rock masses. Liu et al. (2022) highlighted that MS signals with low frequency before failure will appear with the investigation of MS signals underlying the failure of a coal–rock parting coal structure under biaxial compression. Sun et al. (2021) found that MS event cluster characteristics based on the moment tensor inversion method can detect the occurrence of the rupture mode (dominated by tensile fractures) of a dome roof in a main transformer room. However, a study of the evolutionary characteristics of sound signals produced by hard rocks under biaxial compression has not been reported; moreover, there is a gap in the research about the similarities and differences in the evolutionary characteristics of AE, MS and sound signals under the biaxial compression of hard rocks [except for uniaxial compression (Su et al., 2023)], which can contribute to the integrated usage of three types of signals in the prediction and warning of engineering geological disasters.
Intermediate principal stress σ2 is an essential component of the stress states of rock masses under deep engineering, i.e., a true-triaxial stress state (σ1>σ2>σ3≠0) in general or a biaxial stress state (σ1>σ2>σ3≈0, corresponding to the rock near excavation boundaries) in particular. In addition, with the increase in engineering construction depth, σ2 presents an increasing trend. Thus, σ2 can strongly govern the strength, crack behaviour and failure mode of a rock mass (Kiyoo, 1967). In particular, the response variation of the corresponding acoustic signals can be motived when the σ2 changes the mechanical properties in the rock. For example, as σ2 increases, the total number of crack events recognized by AE signals decreases in number and increases in size under true triaxial compression (Chang et al., 2022). The AE characteristic of rock specimens changes from the swarm type to the main shock type in true triaxial unloading compressive tests (Du et al., 2015). Under true triaxial loading, a transition in each frequency band from sparse distribution to dense distribution occurs in the AE dominant frequency, and near the peak stress the downwards transitional behaviour in the AE dominant frequency shifts to a downwards–upwards transitional behaviour (Hao et al., 2022). The percentage of tensile cracks classified by the AF–RA method of AE signals increases under biaxial confinements (Du et al., 2021). However, research on the influence of the intermediate principal stress σ2 on the evolutionary characteristics of acoustic signals produced by hard rock cracking has mainly focused on true triaxial compression conditions rather than biaxial compression, but there is a significant difference in cracking mechanisms (leading to distinctive acoustic characteristics) in hard rocks. Moreover, how σ2 controls the performance of multiscale monitoring technologies composed of AE, MS and sound signals in the failure and instability of hard rocks subjected to biaxial compression (how to affect the signal characteristics) is a crucial research gap.
To end this, a true triaxial testing machine was used to simulate the failure processes of medium-coarse crystalline granite under biaxial compression (rock masses near excavation boundaries) at σ2 values of 1 MPa and 30 MPa, and the whole process was recorded by multisignal monitoring systems composed of AE, sound and MS instruments. Secondly, the experimental results were systematically analysed. This analysis involved aspects of mechanics and raw signals properties, the evolutionary processes of these signals in terms of time (the signal activeness and the b value) and frequency domains (the main frequency and the proportion of the advantage frequency bands), as well as comparison of precursors among the three types of acoustic signals. Finally, the mechanism of the influence of intermediate principal stress on the precursors of acoustic signals was discussed in depth based on the natural correlation between rock failure development and signal generation.
In this study, coarse-grained cubic granite samples with dimensions of 100 mm × 100 mm × 200 mm (see Figure 1) were adopted as the specimens, whose mineral content contained approximately 55% potash feldspar, 28% quartz, 11% plagioclase, 3% biotite and 3% other minerals. The specimens were taken from Cenxi Town, Wuzhou City, Guangxi Province, China, and were all cut from the same rock mass. The screened and polished accuracy of the specimens before testing was strictly in accordance with the rules of rock mechanics experiments recommended by the International Society for Rock Mechanics (Feng et al., 2019). Table 1 shows the physical–mechanical properties of the specimens.
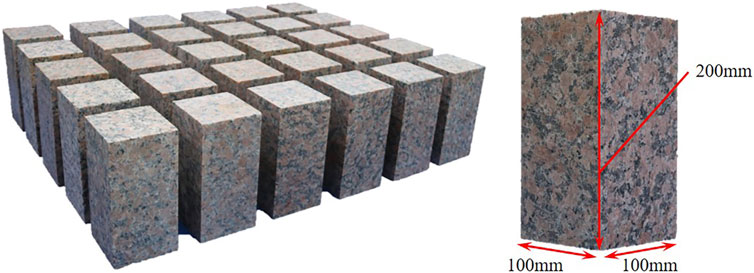
FIGURE 1. Used specimens.

TABLE 1. Basic physical–mechanical properties of the rock specimens.
The true-triaxial testing machine (see Figure 2A) designed by Su et al. (2017) can reach loading conditions with high performance, i.e., a maximum vertical loading of 5,000 kN and a maximum horizontal loading of 3,000 kN, and is specially equipped with independent loading systems in three directions (X, Y and Z). The failure processes of rock masses near excavation boundaries at different intermediate principal stresses can be accurately simulated with this machine.
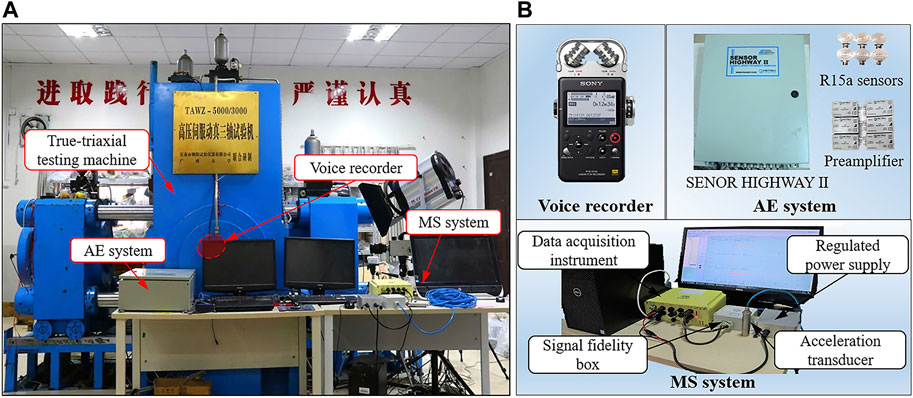
FIGURE 2. (A) True-triaxial testing machine and (B) the monitoring systems of acoustic signals.
The signal monitoring systems include an AE system, an MS system and a sound recorder, as shown in Figure 2B: 1) The AE system is an 8-channel AE acquisition system (namely, SENSOR HIGHWAY II) produced by PAC, United States. The basis parameter setting of the AE system was set as a threshold of 40 dB, a sampling rate of 1 MSPS (1 MHz), a PDT of 50 μs, an HDT of 100 μs, an HLT of 200 μs, and a signal length of 8 k. Six R15a AE sensors, with a frequency range of 50–400 kHz, peak sensitivity [Ref V/(m/s)] of 80 dB, resonant frequency (Ref V/(m/s)) of 75 kHz, and directionality of ±1.5 dB, were equipped in this AE system. 2) The MS system is a high-precision MS monitoring system designed by the Wuhan Institute of Rock and Soil Mechanics, Chinese Academy of Sciences, referred to as SINOSEISM (SSS-32AD-8). The sampling rate in this MS system was set as 4 kHz, and the acceleration transducer of AU (T) 30,000 with high precision, whose parameters are a frequency range of 50–5k Hz ± 3 dB, sensitivity of 30 V/g, resolution of 0.00005 g and measuring range of ±0.16 g, was selected to accurately capture the rock cracking in the testing process. 3) The sound recorder is a digital voice recorder (PCM-D100) developed by SONY; the sampling rate and resolution were set as 44.1 kHz and 24-bit depth, respectively. The sensor of the sound recorder is an electret condenser-type microphone whose parameters include a length of 15 mm, SNR of 100 dB, sensitivity of 31 dB/Pa 1 kHz, and frequency range of 20 Hz–20 kHz.
Additionally, the sensors, i.e., AE and MS sensors and sound recorder, were arranged as presented in Figure 3A to optimally obtain the multiscale acoustic signals accompanying the rock cracking during the testing process. Regarding AE and MS sensors that require contact-based data acquisition, two types of sensors were adhered to the fixture surface after adding an ultrasonic couplant to the front end of these sensors, and then they were firmly secured using insulation tape to ensure the quality of signal capture; conversely, the sound recorder was just placed at a distance of 0.5 m away from the tested specimens due to its superiority in remote data acquisition. In the testing process, there are two types of set signal/information flows: continuous waveform flow in MS and sound signals and hit parameter-motivated independent waveforms with a length of 8k. These types are determined based on the properties of sensor frequency ranges and sampling rates; that is, high-frequency and high-sampling-rate signals are suitable for the independent waveforms, while low-frequency and low-sampling rate signals match with the continuous waveform flow. Furthermore, although the AE system, MS system, and sound recorder are independent of each other, several scientific strategies were implemented in the testing process to minimize synchronization errors among these three types of instruments. In Step 1, the timestamps of the three independently functioning instruments were standardized before each experimental test. In Step 2, data alignment was applied based on the unified timestamps to further synchronize the start and end times of the acquired data.
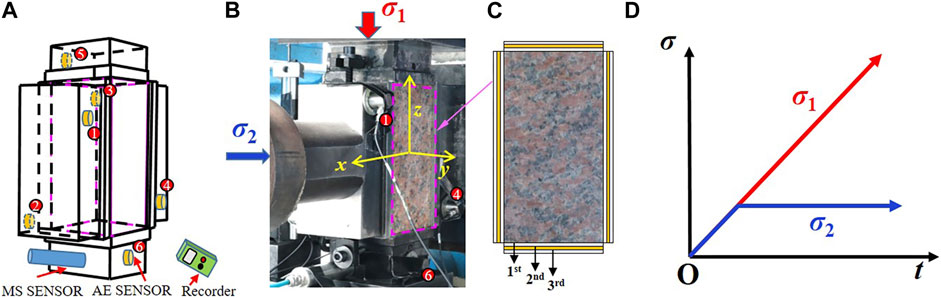
FIGURE 3. (A) Sensor arrangement, (B) loading diagram of rock specimens, (C) arrangement of friction reduction and (D) loading path under biaxial compression test. The first represents the antifriction agent, the second represents the 0.01 mm copper sheet, and the third represents the antifriction agent in Panel (C).
To depress the constraint effect of the specimen in the loading face, anti-friction layers (Figures 3B, C) were added between the fixture and the specimen before the test, including Vaseline and stearic acid (the first layer), a 0.01 mm copper sheet (the second layer) and Vaseline and stearic acid (the third layer); the experimental results proved the strong depression to the constraint effect on the specimen based on the anti-friction layers. To simulate the failure processes of granite under biaxial compression with different intermediate principal stresses, the experimental loading plan (Figure 3D) was designed as follows: 1) independently and simultaneously load σ1 and σ2 at a loading rate v of 0.5 MPa/s until σ2 reaches the set target value; 2) continually load σ1 at the v until the specimen fails; additionally, the σ2 values of 1 MPa and 30 MPa were adopted to investigate the influence of intermediate principal stress on the surrounding rocks near the tunnel excavation boundary.
The entire failure processes of granite under biaxial compression at different intermediate principal stresses σ2 were simulated with the specimens and the testing systems and program in Sections 2.1, 2.2; meanwhile, the AE, MS and sound signals generated during these failure processes were recorded. The experimental results (Figure 4A) show that with the increase in σ2, the peak strength (σ1) and strain (ε1) of granite under biaxial compression significantly increase from 139 MPa to 199 MPa and 5.445‰ to 6.042‰, respectively. In addition, the failed specimens all exhibit abundant vertical cracks parallel to σ1, indicating that a plethora of tensile cracks are encountered in the testing process; as σ2 increases from 1 MPa to 30 MPa, the failed sample presents a number of cracks with regard to an angle with σ1 and rock pits on the bottom left or upper right, respectively, which may reflect the dramatic activities of shear cracks near the onset of granite failure, as shown in Figure 4B. Therefore, the tensile cracking mechanism dominates during the failure of granite subjected to biaxial compression, and σ2 strongly governs the resistance, deformation and cracking mechanisms.
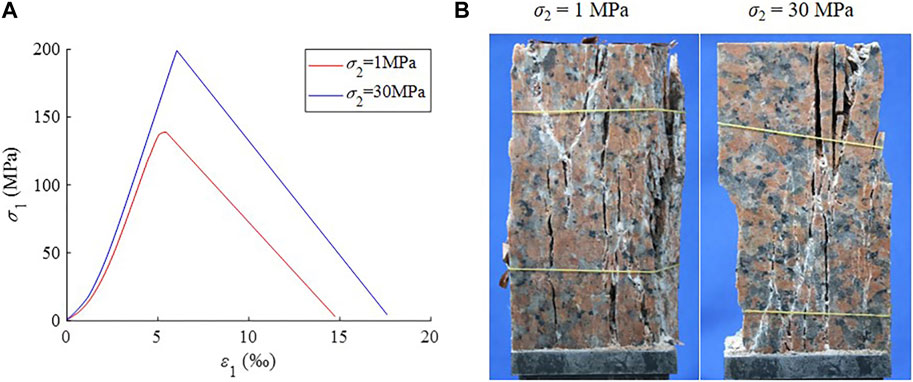
FIGURE 4. (A) σ1–ε1 curves under granite subjected to biaxial compression tests with different σ2 and (B) failed specimens.
Additionally, the evolutionary processes of AE hits, MS waveforms and sound waveforms under granite subjected to biaxial compression tests with different intermediate principal stresses σ2 are shown in Figure 5. Although the three types of acoustic signals encounter a similar progressive development from slight to considerable activeness with the loading advancement, it can be clearly observed that the active period of AE signals is significantly earlier than that of MS and sound signals, and this period in MS signals is more advanced than that in sound signals, especially when σ2 is 30 MPa; near the onset of granite failure, AE hits reach a high level and then continuously decrease, while MS and sound waveforms both present an increasing trend in the density and magnitude of amplitude, and the density of sound waveforms is sparser than that of MS waveforms; meanwhile, the sound signals are stronger than MS signals in the relative level of waveform amplitude. Moreover, with the increase in σ2, the AE hits, MS waveforms and sound waveforms exhibit obvious change rules, such as an enhanced activity level (larger and denser indicators) and an advanced active period. In summary, there are essential differences in the period and intensity of signals between AE hits, MS waveforms and sound waveform and the significantly changing signal properties prior to the granite failure, and intermediate principal stress strongly drives the transition in acoustic responses. This study needs to determine the evolutionary characteristics of acoustic signals during the biaxial compression of granite with different intermediate principal stresses in terms of time (the activeness and the b value) and frequency (the main frequency and the proportion of the advantage frequency bands) domains to provide deep insight into the cracking mechanism and hazard prevention in tunnel engineering construction.
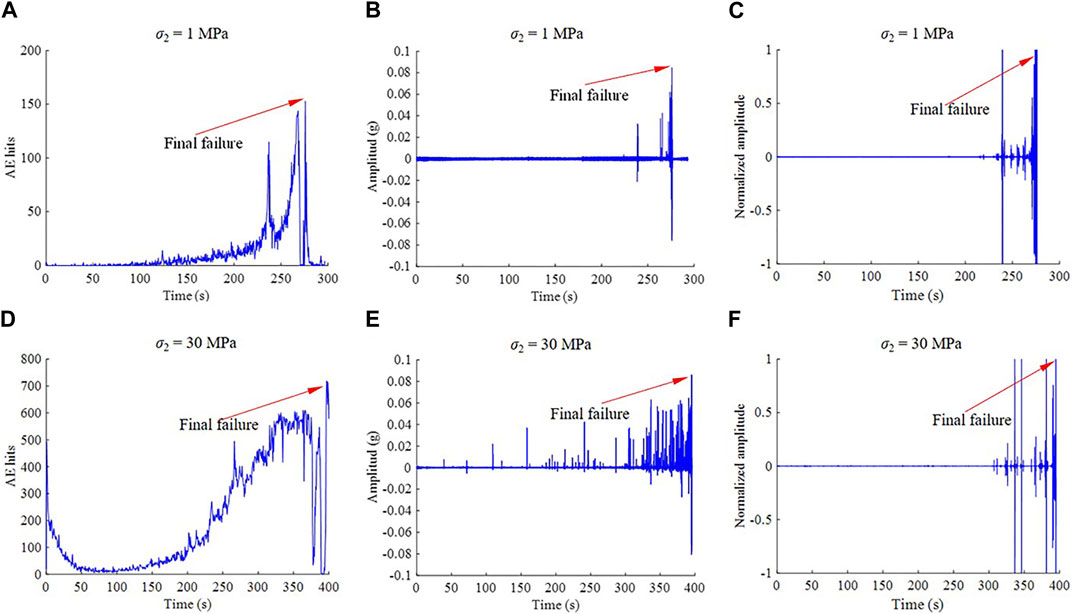
FIGURE 5. Evolutionary processes of (A,D) AE hits, (B,E) MS waveforms and (C,F) sound waveforms under granite subjected to biaxial compression tests with different σ2.
Signal activeness, namely, the signal activity index, refers to the number of times that a signal waveform exceeds a set threshold, which can greatly reflect the failure and damage processes of hard rocks (Su et al., 2021). The AE counts are interchangeably known as the AE signals activity index, given their shared concept and unified expressions. The thresholds for each acoustic signal refer to the 40 dB described in Section 2.1 for AE signals, as well as to their waveform maximum during the environmental noise-dominated period (which is equal to 10% of the loading time) for MS and sound signals.
Figures 6A, D present the evolutionary processes of AE activity index under granite subjected to biaxial compression tests with different σ2 values (e.g., 1 MPa and 30 MPa): 1) At a σ2 of 1 MPa, from 0 to 120 s, AE activity index are almost low activity, and the accumulation shows a slow increasing trend. After 120 s, the activity in the AE activity index gradually increases, and the rising rate in the accumulative AE activity index is obviously advanced, indicating a growth transition from linear to exponential. At 236 s, a high surge of approximately 1.2351 × 10⁴ occurs in the AE activity index, and the accumulation encounters a sudden increase; this suggests that the sample experiences macrocracking with a relatively large magnitude (Moradian et al., 2016; Zhao et al., 2013). After 259 s (near the onset of sample failure), the AE activity index begins to increase, and the rising slope of accumulation dramatically increases to infinity. 2) At a σ2 of 30 MPa, there are three typical stages in the AE activity index and the accumulative AE activity index, including the low activity (slow growth at a line slope) at initial loading (stage Ⅰ), the increasing activity (accelerated growth at an exponential slope) at middle loading (stage Ⅱ) and the dramatically increasing activity (continuously sudden growth approaching an infinite slope) at late loading (stage Ⅲ), similar to the σ2 of 1 MPa. However, the AE activity index at a σ2 of 30 MPa is significantly intensified, as indicated by the accelerated growth stage appearing earlier (a decrease in stress level from 43.5% to 37.4%).
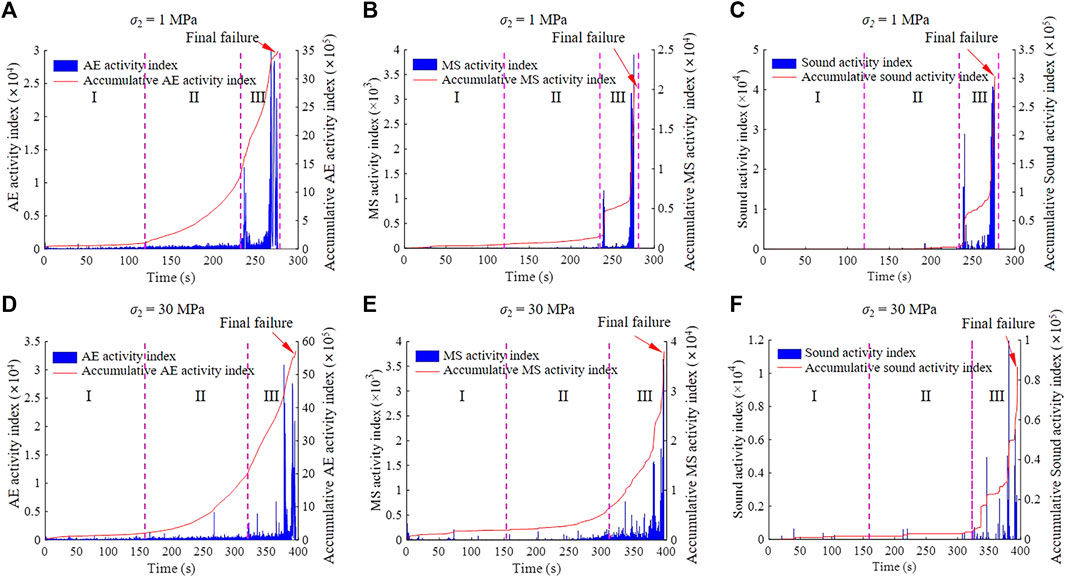
FIGURE 6. Evolutionary processes of (A,D) AE, (B,E) MS, and (C,F) sound activity index under granite subjected to biaxial compression tests with different σ2. I represents the initial loading stage, II represents the middle loading stage, and III represents the late loading stage. The end of stage III is at the peak stress.
Figures 6B, E show the evolutionary processes of MS activity index under granite subjected to biaxial compression tests with different σ2 values (e.g., 1 MPa and 30 MPa): 1) When σ2 is 1 MPa, between 0 and 182 s (before the middle and later loading), the MS activity index mainly presents low activity, and the accumulation increases slowly and steadily. After 182 s, the MS activity index is significantly motivated, and the rising slope in the accumulation obviously increases from linear growth to exponential growth. At 236 s, there is a remarkably sudden phenomenon in the MS activity index, the maximum reaching a high level of 1.171 × 10³, and the accumulation suddenly increases from 1.714 × 10³ to 4.628 × 10³, indicating the existence of a macrocracking phenomenon with relatively large scales in the sample; subsequently, the activity suggests a continuous growth tendency. After 268 s (before the sample fails), the MS activity index dramatically increases, and the curve slope of the accumulation tends to be vertical (the infinite slope). 2) When σ2 is 30 MPa, the key characteristics at σ2 of 1 MPa can also be observed, involving low activity (slow growth at a line slope) at initial loading (stage Ⅰ), increasing activity (accelerated growth at an exponential slope) at middle and late loading (stage Ⅱ) and dramatically increasing (continuously sudden growth approaching an infinite slope) activity at late loading (stage Ⅲ). However, compared with a σ2 of 1 MPa, the occurrence of the accelerated growth stage advances (the stress level decreases from 66.0% to 61.1%).
Figures 6C, F illustrate the evolutionary processes of sound activity index under granite subjected to biaxial compression tests with different σ2 values (e.g., 1 MPa and 30 MPa): 1) At a σ2 of 1 MPa, from 0 to 236 s (before late loading), the sound activity index is extremely low, and the accumulation is close to zero. Near 236 s, the sound activity index is obviously enhanced, and the rise slope in the accumulation remarkedly increases from linear to exponential; at 236 s, an exceedingly high value of 1.5598 × 10⁴ occurs in the sound activity index, and the accumulation increases from 0.0842 × 10⁴ to 0.5380 × 10⁴, indicating the occurrence of macrocracking with a relatively large size inside the sample; then, the activity of both shows an accelerated increasing trend. Near the onset of sample failure, at 271 s, the sound activity index dramatically increases, and the slope of the rise in the accumulation increases to vertical (the infinite slope). 2) At a σ2 of 30 MPa, it can be observed that the evolution of the sound activity index experiences three typical stages, including extremely low activity (a zero level or slow growth at a line slope) at initial and middle loading (stages Ⅰ and Ⅱ), increasing activity (accelerated growth at an exponential slope) at earlier–late loading (the earlier of stage Ⅲ) and dramatically increasing activity (continuously sudden growth approaching an infinite slope) at late–late loading (the late of stage Ⅲ), similar to the σ2 of 1 MPa. However, the difference between both also highlights that the occurrence of the accelerated growth stage is earlier, corresponding to the stress level decreasing from 85.5% to 81.8%.
In summary, these signal activeness reaches an accelerated growth (a growth change from linear to exponential), indicating that the damage inside hard rocks continuously increases when the final failure will occur, which is referred to as a precursor before the rock fails. Additionally, the difference in the period when accelerated growth occurs can be clearly identified (see Figure 7), that is, AE < MS < sound in order of stress level from low to high. This phenomenon arises from differences in the frequency ranges, propagation and capture routes and acquisition modes among three types of acoustic signals, which can be evidenced by the following: AE signals, characterized by high frequency, propagation and capture in rock, as well as acquisition motivated by hit parameters; MS signals, characterized by low frequency, propagation and capture in rock, and utilizing waveform flow-based acquisition; sound signals, characterized by low frequency, propagation in rock and air and capture in air, and also employing waveform flow-based acquisition (Cai et al., 2007; Su et al., 2023; Zhao G et al., 2022). Furthermore, with the increase in the intermediate principal stress σ2, the initial stress of activeness in each of the signals decreases, as shown in Table 2.
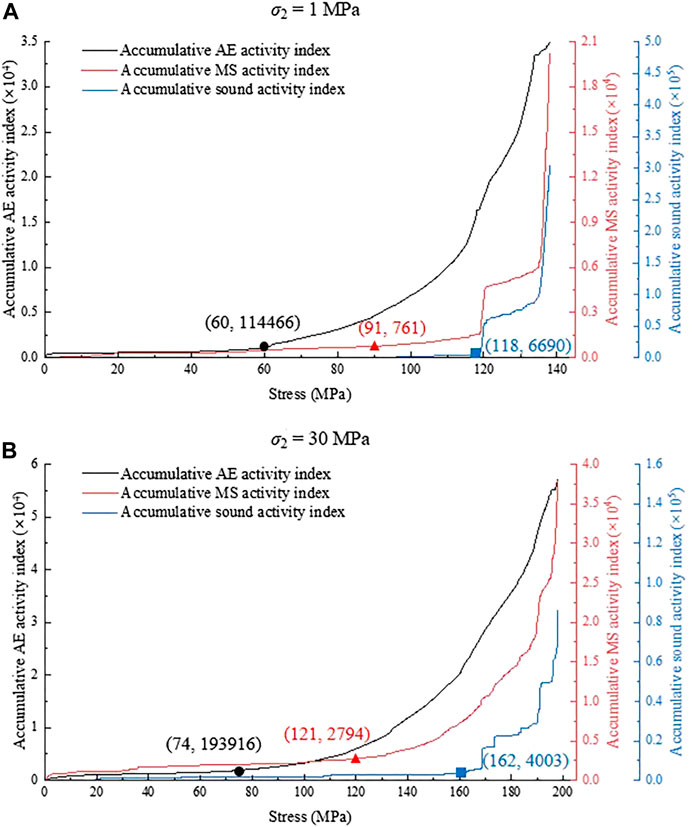
FIGURE 7. Evolution of accumulative AE, MS and sound activity index: (A) 1 MPa and (B) 30 MPa. The initial stresses of the signal activeness are marked as a black circle (AE), red triangle (MS) and blue rectangle (sound).
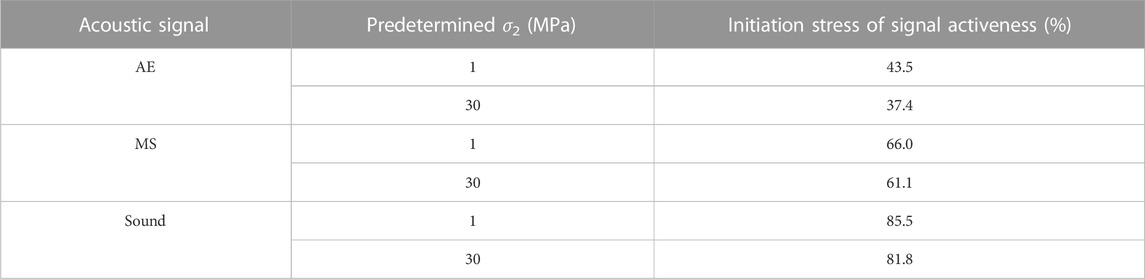
TABLE 2. Activeness of the acoustic signals produced by granite subjected to biaxial compression under different σ2.
The b values of three types of acoustic signals can be calculated by the G-R correlation (Gutenberg and Richter, 1944):
where m denotes the magnitude of seismic events and N denotes the number of seismic events whose magnitude varies within ∆m.
The evolutionary processes of the AE b value by Eq. 1 under granite subjected to biaxial compression tests with different σ2 values (e.g., 1 MPa and 30 MPa) are shown in Figure 8: 1) When σ2 is 1 MPa, from 0 to 68 s, the AE b value slightly increases to a maximum of 2.4 and then considerably decreases to 1.1, caused by the crack closure effect of the rock sample within a short duration and the accelerated crack development at the initial loading. From 68 to 164 s, the AE b value slightly fluctuates between 1.0 and 1.3. After 164 s, the AE b value continuously decreases, indicating the accelerated development of cracks (size and number) inside the sample. At 276 s, the sample completely fails, and the AE b value decreases to a minimum of 0.207. 2) When σ2 is 30 MPa, the characteristics of the AE b value at σ2 of 1 MPa, such as considerable fluctuation, slight fluctuation and continuous decrease, can be accordingly observed. However, the decrease rate of the AE b value considerably declines from 0.0096 s−1 to 0.0055 s−1.
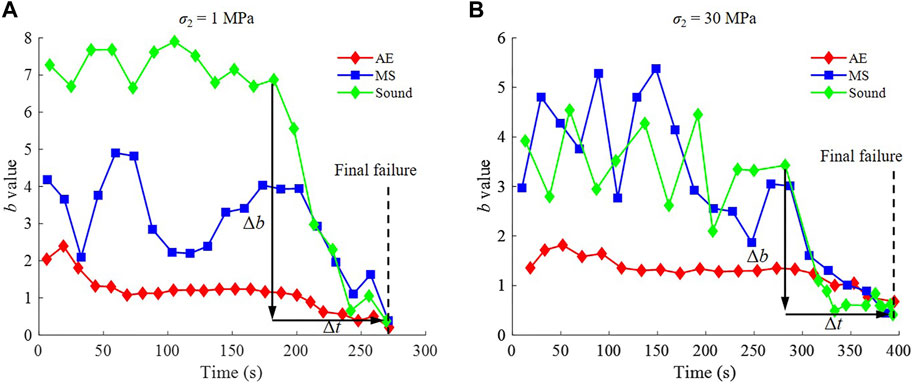
FIGURE 8. Evolutionary processes of b value of AE, MS and sound signals under granite subjected to biaxial compression tests with different σ2, i.e., (A) 1 MPa and (B) 30 MPa.
The evolutionary processes of the MS b value by Eq. 1 under granite subjected to biaxial compression tests with different σ2 values (e.g., 1 MPa and 30 MPa) are illustrated in Figure 8: 1) At a σ2 of 1 MPa, between 0 and 173 s, the MS b value presents an obvious fluctuation stage, which may originate from unstable noise (see Figure 5B). After 173 s, the MS b value continuously decreases, associated with the dramatic activeness of crack behaviours (size and number) in the sample. At 276 s, the sample is destroyed, and the MS b value decreases to a minimum of 0.388. 2) At a σ2 of 30 MPa, there are similar characteristics with respect to the σ2 of 1 MPa, including an obvious fluctuation and a continuous decrease. There is, however, a marked decline in the decrease rate of the MS b value from 0.0374 s−1 to 0.0219 s−1.
The evolutionary processes of the sound b value by Eq. 1 under granite subjected to biaxial compression tests with different σ2 values (e.g., 1 MPa and 30 MPa) are presented in Figure 8: 1) At a σ2 of 1 MPa, from 0 to 182 s, the sound b value maintains a slight fluctuation between 6.5 and 7.8. After 182 s, the sound b value encounters a continuous decreasing trend, revealing the intensive transition of crack behaviour (size and number) of the sample. At 276 s, the sample cannot resist any loads and completely fails, and the sound b value decreases to a minimum of 0.367. 2) At a σ2 of 30 MPa, the varying rules, involving a slight fluctuation and a continuous decrease, are similar to the σ2 of 1 MPa. Compared with the σ2 of 1 MPa, however, the decrease rate of the sound b value obviously declines from 0.0599 s−1 to 0.0217 s−1.
In conclusion, the b values of AE, MS and sound appear to continuously decrease before granite fails, which can be regarded as beneficial information prior to rock failure. Moreover, the difference in the continuous decrease in the b value of the three signals can be highlighted by the fact that the period (equal to the stress level) and rate of decrease from low to high both follow AE < MS < sound. Furthermore, as intermediate principal stresses increase, there are changing rules in the evolutionary characteristics of the signal b value (see Table 3): 1) the continuous descent rate of the b value decreases; 2) the minimum b value increases.
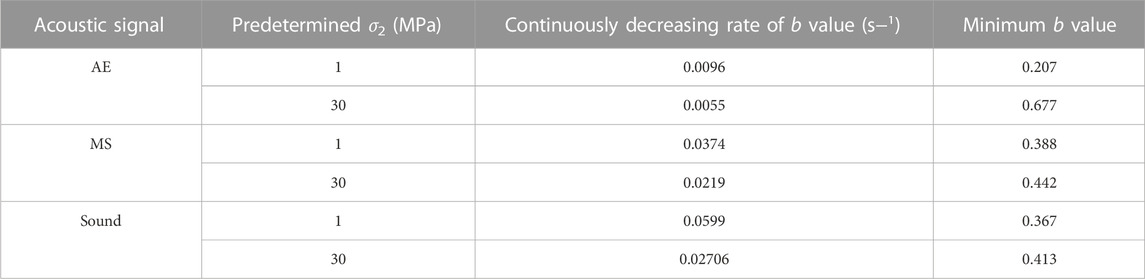
TABLE 3. b value of the acoustic signals produced by granite subjected to biaxial compression under different σ2.
Compared with the time-domain analysis of acoustic signals (e.g., the activeness and b value), the frequency-domain analysis can greatly describe the frequency components of acoustic signals with respect to an abundance of cracks with multiple scales under the failure processes of hard rocks. The fast Fourier transform (FFT), a typical and advantageous method to analyse the frequency components of nonstationary signals, was introduced into the extraction of the main frequency of acoustic signals (Frigo and Johnson, 1998).
Figures 9A, B present the evolutionary processes of the AE main frequency under granite subjected to biaxial compression tests with different σ2 values (e.g., 1 MPa and 30 MPa), in which the size and colour represent the amplitude of AE signals (the higher the amplitude is, the larger the size and the redder the colour): 1) At a σ2 of 1 MPa, the AE main frequency shows the distribution evolution of three types of dominant frequency bands, including a low-frequency range of 40–50 kHz, a middle-frequency range of 140–160 kHz and a high-frequency range of 270–300 kHz. From 0 to 180 s, the number/size and colour of AE signals gradually increase and change from blue to red in the three frequency bands, respectively, but the signal amplitude is characterized by a low level below 80 dB. After 180 s, dramatic activities, the occurrence of AE signals with high amplitudes (the red signals) mainly distributed in 140–160 kHz and less distributed in 40–50 kHz, occur in the main frequency of AE signals; subsequently, the activities are continuously enhanced, and the redder the colour, the greater the number. This phenomenon indicates that a number of cracks with relatively large scales inside the sample occur, and the crack development changes from stable to unstable. After 268 s, there are a few AE signals with extremely high amplitudes (deep red coloured) in two frequency ranges of 140–160 kHz and 40–50 kHz within a short duration, namely, the ‘quiescent period’ (lasting 7 s). (2) At a σ2 of 30 MPa, the distribution and evolution of AE signals in the main frequency, involving the three types of typical frequency bands (40–50 kHz, 140–160 kHz and 270–300 kHz), the increasing activities (the greater the number, the larger the size and the redder the colour) and the ‘quiescent period’ composed of the small signals with exceedingly high amplitude, is similar to the σ2 of 1 MPa. However, the number of low-frequency and high-amplitude signals significantly increases from 47 to 224, and the duration of the “quiescent period” decreases from 7 to 5 s.
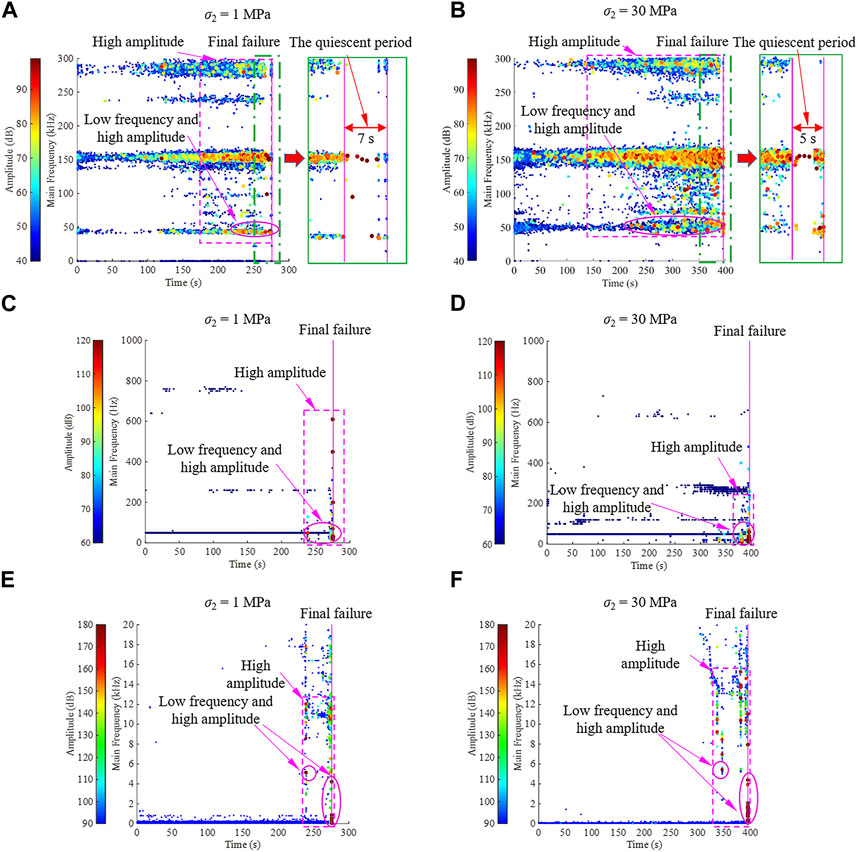
FIGURE 9. Evolutionary processes of the main frequency of (A,B) AE, (C,D) MS, and (E,F) sound signals under granite subjected to biaxial compression tests with different σ2.
Figures 9C, D show the evolutionary processes of the MS main frequency under granite subjected to biaxial compression tests with different σ2 values (e.g., 1 MPa and 30 MPa): 1) When σ2 is 1 MPa, from 0 to 236 s, MS signals are mainly coloured blue, corresponding to low amplitude below 70 dB, and are characterized by a cluster distribution of 45–55 Hz and scatter distributions of 200–300 Hz and 700–800 Hz. At 236 s, MS signals are distributed in the frequency range below 200 Hz in the form of a bar shape; in particular, an MS signal with high amplitude (red coloured) and low frequency (50 Hz) occurs, indicating the occurrence of macroscopic cracking inside the sample. Near the eve of the sample failure, there is a bar distribution composed of MS signals with relatively high amplitude (light blue, green, yellow and red coloured); when 276 s, the sample completely fails, and a sea of extremely high-amplitude and low-frequency MS signals appears. 2) When σ2 is 30 MPa, there are obvious phenomena similar to the σ2 of 1 MPa, such as the increasing activities of MS signals and the occurrence of the low-frequency and high-amplitude signals near the eve of the sample failure. However, the number of MS signals with low frequency and high amplitude significantly increases from 12 to 23.
Figures 9E, F illustrate the evolutionary processes of the sound main frequency under granite subjected to biaxial compression tests with different σ2 values (e.g., 1 MPa and 30 MPa): 1) At a σ2 of 1 MPa, from 0 to 236 s, sound signals with extremely low amplitude (deep blue coloured) are mainly distributed in the frequency range below 2 kHz. At 236 s, there are a few high-amplitude signals that are red coloured (involving a high-amplitude signal with a low frequency of 4.95 kHz), correlating with the appearance of macroscopic cracking with a large scale in the sample; after 236 s, the frequency distribution of sound signals expands to the full frequency band from 20 Hz to 20 kHz. Before the sample fails, the number of sound signals distributed in the full frequency band obviously increases, and the colour changes from blue to green, yellow and red (large amplitude). When 276 s, the sample is destroyed, and the onset of extremely low-frequency and high-amplitude signals occurs in the sound main frequency. 2) At a σ2 of 30 MPa, a notable onset at a σ2 of 1 MPa, the low-frequency and high-amplitude signals, can be clearly recognized. Nevertheless, sound signals with low frequency and high amplitude encounter a significant increase from 20 to 33.
Therefore, AE, MS and sound signals exist in the onset of the signals with low frequency and high amplitude before granite failure. The evolutionary characteristics in the main frequency of acoustic signals present significant differences. The differences can be highlighted by the fact that the AE signals have advantages over the MS and sound signals in the duration of characterization (the entire loading stage in AE signals and the late loading stage in MS and sound signals), and a typical phenomenon characterized by a few signals with extremely high amplitude, the “quiescent period,” only occurs in AE (induced by the acquisition principle of the AE system based on the hit parameters), which may depress the AE evaluation capacity (Zhai et al., 2020). In addition, with the increase in the intermediate principal stress σ2, the evolutionary characteristics in the signal main frequency present varying rules (see Table 4): 1) the proportion of signal with low frequency and high amplitude increases; 2) the duration of the ‘quiescent period’ in AE signals decreases from 7 to 5 s.

TABLE 4. Main frequency of the acoustic signals produced by granite subjected to biaxial compression under different σ2.
The subsignals in different frequency ranges are superior to the signals in the overall frequency range in the aspect of the characterization of crack development with multiple scales in hard rocks; that is, they can accurately reflect the variety of small, relatively large and large-scale cracks at the same time. This study incorporates the wavelet transform to analyse the proportion evolution of the advantage frequency bands in three acoustic signals (Wickerhauser, 1994). The proportion of the advantage frequency bands can be calculated as follows:
(1) Decompose the three types of signals based on the wavelet transform, as shown in Figure 10. A1, A2, A3, … , An are the low-frequency subsignals of the first, second, third, … , nth layer of the wavelet decomposition, respectively; D1, D2, D3, …, Dn are the high-frequency subsignals, respectively. In this study, the wavelet base and wavelet decomposition layer were set as db3 and five, respectively, and then subsignals of six different frequency bands can be obtained as follows: in AE signals, A5 (0–15.625 kHz), D5 (15.625–31.25 kHz), D4 (31.25–62.5 kHz), D3 (62.5–125 kHz), D2 (125–250 kHz), and D1 (250–500 kHz); in MS signals, A5 (0–62.5 Hz), D5 (62.5–125 Hz), D4 (125–250 Hz), D3 (250–500 Hz), D2 (500–1,000 Hz), and D1 (1,000–2,000 Hz); in sound signals, A5 (0–0.68905 kHz), D5 (0.68905–1.3781 kHz), D4 (1.3781–2.7563 kHz), D3 (2.7563–5.5125 kHz), D2 (5.5125–11.025 kHz), and D1 (11.025–22.05 kHz).
(2) Determine the proportion of the advantage frequency bands based on the subsignal decomposition: 1) the energies of the subsignals Ei (i = 1, 2, … , 6) were calculated by squaring and integrating the voltage within the duration time. 2) the energy distribution coefficients of different frequency bands Ki (i = 1, 2, … , 6) were obtained using
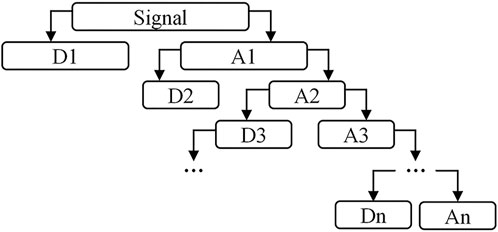
FIGURE 10. Schematic of the decomposition of signals using wavelet transform.
The evolutionary processes of the proportion of the advantage frequency bands of AE signals under granite subjected to biaxial compression tests with different σ2 values (e.g., 1 MPa and 30 MPa) are shown in Figures 11A, D, in which the proportion of the AE advantage frequency bands is dominated by the middle-frequency band ranging from 125 to 250 kHz during the entire loading process: (1) When σ2 is 1 MPa, from 0 to 122.5 s, the AE proportion between 125 and 250 kHz decreases. From 122.5 to 257.5 s, the AE proportion between 125 and 250 kHz presents a slight fluctuation. After 257.5 s (near the eve of the sample failure), a continuous and dramatic increase in the proportion occurs in the range between 125 and 250 kHz, revealing the occurrence of accelerated development of crack behaviours inside the sample. 2) When σ2 is 30 MPa, the typical development of the AE proportion at σ2 of 1 MPa, the continuous and dramatic increase in the AE proportion in the band ranging from 125 to 250 kHz before the sample fails, can be clearly identified. However, the period is earlier compared with the σ2 of 1 MPa, a decrease in stress level from 93.3% to 89.0%.
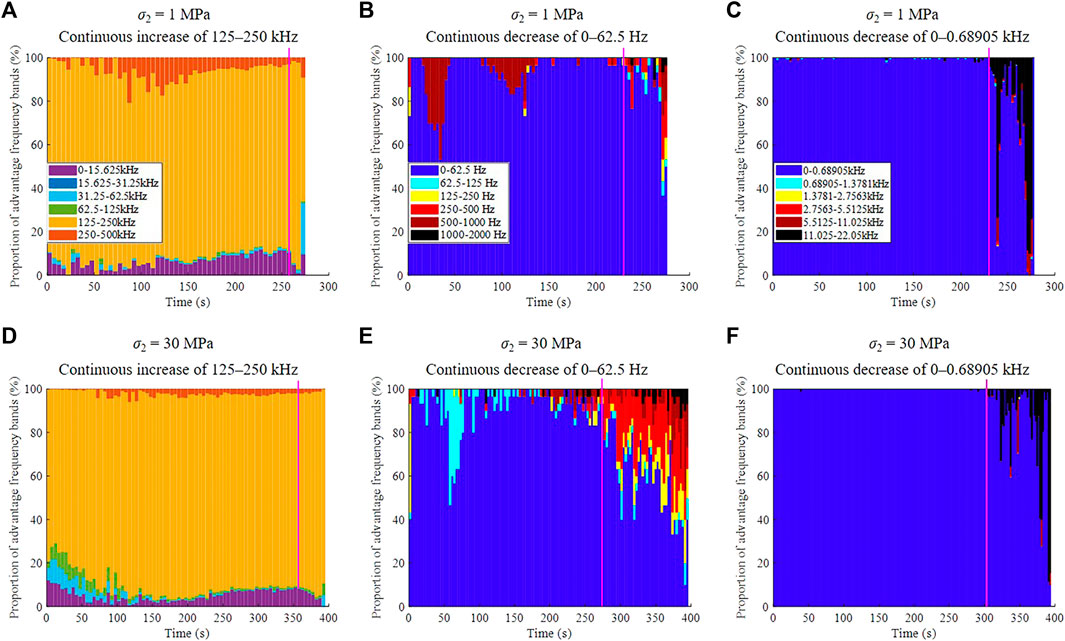
FIGURE 11. Evolutionary processes of the proportion of the advantage frequency bands of (A,D) AE, (B,E) MS and (C,F) sound signals under granite subjected to biaxial compression tests with different σ2.
The evolutionary processes of the proportion of the advantage frequency bands of MS signals under granite subjected to biaxial compression tests with different σ2 values (e.g., 1 MPa and 30 MPa) are shown in Figures 11B, E, in which the lowest frequency band ranging from 0 to 62.5 Hz controls the proportion evolution of the advantage frequency bands of MS signals: 1) At a σ2 of 1 MPa, from 0 to 230 s, the MS proportion is mainly composed of the lowest (0–62.5 Hz) and high (500–1,000 Hz) frequency bands, but there is no significant trend variation in the proportion evolution. After 230 s, the proportion of the lowest frequency band is almost close to 100% and then encounters a continuous decrease, and the accumulative proportion of other frequency bands, such as 62.5–125 Hz, 125–250 Hz, 250–500 Hz, 500–1,000 Hz and 1,000–2,000 Hz, presents an increasing trend. Near the eve of the sample failure, the proportion of the lowest frequency band in MS signals decreases to a low level smaller than 50%. These significant characteristics confirm the accelerated development of cracks in size and number in the sample. 2) At a σ2 of 30 MPa, the significant trend variation, the proportion of the lowest frequency band ranging from 0 to 62.5 Hz, does exist, similar to the σ2 of 1 MPa. Nevertheless, this variation in the lowest-band proportion is obviously enhanced, and the period when this variation occurs advances (a descent in stress level from 83.0% to 69.3%).
The evolutionary processes of the proportion of the advantage frequency bands of sound signals under granite subjected to biaxial compression tests with different σ2 values (e.g., 1 MPa and 30 MPa) are shown in Figures 11C, F, where the lowest frequency band from 0 to 0.68905 kHz is dominant in the proportion evolution: 1) When σ2 is 1 MPa, between 0 and 231 s, the proportion in the lowest frequency band is almost 100%. After 231 s, the lowest-band proportion presents a continuous decreasing trend, and the 11.025–22.05 kHz-dominated proportion increase appears. Before the sample fails, the lowest-band proportion decreases to an extremely low level, approximately 2%. These phenomena proved the accelerated development of multiscale crack activities in the sample. 2) When σ2 is 30 MPa, a similar characteristic, the continuous decrease in the lowest-band proportion before sample failure, can also be observed. However, the stress level when this characteristic occurs decreases from 83.7% to 77.0%, compared to the σ2 of 1 MPa.
In summary, there are significant trend variations in the proportion evolution of the advantage frequency bands of three signals before granite fails, i.e., the continuous increase in the middle band proportion of AE signals (125–250 kHz), and the continuous decrease in the lowest band proportion of MS (0–62.5 Hz) and sound (0-0.68905 kHz) signals. Moreover, the variation difference between the three types of signals can be essentially viewed, such as the different advantage frequency bands between AE signals (the middle band) and MS and sound signals (the lowest band), the varying trend between AE signals (increase) and MS and sound signals (decrease), and the variation in other multifrequency bands between MS signals (all of the others-dominated) and sound signals (two band-dominated, 5.5125–11.025 kHz and 11.025–22.05 kHz). Furthermore, with the increase in the intermediate principal stress σ2, the period when the dominant band proportion of the three signals significantly changes advances, as shown in Table 5.
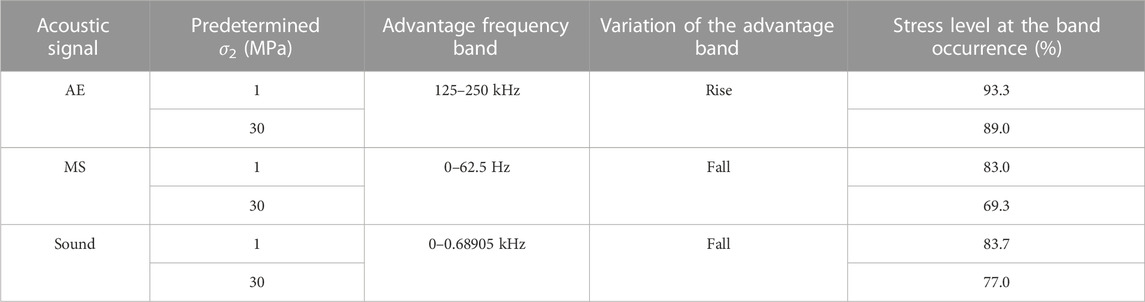
TABLE 5. Proportion of advantage frequency bands of the acoustic signals produced by granite subjected to biaxial compression under different σ2.
Based on the experimental results, it can be concluded that in terms of the activeness, b value, main frequency and proportion of advantage frequency bands, AE, MS and sound signals exist in obvious phenomena preceding the failure of granite subjected to biaxial compression, and the similar phenomena in the three types of signals are summarized in Table 6. However, there are significant differences (see Table 7) in the precursors between AE, MS and sound signals caused by the distinctive nature of acoustic signals (e.g., frequency ranges, acquisition modes and sampling rates) (Su et al., 2021; Su et al., 2023; Zhao G et al., 2022).
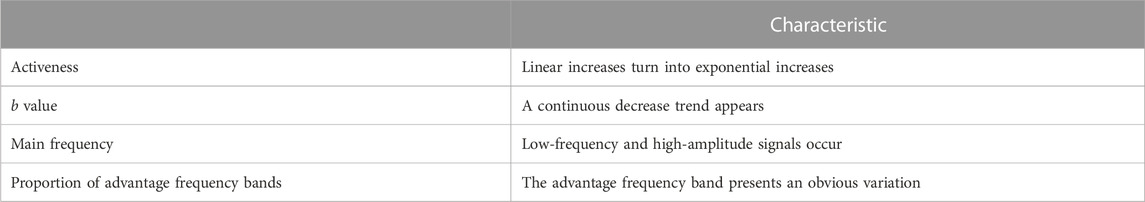
TABLE 6. The similar characteristics of the three types of signals in the failure process of granite under biaxial compression test.
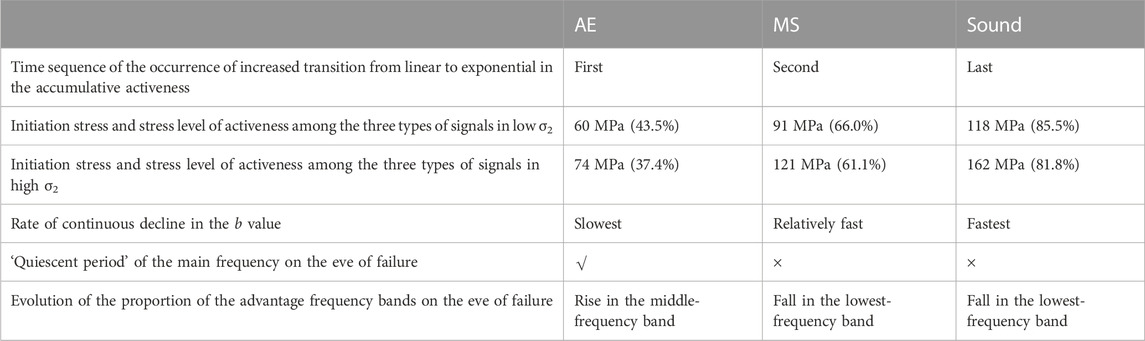
TABLE 7. The different characteristics of the three types of signals in the failure processes of granite under biaxial compression tests with different σ2.
In conclusion, these differences in the precursors of AE, MS and sound signals produced by granite under biaxial compression give us deep insight into the failure process of hard rocks in both cracking scales and time sequences. The intergrade usage of the precursors of three types of signals can contribute to the improvement of prediction and warning of the failure and instability of hard rocks near excavation boundaries, a biaxial compression state.
The experimental results demonstrate that the intermediate principal stress σ2 strongly affects the precursors of acoustic signals produced by granite under biaxial compression, as shown in Figure 12. The changing rules in the signal precursors driven by intermediate principal stress σ2 originate from the mechanism transformation of hard rock cracking under biaxial compression (see Figure 4):
(1) At a low σ2, the slight constraint condition favours the development of microcracks dispersedly distributed inside the rock in initiation loading, but this microcracking at low levels can only motivate the generation of stress waveforms with low energy and high frequency (Hao et al., 2022); thus, the cracking sources are captured by AE signals with a high-frequency response, and the AE signals have low activity (see Figures 6A, 7A). With increasing force, the microcracks grow in both number and size, driving AE signals to dramatically activate; a few of the microcracks at high levels expand to macrocracks parallel to the direction of the maximum principle stress σ1, tensile cracks, and stress waveforms with high energy accompanying macrocrack generation can be gradually obtained by MS and sound signals (see Figures 6B, C, 7A). When macrocracks further grow, MS signals reach a strongly active period, and then sound signals encounter an extremely active period. Before the failure, the increasing force controls macrocracks to develop in both number and size, especially those near the free faces; the corresponding signal activeness is strongly enhanced. Finally, two bars of tension-dominated macroscopic fracture zones parallel to σ1 occur in the boundaries of the free faces, namely, spalling, and the macrocracks inside the rocks further develop into tensile macroscopic cracks parallel to σ1 and a few shear macroscopic cracks with regard to an angle with σ1, which may induce small fragments on the local location of the free faces; the rock under slight constraint conditions cannot resist any force and immediately fails (see Figure 4B). Consequently, the activeness of the three types of signals steadily activates overall and presents a significant time sequence (see Figure 7A).
(2) At a high σ2, microcrack initiation is depressed by the considerable constraint condition, and there are very small cracks inside the rock, while this considerable constraint drives the generation of cracks with more scales and high energy with increasing force (Hao et al., 2022), which can advance the dramatic activeness of AE signals (see Figures 6D, 7B). With the increase in the force, the crack behaviour mainly focuses on the development of existing cracks in size, rather than that of new cracks in number, and the macrocracks parallel to σ1 are dominantly produced in the local areas; however, the considerable input of external energy imposed by the force contributes to the increase in the crack scales (the production of stress waveforms with more high energy). These phenomena suggest that the activeness of MS and sound signals can be gradually advanced (see Figures 6E, F, 7B); as the force increases, MS signals first arrive at the dramatic active period, and the activeness in sound signals subsequently changes to an active stage. Before the failure, the crack activities are strongly motivated to develop in both size and number, especially the accelerated generation of shear cracks with regards to an angle with σ1 (induced by shear-motivated dilatancy on a true-triaxial stress state characterized by the high constraint condition and the σ3 of nonzero level); the incomplete development of the rock cracks in the overall number (a relatively moderate dissipation) cause the insufficient release of elastic strain energy stored in the rock (potential risk areas with extremely high energy near the free faces); and the corresponding signals activeness is strongly enhanced. Eventually, the shear macroscopic fracture zones occur, and the local rocks near the free faces are damaged into the ejection phenomenon composed of a plank rock and a number of fragmental rocks driven by the strong tension and shear fractures, namely, rockburst; this intensive phenomenon induces the dramatic activeness of signals. Hence, the dramatic activeness of the three types of signals is motivated earlier.
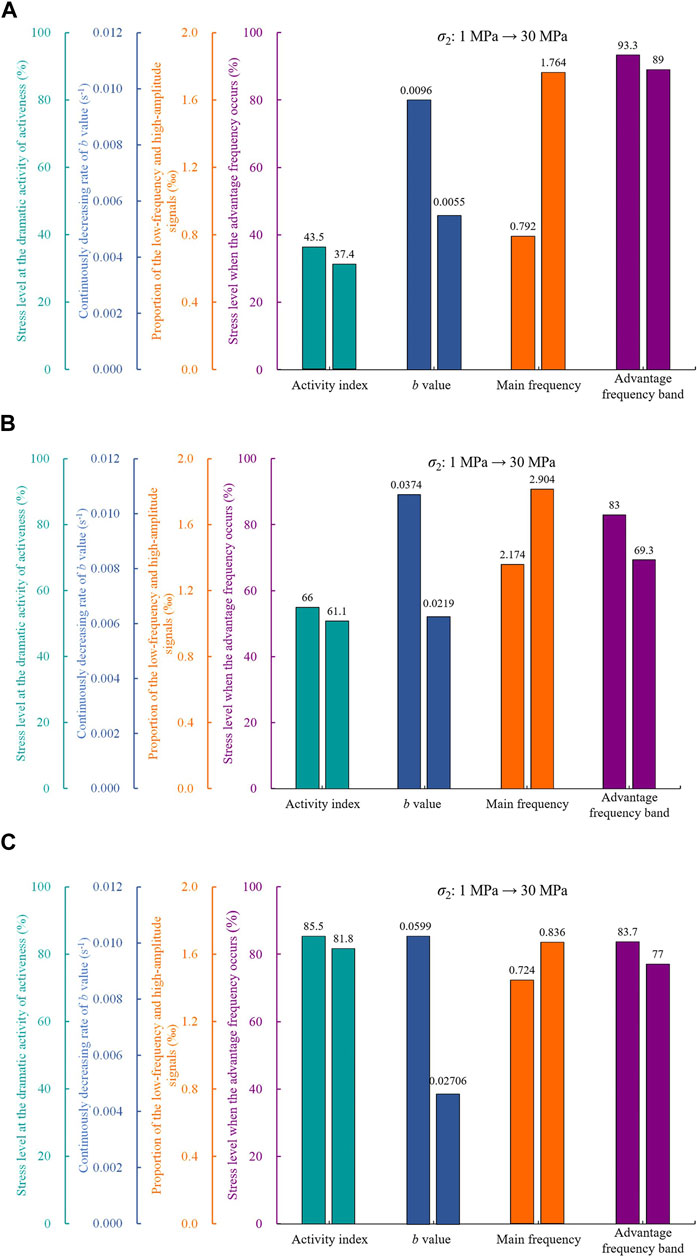
FIGURE 12. Statistical results of the influence of intermediate principal stress on the precursors of acoustic signals under granite subjected to biaxial compression tests with different σ2: (A) AE, (B) MS and (C) sound.
In addition, the significant difference in cracking mechanism and failure mode between low and high σ2 can be clearly recognized by the AE-based AF–RA method classifying the crack modes (shear or tension), as shown in Figure 13, in which the tensile cracks dominate in the loading process before the failure, and the percentage of tensile cracks under high σ2 is slightly larger than that under low σ2, similar to previous studies (Cai, 2008; Du et al., 2015; Du et al., 2021). On the eve of the failure, the percentage of shear cracks of high σ2 is significantly larger than that of low σ2 (when failure is 68% under high σ2 and 25% under low σ2), which may be controlled by the shear-motived dilatancy of a true-triaxial stress state at the middle rock plate, and there is spalling at high σ2 and rockburst at low σ2 (see Figure 4B).
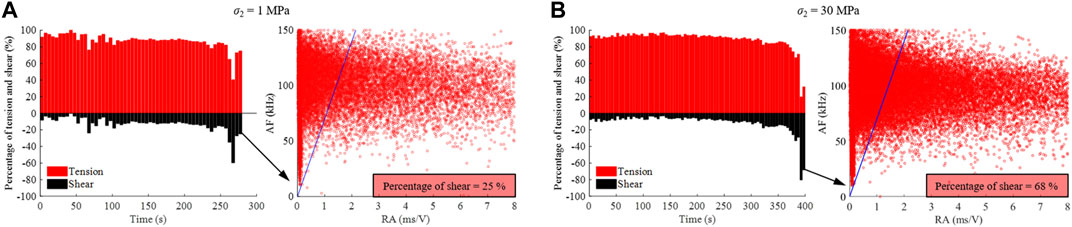
FIGURE 13. Evolutionary processes of the tension–shear percentage classified by the AF-RA method of AE signals under granite subjected to biaxial compression tests with different σ2: (A) 1 MPa and (B) 30 MPa. The crack modes are classified by k = 70 (Equation k = AF/RA), in which the signals below and above k represent tension and shear cracks, respectively.
Therefore, as the intermediate principal stress σ2 increases, the failure process and mode of granite under biaxial compression show an essential transition, and the corresponding signal characteristics (e.g., the signal activeness, b value, main frequency and proportion of the advantage frequency bands) also occur in acoustic responses, partly proven by the characteristic variation of AE signals generated by hard rock cracking under the intermediate principal stress (Chang et al., 2022; Du et al., 2015; Du et al., 2021; Hao et al., 2022). Moreover, this study summarizes the failure process and signal characteristics of granite subjected to biaxial compression under different σ2 values (see Figure 14), and the integrated use of three types of signals in the failure and damage of rock masses near excavation boundaries can contribute to improving the prediction and warning of engineering hazards, i.e., spalling driven by a low σ2 and rockburst driven by a high σ2.
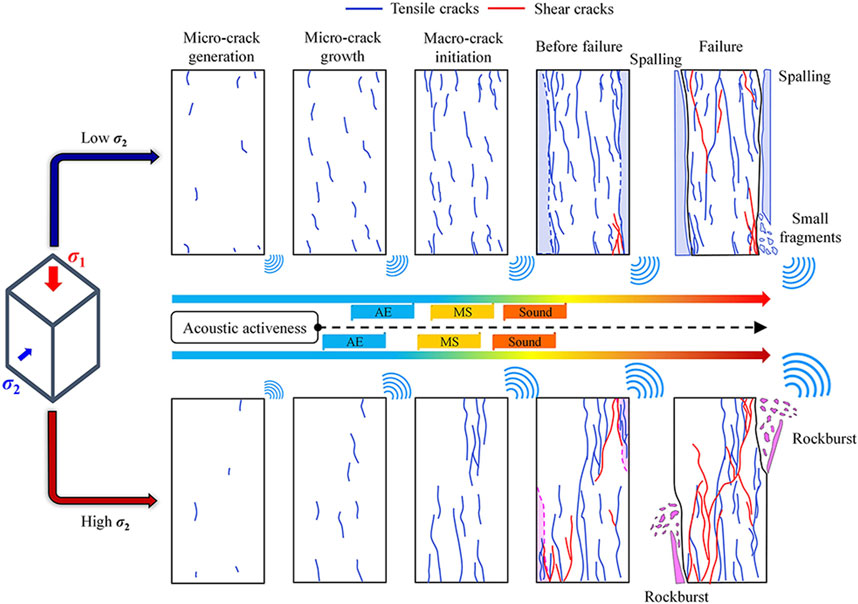
FIGURE 14. Schematic diagram of the failure process and signal characteristics of granite subjected to biaxial compression under different σ2.
To improve the prediction and early warning of failure and instability of rock masses near excavation boundaries (a stress state of biaxial compression), this study performs research on the evolutionary characteristics of multifrequency acoustic signals (AE, MS and sound signals) produced by granite under biaxial compression with different intermediate principal stresses (1 MPa and 30 MPa) in terms of time (the activeness and the b value) and frequency (the main frequency and the proportion of the advantage frequency bands) domains. The main contributions can be summarized as follows:
(1) Three signals exist in the different initial stresses of signal activeness under the biaxial compression of granite because of differences in the frequency ranges and propagation properties of these acoustic signals. Based on the shift in the cumulative signal activeness from a linear increase to an exponential increase, the initial stresses of signal activeness under low and high intermediate principal stresses be accurately identified and arranged in order from low to high: AE (37.4% and 43.5% of σpeak) < MS (61.1% and 66% of σpeak) < sound (81.8% and 85.5% of σpeak).
(2) There are notable distinctions in the signal precursors before the failure of granite subjected to biaxial compression. Near the onset of granite failure, the time sequence when the signal activeness reaches an exponential increase is represented by AE < MS < sound; the continuous decrease rate of b value shows an obvious order: AE < MS < sound; a few of signals with extremely high amplitude, the “quiescent period,” only occur in the AE main frequency; the mid-frequency band (125–250 kHz) of AE signals increases, but the lowest-frequency (MS: 0–62.5 Hz, sound: 0–0.68905 kHz) bands of MS and sound signal decrease in the proportion of the advantage frequency bands.
(3) Intermediate principal stress strongly affects the precursors of signals during the failure process of biaxial compression of granite. As the intermediate principal stress increases, the period when the signal activeness arrives at an exponential increase advances, the continuous descent rate in the b value of signals decreases, the proportion of the signals with low frequency and high amplitude increases, and the stress level at the occurrence of significant variation in the proportion of the advantage frequency bands presents a decreasing trend.
In summary, the combined application of AE, MS and sound signals can better capture the multiscale precursors of granite subjected to biaxial compression with different intermediate principal stresses, thus helping to achieve a more accurate prediction and warning of engineering geological disasters under deep underground engineering, i.e., spalling and rockburst. Nevertheless, the conclusions obtained in this paper are based on the data of acoustic signals produced by medium–coarse crystalline granite samples under biaxial compression at 1 MPa and 30 MPa, and future investigations will focus on the evolution of acoustic signals of other hard rocks under biaxial compression with a series of intermediate principal stresses; moreover, the gap in signal characteristics composed of the small-scale cracking of samples in the lab and the large-scale cracking of rock masses in situ will also be given considerable attention.
The raw data supporting the conclusion of this article will be made available by the authors, without undue reservation.
YL: Methodology, Investigation, Writing–original draft, Funding acquisition. PL: Methodology, Conceptualization, Funding acquisition, Writing–review and editing. WC: Data curation, Investigation, Software, Validation, Writing–original draft.
The author(s) declare financial support was received for the research, authorship, and/or publication of this article. This research received financial support provided by the financial support from the Innovation Project of Guangxi Graduate Education (Grant No. YCBZ2022020).
Author WC was employed by China Energy Engineering Group Guangxi Electric Power Design Institute Co., Ltd.
The remaining authors declare that the research was conducted in the absence of any commercial or financial relationships that could be construed as a potential conflict of interest.
The reviewer ZZ declared a shared affiliation with the authors PL, WC to the handling editor at time of review.
All claims expressed in this article are solely those of the authors and do not necessarily represent those of their affiliated organizations, or those of the publisher, the editors and the reviewers. Any product that may be evaluated in this article, or claim that may be made by its manufacturer, is not guaranteed or endorsed by the publisher.
Aggelis, D. G. (2011). Classification of cracking mode in concrete by acoustic emission parameters. Mech. Res. Commun. 38, 153–157. doi:10.1016/j.mechrescom.2011.03.007
Blake, W., Leighton, F., and Duvall, W. I. (1974). Microseismic techniques for monitoring the behaviour of rock structures. Int. J. Rock Mech. Min. Sci. 12, 69. doi:10.1016/0148-9062(75)90157-6
Cai, M. (2008). Influence of intermediate principal stress on rock fracturing and strength near excavation boundaries—insight from numerical modeling. Int. J. Rock Mech. Min. Sci. 45, 763–772. doi:10.1016/j.ijrmms.2007.07.026
Cai, M., Kaiser, P. K., Morioka, H., Minami, M., Maejima, T., Tasaka, Y., et al. (2007). Flac/pfc coupled numerical simulation of ae in large-scale underground excavations. Int. J. Rock Mech. Min. Sci. 44, 550–564. doi:10.1016/j.ijrmms.2006.09.013
Chang, X., Zhang, X., Dang, F., Zhang, B., and Chang, F. (2022). Failure behavior of sandstone specimens containing a single flaw under true triaxial compression. Rock Mech. Rock Eng. 55, 2111–2127. doi:10.1007/s00603-021-02761-z
Chen, K., Zhou, W., Pan, Y., Zhuo, Y., and Zheng, G. (2023). Characterization of true triaxial rock bursts in sandstones with different water contents. Front. Earth Sci. 10. doi:10.3389/feart.2022.1087849
Chen, Q., Liu, Y., Wang, W., Ou, X., Zhou, Y., Teng, Z., et al. (2022). Effects of normal stress and joint inclination angle on rock failure characteristics under compression–shear conditions. Front. Earth Sci. 10. doi:10.3389/feart.2022.950648
Colombo, S., Main, I. G., and Forde, M. C. (2003). Assessing damage of reinforced concrete beam using "b-value" analysis of acoustic emission signals. J. Mat. Civ. Eng. 15, 280–286. doi:10.1061/(asce)0899-1561(2003)15:3(280)
Cui, L., Liu, Y., Sheng, Q., and Xiao, P. (2021). Experimental study on mechanical properties and cracking behaviors of t-shaped flaw-contained rock-like materials under cyclic loading. Front. Earth Sci. 9. doi:10.3389/feart.2021.768077
Dong, L. J., Yang, L. B., and Chen, Y. C. (2022). Acoustic emission location accuracy and spatial evolution characteristics of granite fracture in complex stress conditions. Rock Mech. Rock Eng. 56, 1113–1130. doi:10.1007/s00603-022-03124-y
Du, K., Li, X. B., Li, D. Y., and Weng, L. (2015). Failure properties of rocks in true triaxial unloading compressive test. Trans. Nonferrous Mater. Soc. China. 25, 571–581. doi:10.1016/S1003-6326(15)63639-1
Du, K., Liu, M. H., Yang, C. Z., Tao, M., Feng, F. K., and Wang, S. F. (2021). Mechanical and acoustic emission (ae) characteristics of rocks under biaxial confinements. Appl. Sci. 11, 769. doi:10.3390/app11020769
Feng, X. T., Haimson, B., Li, X. C., Chang, C. D., Ma, X. D., Zhang, X. W., et al. (2019). Isrm suggested method: determining deformation and failure characteristics of rocks subjected to true triaxial compression. Rock Mech. Rock Eng. 52, 2011–2020. doi:10.1007/s00603-019-01782-z
Feng, X. T., Xu, H., Qiu, S. L., Li, S. J., Yang, C. X., Guo, H. S., et al. (2018). In situ observation of rock spalling in the deep tunnels of the China jinping underground laboratory (2400 m depth). Rock Mech. Rock Eng. 51, 1193–1213. doi:10.1007/s00603-017-1387-8
Frigo, M., and Johnson, S. G. (1998). “Fftw: an adaptive software architecture for the fft,” in Proceedings of the 1998 IEEE International Conference on Acoustics, Speech and Signal Processing, ICASSP '98, 15-15 May 1998, Seattle, WA, USA.
Goodman, R. E. (1963). Subaudible noise during compression of rocks. Geol. Soc. Am. Bull. 4, 487–490. doi:10.1130/0016-7606(1963)74[487:SNDCOR]2.0.CO;2
Gutenberg, B., and Richter, C. F. (1944). Frequency of earthquakes in California. Bull. Seismol. Soc. Amer. 34, 185–188. doi:10.1785/BSSA0340040185
Hao, J. W., Zhang, Y. B., Qiao, L., Den, N. F., Li, Q. W., and Zhan, Q. L. (2022). Study on gradual fracture of rock and key precursor information before peak stress based on ae monitoring under true triaxial loading. J. Mat. Civ. Eng. 34. doi:10.1061/(ASCE)MT.1943-5533.0004029
Hloupis, G., Stavrakas, I., Vallianatos, F., and Triantis, D. (2016). A preliminary study for prefailure indicators in acoustic emissions using wavelets and natural time analysis. Proc. Institution Mech. Eng. Part L J. Mater. Des. Appl. 230, 780–788. doi:10.1177/1464420715575337
Kiyoo, M. (1967). Effect of the intermediate principal stress on rock failure. J. Geophys. Res. 72, 5117–5131. doi:10.1029/JZ072i020p05117
Kourkoulis, S. K., Pasiou, E. D., Triantis, D., Stavrakas, I., and Hloupis, G. (2015). Innovative experimental techniques in the service of restoration of stone monuments - part i: the experimental set up. Procedia Eng. 109, 268–275. doi:10.1016/j.proeng.2015.06.232
Lei, W. J., Li, J. Y., and Yun, M. H. (2019). Research on propagation and attenuation characteristics of mining micro-seismic wave. Rock Soil Mech. 40, 1491–1497. doi:10.16285/j.rsm.2017.2424
Lei, X., and Ma, S. (2014). Laboratory acoustic emission study for earthquake generation process. Earthq. Sci. 27, 627–646. doi:10.1007/s11589-014-0103-y
Li, P. F., Su, G. S., Xu, H. J., and He, B. G. (2023). Quantitative detection of damage processes in granite by sound signals. Int. J. Rock Mech. Min. Sci. 164, 105356. doi:10.1016/j.ijrmms.2023.105356
Liu, Y., Lu, C. P., Xiao, Z. Y., and Guo, Y. (2022). Mechanisms underlying the slip and failure of coal-rock parting-coal structures under unloading conditions. Rock Mech. Rock Eng. 55, 4913–4928. doi:10.1007/s00603-022-02919-3
Moradian, Z., Einstein, H. H., and Ballivy, G. (2016). Detection of cracking levels in brittle rocks by parametric analysis of the acoustic emission signals. Rock Mech. Rock Eng. 49, 785–800. doi:10.1007/s00603-015-0775-1
Ohno, K., and Ohtsu, M. (2010). Crack classification in concrete based on acoustic emission. Constr. Build. Mat. 24, 2339–2346. doi:10.1016/j.conbuildmat.2010.05.004
Ohtsu, M., Uchida, M., Okamoto, T., and Yuyama, S. (2002). Damage assessment of reinforced concrete beams qualified by acoustic emission. ACI Struct. J. 99, 411–417. doi:10.14359/12109
Russenes, B. F. (1974). Analysis of rock spalling for tunnels in steep valley sides. Ma Thesis. Norway: Dept. of Geology, University of Trondheim. Retrieved from Available from.
Seo, K. J., Kim, G. Y., Baik, M. H., and Cho, G. C. (2019). A new approach for quantitative damage assessment of in situ rock mass by acoustic emission. Geomech. Eng. 18, 11–20. doi:10.12989/gae.2019.18.1.011
Shiotani, T. (2006). Evaluation of long-term stability for rock slope by means of acoustic emission technique. NDT E Int. 39, 217–228. doi:10.1016/j.ndteint.2005.07.005
Srinivasan, C., Arora, S. K., and Yaji, R. K. (1997). Use of mining and seismological parameters as premonitors of rockbursts. Int. J. Rock Mech. Min. Sci. 34, 1001–1008. doi:10.1016/S1365-1609(97)80009-3
Su, G., Chen, X., Sun, G., Chen, B., and Zhao, G. (2023). Experimental study on the evolutionary characteristics of acoustic signals produced by granite damage under uniaxial compression. Int. J. Damage Mech. 32, 715–745. doi:10.1177/10567895231158147
Su, G. S., Gan, W., Zhai, S. B., and Zhao, G. F. (2020). Acoustic emission precursors of static and dynamic instability for coarse-grained hard rock. J. Cent. South Univ. 27, 2883–2898. doi:10.1007/s11771-020-4516-6
Su, G. S., Huang, J. H., Xu, H. J., and Qin, Y. Z. (2022). Extracting acoustic emission features that precede hard rock instability with unsupervised learning. Eng. Geol. 306, 106761. doi:10.1016/j.enggeo.2022.106761
Su, G. S., Jiang, J. Q., Zhai, S. B., and Zhang, G. L. (2017). Influence of tunnel axis stress on strainburst: an experimental study. Rock Mech. Rock Eng. 50, 1551–1567. doi:10.1007/s00603-017-1181-7
Su, G. S., Zhao, G. F., Jiang, J. Q., and Hu, X. C. (2021). Experimental study on the characteristics of microseismic signals generated during granite rockburst events. Bull. Eng. Geol. Environ. 80, 6023–6045. doi:10.1007/s10064-021-02295-2
Sun, F., Guo, J., Fan, J., and Liu, X. (2022). Experimental study on rockburst fragment characteristic of granite under different loading rates in true triaxial condition. Front. Earth Sci. 10. doi:10.3389/feart.2022.995143
Sun, Y., Li, B., Dong, L., Mao, H., Xu, N., Zhu, Z., et al. (2021). Microseismic moment tensor based analysis of rock mass failure mechanism surrounding an underground powerhouse. Geomatics, Nat. hazards risk 12, 1315–1342. doi:10.1080/19475705.2021.1918266
Tan, Y. A. (1992). A new classification of rockburst intensity. Geol. Rev. 1992, 439–443. doi:10.16509/j.georeview.1992.05.007
Triantis, D., Pasiou, E. D., Stavrakas, I., and Kourkoulis, S. K. (2022). Hidden affinities between electric and acoustic activities in brittle materials at near-fracture load levels. Rock Mech. Rock Eng. 55, 1325–1342. doi:10.1007/s00603-021-02711-9
Triantis, D., Stavrakas, I., Loukidis, A., Pasiou, E. D., and Kourkoulis, S. K. (2023). Spatio-temporal distribution of the sources of acoustic events in notched fiber-reinforced concrete beams under three-point bending. Materials 16, 5118. doi:10.3390/ma16145118
Wang, Q., Qiu, S., Cheng, Y., Li, P., Kou, Y., and Zhang, S. (2021). Influence of the seismic wave velocity of the damage zone on near-field ground motions. Front. Earth Sci. 9. doi:10.3389/feart.2021.803522
Wang, Q. S., Chen, J. X., Guo, J. Q., Luo, Y. B., Li, Y., Wang, H. Y., et al. (2020). Strain rate effect on acoustic emission characteristics and energy mechanisms of karst limestone under uniaxial compression. Adv. Mat. Sci. Eng. 2020, 1–13. doi:10.1155/2020/6871902
Wang, X. R., Wang, E. Y., Liu, X. F., and Zhou, X. (2021). Failure mechanism of fractured rock and associated acoustic behaviors under different loading rates. Eng. Fract. Mech. 247, 107674. doi:10.1016/j.engfracmech.2021.107674
Xia, Z., Mao, J., and He, Y. (2022). Rockburst intensity prediction in underground buildings based on improved spectral clustering algorithm. Front. Earth Sci. 10. doi:10.3389/feart.2022.948626
Zhai, S., Su, G., Yin, S., Zhao, B., and Yan, L. (2020). Rockburst characteristics of several hard brittle rocks: a true triaxial experimental study. J. Rock Mech. Geotech. Eng. 12, 279–296. doi:10.1016/j.jrmge.2019.07.013
Zhang, H., Chen, Q., Wang, X., Zhao, K., and Zeng, Q. (2022). Acoustic emission parameter characterization of damage process of the limestone with different rockburst tendencies. Minerals 12, 1423. doi:10.3390/min12111423
Zhang, Y., Ma, J., Sun, D., Zhang, L., and Chen, Y. (2020). Ae characteristics of rockburst tendency for granite influenced by water under uniaxial loading. Front. Earth Sci. 8. doi:10.3389/feart.2020.00055
Zhao, J. S., Jiang, Q., Lu, J. F., Chen, B. R., Pei, S. F., and Wang, Z. L. (2022). Rock fracturing observation based on microseismic monitoring and borehole imaging: in situ investigation in a large underground cavern under high geostress. Tunn. Undergr. Space Technol. 126, 104549. doi:10.1016/j.tust.2022.104549
Zhao, J. S., Jiang, Q., Pei, S. F., Chen, B. R., Xu, D. P., and Bo, S. L. (2023). Microseismicity and focal mechanism of blasting-induced block falling of intersecting chamber of large underground cavern under high geostress. J. Central South Univ. 30, 542–554. doi:10.1007/s11771-023-5259-y
Zhao, X. G., Cai, M., Wang, J., and Ma, L. K. (2013). Damage stress and acoustic emission characteristics of the beishan granite. Int. J. Rock Mech. Min. Sci. 64, 258–269. doi:10.1016/j.ijrmms.2013.09.003
Zhao G, G., Luo, D., Su, G., Chen, B., and Huang, J. (2022). Experimental research on the evolutionary characteristics of acoustic signals for concrete cracking under uniaxial compression. Appl. Acoust. 191, 108671. doi:10.1016/j.apacoust.2022.108671
Zheng, Z., Li, R., and Zhang, Q. (2023a). A novel anisotropic deterioration mechanical model for rock ductile–brittle failure under 3d high-stress and its application. Comput. Geotech. 162, 105665. doi:10.1016/j.compgeo.2023.105665
Keywords: hard rocks, biaxial compression, intermediate principal stress, acoustic emission, microseismic, sound
Citation: Lu Y, Li P and Cai W (2023) Experimental study on the evolutionary characteristics of acoustic signals produced by granite under biaxial compression with different intermediate principal stresses. Front. Earth Sci. 11:1271355. doi: 10.3389/feart.2023.1271355
Received: 02 August 2023; Accepted: 16 October 2023;
Published: 02 November 2023.
Edited by:
Biao Li, Concordia University, CanadaReviewed by:
Zhi Zheng, Guangxi University, ChinaCopyright © 2023 Lu, Li and Cai. This is an open-access article distributed under the terms of the Creative Commons Attribution License (CC BY). The use, distribution or reproduction in other forums is permitted, provided the original author(s) and the copyright owner(s) are credited and that the original publication in this journal is cited, in accordance with accepted academic practice. No use, distribution or reproduction is permitted which does not comply with these terms.
*Correspondence: Peifeng Li, MjAxMDQwMjAwMkBzdC5neHUuZWR1LmNu
Disclaimer: All claims expressed in this article are solely those of the authors and do not necessarily represent those of their affiliated organizations, or those of the publisher, the editors and the reviewers. Any product that may be evaluated in this article or claim that may be made by its manufacturer is not guaranteed or endorsed by the publisher.
Research integrity at Frontiers
Learn more about the work of our research integrity team to safeguard the quality of each article we publish.