 Shuangshuang Zhang
 Kangliang Guo
95% of researchers rate our articles as excellent or good
Learn more about the work of our research integrity team to safeguard the quality of each article we publish.
Find out more
ORIGINAL RESEARCH article
Front. Earth Sci. , 26 October 2023
Sec. Economic Geology
Volume 11 - 2023 | https://doi.org/10.3389/feart.2023.1270662
This article is part of the Research Topic Advances in Geo-Resources and Geo-Energy Extraction and Exploitation: Theories, Technologies, and Numerical Simulation View all 10 articles
Perforation technology is often used to improve the productivity of horizontal wells in oilfield exploitation. During the perforation process, the formation seepage mode and productivity will change accordingly whether the contaminated zone is shot through. If we continue to use the previous productivity formula, it will cause a large calculation error and bring economic loss to the development of oil and gas fields. Firstly, based on the principle of equivalent seepage resistance, the reservoir-hole inflow profile in these two cases is analyzed in detail, and the reservoir-hole seepage model is constructed in different regions. The perforated horizontal well section is divided into N micro-unit sections, and the pressure drop model in the wellbore is constructed using the fluid mechanics theory. A new perforated horizontal well productivity prediction model is then created by coupling the reservoir-hole seepage model with the pressure drop model in the wellbore as a whole to accurately reflect the production performance of the perforated horizontal well. Through comparison and verification, it is concluded that the calculation results of the model are more precise, which can greatly reduce the productivity error. This method is reasonable and practical. When the oilfield’s actual well data is substituted into this model, it is discussed and analyzed that the reservoir’s physical characteristics, contamination level, and perforation completion parameters all have an impact on the productivity of horizontal wells, with the original formation’s permeability and reservoir contamination thickness having the most pronounced effects. These findings may effectively direct the design of technological processes and performance impact prediction.
During the production of oil and gas wells, the pollution caused by drilling and completion of the formation around the wellbore will lead to a decrease in the permeability of the formation fluid, which will lead to a decrease in formation pressure and reduce the productivity of perforated wells (Hawkins, 1956). The formation of the formation pollution zone around the wellbore is mainly due to the penetration and diffusion of pollutants (Patel and Singh, 2016). The chemical agents and additives used in the drilling and completion process may penetrate the formation and cause formation pollution. During perforation operation, the formation around the well may be impacted and vibrated, resulting in formation fracture and fracture propagation, which in turn causes pollutants to penetrate the formation. In the process of oil and gas exploitation, the strata around the wellbore may be affected by pressure changes and fluid migration, resulting in the diffusion of oil and gas and other pollutants into the surrounding strata. The characteristics of the formation pollution zone are mainly manifested in the changes in formation physical properties and formation fluid (Burton and Hodge, 1998; Patel and Singh, 2016). The formation pollution zone may lead to a change in formation permeability, which reduces the permeability of the formation. The formation pollution zone may cause the pollution of the formation pore water, which makes the chemical composition of the formation pore water change, such as the change of pH value and the change of ion concentration. The formation of pollution zones may have adverse effects on oil and gas exploitation, such as reducing oil recovery and increasing mining costs.
To improve the production effect of horizontal wells, perforation completion technology is often used to improve its productivity. The perforation horizontal completion method has seen significant improvements throughout this time to increase the fluid channel’s smoothness between the production layer and the wellbore and lessen production layer damage (McDowell and Muskat, 1950; Xiaochen et al., 2023) used an electrolytic simulation model to study the effect of perforation parameters on productivity and concluded that if the perforation is long enough, the productivity of perforated wells may be higher than that of open-hole wells. [Harris (1966)] used the finite difference technique to analyze the influence of perforation parameters on productivity but did not consider the influence of the compaction zone. [Klotz et al. (1974)] used the finite element method to evaluate the perforation productivity with a compacted zone. (McLeod, 1983) gave the skin of the compaction zone and pollution zone and deduced the productivity formula of a perforated horizontal well. [Karakas and Tarlq (1991)] constructed a semi-analytical model that proposed the empirical equation of perforation skin and analyzed the influence of formation pollution and perforation on well productivity. [Marett et al. (1993)] established a parameter optimization model for perforated horizontal wells, which considered the interaction of comprehensive factors such as formation pollution, perforation compaction, and well deviation angle in detail, and achieved good optimization results.
In the productivity prediction model of perforated horizontal wells, to improve the development effect and ultimate recovery rate, scholars (Giger et al., 1984; Joshi, 1986) carried out a lot of research work and obtained the productivity prediction formula for perforated horizontal wells, as well as the distribution law of seepage field and pressure drop. Among them, the Joshi model is the most widely used. Aiming at the problem of uneven inflow profile in the horizontal wellbore (Sq, 1994), established a single-phase flow model for perforated horizontal wells, but the final production was reduced [Su and Gudmundsson, 1994; Ouyang (1998)]. Proposed that the pressure drop in the wellbore cannot be ignored, and the pressure drop in the perforated horizontal wellbore is divided into four parts: wall friction pressure drop, acceleration pressure drop, hole roughness pressure drop, and mixed pressure drop. According to the theory and experiment, the corresponding pressure distribution and flow distribution formulas of variable mass flow in horizontal wellbore are obtained (Tong et al., 2023). The coupling model established by (Holmes et al., 1998) in the case of wellbore friction pressure drop is also applicable to multiphase flow [Kabir and Sanchez (2009)]. Considered the coupling of reservoir and wellbore, established a three-dimensional coupling model, used Newton’s iterative algorithm to solve the numerical simulation, and gave the prediction of flow rate and flow pressure in horizontal wellbore. Aiming at the problem of large errors in productivity prediction (Luo et al., 2015), established a flow relationship model and analyzed the influence of near-well heterogeneity, wellbore flow pressure drops, and completion parameters on the inflow profile of horizontal wells [Wang et al. (2021)]. Transformed the three-dimensional seepage problem into a two-dimensional seepage problem and deduced the horizontal well productivity formula considering the fluid rheological properties and reservoir heterogeneity [Zhang et al. (2022)]. Used simulation software to simulate the multiphase flow pattern and pressure change of the wellbore after gas invasion [Wang et al. (202)]. Established a multiphase flow model of multi-component fluid in a wellbore and analyzed the variation of bottom hole pressure and temperature [Ma et al. (2022)]. Proposed a parameter optimization method for horizontal well sections to improve oil well productivity [Li and Wang (2022)]. Considered the horizontal well flow model of formation pollution and concluded that the smaller the pollution radius, the closer the horizontal well is to the external area, and the faster the oil production rate.
The application of perforating horizontal well completion technology is becoming increasingly widespread. Scholars have studied the productivity prediction and productivity influence law of perforating horizontal wells through a large number of experiments and methods. Different reservoir parameters and perforating parameters have different effects on the selection of perforating technology and the size of productivity release, but there are also some problems. For example, during the perforation process, in the case of not penetrating the pollution zone and penetrating the pollution zone, the formation seepage mode will change accordingly, and the productivity prediction results will also change. The current productivity approach will result in significant calculation errors and financial losses for the exploitation of oil and gas resources if we continue to utilize it. Therefore, it is urgent to study the inflow profile state and productivity prediction of perforated horizontal wells under these two different conditions.
The model proposed in this paper is a segmented calculation model for the productivity of perforated horizontal wells considering whether to penetrate the contaminated zone. It can accurately simulate the formation seepage law and predict productivity. This is a method that has not been involved in all previous models. Based on the equivalent seepage resistance method, the reservoir-hole inflow profile under the two conditions of whether to penetrate the contaminated zone is thoroughly examined, and the reservoir-hole seepage resistance model is constructed in different regions. This model is more accurate than the previous one and can significantly lower the calculation error for production capacity. The wellbore pressure drops model and the reservoir-hole seepage model are coupled, and a segmented numerical calculation is performed. According to the actual situation of the reservoir, the inflow profile along the horizontal wellbore can be adjusted to optimize the production performance of the entire horizontal well. The model comparison proves that the model in this paper is reasonable and practical, which can effectively guide the technical process design and effect prediction of perforated horizontal wells, and provide economic benefits for oilfield development.
Oilfield exploitation typically uses near-well stimulation techniques to increase oil well productivity, while perforation completion technology is utilized to increase the productivity of horizontal wells. The fluid flow pattern in the reservoir has changed as a result of perforation (Doan et al., 1990). Three different flow patterns have been observed during the process: reservoir radial flow, three-dimensional flow in the perforation area, and pipe flow in the horizontal wellbore. The fluid flows in these three parts are mutually boundary conditions and interact with each other. We suggest a new productivity calculation model that aims to accurately simulate the productivity dynamic law of perforated horizontal wells when penetrating and not penetrating the contaminated zone, and how to effectively evaluate the productivity of perforated horizontal wells. This chapter mainly describes the construction and verification of the model, and the whole flow chart is shown in Figure 1.
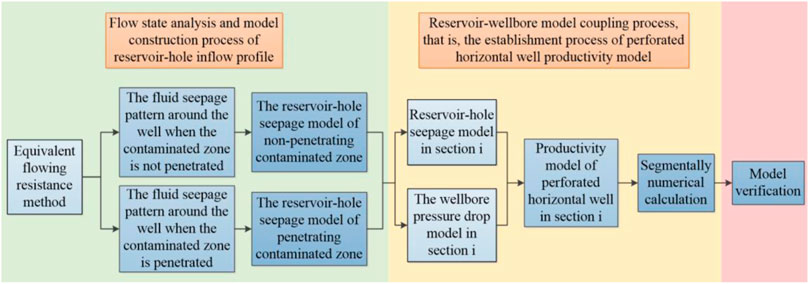
FIGURE 1. Flow chart of model construction.
Firstly, the geometric model of the perforated horizontal well is constructed as illustrated in Figure 2, with the reservoir, fluid, and perforation assuming the following characteristics:
(1) There is a perforated horizontal well parallel to the top and bottom of the oil layer sealed by horizontal, equal thickness, top and bottom impermeable interlayers. The thickness of the oil layer is h (m), and the length of the horizontal well section is L (m);
(2) There is a contamination area around the horizontal wellbore and a compaction area around the perforation;
(3) The fluid in the reservoir is a single-phase isothermal steady seepage flow, the fluid is incompressible, and the boundary pressure of the liquid supply is constant;
(4) The fluid in the horizontal wellbore is a single-phase isothermal flow, and there are frictional resistance pressure drops, acceleration pressure drops, and mixing pressure drops in the horizontal wellbore.
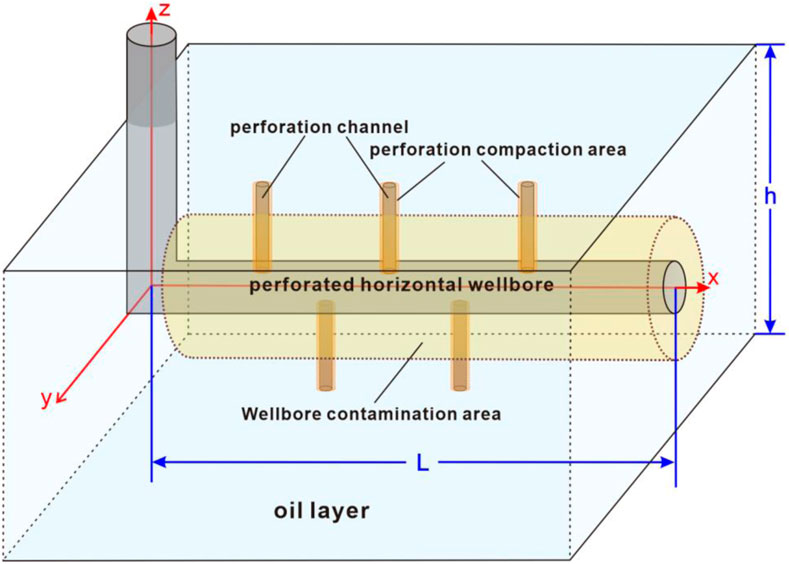
FIGURE 2. Geometric model of perforated horizontal well.
The fluid flow capacity in the real reservoir will be impacted by the permeability of the reservoir along the horizontal section, drilling and completion contamination, and perforation compaction, resulting in a fluctuation of the inflow profile along the horizontal section. The seepage pattern will also change differently when the contaminated zone is not penetrated and penetrated. At this point, the fluid flow pattern around the horizontal well section should be analyzed separately, and then based on the equivalent seepage resistance method (Zhang et al., 1998), the reservoir-hole seepage resistance calculation model is constructed in different regions.
(1) Non-penetrating the contaminated zone
The flow surrounding the wellbore in this model is separated into four areas when the perforation depth
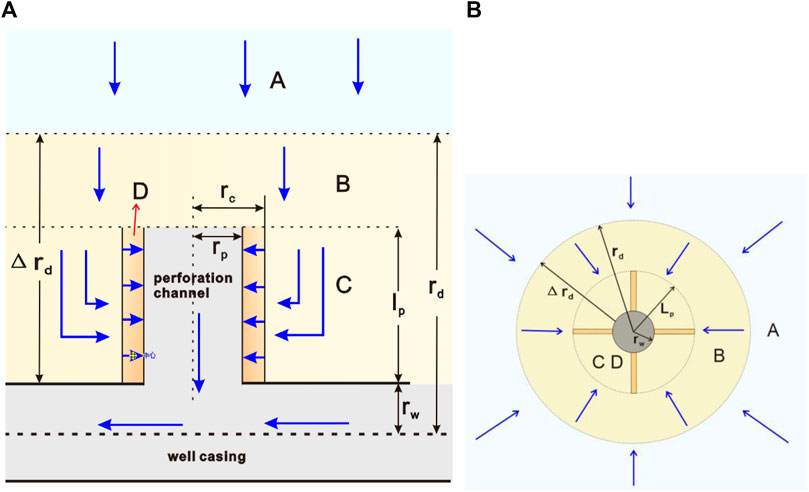
FIGURE 3. Three-radial flow model of non-penetrating contamination zone.
Area A is the original formation area, without formation contamination and perforation, and the fluid flow pattern is a plane radial flow around the horizontal wellbore. The outer boundary radius of the area is the drainage radius
Using the equivalent seepage resistance method (Zhang et al., 1998), the formula representing the relationship between seepage resistance, pressure difference, and productivity can be written as:
According to the productivity formula of ideal open-hole wells:
The seepage resistance of area A can be obtained (the productivity formula in this paper is based on the practical unit of SI mineral production):
There is formation contamination but no perforation in the B area, and the fluid flow pattern is a plane radial flow around the horizontal wellbore. The outer boundary radius of the area is the formation contamination radius
Area C has both formation contamination and perforation, and the fluid flow pattern is different from that of areas A and B. The fluid is a radial flow perpendicular to the perforation hole with the perforation hole as the central axis. The outer boundary is half
The D area is the perforation compaction area, and the fluid is also a radial flow perpendicular to the perforation hole with the perforation hole as the central axis. The outer boundary is the perforation compaction radius
The fluid flow is identical in the perforation areas C and D, which are connected by a series. According to the series formula of equivalent seepage resistance (Zhang et al., 1998):
The fluid seepage resistance around a single perforation hole can be obtained as follows:
(2) Penetrating the contaminated zone
The flow surrounding the wellbore in this model is separated into five areas when the perforation depth
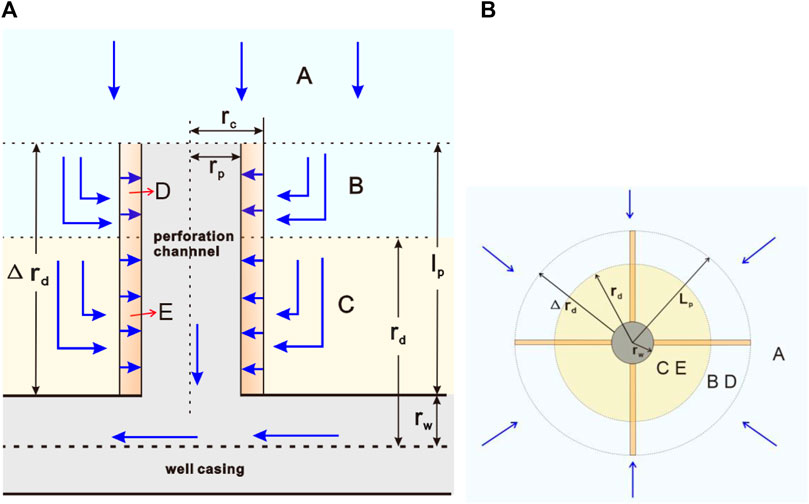
FIGURE 4. Three-radial flow model of penetrating contamination zone.
Area A is the original formation area, without formation contamination and perforation. The flow mode and parameters of area A are the same as those of area A without perforation. The only difference is that the inner boundary radius is the sum of the wellbore radius and perforation depth
There is no formation contamination but perforation in the B area, and the fluid is radial flow around the perforation hole. The outer boundary radius of this area is half
Area C has both formation contamination and perforation. The flow mode and internal and external boundary parameters are the same as those in area B. The difference is that the reservoir thickness is
The D area is the perforation compaction area, and the fluid is also the radial flow around the perforation hole. The outer boundary is the perforation compaction radius
The E area is the perforation compaction area. The flow mode and internal and external boundary parameters are the same as those in the D area. The difference is that the thickness of the oil layer is
The two regions of B and D are connected in series as a region without contamination and perforation, and the two regions of C and E are connected in series as a region with contamination and perforation. According to the series formula of equivalent seepage resistance (Zhang et al., 1998), the seepage resistance in these two large areas is:
However, there is a parallel relationship between these two large regions. According to the parallel formula of equivalent seepage resistance (Zhang et al., 1998), as follows:
The fluid seepage resistance around a single perforation hole can be obtained as follows:
Fluid constantly enters the wellbore from the reservoir during perforating horizontal well production, and the flow rate of this part affects the distribution of pressure drop in the horizontal wellbore. At the same time, the pressure drop in the horizontal wellbore in turn affects the flow into the wellbore (Landman et al., 1991). Therefore, it is necessary to combine the reservoir-hole seepage model in Section 2.1 with the influence of flow pressure drop in the wellbore to examine it as a whole to accurately reflect the production performance of perforated horizontal wells. As seen in Figure 5, the entire perforated horizontal wellbore has been divided into N wellbore unit segments.
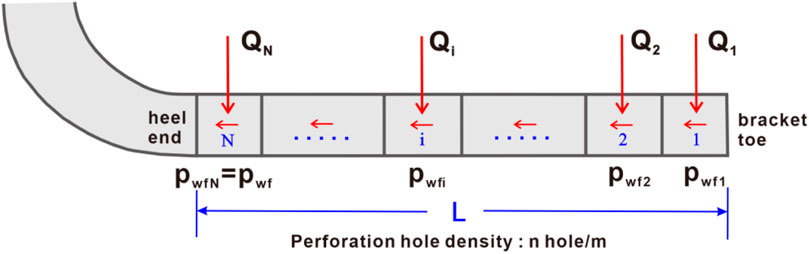
FIGURE 5. Sectional section of the horizontal wellbore.
Suppose: 1) The crude oil in the reservoir flows into the horizontal wellbore from the perforation hole, and the flow in the wellbore is turbulent flow; 2) The fluid is single-phase, incompressible, Newtonian viscous fluid; 3) And in the same wellbore section, the inflow of each perforation is the same, and the flow rate is perpendicular to the wall; 4) Ignore the volume force.
Assuming that the number of perforation holes on the ith infinitesimal segment is M, then:
According to the reservoir-hole seepage model in Section 2.1 of this paper, the seepage resistance in the whole reservoir area of Section ith can be obtained as follows:
(1) Non-penetrating the contaminated zone:
For the entire perforation area, the fluid flow between the hole and the hole is parallel. Combined with Formula 5, 12, the flow resistance of the ith perforation area is:
The seepage resistance in the whole reservoir area of the ith section is the sum of the seepage resistance of the perforated area and the unperforated area of the ith section. Combined with Formula 1ormula –Formula 4, 13, it is obtained that:
That is:
(2) Penetrating the contaminated zone:
Combined with the Formula 11, 12, the flow resistance of the ith perforation area is:
The seepage resistance in the whole reservoir area of the ith section is the sum of the seepage resistance of the perforated area and the unperforated area of the ith section. Combined with Formula 6 – 10, 15, it is obtained that:
That is:
Where:
The fluid in the reservoir flows into the wellbore through the hole after the casing perforation operation of the horizontal well section. The fluid flow in the horizontal wellbore is complicated by the fluid flow along the horizontal portion in addition to the fluid flow along the axial direction, resulting in a variable mass flow with an increasing flow rate along the flow direction (Su and Gudmundsson, 1994). According to the theory of fluid mechanics, the injection flow from the perforation hole has a certain influence on the main flow in the wellbore. The pressure drop of the wellbore pipe flow includes the friction loss of the pipe wall, the acceleration loss, and the mixing pressure loss (Ouyang, 1998). The flow pressure drop model in the wellbore can be expressed as:
According to the Formula 17, the calculation formula of the pressure drop of the pipe flow in the ith section can be obtained as follows:
Where:
Then the flow pressure of section ith of the perforated horizontal well is:
Due to the small length of each section, the flow parameters change little, and each micro-element section can be regarded as a homogeneous formation. According to the equivalent seepage resistance method, the production equation of the ith section of the horizontal well is obtained as follows:
In summary, the ith yield equation is:
(1) Non-penetrating the contaminated zone
(2) Penetrating the contaminated zone
Where:
When the oil well is produced, the pressure at the heel end of the horizontal wellbore is known, that is
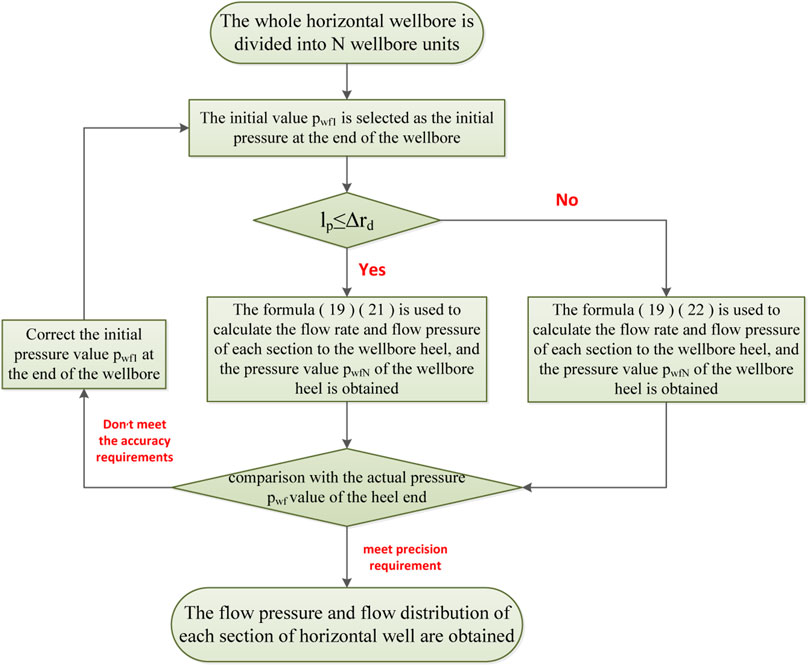
FIGURE 6. Block diagram of numerical calculation steps for productivity segmentation.
(1) The total length of the horizontal wellbore is
(2) Starting from the toe end of the horizontal wellbore, the initial value
(3) At this time, the main flow rate of the wellbore
(4) According to the seepage pressure-productivity Formula 21 or 22 of the reservoir on the wellbore unit section, the wellbore inflow
(5) Similarly, for the third to N wellbore unit segments, the calculation is carried out following the above steps, and the main flow rate
(6) The calculation is terminated and the oil well production is
Five horizontal wells in the J Oilfield are estimated as examples using the segmented calculation model of perforated horizontal well productivity described above. Table 1 displays the essential information.
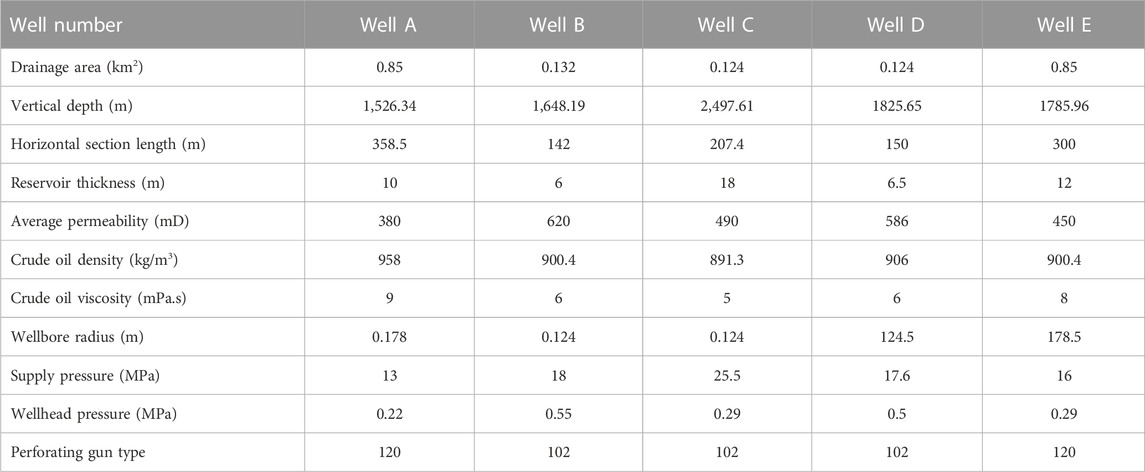
TABLE 1. Basic data of five horizontal wells in J oilfield.
The productivity calculation approach presented in this study may be used to display the horizontal wells’ wellbore inflow profile. Using well A as an example, Figure 7 illustrates the wellbore inflow profile of the perforated horizontal well. The figure truly reflects that the inflow profile along the horizontal wellbore is indeed uneven during horizontal well mining. The rate of wellbore injection increases gradually from the toe of the horizontal wellbore to its heel due to the influence of the flow pressure drop in the horizontal wellbore. The calculation results of this model and the Joshi model are compared with the actual production in the field, see Table 2.
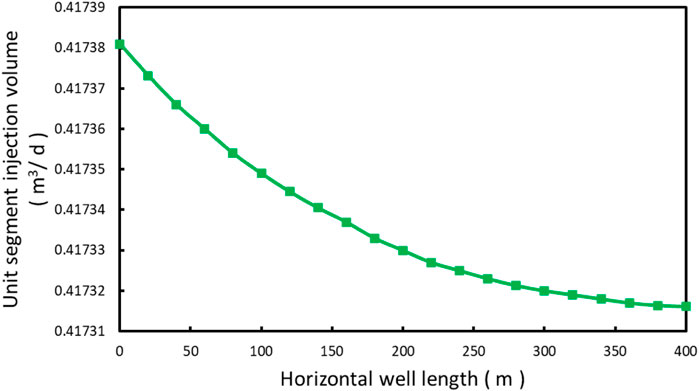
FIGURE 7. Inflow profile of the perforated horizontal well wall.
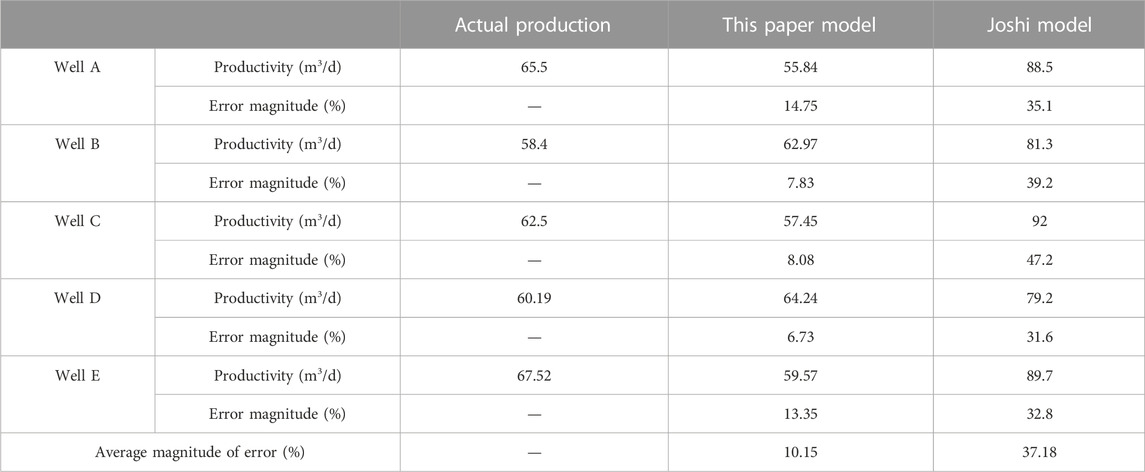
TABLE 2. Comparison of calculation results of horizontal well productivity.
The productivity formula of horizontal wells proposed by Joshi is widely used. Joshi believes that the flow of horizontal wells is composed of horizontal plane flows and vertical plane flows. The calculation formula does not consider various wellbore parameters and wellbore pressure drop, so the calculation results generally seriously overestimate the productivity of horizontal wells. It can be seen from Table 2 that the average error value of the productivity results predicted by the Joshi method is 37.18%, which is larger than the actual yield.
The calculation results of the productivity model of perforated horizontal wells built in this paper are close to the actual production of oil wells, and the average error is 10.15%, which indirectly indicates the rationality and practicability of the model in this paper. The reasons for the small error value are: 1) The two different inflow profile seepage modes of non-penetrating and penetrating contaminated zones are analyzed in detail for the establishment of reservoir-hole seepage models, and the model is generated in different regions, which significantly minimizes the productivity calculation error. 2) Considering the influence of horizontal wellbore pressure drop, through model coupling and segmented numerical computation, the findings of the final productivity calculation are very accurate and practicable.
Among them, the production calculation results of well A, well C, and well E are slightly lower than the actual results, because the horizontal section distance of these three wells is relatively long, and the pressure drop in the wellbore is also large, resulting in a decrease in the hole flow. The model proposed in this paper is used to predict the influence of wellbore pressure drop, so the final productivity result is slightly lower than the actual result. The average error of the three wells of well A, well C, and well E is −12.06%. The distance between the horizontal sections of Well B and Well D is relatively short, and there is a small wellbore pressure drop. However, it can be seen from the data in Table 1 that the average permeability of these two wells is slightly higher. When using the model in this paper, the results will be slightly higher than the actual results. The average error of production in Well B and Well D is +7.28%.
According to the above model, for a certain length of perforated horizontal wells, the reservoir’s physical characteristics (permeability), contamination status (contamination thickness, contamination degree), completion parameters (pore density, pore diameter, and pore depth) are the main factors affecting the flow pressure and flow distribution of each section of horizontal wells. H Well in J Oilfield is used as an example to examine the degree of influence that different factors have. The basic data of the well are shown in Table 3. The hole depth is 0.35 m when the contaminated zone is not penetrated, and the hole depth is 0.55 m when the contaminated zone is penetrated. The change curve of the productivity index of horizontal wells under the influence of different parameters is calculated (see Figure 8).
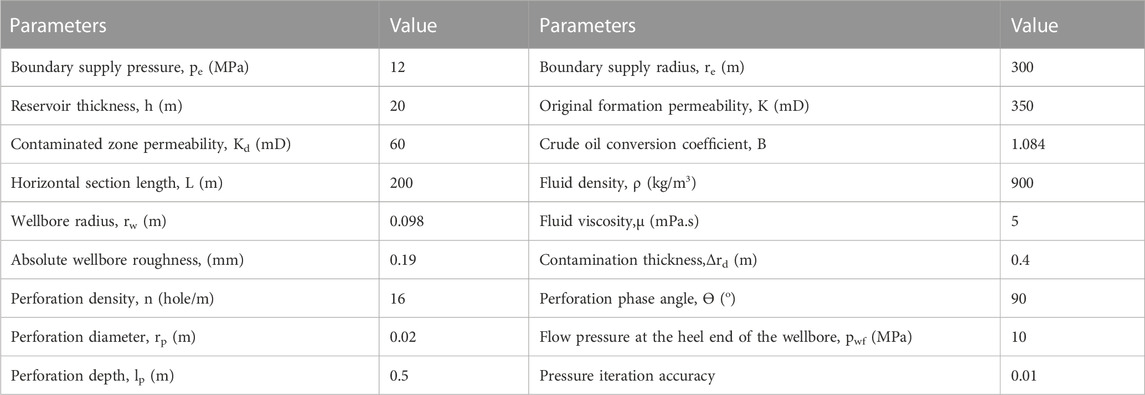
TABLE 3. Basic data of well H in Oil field J.
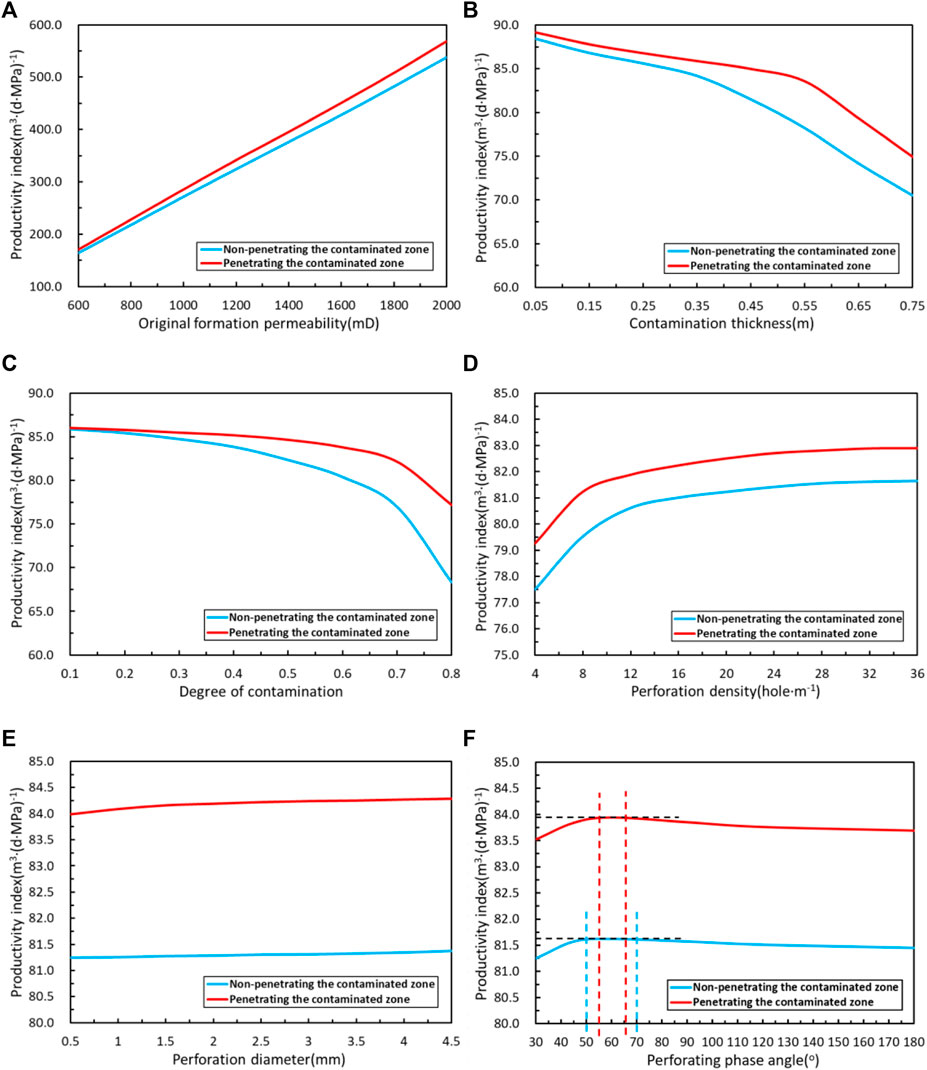
FIGURE 8. Variation diagram of productivity index and completion parameters.
The diagram shows that reservoir physical properties, contamination status, and perforation completion parameters all affect horizontal well productivity, with the influence of original formation permeability and reservoir contamination thickness being the most obvious. Under certain other conditions, the productivity index of horizontal wells without penetrating the contaminated zone and penetrating the contaminated zone increases linearly with the increase of formation permeability (see Figure 8A). Figure 8B demonstrates that as contamination thickness increases, the productivity index declines rapidly, owing to a decrease in the permeability of the contaminated zone and an increase in flow resistance. Simultaneously, when the contamination thickness exceeds the perforation depth (the contaminated zone is not penetrated), the productivity index decreases significantly. The production index decreases with increasing contamination degree, as shown in Figure 8C, and the influence degree of the non-penetrating contaminated zone is more than that of the penetrating contaminated zone.
The graphic indicates the productivity index of horizontal wells increases with the increase of the perforation depth, and perforation depth is an essential factor affecting horizontal well productivity. It can be seen from Figures 8D–F that the impact of pore density on the productivity index is more obvious than that of pore diameter and phase angle. In Figure 8D, when the hole density is small, the productivity index increases rapidly with the increase of the hole density, but the change in the productivity index is not obvious after the hole density increases to a certain number of holes. Combined with field experience, it is apparent that high hole density may degrade casing strength and potentially cause serious downhole accidents. In the case of the shaped charge, increased hole density means decreasing perforation depth. In the field, it is commonly used to improve perforation depth by sacrificing hole density to attain a better perforation effect. In Figure 8E, the productivity index exhibits a sluggish upward trend as pore size increases, and its influence is minimal. With the change in perforation phase angle shown in Figure 8F, the overall change in the horizontal well productivity index is not immediately apparent. The productivity index increases first and subsequently drops as the phase angle is gradually increased. In the case of not penetrating the contaminated zone, the productivity reaches the maximum when the perforation phase angle is between 50–70o; in the case of penetrating the contaminated zone, the productivity reaches the maximum when the perforation phase angle is between 55–65o.
When the perforation passes through the contaminated zone, the formation seepage mode and productivity will change accordingly. Continuing to use the previous productivity formula will cause large errors. Based on the principle of equivalent seepage resistance, this paper proposes a segmented calculation model for the productivity of perforated horizontal wells considering whether to penetrate the contaminated zone, which can accurately simulate the formation seepage law and predict productivity. This is a method that has not been involved in previous models. The main conclusions are as follows:
(1) The seepage model of the reservoir-hole inflow profile is analyzed in detail when the perforation process is not penetrating the contaminated zone, and the dynamic law of the productivity of the perforated horizontal well is accurately simulated. A new productivity calculation model for perforated horizontal wells is produced through model coupling;
(2) The calculation results of the productivity model of perforated horizontal wells in this paper are close to the actual production of oil wells, and the average error is 10.15%. It is concluded that the model is reasonable and practical. It can adjust the inflow profile along the horizontal wellbore, to optimize the production performance of the whole horizontal well, which can effectively guide the technical process design and effect prediction of a perforated horizontal well, and provide economic benefits for oilfield development;
(3) Sensitivity analysis shows that reservoir physical properties, contamination status, and perforation completion parameters have a certain influence on the productivity of horizontal wells, among which the influence of original permeability and reservoir contamination thickness is the most obvious.
The original contributions presented in the study are included in the article/Supplementary material, further inquiries can be directed to the corresponding author.
SZ: Formal Analysis, Investigation, Methodology, Writing–original draft, Writing–review and editing. KG: Conceptualization, Writing–original draft. HY: Data curation, Writing–original draft. XG: Formal Analysis, Writing–original draft.
The author(s) declare that no financial support was received for the research, authorship, and/or publication of this article.
The authors are very grateful for the support of Yangtze University for this article. The authors wish to acknowledge KG for interpreting the significance of the results of this study.
The authors declare that the research was conducted in the absence of any commercial or financial relationships that could be construed as a potential conflict of interest.
All claims expressed in this article are solely those of the authors and do not necessarily represent those of their affiliated organizations, or those of the publisher, the editors and the reviewers. Any product that may be evaluated in this article, or claim that may be made by its manufacturer, is not guaranteed or endorsed by the publisher.
Bell, W. T., Brieger, E. F., and Harrigan, J. W. (1972). Laboratory flow characteristics of gun perforations. J. Petroleum Technol. 24, 1095–1103. doi:10.2118/3444-PA
Burton, R. C., and Hodge, R. M. (1998). “The impact of formation damage and completion impairment on horizontal well productivity,” in Proceedings of the Paper presented at the SPE Annual Technical Conference and Exhibition, New Orleans, Louisiana, September 1998 (OnePetro). doi:10.2118/49097-MS
Doan, Q., Farouq Ali, S. M., and George, A. E. (1990). “SCALING CRITERIA AND MODEL EXPERIEMENTS FOR HORIZONTAL WELLS,” in Proceedings of the Paper presented at the Annual Technical Meeting, Calgary, Alberta, June 1990.
Giger, F. M., Reiss, L. H., and Jourdan, A. P. (1984). “The reservoir engineering aspects of horizontal drilling,” in Proceedings of the Paper presented at the SPE Annual Technical Conference and Exhibition, Houston, Texas, September 1984.
Harris, M. H. (1966). The effect of perforating oil well productivity. J. PETROLEUM Technol. 18, 518–528. doi:10.2118/1236-pa
Holmes, J. A., Barkve, T., and Lund, Ø. (1998). “Application of a multisegment well model to simulate flow in advanced wells,” in Proceedings of the Paper presented at the European Petroleum Conference, The Hague, Netherlands, October 1998.
Joshi, S. D. (1986). “A review of horizontal well and drainhole technology,” in Proceedings of the Paper presented at the SPE Annual Technical Conference and Exhibition, Dallas, Texas, September 1987.
Kabir, A., and Sanchez, G. (2009). “Accurate inflow profile prediction of horizontal wells through coupling of a reservoir and a wellbore simulator,” in Proceedings of the Paper presented at the SPE Reservoir Simulation Symposium, The Woodlands, Texas, February 2009. doi:10.2118/119095-MS
Karakas, M., and Tarlq, S. M. (1991). Semianalytical productivity models for perforated completions. SPE Prod. Eng. 6, 73–82. doi:10.2118/18247-PA
Klotz, J. A., Krueger, R. F., and Pye, D. S. (1974). Effect of perforation damage on well productivity. J. Petroleum Technol. 26, 1303–1314. doi:10.2118/4654-PA
Landman, M. J., Laboratories, B. R. M., and Goldthorpe, W. H. (1991). Optimization of perforation distribution for horizontal wells.
Li, J., and Wang, T. (2022). Production analysis of horizontal wells in a two-region composite reservoir considering formation damage. Front. Energy Res. 10, 818284. doi:10.3389/fenrg.2022.818284
Luo, X., Jiang, L., Su, Y., and Huang, K. (2015). The productivity calculation model of perforated horizontal well and optimization of inflow profile. Petroleum 1, 154–157. doi:10.1016/j.petlm.2015.04.002
Ma, C., Xing, Y., Qu, Y., Cheng, X., Wu, H., Luo, P., et al. (2022). A new fracture parameter optimization method for the horizontal well section of shale oil. Front. Earth Sci. 10, 895382. doi:10.3389/feart.2022.895382
Marett, B. P., Landman, M. J., and Research, B. (1993). “Optimal perforation design for horizontal wells in reservoirs with boundaries,” in Proceedings of the Paper presented at the SPE Asia Pacific Oil and Gas Conference, Singapore, February 1993.
McDowell, J. M., and Muskat, M. (1950). The effect on well productivity of formation penetration beyond perforated casing. J. Petroleum Technol. 2, 309–312. doi:10.2118/950309-G
McLeod, H. O. (1983). The effect of perforating conditions on well performance. J. Petroleum Technol. 35, 31–39. doi:10.2118/10649-PA
Ouyang, L.-B. (1998). “A simplified approach to couple wellbore flow and reservoir inflow for arbitrary well configurations,” in Proceedings of the Paper presented at the SPE Annual Technical Conference and Exhibition, New Orleans, Louisiana, September 1998.
Patel, M. C., and Singh, A. (2016). “Near wellbore damage and types of skin depending on mechanism of damage,” in Proceedings of the Paper presented at the SPE International Conference and Exhibition on Formation Damage Control, Lafayette, Louisiana, USA, February 2016. doi:10.2118/179011-MS
Su, Z., and Gudmundsson, J. S. (1994). “Pressure drop in perforated pipes: experiments and analysis,” in Proceedings of the Paper presented at the SPE Asia Pacific Oil and Gas Conference, Melbourne, Australia, November 1994 (OnePetro). doi:10.2118/28800-MS
Tong, L., Xiaochen, W., Xiangjun, L., Lixi, L., Xuancheng, W., Jin, C., et al. (2023). A criterion for a hydraulic fracture crossing a natural fracture in toughness dominant regime and viscosity dominant regime. Eng. Fract. Mech. 289, 109421. doi:10.1016/j.engfracmech.2023.109421
Wang, G., Liu, Y., and Liu, Z. (2021). Research and application of cold productivity formula of horizontal well in the power-law fluid heavy oil reservoir. Front. Energy Res. 9, 792427. doi:10.3389/fenrg.2021.792427
Wang, X., Huang, L., Li, X., Bi, S., Li, H., Zhang, J., et al. (2022). Wellbore multiphase flow behaviors of gas kick in deep water horizontal drilling. Front. Phys. 10, 1049547. doi:10.3389/fphy.2022.1049547
Xiaochen, W., Jin, C., Xiangjun, L., Lixi, L., Tong, L., Xuancheng, W., et al. (2023). Statistical damage constitutive model considering water-weakening effect based on the Hoek–Brown criterion. Environ. Earth Sci. 82, 408. doi:10.1007/s12665-023-11093-w
Zhang, J., Lei, G., and Zhang, Y. (1998). Seepage flow in porous media. Dongying: University of Petroleum Press.
Zhang, W., Xue, X., Zhang, C., Qu, Y., Ke, K., Pan, S., et al. (2022). A drilling wellbore pressure calculation model considering the effect of gas dissolution and suspension. Front. Earth Sci. 10, 993876. doi:10.3389/feart.2022.993876

Keywords: perforated horizontal well productivity, contaminated zone of strata, equivalent seepage resistance method, flow pressure drop, coupling model, segmented numerical calculation, sensitivity analysis
Citation: Zhang S, Guo K, Yang H and Gao X (2023) The productivity segmented calculation model of perforated horizontal wells considering whether to penetrate the contaminated zone. Front. Earth Sci. 11:1270662. doi: 10.3389/feart.2023.1270662
Received: 01 August 2023; Accepted: 16 October 2023;
Published: 26 October 2023.
Edited by:
Jianwei Tian, Technical University of Denmark, DenmarkReviewed by:
Xin Du, University of Science and Technology of China, ChinaCopyright © 2023 Zhang, Guo, Yang and Gao. This is an open-access article distributed under the terms of the Creative Commons Attribution License (CC BY). The use, distribution or reproduction in other forums is permitted, provided the original author(s) and the copyright owner(s) are credited and that the original publication in this journal is cited, in accordance with accepted academic practice. No use, distribution or reproduction is permitted which does not comply with these terms.
*Correspondence: Shuangshuang Zhang, d2Fpd2FpMTUxNUAxNjMuY29t
Disclaimer: All claims expressed in this article are solely those of the authors and do not necessarily represent those of their affiliated organizations, or those of the publisher, the editors and the reviewers. Any product that may be evaluated in this article or claim that may be made by its manufacturer is not guaranteed or endorsed by the publisher.
Research integrity at Frontiers
Learn more about the work of our research integrity team to safeguard the quality of each article we publish.