
94% of researchers rate our articles as excellent or good
Learn more about the work of our research integrity team to safeguard the quality of each article we publish.
Find out more
ORIGINAL RESEARCH article
Front. Earth Sci. , 19 October 2023
Sec. Environmental Informatics and Remote Sensing
Volume 11 - 2023 | https://doi.org/10.3389/feart.2023.1265292
 Sonia1 Sunita1
 Tathagata Ghosh1*
 Abdelfattah Amari2*
 Virendra Kumar Yadav3Haitham Osman2
 Dipak Kumar Sahoo4*
 Ashish Patel3*
An arid climate is a unique condition that has a significant impact on the growth of crops and natural vegetation. The normalized difference vegetation index (NDVI) is a crucial remotely sensed measurement of greenness due to its strong correlation with crop and vegetation growth and productivity. In the present study, the spatiotemporal dynamics of NDVI were analyzed from 2000 to 2021 in the segment of the arid western plain zone of Rajasthan, India. NDVI time-series data, as well as data related to climatic factors, viz., precipitation, soil moisture, evapotranspiration, and 2-m air temperature, were collected from Giovanni, the Goddard Earth Science dataset. The Mann–Kendall (MK) trend test and Sen’s slope depicted the long-term continuous time–frequency trend, while Karl Pearson’s correlation analysis depicted the significant relationship between all the factors except 2-m air temperature. The seasonal and mean monthly results of all the factors except 2-m air temperature showed considerable coherence with NDVI. The multiscale time–frequency decomposition or wavelet analysis depicted the fifth to the seventh month and the ninth to the 15th month of the cycle, showing the significance of the cropping pattern and the natural vegetation growth cycle. The cross-wavelet analysis further depicted important coherence, leading, and lagging phases among climatic factors and NDVI. Our research provided significant insights into the long-term variability and coherence of various climatic factors with NDVI that are applicable on regional and global scales.
Plants are essential primary producers in terrestrial ecosystems (Sha et al., 2022). They play a significant role in regulating biogeochemical cycles and complex global ecosystems at regional and global scales (Liu et al., 2015; Zhou et al., 2022). Thus, vegetation dynamics over a long time period can be considered a good indicator of environmental change (Kong et al., 2018; Deng et al., 2019). The growth of plants depends upon a range of determinants, and among them, meteorological and climatic factors are considered to be the most significant (Currier and Sala, 2022; Shen et al., 2022). Changing patterns of climatic and meteorological factors resulted in significant variations in vegetation growth and distribution (Kalisa et al., 2019; Luo et al., 2020). Hence, continuous monitoring of the vegetation phenology is of utmost importance for understanding the present environmental scenario and necessary future actions (Zhang et al., 2022; Pei et al., 2023).
Geospatial technology can be used to collect, process, and analyze remotely sensed data to support a variety of applications, such as land use planning, natural resource management, climate change monitoring, and vegetation dynamics (Meresa and Gebrewhid, 2019; Hussain et al., 2022). The NDVI obtained from remotely sensed data is a popular proxy for identifying vegetation greenness and crop health in regional to global-scale investigations. (Fensholt et al., 2009; Vrieling et al., 2013; Huang D et al., 2021). The variability of NDVI has been analyzed from different perspectives by different scholars, and a wide range of climatic parameters have been found to have a synergic effect on it (Martiny et al., 2006; Sha et al., 2020; Moussa Kourouma et al., 2021). NDVI measures the greenness of the land surface and verifies the density of vegetation (Thakur et al., 2022) and can be articulated through the following expression (1):
where IR represents the infrared band (0.841–0.876 µm) and Red denotes the red band of red color (0.620–0.670 µm). The value of NDVI ranges between +1 and −1. Values near zero (−0.1 to 0.1) represent sand and snow cover. Negative values represent water bodies. Values between 0.2 and 0.4 signify vegetation and plant cover (Yan et al., 2022; Zhao et al., 2023). Most studies focused on the understanding of vegetation and crop health depiction in relation to NDVI and climatic factors using geographically weighted regression (Georganos et al., 2017) in the field of ecology or land use and land cover change (Radočaj et al., 2023). Guha and Govil (2021) worked on changing the pattern of land surface temperature (LST) and NDVI in Raipur, India, from 2002 to 2018. The results showed that when the NDVI was high, the LST–NDVI relationship was strong to moderately negative, but when the NDVI was low, the relationships were positive and not always the same. The study concluded that the relationship was stronger in the past and weaker in the present scenario.
A similar approach was adopted by several scholars to establish the relationship between NDVI and LST (Garai et al., 2022; Thanabalan et al., 2023). Monsoon variability and the pattern of climate change have a definite and significant impact on plant dynamics at global and local scales and have been addressed by many scholars (Dutta Dey and Singh, 2021; Gao et al., 2022; Sun et al., 2022). Multiscale time–frequency decomposition or wavelet transformation is a technique that helps determine the complex coherence of different parameters in long-term time series (Sreedevi et al., 2021; Wu et al., 2022). The application of wavelet is widely employed in the fields of meteorology (Barik et al., 2020; Barik and Mishra, 2021), geophysics (Yin et al., 2022; Li et al., 2023), and oceanography (Simon et al., 2020; Buttay et al., 2022), to name a few.
The application of wavelet analysis in the evaluation of NDVI is reported in a number of studies. Dastour et al. (2022) studied monitoring spatiotemporal climate and vegetation change around the Athabasca River Basin in Canada. In order to investigate trend, coherency, and time lag estimates between climate and vegetation time series, the authors constructed a least-squares wavelet (LSWAVE) program. The authors used the NDVI time series from the Terra satellite (Tian et al., 2020) and the composite climate time series. The study depicted that the seasonal cycles of climate and NDVI are time-delayed coherent. The annual cycle was the most coherent component of the complete Athabasca River Basin (ARB), with 84% annual coherency between vegetation and temperature and 46% annual coherency between vegetation and precipitation. Galford et al. (2008) applied wavelet methods on MODIS time series to estimate the intensification of agricultural production and the growth of row crops in Comodoro, Mato Grosso. The study incorporated 5-year data, and MODIS EVI data were wavelet-smoothed using a 90% power wavelet transform. The authors inferred the distinctive phenology of single- and double-harvest crops from this wavelet-smoothed data record. The study revealed that more than 3,200 km2 were transformed from natural vegetation and grazing to row-crop cultivation between 2000 and 2005. A group led by Rhif et al. (2022) focused on improving trend analysis for non-stationary NDVI time series in different segments of Tunisia based on different meteorological data, statistical tests, and wavelet transform for the time span of 2001–2017. In this work, different types of mother wavelets were analyzed for the most suitable one. The study depicted that a combination of Daubechies and Symlets MWs (db9 and sym4) mother wavelets performed best in this context. The study reported the degradation of forests (Li W et al., 2021) and the increase in vegetation area and croplands in different segments of the study area. Ghasempour et al. (2021) worked on spatiotemporal variation of drought and incorporated remote sensing and wavelet transformation in the northwest part of Iran. Maximal overlap discrete wavelet transform (MODWT) was adopted for extracting temporal features of time series. The study considered several satellite-based indices like NDVI, the vegetation condition index, the vegetation health index, and the temperature condition index. The study evaluated the coherence between ground-based drought indices and satellite-based indices. It was concluded that there was a significant association between selected variables and drought.
Hence, there is great potential for the application of multiscale time–frequency decomposition or wavelet transformation in the observation of long-term NDVI responsiveness to meteorological factors but is still limited to few studies (Sebastian et al., 2019; Ghasempour et al., 2021; Naga Rajesh et al., 2023). An arid environment has typical characteristics of limited resources and presents a challenging environment for the growth of plants and crops. Hence, it is significant to study the synergic effect of climatic factors on the vegetation dynamics in this unique ecosystem. Presently, there is a considerable research gap in the context of the arid western plain zone of Rajasthan, India. The major objectives of the present study were to evaluate the spatial and temporal trend of NDVI and climatic factors like precipitation, 2-m air temperature, evapotranspiration, and soil moisture over 2 decades (2000–2021) in the segment of the arid western plain zone (ACZ-II) of Rajasthan, India. In addition, the study analyzed the magnitude of coherence of NDVI to other climatic factors to evaluate the responsiveness of NDVI to meteorological factors using multiscale time–frequency decomposition or wavelet transform.
The present study area is located in the segment of the arid western plain zone (ACZ-II) of western Rajasthan, India. The geographical extension of the study region is between 74°3′6.316″E and 74°39′9.247″E and 27°47′53.022″N and 28°40′21.049″N encompassing an area of 4,500 km2 (Figure 1). There are four main agro-climatic zones in western Rajasthan: (1) irrigated north-western plain (ACZ-I), (2) arid western plain (ACZ-II), (3) transitional plain of inland drainage (ACZ-III), and (4) transitional plain of Luni Basin (ACZ-IV). A negligible fraction of the arid western zone is covered by vegetation (Kar, 2014). The extreme range of temperature (–1°C–49°C) and low rainfall (350 mm) are some of the significant climatic characteristics of this region (Census of India, 2011).
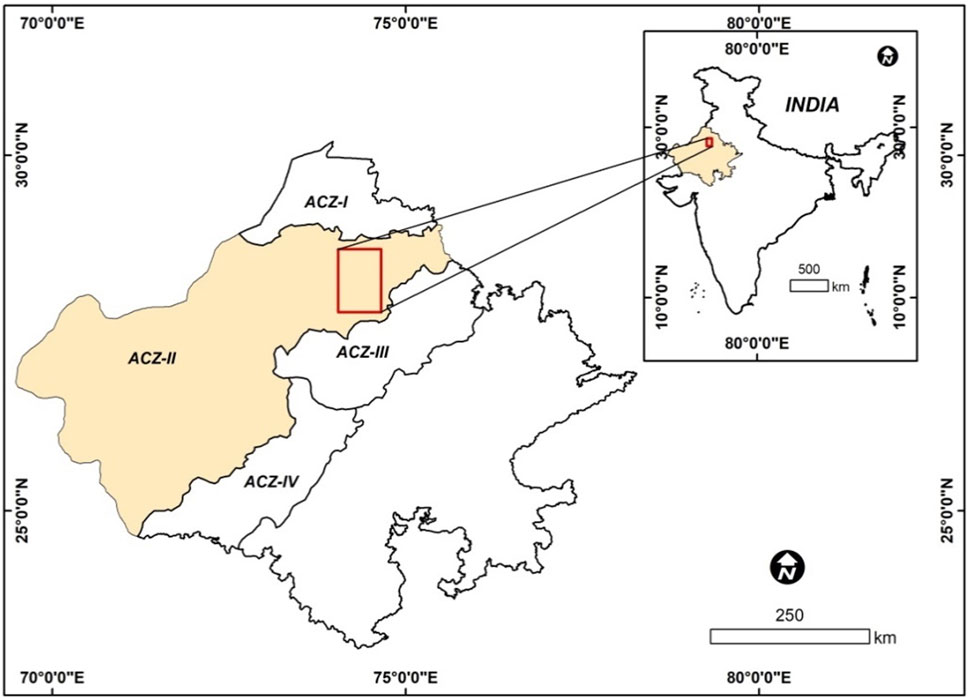
FIGURE 1. Location map of the study area (Source: Kar, 2014).
In the present study, 21 years of mean monthly continuous data (2000–2021) for NDVI, precipitation (mm/day), soil moisture (kg m–2), evapotranspiration (kg m–2), and 2-m air temperature (oC) were downloaded from NASA-supported Giovanni datasets. A NASA Goddard Earth Science Data and Information Services Center (GES DISC) Distributed Active Archive Center (DISC) web application (https://giovanni.gsfc.nasa.gov/giovanni/) was used for accessing, visualizing, and analyzing considerable volume geospatial data. The details of the data are shown in Table 1.
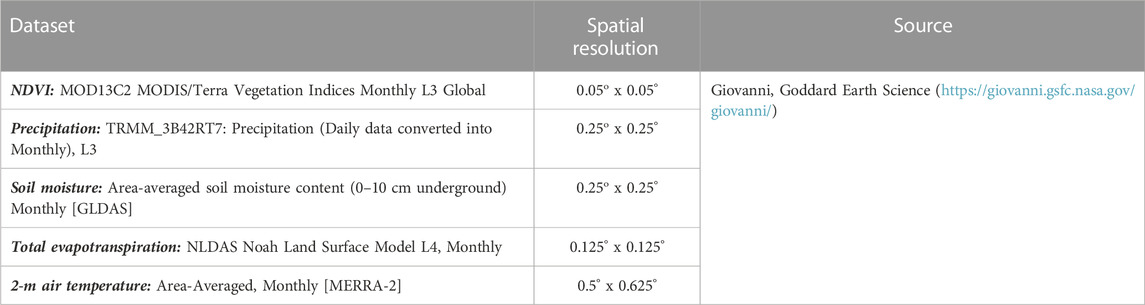
TABLE 1. Details of NDVI, precipitation, soil moisture, total evapotranspiration, and 2-m air temperature data used for analysis.
Karl Pearson’s coefficient of correlation “r” is a widely used technique for determining correlation among variables (Zeren Cetin et al., 2023). In the present study, multiple correlations between the variables were established and are portrayed in Figure 2 using the following expression (1) in RStudio using the metan package (Olivoto and Lúcio, 2020):
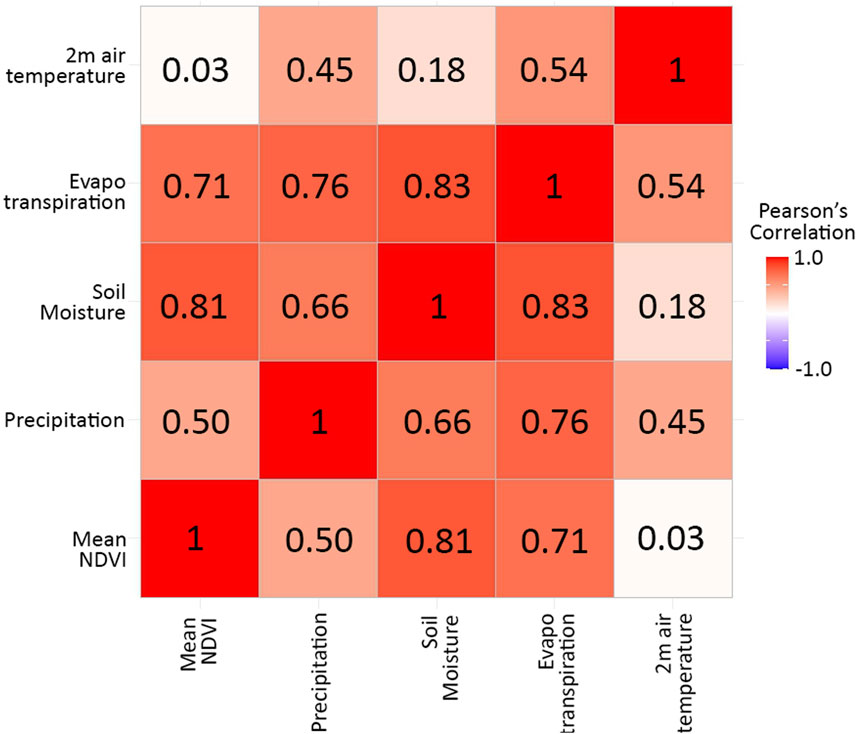
FIGURE 2. Correlation among the selected parameters.
where n is the total number of samples, X′ and Y’ are the respective means of x and y, and rxy is the correlation coefficient between variables x and y.
To determine the trend in the time series of the selected variables, Mann–Kendall (MK) statistics and Sen’s slope were performed in RStudio (Team R. C., 2020) using the Kendall (McLeod, 2016) and trend (Pohlert, 2023) packages. The MK test is a widely used tool for the depiction of monotonic trends in time-series data (2 and 3):
where
where S is the MK statistics or Kendall’s tau (MK-tau) and Rj and Ri are the ranks of time series observation of yj and yi, respectively. The test assumes that data are independent and identically distributed. The following expressions (4 and 5) can be used for the denervation of mean E(s) and variance var(s):
where tp is the number of ties for the pth extent and q is the number of tied groups. The second part represents the tuning for tied observations. It is assumed that with a significant number of observations, S tends to follow a normal distribution. The Z significance test (ZMK) with a p-value <0.05 was computed by Eq. 6:
Here, the null hypothesis (Ho), that is, no trend, is tested against the alternative hypothesis (H1), having a trend in the time-series data. In addition, Sen’s slope was estimated using the following expression:
where Qi is the estimated slope for each pair of observations; j and k denote time steps where j>k.
The time-series data for all the variables were represented in Origin software. The collected data were categorized in two ways. The entire dataset was initially organized according to the seasons (winter, pre-monsoon, monsoon, and post-monsoon) and represented through a box plot in RStudio using the tidyverse package (Wickham et al., 2019). In addition, the entire dataset was organized in mean monthly results and represented using a boxplot. A continuous wavelet converts a time-series signal into the time–frequency domain. It depicts the magnitude and periodicity of the time-series data [Xt] in the time domain (Mahasa et al., 2023). The Morlet wavelet transform of a time series (Xt) is defined as the convolution of the series with a set of “wavelet daughters” generated by the mother wavelet by time translation and scale factors (8):
where s is the wavelet scale, τ defines the position of the wavelet window in the time or the translated time index, and Ψ is the mother Morlet function with * denoting the complex conjugate. In the present study, the Morlet wavelet function (Ψ) as a basis of the wavelet function is used through the following expression (9):
where ω is the rotation rate or angular frequency per unit time in radians and t is the time step. One revolution is equal to 2π (radians); therefore, the period (or inverse frequency) measured in time units equals 2π/6. The wavelet power can be expressed through the following expression (10):
A cross-wavelet transformation (CWT) function was applied to measure the relationship between NDVI and individual climatic variables using a similar time step. The cross-wavelet [Wxy (τ,s)] is expressed in the following way (11):
where * denotes the complex conjugate of the y time series. The following expressions can be used for the determination of the power of cross-wavelet, which is the measure of coherence between pairs of time-series data (12 and 13):
The difference in phase between two time-series data depicts an in-phase oscillation pattern of two time-series data if they are matched with each other; in contrast, the difference in phase depicts an out-of-phase pattern if the two time-series data do not match (Grinsted et al., 2004). The lagging or the leading tendencies of the variables are indicated through the arrows (Schmidbauer and Roesch, 2018). The coherence between the variables was evaluated at the p-value of 0.05 and was incorporated in the cone of influence (Pal and Devara, 2012). The entire process of wavelet analysis and its graphical expression was performed in RStudio using the WaveletComp package (Schmidbauer and Roesch, 2018). To detect the presence or absence of multicollinearity among climatic variables, the variance inflation factor (VIF) was obtained in RStudio using the faraway package (Faraway, 2022). The spatial distribution of NDVI was depicted in the Google Earth Engine (GEE) code editor. The Landsat 5 TM dataset was used for the depiction of the year 2000 NDVI data, and the Landsat 7 ETM+ dataset was adopted for the recent year. In the cases of 2000 and 2021, the mean annual time frame was considered for the depiction of NDVI. Finally, the results were downloaded and represented in ArcGIS 10.5.
The relationship of mean NDVI to the climatic factors was determined by using Karl Pearson’s coefficient of correlation. Precipitation showed a positive and moderate correlation with mean NDVI (r = +0.50). Soil moisture and precipitation are important climatic factors that have a direct impact on the growth of plants and crops (Chen et al., 2023; Yang et al., 2023). Evapotranspiration depicted a higher positive correlation with all the factors including mean NDVI (r = +0.71). On the other hand, a relatively insignificant correlation was observed between the 2-m air temperature and mean NDVI (r = +0.03). Soil moisture and NDVI depicted a high positive correlation of +0.81 (Figure 2). The positive correlation between the mean NDVI and climatic factors depicted the definite influence of climatic factors on the growth of plants and crops (Tian et al., 2019; Wang et al., 2022).
Before further assessing the relationship between climatic factors with NDVI, it is crucial to evaluate if any kind of multicollinearity exists between climatic factors (Li M et al., 2021; Zhang et al., 2021). The presence of multicollinearity can result in unstable estimations as it enhances the variance of the coefficient of regression (Chan et al., 2022; Zhu et al., 2023). VIF is a widely used method adopted by scholars of different disciplines for depicting multicollinearity among variables (Chan et al., 2022; Park et al., 2022). The VIFs for the climatic factors were 2.43, 4.85, 7.06, and 2.12 for precipitation, soil moisture, evapotranspiration, and 2-m air temperature, respectively, with a p-value of <2.2×10⁻¹⁶. All the VIFs showed values less than 10 with a very low p-value, which indicated the absence of any significant collinearity among climatic factors (Akinwande et al., 2015).
Figure 3 depicts the spatial dynamics of NDVI from 2000 to 2021. The illustration clearly shows a significant change in vegetation cover over the last 2 decades. In recent years, the greener segments, which are mostly associated with agricultural activities, have expanded in the northern and eastern segments. In previous years, the concentration of crops/vegetation was mostly observed in the central segment.
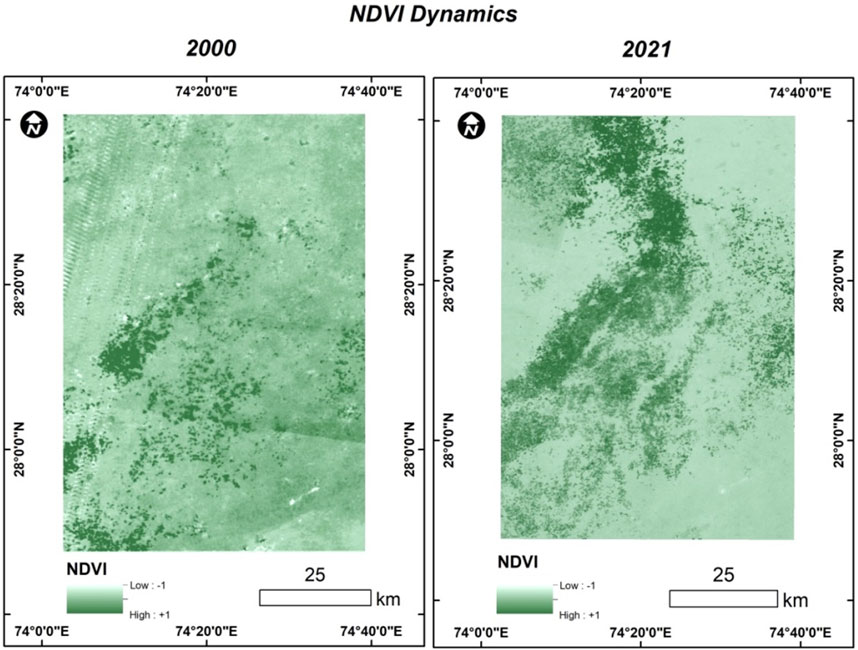
FIGURE 3. NDVI dynamics from 2000–2021.
The linear trend of mean NDVI showed a clear upward trend (Figure 4A) for the period 2000–2021. The range of mean NDVI from 2000–2021 was between 0.12 and 0.49 as minimum and maximum, respectively, with a mean of 0.07. The monthly minimum NDVI value was observed during May 2000 (pre-monsoon), while the maximum NDVI value was observed during September 2011 (monsoon). The standard deviation of 0.08 showed relatively a small deviation in the entire time span with a positive skewness (+1.17). MK trend analysis depicted a positive trend at the 95% confidence level with a Sen’s slope of 3.3×10⁻⁴.
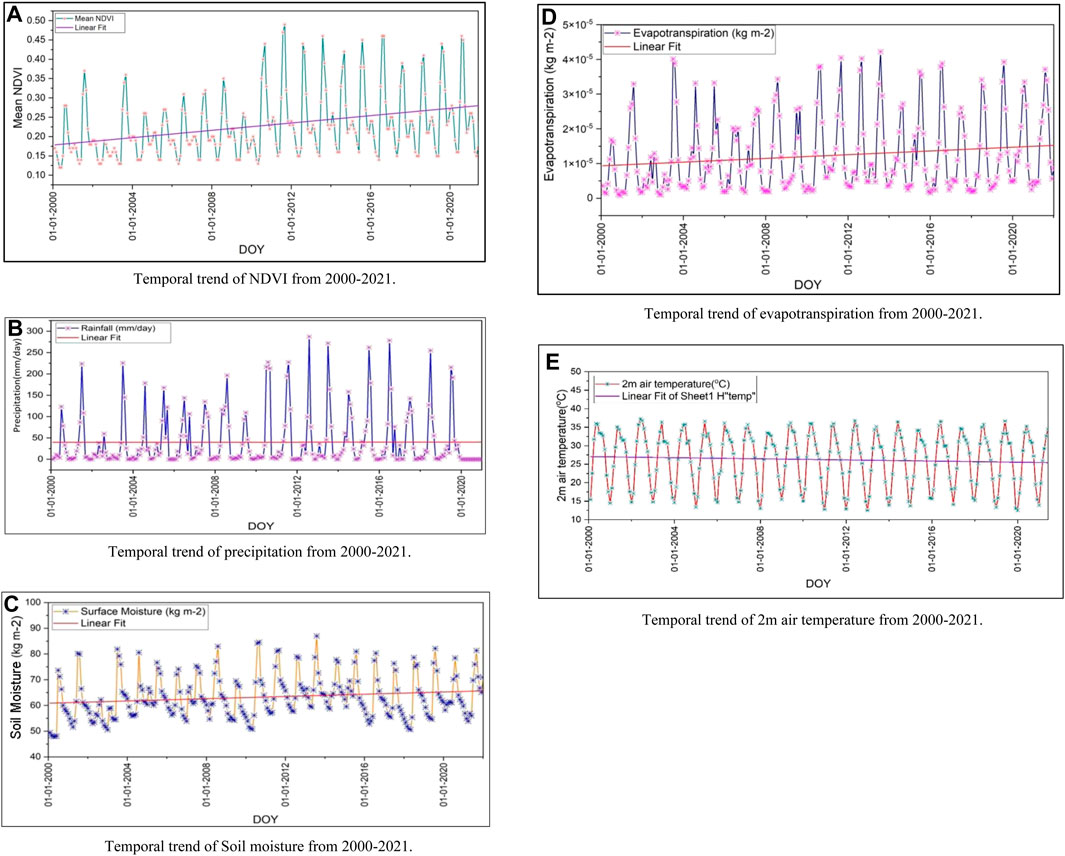
FIGURE 4. (A) Temporal trend of NDVI from 2000 to 2021. (B) Temporal trend of precipitation from 2000 to 2021. (C) Temporal trend of soil moisture from 2000 to 2021. (D) Temporal trend of evapotranspiration from 2000 to 2021. (E) Temporal trend of 2-m air temperature from 2000 to 2021.
The precipitation rate varies between 0 mm/day and 287.41 mm/day in the entire time span. The maximum precipitation was observed during August 2012 (monsoon). The mean precipitation value was as high as 46.17 mm/day, the standard deviation was as high as 63.18 mm/day, and skewness indicated a high positive value (+2.06). The MK trend test and Sen’s slope indicated a downward trend in the time frame (z = −2.46 and Sen’s slope −6.88×10⁻³, respectively) (Figure 4B). Soil moisture ranged between 47.95 kg m–2 and 86.97 kg m–2 with a mean of 6.52 kg m-–2 (Figure 4C). The standard deviation was as high as 8.29 kg m–2, while skewness was 0.71. The MK trend test and Sen’s slope indicated an upward trend in the time frame (z = 2.71 and Sen’s slope 1.72×10⁻², respectively). Evapotranspiration ranged between 8.73×10⁻⁷ kg m–2 and 4.22×10⁻⁵ kg m–2 with a mean of 8.88×10⁻⁶ kg m–2 (Figure 4D). The standard deviation and skewness were 1.09×10⁻⁵ kg m–2 and 1.09, respectively, while the MK trend and Sen’s slope were 1.42×10⁻⁸. Figure 4E shows the trend of 2-m air temperature on NDVI. The range of 2-m air temperature from 2000 to 2021 was 12.52°C (minimum) and 37.21°C (maximum) (Figure 4E). The standard deviation was high, at 7.30, while the skewness was −0.34. The minimum temperature was observed during January 2020 (winter), and the maximum temperature was observed during June 2002 (pre-monsoon). MK trend statistics showed a downward trend (z = −1.16) with a Sen’s slope of−5.66×10⁻³.
The mean monthly characteristics of NDVI depicted some important facts and complex relationships with other climatic factors. The months of May and June showed the lowest means (0.14 and 0.15, respectively) and minimum inter-quartile ranges (IQRs) (0.02 and 0.02, respectively) (Figure 5A). On the other hand, August and September depicted the highest means (0.37 and 0.36, respectively) and highest IQRs (0.13 and 0.13, respectively). The maximum NDVI values can be observed in July, August, and September. Precipitation (Figure 5B), soil moisture (Figure 5C), and evapotranspiration (Figure 5D) confirm a similar pattern; 2-m air temperature is an exception (Figure 5E). During June, 2-m air temperature reached its zenith with a mean and IQR of 35.54 and 1.75, respectively.
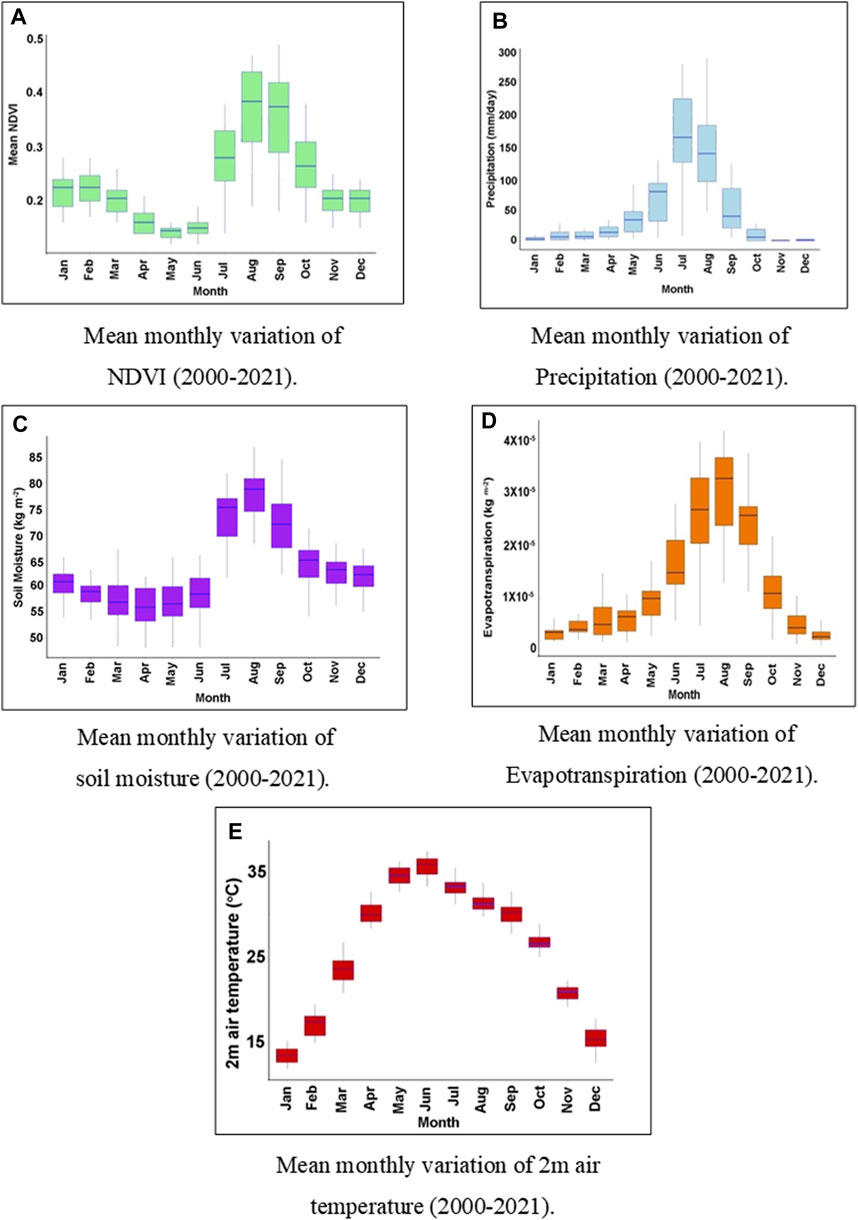
FIGURE 5. (A) Mean monthly variation of NDVI (2000–2021). (B) Mean monthly variation of precipitation (2000–2021). (C) Mean monthly variation of soil moisture (2000–2021). (D) Mean monthly variation of evapotranspiration (2000–2021). (E) Mean monthly variation of 2-m air temperature (2000–2021).
Figure 5E depicts the mean monthly temperature pattern of the entire time span. In the selected study area, the winter season spans between mid-November and February, and the pre-monsoon season or summer prevails from April to June. The monsoon season ranges between July and September. The characteristics of the post-monsoon season can only be observed during October and early November (Dhakar et al., 2013). Seasonal characteristics were depicted by observing the behavior of all the variables in the four major seasons, viz., winter, pre-monsoon, monsoon, and post-monsoon. During winter and pre-monsoon, NDVI showed relatively low IQRs (0.04 and 0.05, respectively) (Figure 6A) (Table 2) with a very low standard deviation (0.03) and depicted a significant association with soil moisture in particular (Figure 6B). During the monsoon season, IQR showed the highest value of 0.20 and depicted the maximum association with the climatic factors. During monsoon, the IQRs of related climatic factors like precipitation (Figure 6C), soil moisture (Figure 6D), and evapotranspiration (Figure 6C) were 119.69 mm/day, 16.41 kgm–2, and 1.7×10⁻⁵ kgm–2, respectively. At the same time, the IQR of the 2-m air temperature was at a minimum during the monsoon season (3.51) (Figure 6E). In post-monsoon, the IQR of the mean NDVI was 0.13, while at the same time, the IQR of precipitation was 44.80 with a considerably lower mean value. Soil moisture also follows a similar pattern as precipitation in terms of IQR. In the case of NDVI, the standard deviation was relatively smaller in all seasons except monsoon. In contrast, all of the climatic variables showed a higher standard deviation. Table 2 summarizes the descriptive statistics of NDVI and all the climatic factors.
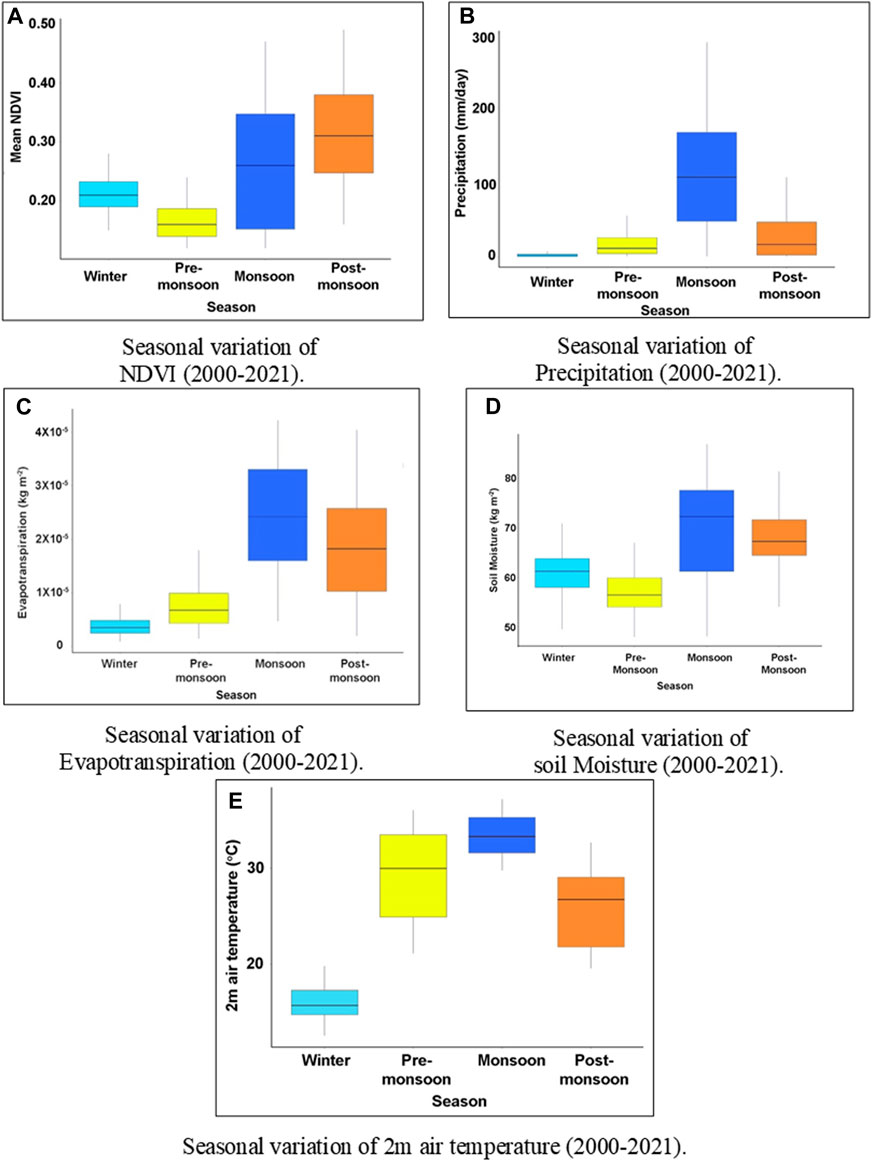
FIGURE 6. (A) Seasonal variation of NDVI (2000–2021). (B) Seasonal variation of precipitation (2000–2021). (C) Seasonal variation of evapotranspiration (2000–2021). (D) Seasonal variation of soil moisture (2000–2021). (E) Seasonal variation of 2-m air temperature (2000–2021).
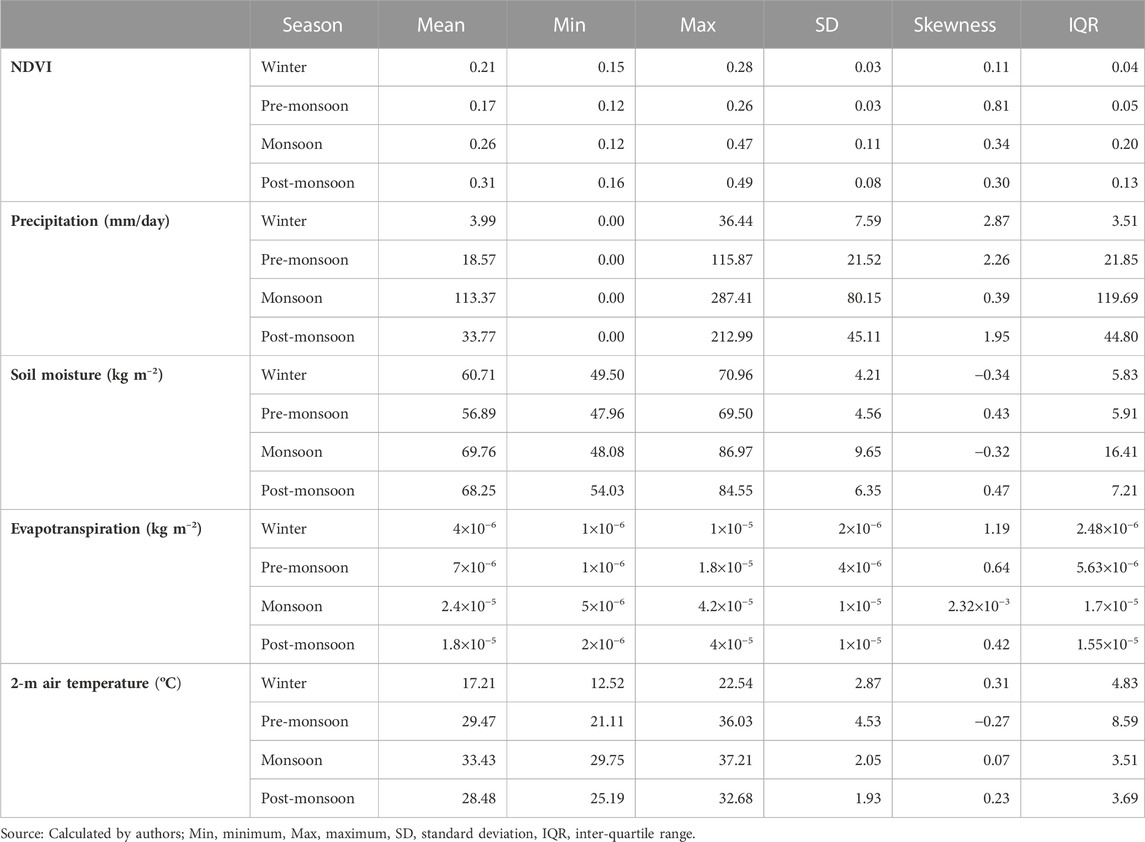
TABLE 2. Seasonal descriptive statistics of NDVI and climatic factors.
The precipitation time series and NDVI time series depicted some significant results. A continuous segment of coherency among the factors can be observed in the eighth to the 16th month period. The highest cross-wavelet power (CWP) level can be observed after 2010 in the 12th month segment period (Figure 7A). Another discrete segment of coherency was observed in the fourth to the seventh month period. The direction of the arrows confirms that in these segments, the factors were associated with an in-phase condition. Results obtained from the cross-wavelet analysis of evapotranspiration and NDVI depicted some significant facts. The CWP level ranged between below 0.3 to above 1.5. A continuous segment of coherency with a longer periodicity of the evapotranspiration time series and NDVI time series can be observed from the ninth to the 12th month period throughout the temporal dimension. A segment of periodicity can also be observed between the fifth and the seventh month period (Figure 7B). In this case, the segment was discrete before 2010, while it is relatively continuous afterward. The maximum CWP level was observed after 2010 and in the period segment of the 11th to the 12th month period in a discrete manner. The arrows in the segments toward the right (fifth to the seventh month period) and top-right (ninth to the 12th month period) directions indicate the in-phase cyclicity of evapotranspiration and NDVI (Schmidbauer and Roesch, 2018; Liu et al., 2023). In the case of the ninth to the 12th month period, the segment was associated with the situation when the mean NDVI was leading and evapotranspiration was lagging. Soil moisture and NDVI showed a similar pattern of coherency and phase condition except for CWP level. In this context, most of the area was associated with a relatively lower CWP level, with only a few patches with a higher CWP level. An in-phase condition can be observed during the fourth to seventh month period and the ninth to the 16th month period (Figure 7C). In the case of 2-m air temperate and NDVI, only a single segment of coherency can be observed in the eighth to the 16th month period with the highest CWP level between 2010 and 2015. The direction of the arrow indicates a slight in-phase condition (Figure 7D).
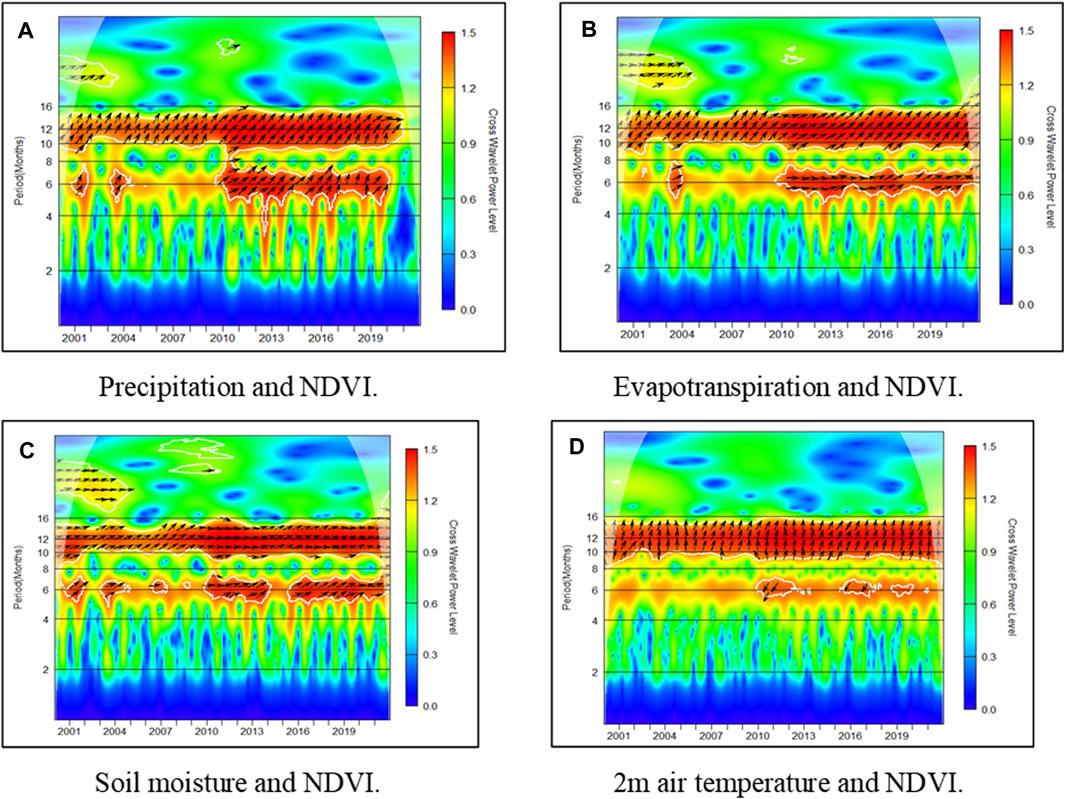
FIGURE 7. (A) Precipitation and NDVI. (B) Evapotranspiration and NDVI. (C) Soil moisture and NDVI. (D) 2-m air temperature and NDVI.
The relationship of NDVI to the other climatic factors in the temporal dimension suggested several significant points and showed considerable alignment with seasonal patterns. Soil moisture plays a crucial role in the entire life span of plants and crops and has a strong relationship with evapotranspiration (Huang T et al., 2021). A high positive correlation exists between NDVI and soil moisture (r = +0.81). The result is further supported by the study of Saco and Morenode las Heras (2013). In this study, the development of vegetation patterns through the interaction of biotic and abiotic processes was evaluated, and it was concluded that the distribution of vegetation patches is fundamentally associated with soil moisture in the semi-arid region. Another study by Dang et al. (2022) incorporated temperature and soil moisture to measure global ecosystem production. According to the study, temperature variation played a significant role in influencing the degree of solar-induced chlorophyll fluorescence as an indicator of global ecosystem productivity in most humid segments.
Soil moisture, on the other hand, was critical in influencing ecosystem production in semi-arid and arid regions. During the monsoon season, higher soil moisture and 2-m air temperature played a positive role in the photosynthesis process of plants and crops. In the pre-monsoon season, the 2-m air temperature was higher, but soil moisture was lower. In the study area, in association with the climatic constraints, agricultural activities are mostly concentrated during the kharif (monsoon) season, where precipitation plays a significant role. Furthermore, it was observed that the enhanced spatial and temporal dimensions of the NDVI in recent years are primarily due to the contribution of agricultural activities. This result is supported by several studies. The inferences depicted by Zheng et al. (2018) showed that from 1999–2016, one of the significant contributors to increasing the NDVI was cropland in the semi-arid basin of the Chinese loess plateau. The study also concluded that climate change is another driving force. The study by Huang et al. (2010) found that MODIS-NDVI-based crop classification in China classified crop growth into three classes, viz., better than usual, usual, and worse than usual (Huang et al., 2010). The study by Lu et al. (2021), concluded that in the recent years, intensive agricultural management led to increasing yields and further resulted in an increased NDVI. The study concluded that in recent years, intensive agricultural management led to increasing yields and further resulted in an increased NDVI. The results from our study also indicated that in recent years, there has been a considerable increase in the spatial extent of agriculture along with increased yield. The MK trend test and Sen’s slope showed no significant variation was observed in the recent time span. The wavelet analysis indicates that the coherency of NDVI to other climatic factors was stronger in two periods. The result can be related to the cropping pattern and the plant growth cycle. The result is supported by several studies with a similar approach. Fayech and Tarhouni (2021) worked in the arid region of Gabes to depict the relationship between NDVI and rainfall. The linear regression showed a positive relationship between annual NDVI and annual rainfall, while the relationship was negative between LST and NDVI.
Ramos et al. (2018) associated a remotely sensed leaf area index in hydrological modeling to evaluate maize development. The leaf area index shows the variability of crops and soils in different phases of the cycle of plants. The present study showed that during the post-monsoon season, the NDVI was associated with the highest mean value compared to the wet season (Ramos et al., 2018). During monsoon, the solar radiation is relatively lesser, which may cause a lesser rate of photosynthesis and a relatively smaller NDVI (Yin et al., 2023). The result is supported by the work of Chen et al. (2004). The study reported that the presence of clouds can result in lower NDVI. Soil moisture and evapotranspiration also showed a close relationship and coherence with the NDVI (Schultz and Halpert, 1993). During the pre-monsoon season, the soil moisture and evapotranspiration showed considerable coherence with NDVI. Furthermore, higher LST and lower soil moisture during the pre-monsoon season may lead to lower levels of NDVI. The work of Sharma et al. (2022) substantiates this result. The wavelet analysis showed the prevalence of periodicity between climatic factors and NDVI during the pre-monsoon and post-monsoon seasons, viz., the fourth to the seventh month and the ninth to the thirteenth month.
Coherence is clearly visible between climatic factors and NDVI except for 2-mm air temperature. Longer periodicity with an in-phase condition indicates the strong sensitivity and responsiveness of NDVI to climatic factors. The work of Huang T et al. (2021) confirms the results obtained in the present study. The orientation of the arrows shows the phase conditions between the specific climatic factor and NDVI. A significant in-phase condition was observed with a minor shift indicated by the angle of the arrow (Huang D et al., 2021). This kind of shift showed the influence of other climatic factors on the overall dynamics of NDVI (He et al., 2012; Sebastian et al., 2019). In contrast, the lower periodicity of smaller patches of coherence showed different behavior. These smaller patches indicated the influence of smaller-scale seasonal variation and local circulation (Sebastian et al., 2019). In most situations, the arrows in the smaller patches of significant coherence showed an in-phase condition except for 2-m air temperature. The angles of the arrow also indicated the impact of other climatic factors. One important finding from the cross-wavelet analyses was that after 2010, the periodicity of the fourth to the seventh month was more continuous than before, which may be attributed to better irrigation in the entire region in recent years (Hussain and Mohammad, 2018). The work of Kaur and Singh (2023) also supports the present work. The authors reported that in recent years, the Indira Gandhi Canal and oil schemes have been major driving forces behind enhanced agricultural activities in significant segments of Rajasthan, including the present study area (Kaur and Singh, 2023).
In the present study, the impact of climatic factors like precipitation, soil moisture, 2-m air temperature, and evapotranspiration was considered for evaluating the long-term mean NDVI response. The seasonal characteristics of the components were found to have a strong relationship with mean NDVI. According to the findings, the pre- and post-monsoon seasons are characterized by intricate coherence among climatic elements, which has a major impact on NDVI. All the climatic factors except 2-m air temperature showed strong coherence and in-phase conditions in these two seasons. One important inference that can be deduced from the analysis is that agricultural activities in recent years were relatively intense and spatially extended with better inputs and are responsible for the increased NDVI. From the CWP level, it was observed that in two major geographic segments of the study area, the coherence between the climatic factor and the mean NDVI was strong, which is further related to the agricultural activities and vegetation growth cycle. The present study also showed that tools like wavelet transform can play a significant role in explaining long-term complex time series and its coherence to other variables and in-phase or out-of-phase conditions. The present study is limited to a specific time and space by specific climatic factors. The application of the present study is not only restricted to the study area but rather is applicable at the global scale with similar climatic conditions. Recent techniques like machine learning algorithms could be applied to extend the present study by including more climatic factors with a wider regional scope so that the importance of each variable on the response variable can be understood.
The original contributions presented in the study are included in the article/Supplementary Material; further inquiries can be directed to the corresponding authors.
Sonia: formal analysis, investigation, methodology, writing–original draft, and writing–review and editing. Sunita: formal analysis, investigation, methodology, writing–original draft, and writing–review and editing. TG: conceptualization, data curation, project administration, supervision, and writing–review and editing. AA: writing–review and editing, funding acquisition, resources, software, and validation. VY: writing–original draft, writing–review and editing, formal analysis, investigation, and methodology. HO: funding acquisition, resources, software, visualization, and writing–review and editing. DS: conceptualization, data curation, funding acquisition, resources, and writing–review and editing. AP: conceptualization, project administration, supervision, writing–original draft, and writing–review and editing.
The author(s) declare that no financial support was received for the research, authorship, and/or publication of this article.
The authors extend their appreciation to the Deanship of Scientific Research at King Khalid University for funding this work through the Research Groups Program under grant number R.G.P.2/34/44.
The authors declare that the research was conducted in the absence of any commercial or financial relationships that could be construed as a potential conflict of interest.
All claims expressed in this article are solely those of the authors and do not necessarily represent those of their affiliated organizations, or those of the publisher, the editors, and the reviewers. Any product that may be evaluated in this article, or claim that may be made by its manufacturer, is not guaranteed or endorsed by the publisher.
Akinwande, M. O., Dikko, H. G., and Samson, A. (2015). Variance inflation factor: as a condition for the inclusion of suppressor variable(s) in regression analysis. Open J. Stat. 05, 754–767. doi:10.4236/ojs.2015.57075
Barik, G., Acharya, P., Maiti, A., Gayen, B. K., Bar, S., and Sarkar, A. (2020). A synergy of linear model and wavelet analysis towards space-time characterization of aerosol optical depth (AOD) during pre-monsoon season (2007–2016) over Indian sub-continent. J. Atmos. Sol. Terr. Phys. 211, 105478. doi:10.1016/j.jastp.2020.105478
Barik, N., and Mishra, J. (2021). “Utilization and geopolymerization of fly ash for concrete preparation and soil stabilization: a short review,” in Processing and characterization of materials: select proceedings of CPCM 2020. Editors S. Pal, D. Roy, and S. K. Sinha (Singapore: Springer Singapore), 357–367. doi:10.1007/978-981-16-3937-1_36
Buttay, L., Vasseur, D. A., González-Quirós, R., and Nogueira, E. (2022). Nutrient limitation can explain a rapid transition to synchrony in an upwelling-driven diatom community. Limnol. Oceanogr. 67, S298–S311. doi:10.1002/lno.12033
Chan, J. Y., Le, H., Leow, S. M., Bea, K. T., Cheng, W. K., Phoong, S. W., et al. (2022). Mitigating the multicollinearity problem and its machine learning approach: a review. Mathematics 10, 1283. doi:10.3390/math10081283
Chen, J., Jönsson, P., Tamura, M., Gu, Z., Matsushita, B., and Eklundh, L. (2004). A simple method for reconstructing a high-quality NDVI time-series data set based on the Savitzky–Golay filter. Remote Sens. Environ. 91 (3-4), 332–344. doi:10.1016/j.rse.2004.03.014
Chen, Z., Wang, W., Cescatti, A., and Forzieri, G. (2023). Climate-driven vegetation greening further reduces water availability in drylands. Glob. Chang. Biol. 29, 1628–1647. doi:10.1111/gcb.16561
Currier, C. M., and Sala, O. E. (2022). Precipitation versus temperature as phenology controls in drylands. Ecology 103, e3793. doi:10.1002/ecy.3793
Dang, C., Shao, Z., Huang, X., Qian, J., Cheng, G., Ding, Q., et al. (2022). Assessment of the importance of increasing temperature and decreasing soil moisture on global ecosystem productivity using solar-induced chlorophyll fluorescence. Glob. change Biol. 28 (6), 2066–2080. doi:10.1111/gcb.16043
Dastour, H., Ghaderpour, E., Zaghloul, M. S., Farjad, B., Gupta, A., Eum, H., et al. (2022). Wavelet-based spatiotemporal analyses of climate and vegetation for the Athabasca river basin in Canada. Int. J. Appl. Earth Observation Geoinformation 114, 103044. doi:10.1016/j.jag.2022.103044
Deng, C., Zhang, B., Cheng, L., Hu, L., and Chen, F. (2019). Vegetation dynamics and their effects on surface water-energy balance over the Three-North Region of China. Agric Meteorol 275, 79–90. doi:10.1016/j.agrformet.2019.05.012
Dhakar, R., Sehgal, V. K., and Pradhan, S. (2013). Study on inter-seasonal and intra-seasonal relationships of meteorological and agricultural drought indices in the Rajasthan State of India. J. Arid. Environ. 97, 108–119. doi:10.1016/j.jaridenv.2013.06.001
Dutta Dey, S., and Singh, R. (2021). Mapping precarious energy geographies: exploring the lived experience of coal mining in Jharia, India. Energy Res. Soc. Sci. 82, 102298. doi:10.1016/j.erss.2021.102298
Fayech, D., and Tarhouni, J. (2021). Climate variability and its effect on normalized difference vegetation index (NDVI) using remote sensing in semi-arid area. Model Earth Syst. Environ. 7, 1667–1682. doi:10.1007/s40808-020-00896-6
Fensholt, R., Rasmussen, K., Nielsen, T. T., and Mbow, C. (2009). Evaluation of earth observation based long term vegetation trends — intercomparing NDVI time series trend analysis consistency of Sahel from AVHRR GIMMS, Terra MODIS and SPOT VGT data. Remote Sens. Environ. 113, 1886–1898. doi:10.1016/j.rse.2009.04.004
Galford, G. L., Mustard, J. F., Melillo, J., Gendrin, A., Cerri, C. C., and Cerri, C. E. (2008). Wavelet analysis of MODIS time series to detect expansion and intensification of row-crop agriculture in Brazil. Remote Sens. Environ. 112 (2), 576–587. doi:10.1016/j.rse.2007.05.017
Gao, W., Zheng, C., Liu, X., Lu, Y., Chen, Y., Wei, Y., et al. (2022). NDVI-based vegetation dynamics and their responses to climate change and human activities from 1982 to 2020: a case study in the Mu Us Sandy Land, China. Ecol. Indic. 137, 108745. doi:10.1016/j.ecolind.2022.108745
Garai, S., Khatun, M., Singh, R., Sharma, J., Pradhan, M., Ranjan, A., et al. (2022). Assessing correlation between Rainfall, normalized difference Vegetation Index (NDVI) and land surface temperature (LST) in Eastern India. Saf. Extreme Environ. 4, 119–127. doi:10.1007/s42797-022-00056-2
Georganos, S., Abdi, A. M., Tenenbaum, D. E., and Kalogirou, S. (2017). Examining the NDVI-rainfall relationship in the semi-arid Sahel using geographically weighted regression. J. Arid. Environ. 146, 64–74. doi:10.1016/j.jaridenv.2017.06.004
Ghasempour, R., Roushangar, K., Ozgur Kirca, V. S., and Demirel, M. C. (2021). Analysis of spatiotemporal variations of drought and its correlations with remote sensing-based indices via wavelet analysis and clustering methods. Hydrology Res. 53, 175–192. doi:10.2166/nh.2021.104
Grinsted, A., Moore, J. C., and Jevrejeva, S. (2004). Application of the cross wavelet transform and wavelet coherence to geophysical time series. Nonlinear Process Geophys 11, 561–566. doi:10.5194/npg-11-561-2004
Guha, S., and Govil, H. (2021). An assessment on the relationship between land surface temperature and normalized difference vegetation index. Environ. Dev. Sustain. 23, 1944–1963. doi:10.1007/s10668-020-00657-6
He, Y., Guo, X., Dixon, P., and Wilmshurst, J. F. (2012). NDVI variation and its relation to climate in Canadian ecozones. Can. Geogr./Géogr. Can. 56, 492–507. doi:10.1111/j.1541-0064.2012.00441.x
Huang, D., Wang, J., and Khayatnezhad, M. (2021). Estimation of actual evapotranspiration using soil moisture balance and remote sensing. Iran. J. Sci. Technol. Trans. Civ. Eng. 45, 2779–2786. doi:10.1007/s40996-020-00575-7
Huang, Q., Wu, W., Zhang, L., and Li, D. (2010). “MODIS-NDVI-Based crop growth monitoring in China agriculture remote sensing monitoring system,” in 2010 Second IITA International Conference on Geoscience and Remote Sensing, Qingdao, China, 28-31 August 2010, 287–290. doi:10.1109/IITA-GRS.2010.5603948
Huang, T., Ding, X., Zhu, X., Chen, S., Chen, M., Jia, X., et al. (2021). Assessment of poplar looper (apocheima cinerarius erschoff) infestation on euphrates (populus euphratica) using time-series MODIS NDVI data based on the wavelet transform and discriminant analysis. Remote Sens. (Basel) 13, 2345. doi:10.3390/rs13122345
Hussain, A., and Mohammad, T. A. (2018). Indira Gandhi canal project environment and changing scenario of western Rajasthan: a case study. Int. J. Acad. Res. Dev. 3, 15–19.
Hussain, S., Lu, L., Mubeen, M., Nasim, W., Karuppannan, S., Fahad, S., et al. (2022). Spatiotemporal variation in land use land cover in the response to local climate change using multispectral remote sensing data. Land (Basel) 11, 595. doi:10.3390/land11050595
Kalisa, W., Igbawua, T., Henchiri, M., Ali, S., Zhang, S., Bai, Y., et al. (2019). Assessment of climate impact on vegetation dynamics over East Africa from 1982 to 2015. Sci. Rep. 9, 16865. doi:10.1038/s41598-019-53150-0
Kar, A. (2014). Agricultural land use in arid Western Rajasthan: resource exploitation and emerging issues. Agropedology 24 (02), 179–196.
Kaur, S., and Singh, J. (2023). Changing cropping pattern of oilseed crops and its diversification: the case of Thar Desert, Rajasthan (1985-1986 to 2015-2016). OCL - Oilseeds fats, Crops Lipids 30, 13. doi:10.1051/ocl/2023017
Kong, Z., Hart, M., and Liu, H. (2018). Paving the way from the lab to the field: using synthetic microbial consortia to produce high-quality crops. Front. Plant Sci. 9, 1467. doi:10.3389/fpls.2018.01467
Li, M., Wang, T., Chu, F., Han, Q., Qin, Z., and Zuo, M. J. (2021). Scaling-basis chirplet transform. IEEE Trans. Industrial Electron. 68, 8777–8788. doi:10.1109/TIE.2020.3013537
Li, W., Shi, Y., Zhu, D., Wang, W., Liu, H., Li, J., et al. (2021). Fine root biomass and morphology in a temperate forest are influenced more by the nitrogen treatment approach than the rate. Ecol. Indic. 130, 108031. doi:10.1016/j.ecolind.2021.108031
Li, Y., Wu, Y., Tang, J., Zhu, P., Gao, Z., and Yang, Y. (2023). Quantitative evaluation of wavelet analysis method for turbulent flux calculation of non-stationary series. Geophys Res. Lett. 50, e2022GL101591. doi:10.1029/2022GL101591
Liu, Y., Liu, W., and Liang, Z. (2015). Endophytic bacteria from Pinellia ternata, a new source of purine alkaloids and bacterial manure. Pharm. Biol. 53, 1545–1548. doi:10.3109/13880209.2015.1016580
Liu, Z., Xu, J., Liu, M., Yin, Z., Liu, X., Yin, L., et al. (2023). Remote sensing and geostatistics in urban water-resource monitoring: a review. Mar. Freshw. Res. 74, 747–765. doi:10.1071/mf22167
Lu, C., Hou, M., Liu, Z., Li, H., and Lu, C. (2021). Variation characteristic of NDVI and its response to climate change in the middle and upper reaches of yellow River Basin, China. IEEE J. Sel. Top. Appl. Earth Obs. Remote Sens. 14, 8484–8496. doi:10.1109/JSTARS.2021.3105897
Luo, N., Mao, D., Wen, B., and Liu, X. (2020). Climate change affected vegetation dynamics in the northern Xinjiang of China: evaluation by SPEI and NDVI. Land (Basel) 9, 90. doi:10.3390/land9030090
Mahasa, P. S., Xulu, S., and Mbatha, N. (2023). Characterization of evapotranspiration in the orange River Basin of South Africa-Lesotho with climate and MODIS data. WaterSwitzerl. 15, 1501. doi:10.3390/w15081501
Martiny, N., Camberlin, P., Richard, Y., and Philippon, N. (2006). Compared regimes of NDVI and rainfall in semi-arid regions of Africa. Int. J. Remote Sens. 27, 5201–5223. doi:10.1080/01431160600567787
McLeod, A. I. (2016). Kendall rank correlation and mann-kendall trend test. R. package Kendall 602, 1–10.
Meresa, E., and Gebrewhid, Y. (2019). Application of GIS and remote sensing to analyse land use land cover change detection and vegetation dynamics using multi-temporal satellite images; the case of mariamdehan kebele, tigray region, northern Ethiopia. Asian J. Geogr. Res. 2, 1–11. doi:10.9734/ajgr/2019/v2i230079
Moussa Kourouma, J., Eze, E., Negash, E., Phiri, D., Vinya, R., Girma, A., et al. (2021). Assessing the spatio-temporal variability of NDVI and VCI as indices of crops productivity in Ethiopia: a remote sensing approach. Geomatics, Nat. Hazards Risk 12, 2880–2903. doi:10.1080/19475705.2021.1976849
Naga Rajesh, A., Abinaya, S., Purna Durga, G., and Lakshmi Kumar, T. V. (2023). Long-term relationships of MODIS NDVI with rainfall, land surface temperature, surface soil moisture and groundwater storage over monsoon core region of India. Arid Land Res. Manag. 37, 51–70. doi:10.1080/15324982.2022.2106323
Olivoto, T., and Lúcio, A. D. (2020). metan: an R package for multi-environment trial analysis. Methods Ecol. Evol. 11, 783–789. doi:10.1111/2041-210X.13384
Pal, S., and Devara, P. C. S. (2012). A wavelet-based spectral analysis of long-term time series of optical properties of aerosols obtained by lidar and radiometer measurements over an urban station in Western India. J. Atmos. Sol. Terr. Phys. 84–85, 75–87. doi:10.1016/j.jastp.2012.05.014
Park, J., Lee, W. H., Kim, K. T., Park, C. Y., Lee, S., and Heo, T.-Y. (2022). Interpretation of ensemble learning to predict water quality using explainable artificial intelligence. Sci. Total Environ. 832, 155070. doi:10.1016/j.scitotenv.2022.155070
Pei, Y., Qiu, H., Zhu, Y., Wang, J., Yang, D., Tang, B., et al. (2023). Elevation dependence of landslide activity induced by climate change in the eastern Pamirs. Landslides 20, 1115–1133. doi:10.1007/s10346-023-02030-w
Radočaj, D., Šiljeg, A., Marinović, R., and Jurišić, M. (2023). State of major vegetation indices in precision agriculture studies indexed in web of science: a review. Agric. Switz. 13, 707. doi:10.3390/agriculture13030707
Ramos, T. B., Simionesei, L., Oliveira, A. R., Darouich, H., and Neves, R. (2018). Assessing the impact of LAI data assimilation on simulations of the soil water balance and maize development using MOHID-Land. WaterSwitzerl. 10, 1367. doi:10.3390/w10101367
Rhif, M., Abbes, A. B., Martínez, B., Farah, I. R., and Gilabert, M. A. (2022). Optimal selection of wavelet transform parameters for spatio-temporal analysis based on non-stationary NDVI MODIS time series in Mediterranean region. ISPRS J. Photogrammetry Remote Sens. 193, 216–233. doi:10.1016/j.isprsjprs.2022.09.007
Schultz, P. A., and Halpert, M. S. (1993). Global correlation of temperature, NDVI and precipitation. Adv. Space Res. 13, 277–280. doi:10.1016/0273-1177(93)90559-T
Sebastian, D. E., Ganguly, S., Krishnaswamy, J., Duffy, K., Nemani, R., and Ghosh, S. (2019). Multi-scale association between vegetation growth and climate in India: a wavelet analysis approach. Remote Sens. (Basel) 11, 2703. doi:10.3390/rs11222703
Sha, K., Srinivasa, A., and Madhu, D. (2020). The study on variability of NDVI over Kerala using satellite observations. AIP Conf. Proc. 2287, 020013. doi:10.1063/5.0029907
Sha, Z., Bai, Y., Li, R., Lan, H., Zhang, X., Li, J., et al. (2022). The global carbon sink potential of terrestrial vegetation can be increased substantially by optimal land management. Commun. Earth Environ. 3, 8. doi:10.1038/s43247-021-00333-1
Sharma, M., Bangotra, P., Gautam, A. S., and Gautam, S. (2022). Sensitivity of normalized difference vegetation index (NDVI) to land surface temperature, soil moisture and precipitation over district Gautam Buddh Nagar, UP, India. Stochastic Environmental Research and Risk Assessment, 1–11.
Shen, M., Wang, S., Jiang, N., Sun, J., Cao, R., Ling, X., et al. (2022). Plant phenology changes and drivers on the Qinghai–Tibetan Plateau. Nat. Rev. Earth Environ. 3, 633–651. doi:10.1038/s43017-022-00317-5
Simon, M. H., Muschitiello, F., Tisserand, A. A., Olsen, A., Moros, M., Perner, K., et al. (2020). A multi-decadal record of oceanographic changes of the past ∼165 years (1850-2015 AD) from Northwest of Iceland. PLoS One 15, e0239373. doi:10.1371/journal.pone.0239373
Sreedevi, V., Adarsh, S., and Nourani, V. (2021). Multiscale coherence analysis of reference evapotranspiration of north-western Iran using wavelet transform. J. Water Clim. Change 13, 505–521. doi:10.2166/wcc.2021.379
Sun, H., Wang, X., Fan, D., and Sun, O. J. (2022). Contrasting vegetation response to climate change between two monsoon regions in Southwest China: the roles of climate condition and vegetation height. Sci. Total Environ. 802, 149643. doi:10.1016/j.scitotenv.2021.149643
Team R. C. (2020). R Core Team R: a language and environment for statistical computing. Foundation for Statistical Computing.
Thakur, T. K., Dutta, J., Upadhyay, P., Patel, D. K., Thakur, A., Kumar, M., et al. (2022). Assessment of land degradation and restoration in coal mines of central India: a time series analysis. Ecol. Eng. 175, 106493. doi:10.1016/j.ecoleng.2021.106493
Thanabalan, P., Vidhya, R., Kankara, R. S., and Manonmani, R. (2023). Time-series analysis of MODIS (LST and NDVI) and TRMM rainfall for drought assessment over India. Appl. Geomatics 15, 383–405. doi:10.1007/s12518-023-00505-y
Tian, H., Huang, N., Niu, Z., Qin, Y., Pei, J., and Wang, J. (2019). Mapping winter crops in China with multi-source satellite imagery and phenology-based algorithm. Remote Sens. (Basel) 11, 820. doi:10.3390/rs11070820
Tian, H., Pei, J., Huang, J., Li, X., Wang, J., Zhou, B., et al. (2020). Garlic and winter wheat identification based on active and passive satellite imagery and the google earth engine in northern China. Remote Sens. (Basel) 12, 3539–3617. doi:10.3390/rs12213539
Vrieling, A., De Leeuw, J., and Said, M. Y. (2013). Length of growing period over africa: variability and trends from 30 years of NDVI time series. Remote Sens. (Basel) 5, 982–1000. doi:10.3390/rs5020982
Wang, X., Wang, T., Xu, J., Shen, Z., Yang, Y., Chen, A., et al. (2022). Enhanced habitat loss of the Himalayan endemic flora driven by warming-forced upslope tree expansion. Nat. Ecol. Evol. 6, 890–899. doi:10.1038/s41559-022-01774-3
Wickham, H., Averick, M., Bryan, J., Chang, W., McGowan, L., François, R., et al. (2019). Welcome to the tidyverse. J. Open Source Softw. 4, 1686. doi:10.21105/joss.01686
Wu, L., Wang, S., Bai, X., Chen, F., Li, C., Ran, C., et al. (2022). Identifying the multi-scale influences of climate factors on runoff changes in a typical karst watershed using wavelet analysis. Land (Basel) 11, 1284. doi:10.3390/land11081284
Yan, Y., Jarvie, S., Liu, Q., and Zhang, Q. (2022). Effects of fragmentation on grassland plant diversity depend on the habitat specialization of species. Biol. Conserv. 275, 109773. doi:10.1016/j.biocon.2022.109773
Yang, Y., Liu, L., Zhang, P., Wu, F., Wang, Y., Xu, C., et al. (2023). Large-scale ecosystem carbon stocks and their driving factors across Loess Plateau. Carbon Neutrality 2, 5. doi:10.1007/s43979-023-00044-w
Yin, L., Wang, L., Ge, L., Tian, J., Yin, Z., Liu, M., et al. (2023). Study on the thermospheric density distribution pattern during geomagnetic activity. Appl. Sci. Switz. 13, 5564. doi:10.3390/app13095564
Yin, L., Wang, L., Keim, B. D., Konsoer, K., and Zheng, W. (2022). Wavelet analysis of dam injection and discharge in three gorges dam and reservoir with precipitation and river discharge. WaterSwitzerl. 14, 567. doi:10.3390/w14040567
Zeren Cetin, I., Varol, T., and Ozel, H. B. (2023). A geographic information systems and remote sensing–based approach to assess urban micro-climate change and its impact on human health in Bartin, Turkey. Environ. Monit. Assess. 195, 540. doi:10.1007/s10661-023-11105-z
Zhang, D., Wu, L., Niu, X., Guo, Z., Zhang, Z., Li, S., et al. (2022). Looking for ecological sustainability: a dynamic evaluation and prediction on the ecological environment of the belt and road region. Sustain Prod. Consum. 32, 851–862. doi:10.1016/j.spc.2022.06.007
Zhang, S., Bai, X., Zhao, C., Tan, Q., Luo, G., Wang, J., et al. (2021). Global CO2 consumption by silicate rock chemical weathering: its past and future. Earths Future 9, e2020EF001938. doi:10.1029/2020EF001938
Zhao, Y., Hou, P., Jiang, J., Zhao, J., Chen, Y., and Zhai, J. (2023). High-spatial-resolution NDVI reconstruction with GA-ANN. Sensors 23, 2040. doi:10.3390/s23042040
Zheng, K., Ye, J. S., Jin, B. C., Zhang, F., Wei, J. Z., and Li, F. M. (2019). Effects of agriculture, climate, and policy on NDVI change in a semi-arid river basin of the Chinese Loess Plateau. Arid Land Res. Manag. 33 (3), 321–338. doi:10.1080/15324982.2018.1555562
Zhou, J., Wang, L., Zhong, X., Yao, T., Qi, J., Wang, Y., et al. (2022). Quantifying the major drivers for the expanding lakes in the interior Tibetan Plateau. Sci. Bull. (Beijing) 67, 474–478. doi:10.1016/j.scib.2021.11.010
Keywords: normalized difference vegetation index, wavelet transformation, multiscale time–frequency decomposition, Mann–Kendall test, arid environment
Citation: Sonia , Sunita , Ghosh T, Amari A, Yadav VK, Osman H, Sahoo DK and Patel A (2023) Appraisal of long-term responsiveness of normalized difference vegetation index to climatic factors using multiscale time–frequency decomposition in an arid environment. Front. Earth Sci. 11:1265292. doi: 10.3389/feart.2023.1265292
Received: 22 July 2023; Accepted: 28 September 2023;
Published: 19 October 2023.
Edited by:
Fang Chen, Chinese Academy of Sciences (CAS), ChinaReviewed by:
Friday U. Ochege, University of Port Harcourt, NigeriaCopyright © 2023 Sonia, Sunita, Ghosh, Amari, Yadav, Osman, Sahoo and Patel. This is an open-access article distributed under the terms of the Creative Commons Attribution License (CC BY). The use, distribution or reproduction in other forums is permitted, provided the original author(s) and the copyright owner(s) are credited and that the original publication in this journal is cited, in accordance with accepted academic practice. No use, distribution or reproduction is permitted which does not comply with these terms.
*Correspondence: Tathagata Ghosh, dGF0aGFnYXRhd29ya0BnbWFpbC5jb20=; Abdelfattah Amari, YWJkZWxmYXR0YWguYW1hcmlAZW5pZy5ybnUudG4=; Dipak Kumar Sahoo, ZHNhaG9vQGlhc3RhdGUuZWR1; Ashish Patel, dW5pLmFzaGlzaEBnbWFpbC5jb20=
Disclaimer: All claims expressed in this article are solely those of the authors and do not necessarily represent those of their affiliated organizations, or those of the publisher, the editors and the reviewers. Any product that may be evaluated in this article or claim that may be made by its manufacturer is not guaranteed or endorsed by the publisher.
Research integrity at Frontiers
Learn more about the work of our research integrity team to safeguard the quality of each article we publish.