 Sui Wang
 Yuanqiang Cai1
 Peng Zhao
94% of researchers rate our articles as excellent or good
Learn more about the work of our research integrity team to safeguard the quality of each article we publish.
Find out more
ORIGINAL RESEARCH article
Front. Earth Sci., 28 December 2023
Sec. Geohazards and Georisks
Volume 11 - 2023 | https://doi.org/10.3389/feart.2023.1265131
This article is part of the Research TopicInstability Mechanism and Disaster Prevention of the Jointed RockmassView all 11 articles
Long-term cyclic tests for different frequencies were carried out on remolded soft clay with different sand contents, investigating how the frequency impacted the stress–strain, the dynamic shear modulus, and the damping ratio of the remolded samples. Accordingly, when the sand content of the remolded specimen was 1.7%, the slope of the hysteresis curve of the remolded specimen tended to increase gradually with the increasing frequency, the hysteresis circle was slender, and the area of the hysteresis circle tended to decrease gradually; when the sand content of the remolded specimen was 20%, the cumulative deformation of the specimen presented a gradual increase with the loading frequency, and the slope of the hysteresis curve decreased gradually. The hysteresis curve shows a gradually decreasing slope, and the enclosed hysteresis circle area also tends to decrease. In addition, the higher the loading frequency, the stronger the deformation-resistant ability held by the specimen, particularly because the pore water pressure between soils’ internal particles is not discharged in time, which makes the contact between the internal particles of the soil close, and the closer the structure of the soil, the smaller the compressive deformation of the soil, and the more stable the soil.
Soft clay is a special soil mass formed by marine and lacustrine sediments in coastal, lake, swamp, and river bay areas in modern times. It features high water content, strong compressibility, weak strength, low permeability, strong sensitivity, and rheology (Andersen, 1977; Talesnick and Frydman, 1992; France and Sangrey, 1997; Guo et al., 2013; Sangrey et al., 1997; Guo et al., 2016; Qian et al., 2016; Patel et al., 2017; Qian et al., 2017; Ecemis, 2021). Among them, according to the survey results of Ningbo Metro, there is a large number of loose sand interlayers, with a thickness of approximately 10 cm in the soft clay of metro tunnel engineering. According to the design code, this kind of interlayer has almost no influence on the evaluation of foundation liquefaction; however, its seismic liquefaction can cause dramatic changes in stratum deformation, which will cause the subway tunnel to bear huge additional horizontal thrust and cause damage to the subway tunnel. Therefore, there is a contradiction between the evaluation results of foundation liquefaction and the potential damage to subway tunnels. It is of great significance for engineering investigation and subway tunnel design to fully consider the seismic liquefaction of such sand interlayers, deeply study the dynamic characteristics of soft clay with different sand contents, and propose relevant engineering reinforcement measures for its failure form.
Tasiopoulou et al. (2018), Zhao et al. (2018), and Jain et al. (2023) have performed corresponding experimental studies on the dynamic characteristics exhibited by the mixed soil with sand particles in the clay. Yamada, S, et al. (2008) mixed quartz sand with medium-plastic clay in different proportions, measured the dynamic characteristics exhibited by the clay–sand mixture through a cyclic torsion single shear test, and proposed the empirical formula of the dynamic shear modulus (DSM), damping ratio (DR), and shear strain (SS) relationship curve of the remolded clay–sand mixture. Li et al. (2013) paid attention to how confining pressure affected the dynamic characteristics exhibited by remolded red clay through a resonant column test and pointed out that when SS is the same, DSM presents an uptrend and DR presents a downtrend with the confining pressure. Zhao et al. (2015) comparatively examined the DR of undisturbed and remolded sandy mudstone weathered soil through a dynamic triaxial test, finding that when the shear strain value is the same, undisturbed soil shows a larger DR value than plastic soil. Huang et al. (2015) focused on how the fines content affected the dynamic characteristics exhibited by remolded loess using a resonance column test. Research shows that the increase in the fines content is accompanied by decreased DSM and DR of remolded loess. Guo (1998) studied and analyzed a large number of engineering research results and pointed out that in the case of the coarse particle content being less than 30%, a larger coarse particle content reports a smaller permeability coefficient of the mixed soil, and its permeability characteristics are determined by the soil mass and conform to Darcy’s law. In the case of a coarse particle content over 75%, the permeability coefficient increases with the coarse particle content, and its permeability characteristics are determined by the coarse particles but not in accordance with Darcy’s law. The rock content has a significant impact on its hydraulic damage. Xu (2008) further studied the permeability of the mixture and found that its permeability coefficient was between KME (calculated value of the Maxwell–Eucken model) and KEME (calculated value of the effective medium theoretical model). Miller and Sowers (1958) took the maximum dry density as the control factor, carried out consolidated undrained triaxial shear tests on clay–sand mixtures with different sand contents, and pointed out that the impact of sand content on mixed soils’ shear strength has a limit value. Vallejo and Zhou (1994) studied the strength law of soil–sand mixed soil through a direct shear test and reached the conclusion that the limit sand content range is 50%–80%. Vallejo and Mawby (2000) further calculated the porosity of soil–sand mixed soil through theory and finally corrected its limit sand content to 40%–75%. Yamamuro and Covert (2001) and Prakasha and Chandrasekaram (2005) studied the effect of the effective void ratio of the clay–sand mixture on its mechanical properties. Bolton (2000) studied the clay–sand mixed soil and believed that its permeability was closely related to the effective stress and consolidation state. Shi et al. (2011) conducted some indoor tests on laterite with different sand contents and pointed out that the laterite mixed with sand reduced the cohesion, increased the internal friction angle, increased the shear strength, and had an optimal range of the sand content. Zhang et al. (2010) prepared the mixed soil by adding 0%–50% quartz sand to bentonite, found that its cohesion and internal friction angle decreased as the sand mixing rate increased, and statistically estimated that its limit sand mixing amount was 54%–79%. Deng et al. (2012, 2014) designed the indoor direct shear test for the clay–sand mixture, analyzed how the sand content and water content impacted its shear strength, and reached the conclusion that the limit sand content is 50%–70%.
Above all, scholars have conducted little research on the physical and mechanical properties exhibited by soil–sand mixed soil, and even less on muddy soil–sand mixed soil. However, with the continuous progress of rail transit, the treatment of muddy soil–sand mixed soil in tunnel excavation and soft foundation becomes more common; therefore, further research shall be conducted on the soft soil geology.
The British Global Digital Systems (GDS) bidirectional dynamic triaxial test system was adopted (Figure 1). The experimental system has the following six parts: the axial power system, triaxial pressure chamber, dynamic confining pressure loading system, confining pressure controller, backpressure controller, and signal control system (DCS). The GDS test system collects the axial stress, strain, pore pressure, and other data during the vibration process of the sample through the computer (GDS-LAB) and converts DEM, DR, and other indicators through data analysis. The system bears dynamic load, deformation, and stress of up to 10 Hz. The axial load is driven by the base screw driven by a motor, and the axial force and axial deformation are applied from the base of the pressure chamber.
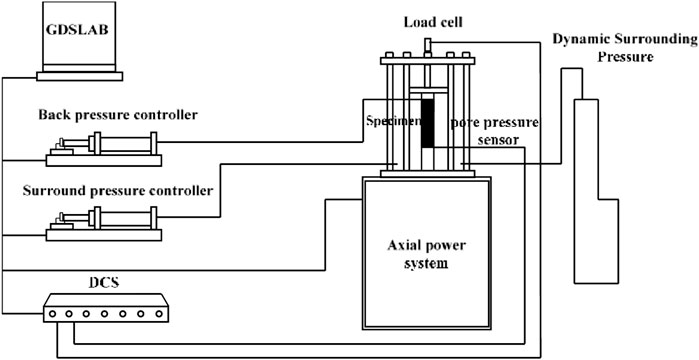
FIGURE 1. GDS bidirectional dynamic triaxial test system.
1) First, a wooden hammer is used to break up the dried soil sample; then, the soil sample is allowed to pass through a 1-mm sieve. The screened soil sample is reserved for standby. 2) The screened air-dried soil is then sieved using a 0.075-mm sieve, and the soil sample obtained after sieving is muddy silt. 3) Preparation of sand is performed as follows: the air-dried soil is sieved using a 0.075-mm sieve and washed with water, and the muddy silt is fully dissolved in water by continuous shaking during the washing process. The washing time should be no less than 20 min, then the washed sand is air-dried for standby. 4) Preparation of remolded samples that have the same moisture content and dry density as the undisturbed soil samples, according to the samples with different sand contents required for the test. 5) Following the Code for Geotechnical Testing (GB/T50123-1999), the dry broken soil with different sand contents should be prepared with distilled water in a soil sample with the same moisture content as the undisturbed sand soft clay and then sealed with a fresh film. In order to make the soil sample fully absorb water and evenly distribute water in the drawing, the prepared remolded soil sample shall be placed in a cool and humid environment for more than 24 h. 6) Vaseline is applied on the inner wall of the three valves to make them fully smooth and reduce the friction between the soil sample and the ring knife inner wall during the test. 7) The mass M of the soil sample is filled into the three valves in five layers into the ring knife, and it is compacted layer by layer. 8) The prepared sample is put into the vacuum cylinder for vacuum saturation, and the sample is prepared. 9) The prepared remolded soil samples with different sand contents are tested on the dynamic triaxial apparatus. Figure 2 demonstrates the process of preparing the remolded soil sample.
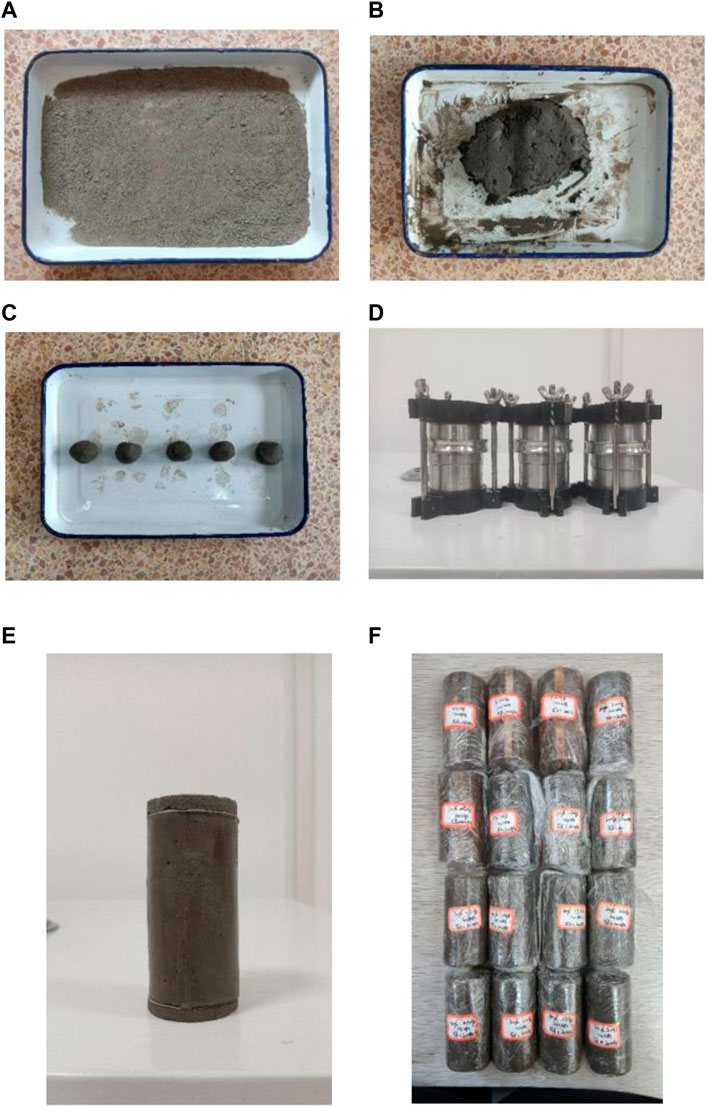
FIGURE 2. Preparation of soft clay specimens with different sand content remodeling samples.
The soil sample is taken from the remolded sample of Ningbo Metro Line 6 in Zhejiang province, with a depth of 5 m–10 m. Table 1 lists soil samples’ basic physical parameters.
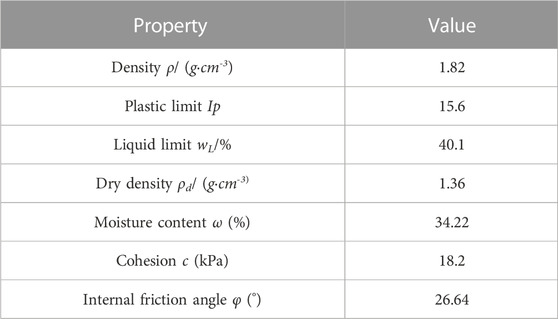
TABLE 1. Soil samples’ basic physical parameters.
The prepared remolded soil sample is placed into the vacuum saturator for vacuum pumping. When the vacuum pressure is expressed to negative pressure, the vacuum pressure is kept in the cylinder for no less than 1 h and it is allowed to stand for more than 10 h. In order to ensure that the saturation reaches more than 95%, if it fails to meet the requirements, the sample is saturated by backpressure before the test until the sample saturation meets the requirements.
After saturation, the sample is under effective confining pressure σ. The isotropic consolidation is carried out at σ3′=100 kPa, and the consolidation is considered to be completed when the B-t curve tends to be flat and the pore pressure drops to equal to the back pressure. The cyclic loading mode is stress-controlled loading, and the dynamic stress waveform is the sine wave. The frequency range of the dynamic wave loaded on a soft soil foundation is 0.1–10 Hz, but mainly 1∼2 Hz. For investigating how vibration frequency impacted saturated soft clay with the sand interlayer, the vibration frequency of this experiment is 0.5 Hz, 1.0 Hz, 1.5 Hz, and 2.0 Hz. In order to measure the cyclic axial bias stress, the axial cyclic stress ratio rc is introduced, as shown in Table 2.
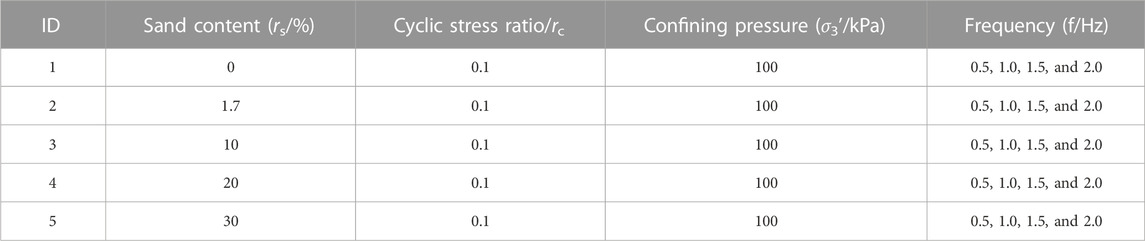
TABLE 2. Pilot scenarios.
During the test, axial deformation, axial stress, pore pressure, and other data are collected and processed by a computer. When the double-amplitude axial strain of the sample reaches 5% or the loading times reach the set loading times, the test is terminated.
In addition, DSM serves as a significant parameter of soil mechanics, referring to soils’ non-deformability under dynamic load, i.e., the size of stiffness. In the data file automatically collected by the computer, the data are selected, the stress–strain hysteresis curve at different stages is drawn, and the slope of a vibration cycle is calculated, which is the dynamic elastic modulus (Gd) of the soil given as follows:
The damping ratio denotes the nature of dissipation of soil energy due to internal resistance under dynamic stress, which is usually calculated by the following equation:
where ΔW represents the energy lost by the soil under a cyclic vibration, equal to the area surrounded by the hysteretic curve (Figure 3); and W is the total energy stored under one cycle of vibration, i.e., the triangle OAB area shown in Figure 3.
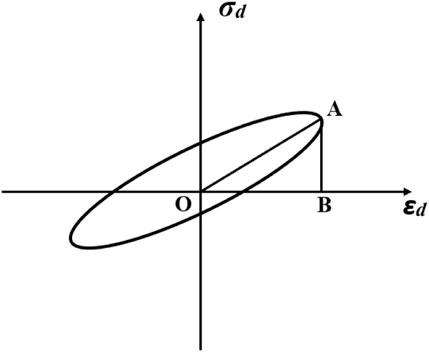
FIGURE 3. Schematic diagram of the hysteretic curve.
Figure 4 shows the cumulative axial deformation regarding remolded soft clay under different sand contents at the same frequency as the change curve of vibration times. The dynamic characteristics and deformation exhibited by remolded soft clay with different sand contents under a long-term cyclic load are analyzed by drawing.
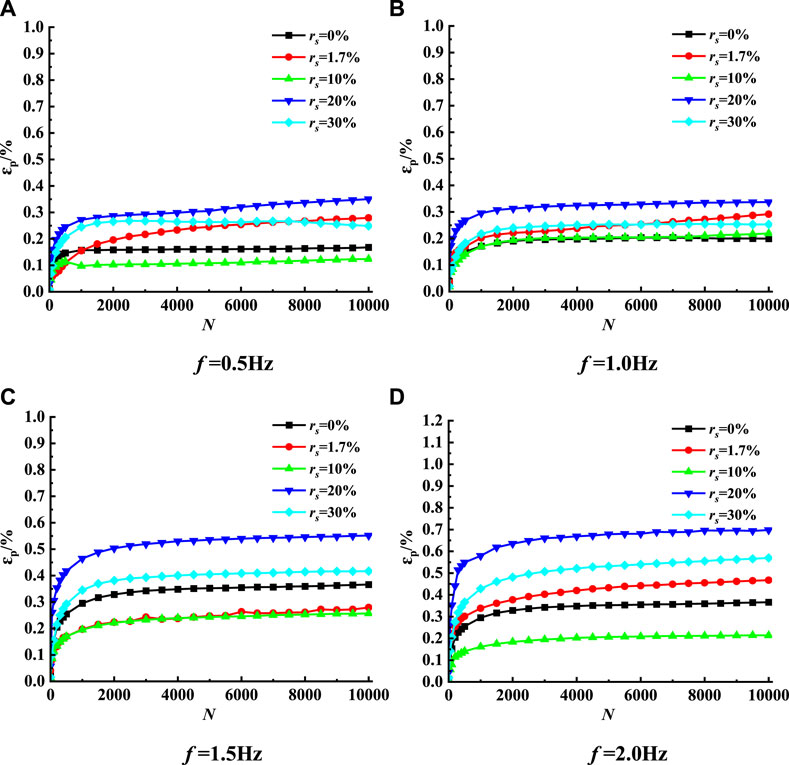
FIGURE 4. Axial cumulative strain of soft clay with cycles for different frequencies.
Under the same frequency, when rs<20%, when the samples’ cumulative strain increases with the sand content, the influence of the sand particles inside the sample on the samples’ skeleton is not notable, and the deformation of the soil is mainly borne by fine-grained soft clay; when rs>20%, the content of sand particles in the sample will make the mechanical properties of the sample unstable, resulting in large cumulative axial deformation. At the same time, the influence of the sand content of the sample in the critical state (i.e., rs =20%) on the cumulative axial deformation will increase with the increase in frequency.
Figure 5 shows the cumulative axial deformation of remolded soft clay under the same sand content at different frequencies versus the number of vibrations. The dynamic characteristics and deformation of remolded soft clay under a long-term cyclic load at different frequencies are analyzed by drawing.
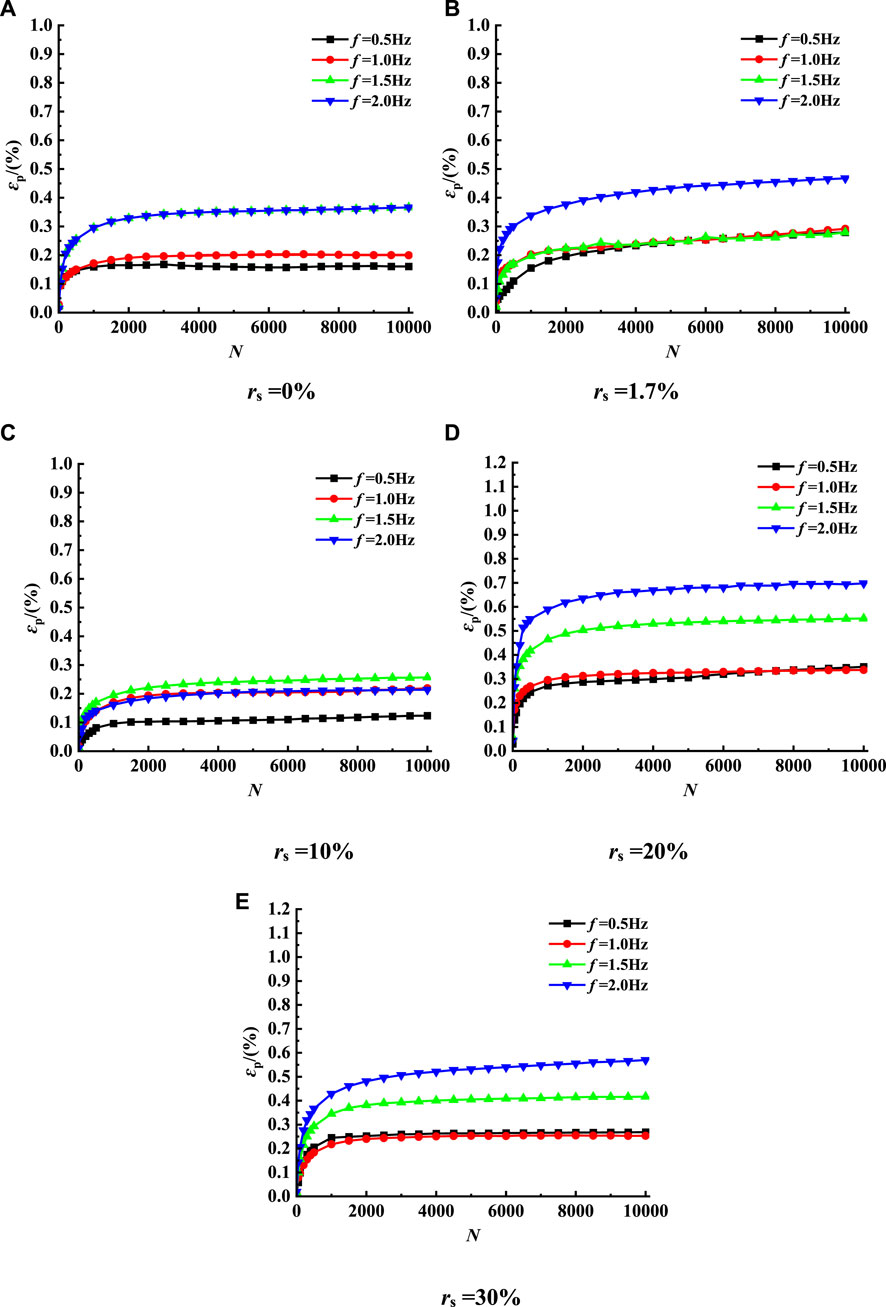
FIGURE 5. Axial cumulative strain with cycles of soft clay for different sand contents.
According to Figure 5, for remolded soil samples with different frequencies, when the sand content is 0%, the influence of frequency on the vertical strain is not significant. Figure 5A shows that there is little difference in strain development when the frequency is 0.5 Hz and 1 Hz. When the frequency is 1.5 Hz and 2 Hz, the strain development is basically the same, but the strain is relatively large; when the sand content is 1.7%, it can be seen from Figure 5B that the strain at f =2 Hz is the highest, while the strain development at the other three frequencies is basically the same; when the sand content is 10%, it can be seen from Figure 5C that the strain is the highest at f =1.5Hz, the strain development is basically the same at f=2 Hz and f =1Hz, and the strain is the lowest at f =0.5Hz; when the sand content is 20%, it can be seen from Figure 5D that the higher the frequency, the greater the strain; when the sand content is 30%, it can be seen from Figure 5E that the difference in strain development is very small and basically the same when the frequency is 0.5Hz and 1 Hz, implying that the greater the frequency, the greater the strain. Therefore, the frequency is not significant for the strain development pattern under different sand content rates. However, it also shows that the sand content has a great influence on the cumulative axial deformation of the sample.
Figure 6 and Figure 7 demonstrate the hysteretic curves of remolded soft clay with different sand contents at different frequencies, in which the sand contents of 1.7% and 20% are taken as representative for comparative analysis.
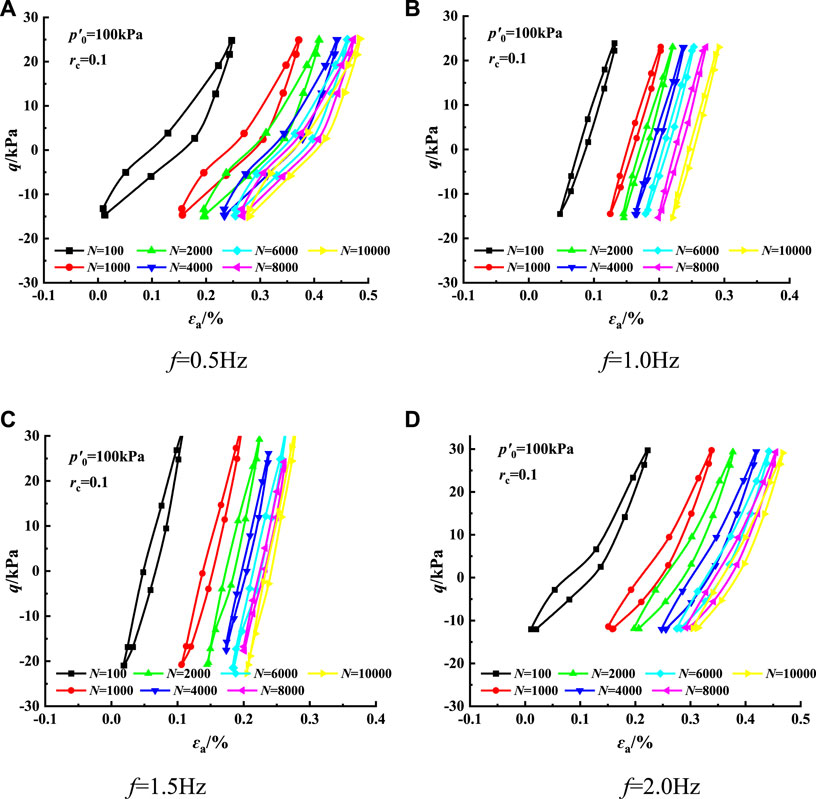
FIGURE 6. rs=1.7% dynamic stress–strain relationship graph.
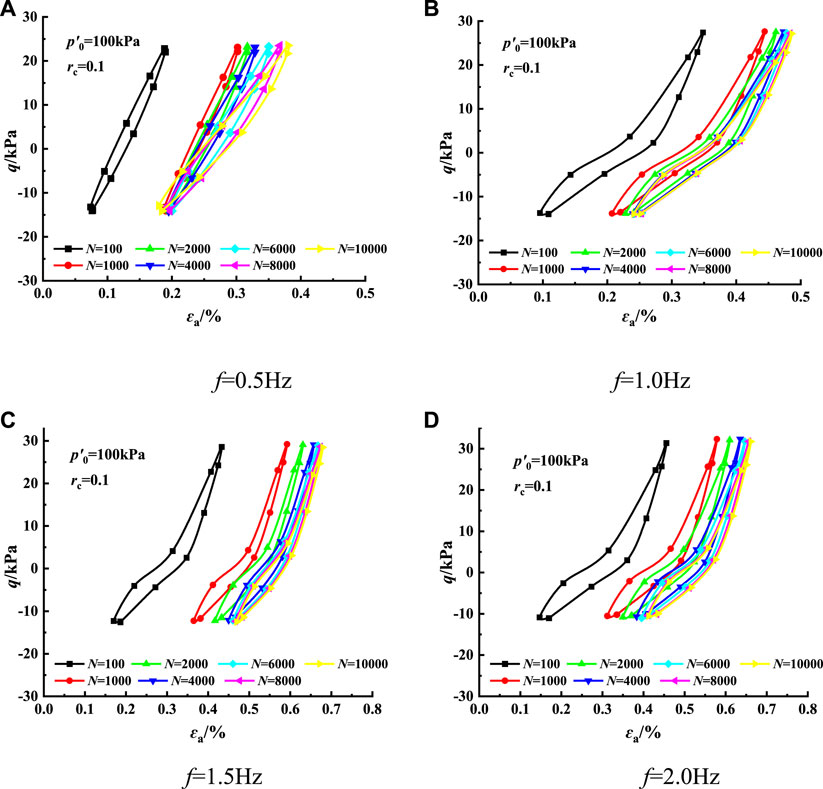
FIGURE 7. rs=20% dynamic stress–strain relationship graph.
According to Figure 6 and Figure 7, the hysteresis curve of saturated remolded soft clay shows a series of closed hysteresis loops when the sample sand is 1.7%. When the cyclic loading begins, the hysteresis loop is relatively narrow and steep, indicating that the slope is relatively large and dense. As the number of cycles increases, the hysteresis loop slowly shifts to the positive direction of the x-axis, that is, to the direction of strain increase, which indicates a gradual increase in remolded samples’ cumulative plastic strain. At the same time, as the number of cycles increases, the hysteresis loop is gradually lengthened, the slope is gradually reduced, and the area enclosed by the hysteresis loop is also gradually reduced. This shows the attenuation of DSM and the increase in the DR of remolded soil samples under cyclic action.
In addition, when the sand content of the remolded sample is 1.7% of that of the undisturbed sample, the hysteresis curve slope of the remolded sample presents a slow increase with the frequency, the enclosed hysteresis loop is thin and long, and the hysteresis loop area has a trend of gradually decreasing; when the sand content of the remolded sample is 20%, the cumulative deformation of the sample gradually increases with the loading frequency, the hysteresis curve slope gradually decreases, and the enclosed hysteresis loop area also decreases. The test shows that the remolded soft clay’s DSM and DR are related to the sand content. The relationship between sand content and DSM and DR is examined by drawing the change curve of the two parameters under different conditions.
According to Figure 8, the DSM of remolded samples at different frequencies presents different change rules. When f=0.5Hz, the DSM of samples presents a non-linear increase with the sand content and reaches the maximum value when rs=20%. As the frequency increases, DSM at initial vibration approaches the DSM at the final cycle; when the load frequency f=2.0 Hz and rs<10%, the DSM of the remolded sample increases with the sand content. When rs>10%, the DSM of the sample is reduced gradually and tends to be stable.
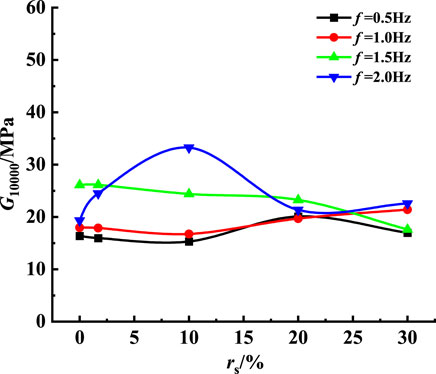
FIGURE 8. Final DSM of soft clay for different sand contents.
According to Figure 9, the change in DR at different frequencies is similar to the change in DSM, with different change trends. The change trend of the DR of the remolded sample is just opposite to that of the DSM. When f=0.5Hz, the DR of the sample changes non-linearly with the increased sand content and reaches the lowest critical value when rs=30%. At the same time, as the frequency increases, the DR of the initial vibration of the sample is closer to that of the final cycle; when the load frequency f=2.0 Hz and rs<10%, the DR of the remolded sample increases with the sand content. When rs>10%, DR decreases gradually and tends to be stable.
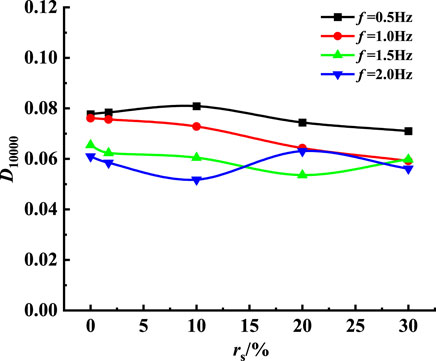
FIGURE 9. Final damping ratio of soft clay for different frequencies.
The influence mechanism of frequency on remolded mixed clay–sand can be concluded as follows: when the confining pressure and cyclic dynamic stress are the same, the higher the loading frequency and the stronger the sample’s ability to resist deformation. This is mainly because the higher the loading frequency, the shorter the time taken to discharge the pore water pressure between soil particles, rendering the particles in the soil in close contact, the closer the soil structure, the smaller the compression deformation of the soil, and the more stable the soil. When the load is the same, a higher frequency reports a smaller final DR, primarily because with the increase in frequency, the particle contact in the sample becomes closer, there are fewer pores, the propagation path of the wave is also increased, and the propagation speed is faster; so, the energy consumed during wave propagation is reduced so that the DR of the energy loss parameters of the remolded sample with different sand contents will also be reduced after the vibration.
Figure 10 shows the change curve of the final DSM of remolded soft clay with frequency under different sand contents. In samples with a stable sand content, DSM increases with the frequency because the higher the load frequency, the shorter of time for which the dynamic stress of the same size acts on the soil, the shorter of time for which axial deformation occurs. According to the formula of DSM, the smaller the strain value per unit time, the greater the DSM. In the case of the sand content rs < 20%, the DSM of the sample presents a significant increase trend; when rs=20%, the final DSM decreases as the frequency increases. However, when rs =30%, the final DSM tends to increase first, then decrease, and then increase again.
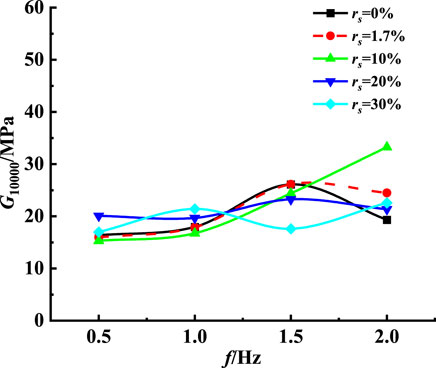
FIGURE 10. Final DSM of soft clay for different frequencies.
Figure 11 shows the change curve of the final DR of remolded soft clay with frequency under different sand contents. The changes in the DR and DSM of samples that have various sand contents also have similar changes, reaching the critical value when the sand content rs=20%, that is, when rs<20%, the resistance ratio of the sample has a significant downward trend; when rs>20%, the DR of remolded samples has a significant upward trend.
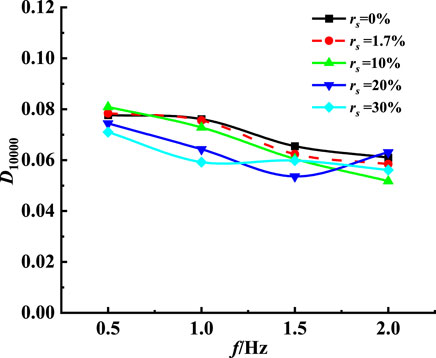
FIGURE 11. Final DR of soft clay for different frequencies.
According to Figure 10 and Figure 11, when the sand content in the soil is high, soft soil particles are mainly filled in the pores of sand particles and slightly affect the soil skeleton composition; when the sand content in the soil is small, the soft soil particles are wrapped with sand particles to form the skeleton of the soil, and the way sand particles affect the skeleton of the soil can be ignored. During the gradual increase in the sand content, there is a critical state of rs=20%. At this time, the soft soil particles in the soil body not only do not participate in the formation of the soil skeleton but also reduce the content of sand particles that constitute the soil skeleton, exacerbating the instability of the macroscopic mechanical characteristics exhibited by the soil body, resulting in a small dynamic stress corresponding to the same dynamic strain, a decrease in DSM, and an increase in DR.
A large number of soft clay samples with different sand contents were conducted; the effects of frequency, sand content on shear modulus, and damping ratio were studied. The following conclusions can be drawn:
1) When the sand content of the remolded sample is 1.7% of that of the undisturbed sample, the hysteretic curve slope of the remolded sample increases slowly with the frequency, the enclosed hysteretic loop becomes thin and long, and the area of the hysteretic loop has a trend of gradual decrease; when the sand content of the remolded sample is 30%, the cumulative deformation of the sample will gradually increase with the loading frequency, the hysteresis curve slope will decrease slowly, and the enclosed hysteresis loop area will also decrease.
2) When the confining pressure and cyclic dynamic stress are the same, the higher the loading frequency, the stronger the sample’s ability to resist deformation. This is mainly because the higher the loading frequency, the less time taken to discharge the pore water pressure between the soil particles, rendering the particles inside the soil in close contact, the tighter the soil structure, the smaller the compression deformation of the soil, and the more stable the soil.
3) When the sand content in the soil is small, the soft soil particles are wrapped with sand particles to form the skeleton of the soil, and the way sand particles affect the soil skeleton can be ignored. When the sand content is gradually elevated, there is a critical state of rs=20%. At this time, the soft soil particles in the soil body not only do not participate in the formation of the soil skeleton but also reduce the content of sand particles that constitute the soil skeleton, exacerbating the instability of the macroscopic mechanical properties of the soil body, resulting in a small dynamic stress corresponding to the same dynamic strain, a decrease in DSM, and an increase in DR.
The raw data supporting the conclusion of this article will be made available by the authors, without undue reservation.
SW: data curation, investigation, writing–original manuscript, and writing–review and editing. YC: investigation, methodology, and writing–review and editing. LZ: investigation, methodology, writing–original manuscript, and writing–review and editing. YP: investigation, methodology, formal analysis, and writing–review and editing. BC: investigation, methodology, and writing–review and editing. PZ: investigation, methodology, and writing–review and editing.
The author(s) declare financial support was received for the research, authorship, and/or publication of this article. The work presented in this paper was sponsored by the Supported by Systematic Project of Key Laboratory of New Technology for Construction of Cities in Mountain Area (No. LNTCCMA-20200104), the Systematic Project of Guangxi Key Laboratory of Disaster Prevention and Structural Safety (No. 2019ZDK005), the Initial Scientific Research Fund of Young Teachers in Ningbo University of Technology (2019A610394), and the Ningbo Public Welfare Science and Technology Planning Project (No. 2019C50012).
These financial supports are gratefully acknowledged.
Authors SW, LZ, and YP were employed by Zhejiang Engineering Survey and Design Institute Group Co., Ltd.
The remaining authors declare that the research was conducted in the absence of any commercial or financial relationships that could be construed as a potential conflict of interest.
All claims expressed in this article are solely those of the authors and do not necessarily represent those of their affiliated organizations, or those of the publisher, the editors, and the reviewers. Any product that may be evaluated in this article, or claim that may be made by its manufacturer, is not guaranteed or endorsed by the publisher.
Andersen, K. H. (1977). “Effect of cyclic loading on clay behaviour,” in Proc. BOSS ICE London, 75–79.
Bolton, A. J. (2000). Some measurements of permeability and effective stress on a heterogeneous soil mixture: implications for recovery of inelastic strains. Eng. Geo-logy 57, 95–104. doi:10.1016/s0013-7952(00)00019-3
Cai, Y., Gu, C., Wang, J., Juang, C. H., Xu, C., and Hu, X. (2013). One-way cyclic triaxial behavior of saturated clay: comparison between constant and variable confining pressure. J. Geotechnical Geo-environmental Eng. 139 (5), 797–809. doi:10.1061/(asce)gt.1943-5606.0000760
Deng, T. F., Ai, Z. W., Luo, S. H., and Gui, Y. (2014). Experimental study on shear characters of clay-sand mixture. People's Yangtze River 45 (9), 95–101. (In Chinese). doi:10.3969/j.issn.1001-4179.2014.09.026
Deng, T. F., Gui, Y., Luo, S. H., and Zhou, J. P. (2012). Study on slope stability of granite residual soil cutting excavation with rainfall. J. Earth Sci. Environ. 34 (4), 88–94. (In Chinese). doi:10.3969/j.issn.1672-6561.2012.04.012
Ecemis, N. (2021). Experimental and numerical modeling on the liquefaction potential and ground settlement of silt-interlayered stratified sands. Soil Dyn. Earthq. Eng. 144 (10), 106691. doi:10.1016/j.soildyn.2021.106691
France, J. W., and Sangrey, D. A. (1997). Effects of drainage in repeated loading of clays. J. Geotechnical Eng. 103GT (7), 769–785. doi:10.1061/ajgeb6.0000454
GB/T 500123-1999 (1999). Standard for soil test methods. GB/T 500123-1999 [S]. Beijing: Ministry of Water Resources of the People's Republic of China. (In Chinese).
Guo, L., Chen, J., Wang, J., Cai, Y., and Deng, P. (2016). Influences of stress magnitude and loading frequency on cyclic behavior of K0-consolidated marine clay involving principal stress rotation. Soil Dyn. Earthq. Eng. 84, 94–107. doi:10.1016/j.soildyn.2016.01.024
Guo, L., Wang, J., Cai, Y. Q., Liu, H. L., Gao, Y. F., and Sun, H. L. (2013). Undrained deformation behavior of saturated soft clay under long-term cyclic loading. Soil Dyn. Earthq. Eng. Soil Dyn. Earthq. Eng. 50, 28–37. doi:10.1016/j.soildyn.2013.01.029
Guo, Q. G. (1998). Engineering characteristics and application of coarse-grained soil [M]. Zhengzhou: Yellow River Water Conservancy Press. (In Chinese).
Huang, Z. Q., Li, L., Jia, J. C., Yue, K. X., and Sun, Y. (2015). Study of resonant column experiment of dynamic shear module and damping ratio of unsaturated loess. People's Yangtze River 46 (5), 69–72. (In Chinese). doi:10.16232/j.cnki.1001-4179.2015.05.016
Hyde, A. F. L., and Ward, S. J. (1986). The effect of cyclic loading on the undrained shear strength of a silty clay. Mar. Geotechnol. 6 (3), 299–314. doi:10.1080/10641198609388192
Idriss, I. M., Dobry, R., and Singh, R. D. (1978). Nonlinear behavior of soft clays during cyclic loading. J. Soil Mech. Found. 104 (12), 1427–1447. doi:10.1061/ajgeb6.0000727
Jain, A., Mittal, S., and Shukla, S. K. (2023). Liquefaction proneness of stratified sand-silt layers based on cyclic triaxial tests. J. Rock Mech. andGeotechnical Eng. 15 (7), 1826–1845. doi:10.1016/j.jrmge.2022.09.015
Kammerer, A. M., Seed, B., and Wu, J. (2004). Pore water development in liquefiable soils under bi-directional loading conditions. Proc. 11th Int. Conf. Soil Dyn. Earthq. Eng. 2, 697.
Li, J., Chen, S. X., Jiang, L. F., and Xiong, S. D. (2013). Resonant column teston dynamic shear modulus and damping ratio of the remolded red clay. J. Sichuan Univ. Eng. Sci. Ed. 45 (4), 62–68. (In Chinese). doi:10.15961/j.jsuese.2013.04.003
Liang, R. Y., and Ma, F. J. (1992). Anisotropic plasticity model for undrained cyclic behavior of clays. I: theory. J. Geotechnical Eng. 118 (2), 229–245. doi:10.1061/(asce)0733-9410(1992)118:2(229)
Matsui, T., Bahr, M., and Abe, N. (1992). Estimation of shear characteristics degradation and stress-strain relationship of saturated clays after cyclic loading. Soil Found. 32 (1), 161–172. doi:10.3208/sandf1972.32.161
Miller, E. A., and Sowers, G. F. (1958). The strength characteristics of soil-aggregate mixtures. Highw. Res. Board Bull. (183), 16–32.
Narasimha, R. S. (2003). Behaviour of marine clay under wave type of cyclic loading. Proceedings of the international conference on off-shore mechanics and arctic engineering-OMAE 3, 495–503.
Patel, A., Ingale, R., and Bhanarkar, K. B. (2017). Effect of compaction states and the confining pressure on Poisson’s ratio of stratified and non-stratified soils. Arab. J. Sci. Eng. 1-17, 1983–1999. doi:10.1007/s13369-017-2846-y
Prakasha, K. S., and Chandrasekaram, V. S. (2005). Behavior of marine sand-clay mixtures under static and cyclic triaxial shear. J. geotechnical geoenvironmental en-gineering 131 (2), 213–222. doi:10.1061/(asce)1090-0241(2005)131:2(213)
Qian, J. G., Du, Z. B., and Yin, Z. Y. (2017). Cyclic degradation and non-coaxiality of soft clay subjected to pure rotation of principal stress directions. Acta Geotech. 14 (3), 943–959. doi:10.1007/s11440-017-0567-8
Qian, J. G., Wang, Y. G., Yin, Z. Y., and Huang, M. S. (2016). Experimental identification of plastic shakedown behavior of saturated clay subjected to traffic loading with principal stress rotation. Eng. Geol. 214 (1), 29–42. doi:10.1016/j.enggeo.2016.09.012
Seed, H. B., and Lee, K. L. (1966). Liquefaction of saturated sands during cyclic loading. J. Soil Mech. Found. Div. 92 (6), 105–134. doi:10.1061/jsfeaq.0000913
Shi, C. X., Huang, Y., Yang, Y. T., Feng, H., and Bo, T. Z. (2011). Research on mechanical properties and sand-doped mechanism of the laterite improved with sand. Eng. Surv. 39 (4), 1–8. (In Chinese).
Silvestri, V., and Bouteldja, M. (1993). “On the consolidation response of a sensitive clay under cyclic loading,” in In can-adian geotechnical conference, 455–464.
Talesnick, M., and Frydman, S. (1992). Irrecoverable and overall strains in cyclic shear of soft clay. Soils Found. 32 (3), 47–60. doi:10.3208/sandf1972.32.3_47
TasiopoulouGiannakouChacko, P. A. J., and De Wit, S. (2018). Liquefaction triggering and post-liquefaction deformation of laminated deposits. Soil Dyn. Earthq. Eng. 124, 330–344. doi:10.1016/j.soildyn.2018.04.044
Vallejo, L. E., and Mawby, R. (2000). Porosity influence on the shear strength of granular material-clay mixtures. Eng. Geol. 58 (2), 125–136. doi:10.1016/s0013-7952(00)00051-x
Vallejo, L. E., and Zhou, Y. (1994). “The mechanical properties of simulated soil-rock mixtures[C],” in Proceedings of the 13th international conference on soil mechanics and foundation engineering New Delhi, India, 365–368.
Whichtmann, T., Niemunis, A., and Triantafyllidis, Th (2007). On the influence of the polarization and the shape of the strain loop on strain accumulation in sand under high-cyclic loading. Soil Dyn. Earthq. Engine 27 (1), 14–28. doi:10.1016/j.soildyn.2006.05.002
Xu, W. J. (2008). Research on meso structural mechanics and slope stability of soil rock mixture [D]. Beijing: Institute of Geology and Geophysics, Chinese Academy of Sciences.
Yamada, S., Hyodo, M., Orense, R. P., Dinesh, S. V., and Hyodo, T. (2008). Strain-dependent dynamic properties of remolded sand-clay mixtures. J. Geotechnical Geoenvironmental Eng. 134 (7), 972–981. doi:10.1061/(asce)1090-0241(2008)134:7(972)
Yamamuro, J. A., and Covert, K. M. (2001). Monotonic and cyclic liquefaction of very looses and swith high silt content. J. geotechnical geoenvironmental engineer-ing 127 (4), 314–324. doi:10.1061/(asce)1090-0241(2001)127:4(314)
Yasuhara, K., Murakami, S., Song, B. W., Yokokawa, S., and Hyde, A. F. L. (2003). Postcyclic degradation of strength and stiffness for low plasticity silt. J. Geotechnical Geoenvironmental Eng. 129 (8), 756–769. doi:10.1061/(asce)1090-0241(2003)129:8(756)
Zhang, H. Y., Liu, J. S., Cui, S. L., and Liang, J. (2010). Controlling mechanism of quartz sand content on shear strength of bentonite-sand mixtures as buffer/backfill material. J. Rock Mech. Eng. 29 (12), 2533–2542. (In Chinese). doi:10.13885/j.issn.0455-2059.2018.03.004
Zhao, Y., Li, Y. H., Zhao, K., and Zahng, P. (2015). Comparative study on damping ratio test of remodeled and undisturbed saprolite. People's Yangtze River 46 (9), 80–83+105. (In Chinese).
Keywords: soft clay, sand interlayer, hysteresis curve, dynamic shear modulus, damping ratio
Citation: Wang S, Cai Y, Zhang L, Pan Y, Chen B and Zhao P (2023) Experimental study on dynamic characteristics of saturated remolded soft clay with sand particles. Front. Earth Sci. 11:1265131. doi: 10.3389/feart.2023.1265131
Received: 22 July 2023; Accepted: 04 October 2023;
Published: 28 December 2023.
Edited by:
Hongyuan Liu, University of Tasmania, AustraliaCopyright © 2023 Wang, Cai, Zhang, Pan, Chen and Zhao. This is an open-access article distributed under the terms of the Creative Commons Attribution License (CC BY). The use, distribution or reproduction in other forums is permitted, provided the original author(s) and the copyright owner(s) are credited and that the original publication in this journal is cited, in accordance with accepted academic practice. No use, distribution or reproduction is permitted which does not comply with these terms.
*Correspondence: Sui Wang, d2FuZ3N1aTEwNjEwQDE2My5jb20=
Disclaimer: All claims expressed in this article are solely those of the authors and do not necessarily represent those of their affiliated organizations, or those of the publisher, the editors and the reviewers. Any product that may be evaluated in this article or claim that may be made by its manufacturer is not guaranteed or endorsed by the publisher.
Research integrity at Frontiers
Learn more about the work of our research integrity team to safeguard the quality of each article we publish.