 T. J. Lawrence
 S. J. Carr2
 A. J. Manning
 A. J. Bushby
 K. L. Spencer
- 1School of Geography, Queen Mary University of London, London, United Kingdom
- 2Centre for National Parks and Protected Areas, Institute of Science and Environment, University of Cumbria, Ambleside, United Kingdom
- 3HR Wallingford, Wallingford, United Kingdom
- 4School of Engineering and Materials Science, Queen Mary University of London, London, United Kingdom
Clay-rich flocculated suspended sediments are an important constituent of estuarine and coastal systems globally. They are responsible for the host, movement and deposition of a variety of pollutants, contaminants and sediment itself. Accurate modelling of the movement of these sediments is crucial for a number of industries including fisheries, aquaculture, shipping and waste management. This requires an accurate and reliable measurements of the physical properties of flocs and their behaviour. Porosity is a key element in floc structures, and this research provides updated 3D quantified porosity and pore space morphological data in relation to influences on floc settling behaviour. We report the questionable relationship between floc size and settling velocity, and explore alternative influences such as floc composition, porosity and pore morphology. These outcomes suggest that a shift in focus from floc size to a combination of factors is necessitated to understand the complex movement behaviour of flocculated suspended sediments.
1 Introduction
Flocculated suspended cohesive sediments (flocs) occur globally, occupying a vital role in determining transport, storage and deposition of contaminants and pollutants including, but not limited to, emerging contaminants such as microplastics (Winterwerp, 1998; Maggi, 2005; Manning et al., 2007; Soulsby et al., 2013; Ho et al., 2022). Flocs are complex, low-density, fragile aggregates of biological and mineralogical material, and typically represent the majority of suspended particulate matter in fine sediment dominant systems (Droppo, 2001; Burd and Jackson, 2009). Understanding their behaviour is therefore a vital aspect of sediment research, to enable sustainable management of the relevant aquatic ecosystems and environments (Wheatland et al., 2017; Wheatland et al., 2020; Spencer et al., 2021).
Conventionally, due to the fragile nature of their structures, floc porosity values are inferred through indirect methods such as 2D size and settling velocity assuming spherical shape (Droppo, 2004; Hsu and Liu, 2010; Amarasinghe et al., 2015; Fromant et al., 2017). This inference of porosity is often determined through use of settling velocity and floc density calculations, (Krishnappan et al., 1999; Manning et al., 2007; Hsu and Liu, 2010), due to the heterogenous nature of flocs making measurement of porosity directly difficult using conventional techniques (Ho et al., 2022). However, recent advances in direct quantification approaches have facilitated 3D observation and measurement of floc porosity and pore spaces (Lawrence et al., 2022; Lawrence et al., 2023). This direct quantification approach overcomes the need to indirectly infer porosity properties in flocs, instead facilitating the direct 3D quantification of floc porosity (Lawrence et al., 2022). These new data not only quantify bulk porosity directly in flocs, but additional 3D pore space and pore network data are available.
X-ray CT techniques similar to those developed for use in this project have been applied to other materials to measure porosity (Desbois et al., 2009; Hemes et al., 2015; Zhu et al., 2020; Zhu et al., 2021), however the unconsolidated, watered structure of cohesive flocculated sediments means that these techniques cannot be applied in this scenario.
Floc settling velocity measurement is long established by use of settling columns such as LabSFLOC-2 (Manning, 2006; Manning et al., 2007; Manning et al., 2011; Ye et al., 2018). Conventionally, the measurement of floc settling rate is undertaken manually, tracking populations of flocs through the settling column camera view, using movement between frames and assumed floc density as calculating inputs for their settling rate (Manning and Dyer, 1999; Manning, 2004; Manning et al., 2007). Updates in the measurement and analysis of floc settling rate are presented here, facilitating swifter processing and quantification by use of semi-automation, enabling less strenuous production of larger datasets.
As a result of the development of these data collection, processing, and analysis strategies, it is now possible to link directly measured floc porosity data to floc functional behaviour. The objectives of this article are to examine the relationships that floc size, composition, porosity and pore space morphology have with floc settling velocity when these parameters are measured directly in 3D volumes.
2 Materials and methods
The materials and methods can be divided into several sub-sections, addressing: the sampling of source sediments; collection and processing of 2D settling data using the LabSFLOC-2 system (Manning, 2006); and collection and processing of 3D floc structure and porosity data using newly established protocols (Lawrence et al., 2022; Lawrence et al., 2023).
2.1 Source sediment sampling
The natural sediment was collected from Thames estuary mudflats, and the flocs subsequently formed using an annular flume, immediately prior to LabSFLOC experimentation using artificial seawater (Sigma Sea Salts) at 34 gL-1 salinity. Three artificial sediments were created, using bentonite clay powder, DI water and xanthan gum at several concentrations (0.01%, 2%, 5%) as a proxy for (standard, high, extremely high) EPS presence (Du et al., 2010; Nouha et al., 2018). The use of xanthan gum is established as a reliable approach for use as a proxy for natural EPS in previous experimental studies (Fitzherbert and Wheatland, 2015; Wheatland et al., 2017; Spencer et al., 2021). The sediments were mixed using an annular flume for 11 days, using on/off cycles to represent tidal conditions (Fitzherbert and Wheatland, 2015), and sampled immediately prior to LabSFLOC experimentation.
2.2 Settling data collection
The LabSFLOC-2 (Manning, 2006) system, modified with a plankton chamber for sample collection, was used to generate settling velocity data for the 4 floc populations. The LabSFLOC-2 system was used according to standard operation, where video recording of the settling floc population is saved to a laptop using FlyCapture software (Manning et al., 2011; Systems, 2019). After settling, the flocs in the plankton chamber at the base of the column were collected for 3D sampling. The raw video files were subjected to a largely automated workflow to collect settling velocity data for large populations, avoiding the time-consuming manual method that is conventionally used (Manning et al., 2007; Manning et al., 2011). The workflow is split into 5 distinct stages: formatting the. avi movie files; semi-automated segmentation using Trainable Weka (Arganda-Carreras et al., 2017); quantification of 2D floc parameters using ImageJ particle analyzer (Abràmoff et al., 2004); quantification of floc settling velocity using TrackMate (Tinevez et al., 2017); and finally the combination of the results of steps 3 and 4 to produce a coherent excel sheet. This produces a dataset of 100s–1000s of flocs from each settling experiment, each assigned a settling velocity, Feret diameter and unique ID for analysis.
2.3 3D structure and porosity data collection
After collection, the plankton chamber samples were divided and subjected to the preparation for μCT scanning as detailed in Fitzherbert and Wheatland (2015) producing 3D floc quantification data, outlined in (Lawrence et al., 2022; Lawrence et al., 2023). Data for the four different floc compositions was produced for analysis concerning 3D floc size, porosity, and pore space characteristics (diameter, tortuosity, connectivity). 2D Feret diameter was also collected for each floc sample, to facilitate comparison and combination of 2D and 3D datasets.
2.4 Processing and analyses
Due to the 2D Feret diameter measurements collected in the settling velocity column data, and the time-consuming nature of producing the 3D datasets, binning of Feret diameter floc size was required to carry out analyses. These bins were assigned broadly as micro-flocs (<160 μm) and macro-flocs (>160 μm) (Manning et al., 2010), and further divided into 25th and 75th percentiles for micro-flocs and 25th, 50th and 75th percentiles for macro-flocs. 30 flocs in each sub-division were included, totaling 150 flocs per composition type, 600 overall. It is not possible to directly match a floc in the settling velocity dataset and the 3D dataset, therefore overall populations separated by floc type, and sub-populations of flocs by Feret diameter bin, were used for analyses. These bins were chosen as categorization was required to compare new data with pre-existing work, and having assessed the distribution of flocs the bins were assigned.
3 Results
By utilising a combination of 2D and 3D datasets, it is possible to assess the relationship between a variety of floc structural elements (size, composition, porosity, pore space morphology) and floc settling velocity. Not all volumes that were analyzed in 3D were visualized, which is a separate process, but Figure 1 presents an overall view of a natural sediment floc and its bulk pore space in 3D.
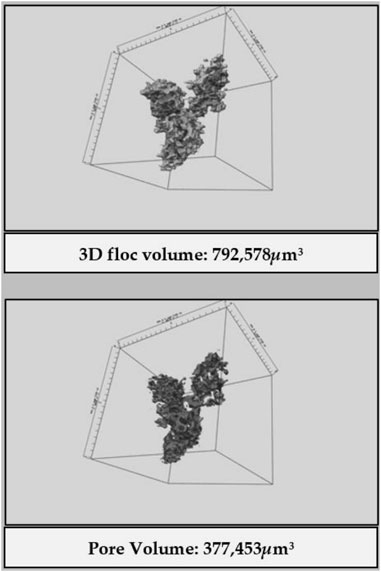
FIGURE 1. 3D rendering of natural sediment floc (top panel) with it’s associated bulk porosity volume (lower panel), created using directly segmented floc and pore volume and visualized using Drishti (Limaye, 2012).
3.1 Floc size
Figure 2 depicts a dataset of floc Feret diameter plotted against floc settling velocity in natural sediment samples. There is no clear relationship evident, but there are ‘bands’ of data that could group the flocs by another metric or factor, such as porosity or composition. The ‘bands’ are predominantly centered immediately above and below 2000 micron/s settling velocity, with another small band of flocs at around 4,000 micron/s.
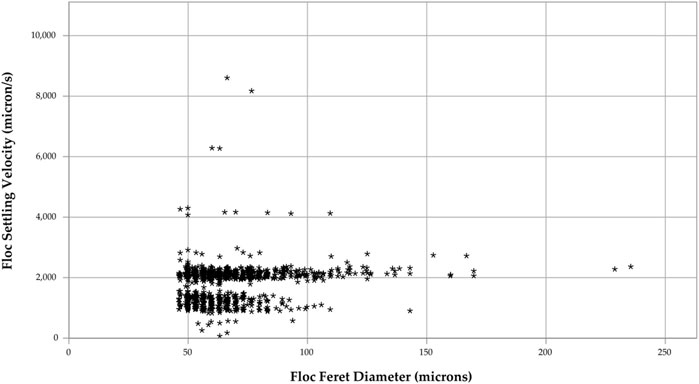
FIGURE 2. Scatter plot of floc Feret diameter vs. floc settling velocity in natural sediment samples. This plot suggests no substantial relationship between floc size and floc settling velocity, but there are ‘bands’ of flocs grouped by another factor.
Table 1 contains data that directly compares micro- (<160 μm) and macro-(>160 μm) floc settling velocity data. Here, the clear outcome is that macro-flocs settle slower than micro-flocs, albeit the macro-floc data is derived from a far smaller sample size. Figure 3 contradicts this, where floc size is plotted as directly measured 3D volume, showing that larger volume flocs bear higher settling velocity values than the smaller flocs. This relationship plateaus once flocs reach ∼200,000 micron3, with a ‘terminal settling velocity’ of approximately 2,200–2,400 micron/s.
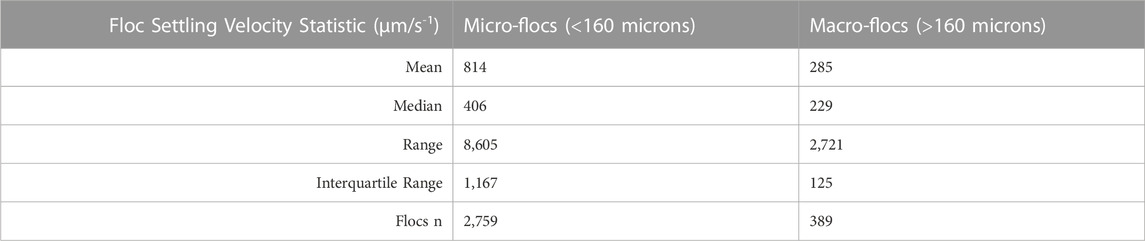
TABLE 1. Table comparing settling velocity metrics between micro- and macro-flocs from a natural sediment sample. The micro-floc settling velocity mean and median values are lower than the macro-floc values.
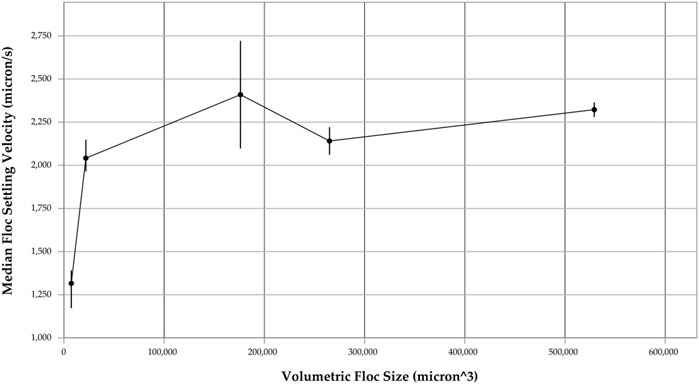
FIGURE 3. Plot of volumetric floc size (micron3) plotted against floc settling velocity in natural sediment samples. Error bars are included to represent standard deviation within each plot point data group.
3.2 Floc composition
Figure 4 expands on the data shown in Figure 1 (natural floc Feret diameter vs. settling velocity) to include several artificial floc samples with varying xanthan gum concentration, as a proxy for EPS presence in the flocs. This plot reiterates the lack of relationship between floc Feret diameter and floc settling velocity, instead offering a ‘banding’ effect at different settling velocity values. It is important to note the logarithmic Y-axis here, that more widely differentiates the floc ‘bands’ based on settling velocity. The natural flocs are banded at the highest settling velocity, followed by the high xanthan gum samples, with the medium xanthan gum samples occupying the lowest settling velocities but with the least closely ‘banded’ appearance. The low xanthan gum samples are the most similar to the natural flocs in terms of ‘EPS’ concentration, but do not band with the natural flocs, implying some other contributing factor, or factors, to determine settling rate.
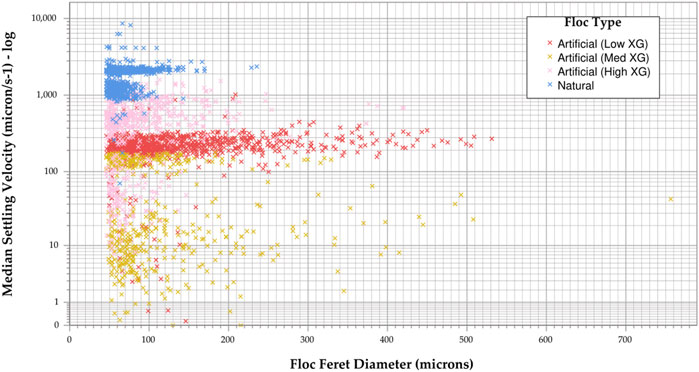
FIGURE 4. Scatter plot of floc Feret diameter vs. floc settling velocity, grouped by floc composition. This plot suggests no substantial relationship between floc size and settling velocity, but banding is present according to floc composition.
3.3 Porosity and pore space morphology
Figure 5 presents 3D volumetric quantified porosity and pore space morphology relationships with floc settling velocity in natural sediment samples. Floc porosity appears to bear a positive relationship with settling velocity, although standard deviation is high in the lower porosity sample groups. Settling velocity decreases with larger pore diameters in this data. Broadly, higher tortuosity values are associated with lower settling velocities, but there is no linear relationship present. In terms of connectivity, which is a proxy for pore network ‘complexity’ in that higher numbers mean greater branches per node, there is no clear relationship, aside from very low connectivity values associating with lower settling velocities.
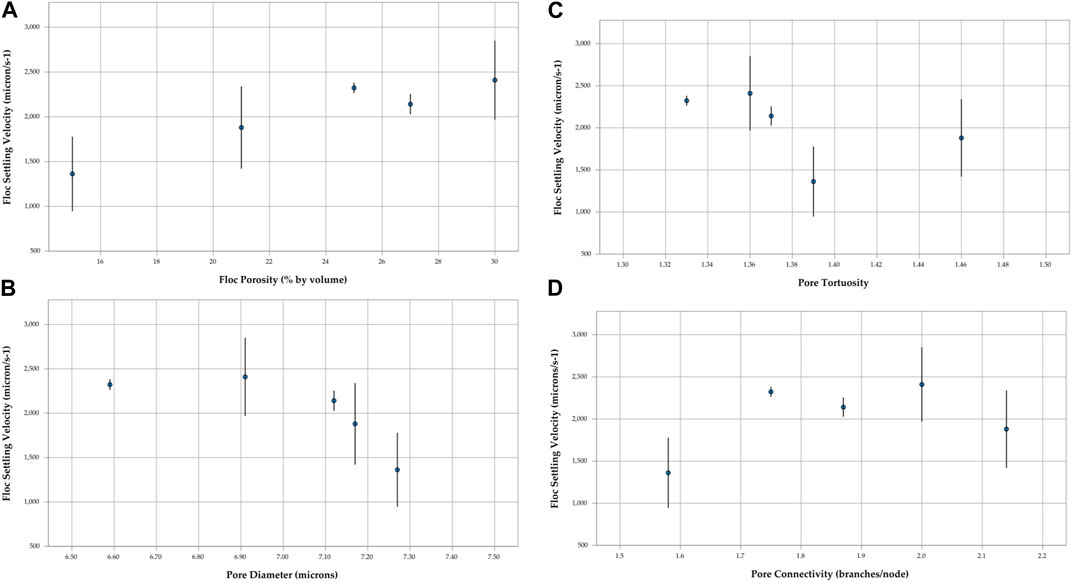
FIGURE 5. A selection of plots showing the relationship between floc porosity (A), pore diameter (B), pore tortuosity (C), and pore connectivity (D) and floc settling velocity in natural sediment samples.
4 Discussion
4.1 Floc size and settling velocity
The settling velocity data plotted against floc size yielded no substantial relationship when either floc Feret diameter (Figure 2) or volumetric floc size (Figure 3) was used. This indicates another responsible factor or factors influencing settling behaviour. However, there are some signals to be discussed from the floc size and settling velocity datasets.
Figure 1 shows a banding effect in the data, suggesting that some factor is controlling floc settling velocity that is common amongst groups of flocs within the overall population, it’s not completely random. Figure 3 indicates that larger flocs in general settle faster than smaller flocs but this relationship is not linear and most larger flocs have a similar mean settling rate. The data in Figure 2 and Table 1, where Feret diameter is used, offers a limited indication of macro-flocs settling slower than micro-flocs, which contradicts the general understanding in the literature (Maggi, 2007; Manning et al., 2007; Liu et al., 2019). Contrarily, when 3D-measured floc volume is used as a size metric, the relationship appears as usually reported, where macro-flocs settle more quickly, despite the relationship being non-linear and plateaued. This further expands on the ideas introduced in Lawrence et al. (2022), where Feret diameter is suggested to be an unreliable indicator of 3D floc size. There is a reduction in settling rate variability when floc size increases in these datasets, which indicates a structural influence within growing flocs that stabilizes settling behaviors (Spencer et al., 2021).
4.2 Floc composition and settling velocity
Previous studies indicate that floc size and settling velocity demonstrate a positive relationship (Mietta et al., 2009; Manning et al., 2011; Soulsby et al., 2013), however when broadly categorized into micro- and macro-flocs, it is evident that the macro-floc settling velocities were lower than in micro-flocs. The data in Figure 4 offer an alternative influence, where settling velocities are banded by floc xanthan gum content (EPS proxy). This suggests that floc composition, rather than size, is the most important factor in determining settling velocity. It is important to note that 2 of the artificial sediments contain very high, unrealistic, levels of xanthan gum (as proxy) compared to typical estuarine flocculated suspended sediments. However, they do offer an extreme high end to test how EPS influence can affect settling behaviors.
In the literature, there are several references to a negative relationship between EPS content and settling velocity (Pang et al., 2018; Cao et al., 2019), with increased levels of EPS typically reducing the density of the sediment and reducing settling rates (Greiser and Wurpts, 2008). However, there are also indications that the negative effect of EPS-induced reductions in density on settling velocity is countered by the positive effect of EPS-induced increased aggregation and floc stability on settling velocity (Droppo, 2001; Tan et al., 2012; Burger et al., 2017). Alternatively, Jin et al. (2003) found settling velocity was statistically independent of EPS content. Increased overall organic content (often occurring simultaneously with increased EPS content) has been shown to have a stronger influence (Lee, et al., 2017), with Blake et al. (2009) reporting an increase in settling velocities in burnt aggregates when compared to non-burnt aggregates of the same EPS content. This implies that other organic factors have a more meaningful influence on settling velocity than EPS content alone. This observation is supported by data in this project, as there is no clear linear relationship between xanthan gum content and settling velocity. The lowest xanthan gum flocs (and the natural flocs) tend to have narrower ranges in settling velocity values, indicating that floc populations with lower EPS content are more consistent in terms of settling rate. This could be as a result of lower variability in floc shape or structure which are affected by EPS ‘stringy-ness’, and so could floc shape be a highly influential factor in settling behavior? 3D floc shape analysis is possible using the segmentation and quantification methods introduced in Lawrence et al. (2023), so this aspect should be explored in future research.
4.3 Porosity and pore morphology and settling velocity
From the panels of Figure 5, it is possible to assess the varying levels of influence that porosity and pore morphology have on settling velocity in flocs. There is a weak positive relationship present between total floc porosity and settling velocity (panel a). The relationship between porosity and settling velocity is complex, high porosity represents effective density approaching water density (Mikkelsen et al., 2007; Kinoshita et al., 2017) and higher levels of advective through-flow based drag reduction (Droppo, 2001; Khelifa and Hill, 2006; Vahedi and Gorczyca, 2012; Zhang and Zhang, 2015), with these aspects counteracting as effects, producing an end-result settling rate that is a balanced outcome of the factors involved. The advective flow conditions are determined by pore morphology, so it is useful to be able to quantify these parameters for analysis here.
Larger pore diameters are associated with a lower settling velocity. This is perhaps a counter-intuitive outcome when discussing advective through-flow, but a substantial number of the pores measured in this study were hydraulically ‘closed-off’ to the outside water column (Yang et al., 2006; Ewing et al., 2010; Yong et al., 2014). Essentially, making the floc surface smoother and reducing turbulence caused by the in/outflow of water from the pores. This would cause the flocs with typically larger pores to experience more interruption to settling, thus reducing settling velocity. There is no relationship of note in terms of pore connectivity. It is important to highlight that this measure of pore network connectivity is a proxy for pore network ‘complexity’, where higher values mean higher numbers of branches per node. The lack of relationship with settling velocity makes some sense, as it would take a high proportion of through-flow in the floc for network complexity to have a significant impact. The one observation that stands out in panel c, is that very low connectivity values correspond to very low settling velocities. This can be explained by very simplistic networks occupying far smaller spaces, and having little-to no advective potential (Rosenzweig et al., 2013; Li et al., 2019; Li et al., 2020). In terms of pore tortuosity, panel d shows a fairly strong sign that higher tortuosity values are associated with lower settling velocities. This is to be expected, as more tortuous pores provide greater resistance to advective flow, even in large, open pore spaces, through increased turbulence. This turbulence can also unbalance the floc during settling, causing rotation and longer settling pathways, reducing settling velocity (Strom and Keyvani, 2011; Zhu, 2019; Moruzzi et al., 2020).
All of these porosity and pore morphological factors can be related to the shape and composition of the floc itself, which further indicates that floc structure is an important focus for future research into effects on settling behaviour. This outcome further demonstrates why it is important to quantify floc porosity using direct methods, rather than by inference using indirect approaches, e.g., density. This heterogeneous structure-based challenge in investigating floc behaviour is overcome by our approach that avoids the use of inference.
4.4 Concluding comments
Conventional notions about floc size influencing settling velocity can be questioned, with influences from floc composition, porosity and pore morphology offering a wider suite of influencing factors in floc behaviour. These new parameters require further investigation, but there is substantial opportunity to explore flocs and their associated porosity in 3D and these techniques can assist in analysis. Regarding application of these findings, this test case project has provided the proof that the measurement is possible, but more experimental work is needed to investigate varying floc compositions and environments. The ability to directly quantify porosity and pore space parameters provides new opportunities to model floc behaviour (Gu et al., 2019), flipping the approach by no longer determining structure from behaviour, but exploring behaviour as a consequence of observed structure.
Data availability statement
The raw data supporting the conclusion of this article will be made available by the authors, without undue reservation.
Author contributions
TL: Data curation, Formal Analysis, Investigation, Methodology, Software, Validation, Visualization, Writing–original draft, Writing–review and editing. SC: Data curation, Formal Analysis, Investigation, Resources, Software, Supervision, Writing–review and editing. AM: Data curation, Investigation, Resources, Software, Supervision, Writing–review and editing. JW: Data curation, Formal Analysis, Investigation, Methodology, Software, Writing–review and editing. AB: Conceptualization, Funding acquisition, Investigation, Software, Supervision, Writing–review and editing. KS: Conceptualization, Funding acquisition, Investigation, Project administration, Resources, Software, Supervision, Writing–review and editing.
Funding
The author(s) declare financial support was received for the research, authorship, and/or publication of this article. This research was supported by the Natural Environmental Research Council (grant numbers NE/M009726/1 and NE/N011678/1).
Acknowledgments
The authors thank Michelle Day for assistance with the 3D X-Ray microtomography. All laboratory work was conducted at the School of Geography, Queen Mary University of London, United Kingdom.
Conflict of interest
AM was employed by the company HR Wallingford.
The remaining authors declare that the research was conducted in the absence of any commercial or financial relationships that could be construed as a potential conflict of interest.
The author(s) declared that they were an editorial board member of Frontiers, at the time of submission. This had no impact on the peer review process and the final decision.
Publisher’s note
All claims expressed in this article are solely those of the authors and do not necessarily represent those of their affiliated organizations, or those of the publisher, the editors and the reviewers. Any product that may be evaluated in this article, or claim that may be made by its manufacturer, is not guaranteed or endorsed by the publisher.
References
Abràmoff, M. D., Magalhães, P. J., and Ram, S. J. (2004). Image processing with ImageJ. Biophot. Int. 11 (7), 36–41.
Amarasinghe, P. M., Abelev, A., Qadri, S. B., and Calantoni, J. (2015). Micromechanical determination of the tensile strength of flocculated artificial marine cohesive sediment. Mech. Res. Commun. 64, 42–49. doi:10.1016/j.mechrescom.2015.01.002
Arganda-Carreras, I., Kaynig, V., Rueden, C., Eliceiri, K. W., Schindelin, J., Cardona, A., et al. (2017). Trainable Weka segmentation: A machine learning tool for microscopy pixel classification. Bioinformatics 33 (15), 2424–2426. doi:10.1093/bioinformatics/btx180
Blake, W. H., Wallbrink, P. J., and Droppo, I. G. (2009). Sediment aggregation and water quality in wildfire-affected river basins. Mar. Freshw. Res. 60 (7), 653–659. doi:10.1071/mf08068
Burd, A. B., and Jackson, G. A. (2009). Particle aggregation. Annu. Rev. Mar. Sci. 1, 65–90. doi:10.1146/annurev.marine.010908.163904
Burger, W., Krysiak-Baltyn, K., Scales, P. J., Martin, G. J. O., Stickland, A. D., and Gras, S. L. (2017). The influence of protruding filamentous bacteria on floc stability and solid-liquid separation in the activated sludge process. Water Res. 123, 578–585. doi:10.1016/j.watres.2017.06.063
Cao, S., Peng, Y., Du, R., and Zhang, H. (2019). Characterization of partial-denitrification (pd) granular sludge producing nitrite: effect of loading rates and particle size. Sci. Total Environ. 671, 510–518. doi:10.1016/j.scitotenv.2019.03.380
Desbois, G., Urai, J. L., and Kukla, P. A. (2009). Morphology of the pore space in claystones - evidence from BIB/FIB ion beam sectioning and cryo-SEM observations. eEarth 4 (1), 1–19. doi:10.5194/eed-4-1-2009
Droppo, I. G. (2001). Rethinking what constitutes suspended sediment. Hydrol. Process. 15 (9), 1551–1564. doi:10.1002/hyp.228
Droppo, I. G. (2004). Structural controls on floc strength and transport. Can. J. Civ. Eng. 31 (4), 569–578. doi:10.1139/l04-015
Du, C., Zhou, G., Wang, H., Chen, X., and Zhou, J. (2010). Depth profiling of clay-xanthan complexes using step-scan mid-infrared photoacoustic spectroscopy. J. Soils Sediments 10 (5), 855–862. doi:10.1007/s11368-010-0225-3
Ewing, R. P., Hu, Q., and Liu, C. (2010). Scale dependence of intragranular porosity, tortuosity, and diffusivity. Water Resour. Res. 46 (6). doi:10.1029/2009wr008183
Fitzherbert, M., and Wheatland, J. A. (2015). A manual for preparing flocculated aquatic sediment for electron microscopy. Queen Mary, University of London document/report.
Fromant, G., Floc’h, F., Lebourges-Dhaussy, A., Jourdin, F., Perrot, Y., Le Dantec, N., et al. (2017). In situ quantification of the suspended load of estuarine aggregates from multifrequency acoustic inversions. J. Atmos. Ocean. Technol. 34 (8), 1625–1643. doi:10.1175/jtech-d-16-0079.1
Greiser, N., and Wurpts, R. (2008). Chinese-German joint symposium on hydraulic and ocean engineering. .Microbiological Impact On Formation And Rheological Properties Of Fluid Mud, 10, 369–371
Gu, C., Wheatland, J. A. T., Botto, L., Bushby, A. J., Carr, S. J., Manning, A. J., et al. (2019). “Investigation of the dynamics of 3-D flocs with complex morphology via stokesian dynamics simulations,” in Egu Geophysical Research Abstracts. 25.
Hemes, S., Desbois, G., Urai, J. L., Schröppel, B., and Schwarz, J. O. (2015). Multi-Scale characterization of porosity in boom clay (HADES-Level, mol, Belgium) using a combination of X-ray μ-CT, 2D BIB-sem and FIB-sem tomography. Microporous Mesoporous Mater. 208, 1–20. doi:10.1016/j.micromeso.2015.01.022
Ho, Q. N., Fettweis, M., Spencer, K. L., and Lee, B. J. (2022). Flocculation With Heterogeneous Composition In Water Environments: A Review, Maharashtra, India: Water Research.
Hsu, R. T., and Liu, J. T. (2010). In-situ estimations of the density and porosity of flocs of varying sizes in a submarine canyon. Mar. Geol. 276 (1–4), 105–109. doi:10.1016/j.margeo.2010.07.003
Jin, B., Wilén, B. M., and Lant, P. (2003). A comprehensive insight into floc characteristics and their impact on compressibility and settleability of activated sludge. Chem. Eng. J. 95 (1–3), 221–234. doi:10.1016/s1385-8947(03)00108-6
Khelifa, A., and Hill, P. S. (2006). Models for effective density and settling velocity of flocs. J. Hydraulic Res. 44 (3), 390–401. doi:10.1080/00221686.2006.9521690
Kinoshita, T., Nakaishi, K., and Kuroda, Y. (2017). Determination of kaolinite floc size and structure using interface settling velocity. Appl. Clay Sci. 148, 11–16. doi:10.1016/j.clay.2017.07.024
Krishnappan, B. G., Marsalek, J., Watt, W. E., and Anderson, B. C. (1999). Seasonal size distributions of suspended solids in a stormwater management pond. Water Sci. Technol. 39 (2), 127–134. doi:10.2166/wst.1999.0103
Lawrence, T. J., Carr, S. J., Manning, A. J., Wheatland, J. A. T., Bushby, A. J., and Spencer, K. L. (2023). A novel 3D volumetric method for directly quantifying porosity and pore space morphology in flocculated suspended sediments. MethodsX 10, 101975. doi:10.1016/j.mex.2022.101975
Lawrence, T. J., Carr, S. J., Wheatland, J. A. T., Manning, A. J., and Spencer, K. L. (2022). Journal of soils and sediments.Quantifying The 3d Structure And Function Of Porosity And Pore Space In Natural Sediment Flocs, 23. doi:10.1007/s11368-022-03304-x
Lee, B. J., Hur, J., and Toorman, E. A. (2017). Seasonal variation in flocculation potential of river water: roles of the organic matter pool. WaterSwitzerl. 9 (5), 335. doi:10.3390/w9050335
Li, G., Zhan, L., Yun, T., and Dai, S. (2020). Pore-Scale controls on the gas and water transport in hydrate-bearing sediments. Geophys. Res. Lett. 47 (12). doi:10.1029/2020gl086990
Liu, J., Liang, J. H., Xu, K., Chen, Q., and Ozdemir, C. E. (2019). Modeling sediment flocculation in Langmuir turbulence. J. Geophys. Res. Oceans 124 (11), 7883–7907. doi:10.1029/2019jc015197
Liyao, G., Dai, S., Zhan, L. tong, and Chen, Y. min. (2019). A pore-scale numerical investigation of the effect of pore characteristics on flow properties in soils. J. Zhejiang Univ. Sci. A 20 (12), 961–978. doi:10.1631/jzus.a1900255
Maggi, F. (2005). Flocculation dynamics of cohesive sediment. Commun. Hydraulic Geotechnical Eng. 5 (1), 1–139.
Maggi, F. (2007). Variable fractal dimension: A major control for floc structure and flocculation kinematics of suspended cohesive sediment. J. Geophys. Res. Oceans 112 (7), C07012. doi:10.1029/2006jc003951
Manning, A. J., Baugh, J. V., Spearman, J. R., Pidduck, E. L., and Whitehouse, R. J. S. (2011). The settling dynamics of flocculating mud-sand mixtures: part 1-empirical algorithm development. Ocean. Dyn. 61 (2–3), 311–350. doi:10.1007/s10236-011-0394-7
Manning, A. J., Baugh, J. V., Spearman, J. R., and Whitehouse, R. J. S. (2010). Flocculation settling characteristics of mud: sand mixtures. Ocean. Dyn. 60 (2), 237–253. doi:10.1007/s10236-009-0251-0
Manning, A. J., and Dyer, K. R. (1999). A laboratory examination of floc characteristics with regard to turbulent shearing. Mar. Geol. 160 (1–2), 147–170. doi:10.1016/s0025-3227(99)00013-4
Manning, A. J., Friend, P. L., Prowse, N., and Amos, C. L. (2007). Estuarine mud flocculation properties determined using an annular mini-flume and the LabSFLOC system. Cont. Shelf Res. 27 (8), 1080–1095. doi:10.1016/j.csr.2006.04.011
Manning, A. J. (2006). LabSFLOC - a laboratory system to determine the spectral characteristics of flocculating cohesive sediments, HR Wallingford Technical Report (TR 156), 26.
Manning, A. J. (2004). Observations of the properties of flocculated cohesive sediment in three western European estuaries. J. Coast. Res. 41, 70–81.
Mietta, F., Chassagne, C., Manning, A. J., and Winterwerp, J. C. (2009). Influence of shear rate, organic matter content, PH and salinity on mud flocculation. Ocean. Dyn. 59 (5), 751–763. doi:10.1007/s10236-009-0231-4
Mikkelsen, O. A., Hill, P. S., and Milligan, T. G. (2007). Seasonal and spatial variation of floc size, settling velocity, and density on the inner adriatic shelf (Italy). Cont. Shelf Res. 27 (3–4), 417–430. doi:10.1016/j.csr.2006.11.004
Moruzzi, R. B., Bridgeman, J., and Silva, P. A. G. (2020). A combined experimental and numerical approach to the assessment of floc settling velocity using fractal geometry. Water Sci. Technol. 81 (5), 915–924. doi:10.2166/wst.2020.171
Nouha, K., Kumar, R. S., Balasubramanian, S., and Tyagi, R. D. (2018). Critical review of EPS production, synthesis and composition for sludge flocculation. J. Environ. Sci. (China) 66, 225–245. doi:10.1016/j.jes.2017.05.020
Pang, Q., Zhang, R., Wen, C., and Han, P. (2018). Fluid mud consolidation delayed by extracellular polymer substances. Environ. Technol. (United Kingdom) 39 (19), 2534–2541. doi:10.1080/09593330.2017.1360397
Rosenzweig, R., Furman, A., and Shavit, U. (2013). A channel network model as a framework for characterizing variably saturated flow in biofilm-affected soils. Vadose Zone J. 12 (2), 0079–115. doi:10.2136/vzj2012.0079
Soulsby, R. L., Manning, A. J., Spearman, J., and Whitehouse, R. J. S. (2013). Settling velocity and mass settling flux of flocculated estuarine sediments. Mar. Geol. 339, 1–12. doi:10.1016/j.margeo.2013.04.006
Spencer, K. L., Wheatland, J. A. T., Bushby, A. J., Carr, S. J., Droppo, I. G., and Manning, A. J. (2021). A structure – function based approach to floc hierarchy and evidence for the non - fractal nature of natural sediment flocs. Sci. Rep. 11, 14012. doi:10.1038/s41598-021-93302-9
Strom, K., and Keyvani, A. (2011). An explicit full-range settling velocity equation for mud flocs. J. Sediment. Res. 81 (12), 921–934. doi:10.2110/jsr.2011.62
Tan, X. L., Zhang, G. P., Yin, H., Reed, A. H., and Furukawa, Y. (2012). Characterization of particle size and settling velocity of cohesive sediments affected by a neutral exopolymer. Int. J. Sediment Res. 27 (4), 473–485. doi:10.1016/s1001-6279(13)60006-2
Tinevez, J. Y., Perry, N., Schindelin, J., Hoopes, G. M., Reynolds, G. D., Laplantine, E., et al. (2017). Trackmate: an open and extensible platform for single-particle tracking. Methods 115, 80–90. doi:10.1016/j.ymeth.2016.09.016
Vahedi, A., and Gorczyca, B. (2012). Predicting the settling velocity of flocs formed in water treatment using multiple fractal dimensions. Water Res. 46 (13), 4188–4194. doi:10.1016/j.watres.2012.04.031
Wheatland, J. A. T., Bushby, A. J., and Spencer, K. L. (2017). Quantifying the structure and composition of flocculated suspended particulate matter using focused ion beam nanotomography. Environ. Sci. Technol. 51 (16), 8917–8925. doi:10.1021/acs.est.7b00770
Wheatland, J. A. T., Spencer, K. L., Droppo, I. G., Carr, S. J., and Bushby, A. J. (2020). Development of novel 2D and 3D correlative microscopy to characterise the composition and multiscale structure of suspended sediment aggregates. Cont. Shelf Res. 200, 104112. doi:10.1016/j.csr.2020.104112
Winterwerp, J. C. (1998). A simple model for turbulence induced flocculation of cohesive sediment. J. Hydraulic Res. 36 (3), 309–326. doi:10.1080/00221689809498621
Yang, Z., Peng, X. F., Chu, C. P., Lee, D. J., and Su, A. (2006). Sedimentation of permeable floc. Dry. Technol. 24 (10), 1277–1282. doi:10.1080/07373930600840393
Ye, L., Manning, A. J., Hsu, T. J., Morey, S., Chassignet, E. P., and Ippolito, T. A. (2018). Novel application of laboratory instrumentation characterizes mass settling dynamics of oil-mineral aggregates (OMAs) and oil-mineral-microbial interactions. Mar. Technol. Soc. J. 52 (6), 87–90. doi:10.4031/mtsj.52.6.14
Yong, Y., Lou, X., Li, S., Yang, C., and Yin, X. (2014). Direct simulation of the influence of the pore structure on the diffusion process in porous media. Comput. Math. Appl. 67 (2), 412–423. doi:10.1016/j.camwa.2013.08.032
Zhang, J., and Zhang, Q. (2015). Direct simulation of drag force on fractal flocs during settling. J. Coast. Res. 73, 753–757. doi:10.2112/si73-129.1
Zhu, H., Huang, C., Ju, Y., Bu, H., Li, X., Yang, M., et al. (2021). Multi-scale multi-dimensional characterization of clay-hosted pore networks of shale using fibsem, tem, and x-ray micro-tomography: implications for methane storage and migration. Appl. Clay Sci. 213, 106239. doi:10.1016/j.clay.2021.106239
Zhu, H., Ju, Y., Huang, C., Chen, F., Chen, B., and Yu, K. (2020). Microcosmic gas adsorption mechanism on clay-organic nanocomposites in a marine shale. Energy. 197, doi:10.1016/j.energy.2020.117256
Keywords: flocculation, suspended sediment, porosity, micro-CT, floc behaviour, settling velocity
Citation: Lawrence TJ, Carr SJ, Manning AJ, Wheatland JAT, Bushby AJ and Spencer KL (2023) Functional behaviour of flocs explained by observed 3D structure and porosity. Front. Earth Sci. 11:1264953. doi: 10.3389/feart.2023.1264953
Received: 21 July 2023; Accepted: 26 September 2023;
Published: 04 October 2023.
Edited by:
Aurélien Gay, UMR5243 Géosciences Montpellier, FranceCopyright © 2023 Lawrence, Carr, Manning, Wheatland, Bushby and Spencer. This is an open-access article distributed under the terms of the Creative Commons Attribution License (CC BY). The use, distribution or reproduction in other forums is permitted, provided the original author(s) and the copyright owner(s) are credited and that the original publication in this journal is cited, in accordance with accepted academic practice. No use, distribution or reproduction is permitted which does not comply with these terms.
*Correspondence: T. J. Lawrence, bGF3cmVuY2V0M0BjYXJkaWZmLmFjLnVr