 Seunghwan Seo
 Jongjeon Park2
 Gunwoong Kim
94% of researchers rate our articles as excellent or good
Learn more about the work of our research integrity team to safeguard the quality of each article we publish.
Find out more
ORIGINAL RESEARCH article
Front. Earth Sci., 06 December 2023
Sec. Geohazards and Georisks
Volume 11 - 2023 | https://doi.org/10.3389/feart.2023.1263997
This article is part of the Research TopicGeophysical, Climatological and Anthropogenic Hazards and Disaster: Vulnerability, Risk Assessment, and SustainabilityView all 11 articles
This study aims to identify and evaluate the significance of the key design factors that impact the stability of Earth retaining wall anchor-supported structures during excavations in urban areas. Although there are many previous studies on the deformation of Earth retaining walls during excavation, there is a lack of verification studies that quantitatively examine the stability of various influencing factors such as wall, ground characteristics, and external influencing factors. To this end, finite-element analyses were conducted, and their results were compared and validated with field measurements. These comparisons demonstrated that the numerical modeling technique employed in this study effectively simulates the wall’s behavior under excavation conditions. Subsequently, the impact of the main design factors, including ground properties, external conditions, and structural stiffness, on the behavior of the wall was quantitatively assessed by applying variation ratios. The findings indicate that the horizontal displacement of the wall, induced by excavation, is significantly dependent on the unit weight and shear strength of the soil. Conversely, the groundwater level location, surcharge load, and structural stiffness exhibit a relatively minor effect. Finally, the variability of the main design parameters was investigated, considering the specific ground layer where the wall is installed, revealing distinct influences of these variables across different ground layers. Consequently, it is expected that the importance of the influencing geotechnical factors will be selected and used for predicting the behavior of Earth retaining walls and actual design, which will help to efficient wall design.
Although the advance in civil engineering technologies has led to a decrease in the number of work accidents at construction sites, collapse-type accidents during Earth retaining wall excavations continue to occur with some frequency. This can be attributed to various factors, including the inherent uncertainty in the properties of the ground compared to those of other structures and the scale of the excavation.
In the design of Earth retaining wall, prediction methods for lateral displacement have been applied by conventional researches. It is essential to accurately predict the behavior of the ground and wall according to the excavation for the efficient design of the Earth retaining wall, and the change of the ground and the wall displacement during the step-by-step excavation should also be accurately predicted in advance and considered in the design (Hsiung, 2009; Khoiri and Ou, 2013; Bhatkar et al., 2017; Dong et al., 2018). The methods used for design are studied for clay or sandy ground, so it is difficult to predict wall displacement under various ground conditions. During construction, the stability of the Earth retaining wall is evaluated by the wall displacement measured by instrumentation (Ran et al., 2011; Fearnhead et al., 2014; Wu et al., 2015). However, there is a difference between the predicted displacement and the actual displacement during construction due to the fundamental problem that the methods proposed by conventional researches cannot properly describe the site conditions with various characteristics (Dmochowski and szolomicki 2021). The factors affecting the wall displacement during excavation are influenced by several parameters such as ground material properties, external influences such as groundwater level (GL) and surcharge load at the back and structure stiffness (Do and Ou, 2020; Zhang et al., 2020).
Previous researchers have conducted numerous studies on the behavior of retaining walls during the excavation of the surrounding ground. Caspe (1966) investigated wall displacement and Poisson’s ratio in a viscous clay ground, Peck (1969) studied settlement characteristics based on actual measurements, Bowles (1996) proposed a simplified method, and Clough and O'Rourke (1990) used field measurements and the finite-element method to analyze settlement levels considering the separation between different ground layers. Yoo et al. (2000) conducted a study in Korea analyzing wall displacement and surrounding ground behavior at three stages of the excavation process: pre-excavation, excavation, and support beam removal. Other studies on the response of adjacent structures to ground displacement caused by excavation include Boscardin and Cording’s (1989) investigation of the effect of horizontal ground displacement on the deformation of adjacent structures, Son and Cording (2005, 2007) research on the relationship between ground settlement, deformation rate, and damage level in adjacent structures, and Lee et al. (2007) assessment of damage risk to adjacent buildings during excavation by combining the Peck and Bowles methods.
Peck (1969) demonstrated that ground settlement depends on the stiffness of the soil, showing that stiffer soils, such as sandy soil and hard clay, exhibit lower settlement compared to softer soils like soft to medium clay. Clough and Tsui (1974) and Mana and Clough (1981) found that the overall behavior of the ground depends on soil stiffness, with lateral displacement rates and magnitudes increasing as the risk of uplift augments or the excavation failure safety factor approaches one. Song and Yoo (2018) conducted an indoor model experiment to analyze the impact of groundwater levels (GLs) on retaining walls during excavation. Their findings revealed that as the GL increased, wall displacement increased while wall stiffness decreased. Park and Joung (2020) conducted a numerical study on the excavation width and deformation characteristics of retaining walls, identifying the extent of mutual interference caused by Earth pressure using two-dimensional numerical analyses. St John (1975) determined that compared to three-dimensional simulations, two-dimensional analyses tend to overestimate the deformation of retaining walls in stiff clay excavations. Naylor and Pande (1981) compared three- and two-dimensional analyses and found that, while ground settlement did not differ significantly between the two analyses, the horizontal wall displacement was approximately twice as large in the three-dimensional analysis. Jeong and Kim (2009) confirmed the suitability of the three-dimensional numerical methods for considering the characteristics of retaining walls and support materials. They suggested that the depth to consider in the analysis should be set at more than twice the excavation depth to achieve more accurate results in three-dimensional numerical analysis. Yoo and Kim (2000) examined the influence of factors such as ground stiffness, wall bending stiffness, and over-excavation on the behavior of retaining walls using indoor model experiments and finite-element analysis. The results revealed that the behavior of retaining walls is highly affected by the construction process, the stiffness of wall components, and whether over-excavation occurs. Reducing the installation gap proved more effective in suppressing wall displacement than increasing the stiffness of the support structure. The influence area of settlement expanded as the degree of over-excavation increased, with the maximum settlement reaching approximately 70% of the maximum horizontal wall displacement.
Chen et al. (2014) conducted a three-dimensional numerical analysis to study changes in effective horizontal stress and interstitial water pressure during the installation of a diaphragm wall. The installation of diaphragm walls in soft ground resulted in significant ground settlement, reduced ground stress, and changes in interstitial water pressure (Ng, 1992; Symons and Carder, 1993; Powrie and Kantartzi, 1996; Poh and Wong, 1998). These changes in ground conditions depend on factors such as the thickness and length of the basement continuation wall, soil type, and construction techniques. Schäfer and Triantafylidis (2004, 2006) analyzed the effects of deep excavation on the behavior and stress evolution of basement continuation walls in normally consolidated clay (NC) and found significant stress evolution in the ground prior to construction.
The behavior of Earth retaining walls is influenced by various factors, including soil type, excavation shape, wall type, support system, and construction technique (Ou et al., 1993; Poh and Wong, 1998; Wong and Poh, 2000; Zhang et al., 2015, 2018). Additionally, the impact of deep excavation on ground behavior is contingent upon the length and depth of the wall, the depth of the support layer, and the stiffness of the support material (Ou et al., 1993; Goh et al., 2020). Recent studies have focused on corner joints of retaining walls, employing three-dimensional numerical analyses. Tanner Blackburn and Finno (2007) observed that horizontal deformation and ground settlement increase from the corner to the center of the retaining walls. Hsieh and Ou (1998) reported a reduction of 20%–60% in horizontal wall displacement at the corner compared to the maximum settlement at the center. In addition, a recent study analyzed the factors affecting the behavior of embedded retaining wall through inverse analysis. Through inverse analysis of post-construction monitoring data, it was reported that the nonlinear soil stiffness has the largest impact on wall deformation in stiff clay condition (Foo et al., 2023).
As mentioned above, there are many previous studies on the deformation of Earth retaining walls during excavation, however there is lack of validation study that examines the stability of various influencing factors such as wall, soil properties, and external influencing factors. This study aims to thoroughly analyze the factors that influence the response of retaining walls during ground excavations based on the results obtained from numerical analyses of a single process at an earthwork excavation site. Prior to the numerical analyses, the results obtained from field applications and finite-element analysis were compared to validate the numerical modeling scheme used for analyzing the wall behavior. The finite-element analyses were conducted setting as parameters the factors that affect the horizontal displacement of the wall during excavation, including ground material properties, external influences (such as GL location and surcharge load at the back), and structural stiffness. Subsequently, the significance of these influencing factors was determined by analyzing the behavior characteristics of the wall and the magnitude of deformation due to excavation, and the results were utilized to predict the horizontal wall displacement during the design process.
Among the analysis methods used for stability assessment of continuous underground walls, the elastic-plastic beam-on-foundation analysis method is commonly employed in design due to the simplicity and minimal expertise requirements for the input data. However, this method combines the wall and ground after analyzing separately their structural failure points. Consequently, accurately calculating the active failure surface, while considering the effects of the wall, Earth anchors, and surrounding ground, becomes challenging, particularly in inverse analysis scenarios such as when determining the cause of retaining wall collapses. To address this limitation, this study adopts the finite-element method (FEM), which incorporates the shear strength reduction method to automatically consider changes in the active failure surface. This is achieved by performing a continuum analysis that accounts for the excavation and construction stages. Accordingly, the influencing factors for the elastic-plastic beam-on-foundation analysis method and the FEM model were selected differently. The input data required to characterize the geotechnical properties for the elastic-plastic beam-on-foundation analysis included the wet unit weight, underwater unit weight, adhesion, internal friction angle, and coefficient of transverse ground reaction force (Ks). On the other hand, the geotechnical properties utilized for the finite-element analysis included the wet unit weight, underwater unit weight, adhesion, internal friction angle, and elastic modulus (E). Previous research results Jeong and Kim (2009) have indicated that the elastic-plastic beam-on-foundation analysis method has the disadvantage of not being able to simultaneously consider the resistance of the structure and the ground at each analysis point. Consequently, it does not account for the continuity of the analysis or the soil-structure interaction. Notably, the difference between the transverse ground reaction force coefficient and elastic modulus represents a significant distinction between the two analysis methods.
The excavation site data were based on field measurements, whereas the basic data were selected using the input values from SUNEX, a beam–column program widely used in practical applications. The ground properties considered were the type, wet unit weight, underwater unit weight, adhesion, internal friction angle, transverse ground reaction coefficient, depth, layer thickness, and average N-value. To account for water pressure on the wall during design, the initial GL was expressed from the ground surface.
The input properties, such as elastic modulus, cross-sectional area, and cross-sectional secondary moment, were based on the same values as those used for vertical walls. Regarding the anchors, the initial tensile force is known to impact the final behavior of the wall. The pouring of the building wall, which occurs after excavation is completed, has negligible contribution to the stability evaluation of the wall. Dependent on its location and size, the background load influences the horizontal displacement of the wall during excavation and can act as an external force along with the GL (Ou et al., 1993; Goh et al., 2020). Based on a literature review and field data, four major influencing factors were selected for this study. The types of wall and support materials were reviewed according to their axial and bending stiffnesses (EA and EI, respectively). It is important to note that the nature of the analysis program used in the design led to variations from the actual site conditions. Therefore, the behavior of each type of wall and support material was analyzed by considering the quantitative variations, rather than analyzing each type separately using different methods. Table 1 lists the influencing factors considered in the analysis.

TABLE 1. Parametric numerical analyses.
The numerical analysis utilizes the commercial FE software PLAXIS 2D (2022). The typical 2D FE model used in this study is shown in Figure 1. The soil and rock are composed of 15-node triangular elements, while the retaining wall is modeled using 5-node plate elements. The model employs fourth-order interpolation for displacements and twelve Gauss points for numerical integration (stress points). The interfaces consist of five pairs of 10-node interface elements that can connect with 15-node soil elements. The numerical model has a total height equal to the height of the retaining wall (L) plus an additional 1.0L below the retaining toe level, and extends three times the excavation width (H) from the retaining wall center. These dimensions were chosen to minimize boundary effects on the retaining wall’s behavior. A finer mesh was used near the retaining wall and surrounding soil interface, while a coarser mesh was used further away. The typical retaining wall had a width of 0.3 m and a length of 12 m. The bearing end of the wall was on weathered rock and continued into a layer of sand. The mesh consisted of 40,110 nodes and 4,848 fifteen-node triangular elements. Assuming a rigid, unyielding strata, such as a rock layer, the vertical boundaries are allowed to move only in the vertical direction, while the bottom boundary is fixed in both the horizontal and vertical directions.
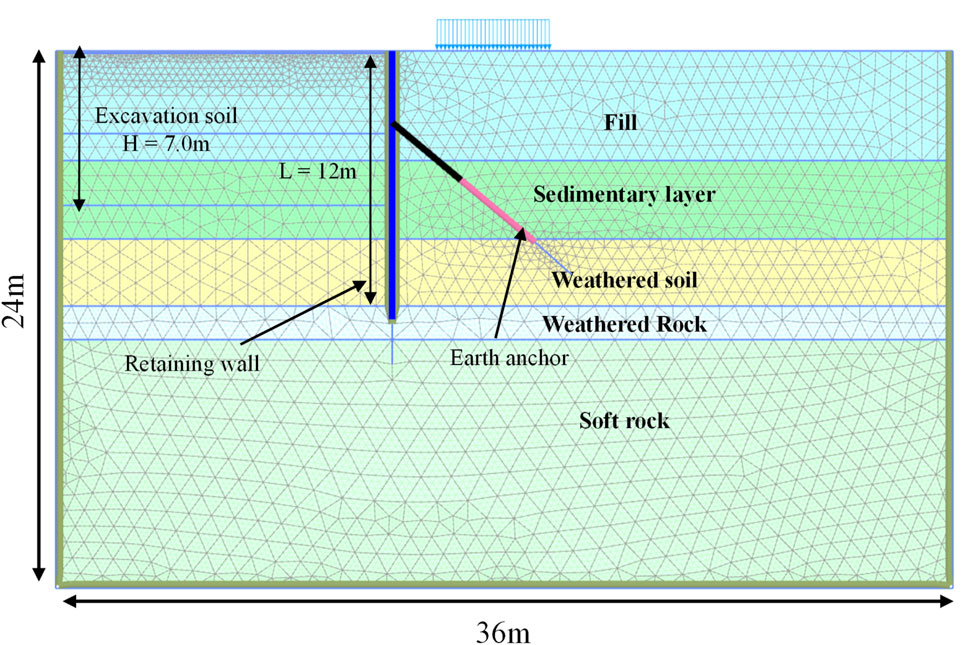
FIGURE 1. FEM model implemented in Plaxis 2D.
The conditions for the finite-element analysis were as follows. The Mohr–Coulomb (M–C) model, commonly used in practice, was applied to the ground model, while an elastic model was employed for the retaining wall. Underground anchors were modeled using node-to-node anchor elements and embedded piles. The ground and structural properties used in the finite-element analysis are listed in Tables 2, 3.

TABLE 2. Soil properties.

TABLE 3. Material properties.
Although the cast-in-place (CIP) wall consists of a continuous arrangement of concrete columns with rebars and H-piles, the analysis was performed in two-dimensional plane strain due to the characteristics of a continuous wall where the differences in stiffness among the concrete columns are minimal. The equivalent physical properties were calculated using Equation (1) to replace the elastic modulus (E) and sectional secondary moment (I) of the continuous wall. In Figure 2, the earth-membrane wall represents a unit width of 1 m.
where,
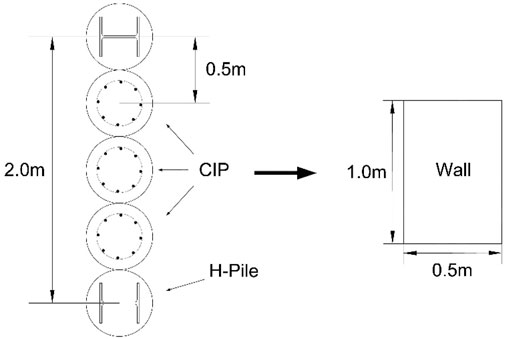
FIGURE 2. CIP and H-pile wall section transformation.
For the analysis area, the boundary conditions were defined as vertical displacement constraints for the lower boundary, horizontal displacement constraints for the left and right boundaries, and a free surface for the upper boundary along the axial direction of the global coordinate system. After the construction of the earth-membrane wall, the ground area inside the wall entered a stress-relieved state due to excavation. To simulate the separation behavior between the ground and wall, an interface element was applied. The interface element allowed for modeling the relative displacement between the soil and wall. Without the use of the interface element, the ground near the wall did not settle due to the arching effect between the elements. Table 4 summarizes the strength reduction factors for each soil and structural material when employing the interface element.
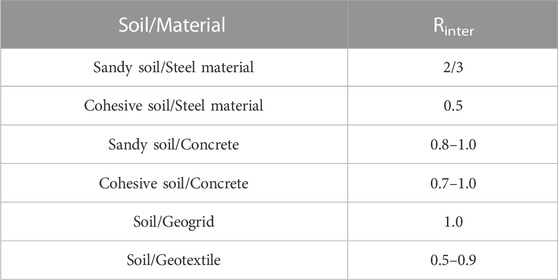
TABLE 4. Interface reduction factor.
A step-by-step analysis was conducted to examine the displacement and external stability of the retaining wall in accordance with the actual construction stages. The construction stages were simulated as follows: Step 1: H-pile construction, Step 2: step-by-step excavation, Step 3: anchor installation, Step 4: repetition of Steps 2 and 3, and final excavation, based on the construction system at the site, as shown in Figure 3.
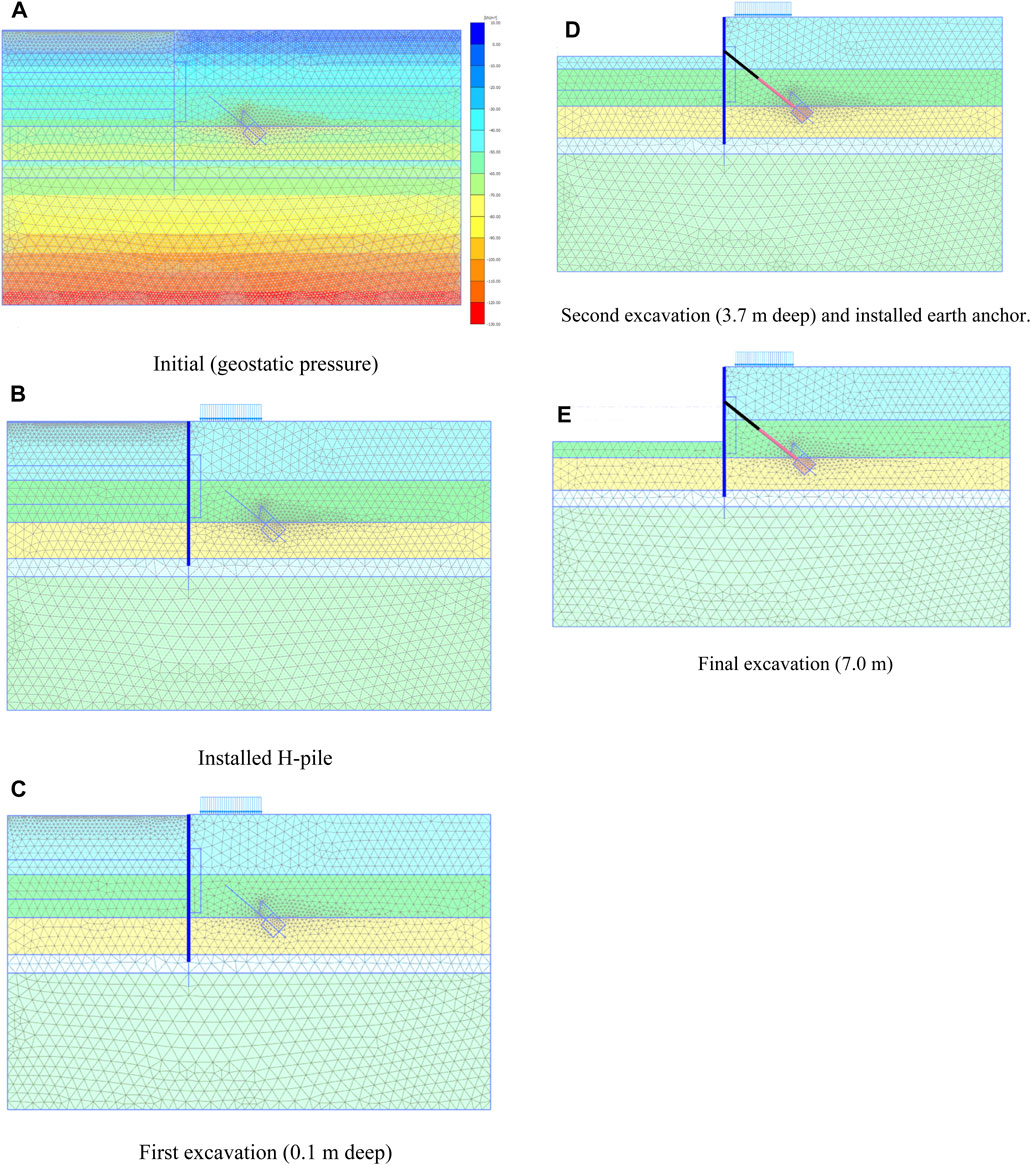
FIGURE 3. Numerical simulation procedure: (A) Initial, (B) Installed H-pile, (C) First excavation, (D) Second excavation, (E) Final excavation.
To analyze the influencing factors, specific influence factor selection and analysis cases were determined, as illustrated in Figure 4. Verification was previously conducted using field measurement data, and an additional analysis was carried out. When subdividing the influencing factors, the ground physical properties encompassed unit weight, adhesion, friction angle, and elastic modulus, with the analysis performed considering the magnitude of the surcharge load at the back. Additionally, the GL required adjustment based on the step-by-step analysis. However, for this project, only the initial GL (−3.2 m) was selected and reviewed, and the influence factor analysis was conducted by varying the position of the GL accordingly. Lastly, the stiffness of the Earth wall was chosen as an influencing factor, and the EA and EI values were analyzed.
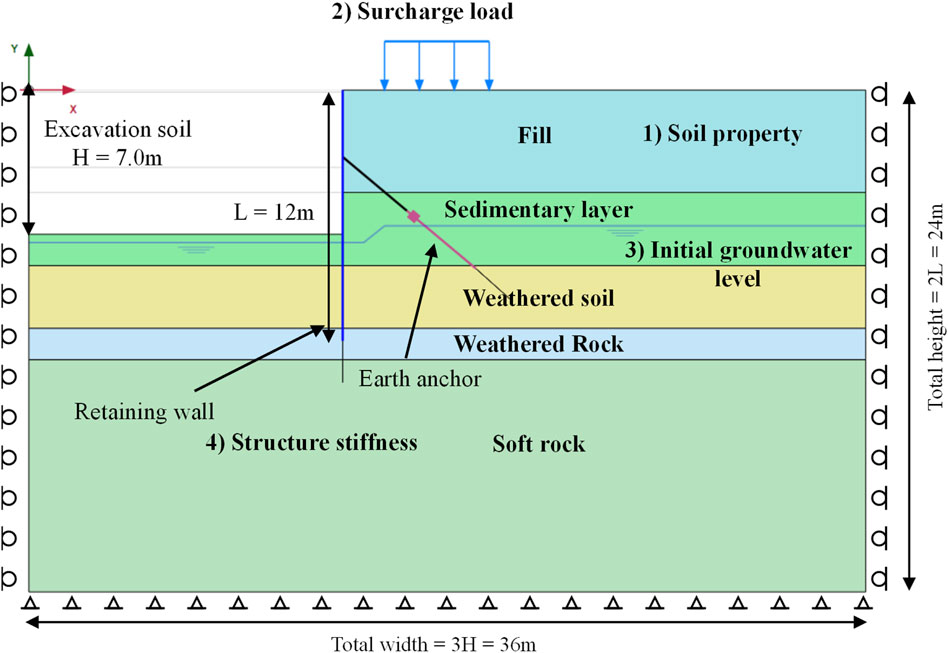
FIGURE 4. Influence factor for retaining wall and Earth anchor in 2D FE model.
For the influence factor analysis method, a representative cross-section was selected based on validated field cases, and weights were assigned to each factor for assessment. To ensure the properties of the influencing factors remained within a reasonable range, the assigned weights were limited. In other words, the range is chosen to ensure that no exceptional properties are assigned. The analysis was conducted using the same properties as those used for validation. In this study, each influence factor was assigned a weight ranging from 80% to 120%, and a variation ratio of 0.8–1.2 was applied to examine the effect on the horizontal displacement of the retaining wall.
This section presents the comparison and analysis of the behavioral characteristics of the Earth shield excavation method based on field application cases, along with the verification of the validity of the 2D finite-element analysis technique and beam–column analysis employed in this study. The parameters and properties of the retaining wall and ground structures used in the numerical analysis were consistent with those employed in the field. Verification was conducted for Sites A and B, and the results of the field measurement and numerical analysis are depicted in Figure 5, illustrating the horizontal displacement of the retaining wall caused by ground excavation. As observed in the figure, the horizontal displacement resulting from step-by-step excavation progressively increased. For the validation, specific representative cross-sections of Sites A and B were selected, and the field measurements were based on the inclinometer readings from those cross-sections. The inclinometers were measured on a bi-weekly basis and the measurement reports for these sites were utilized.
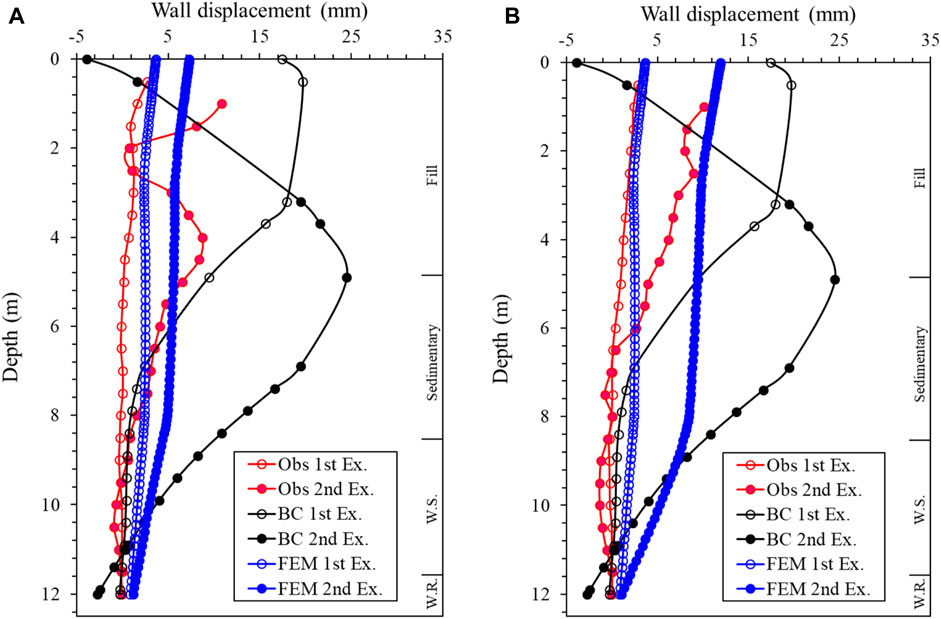
FIGURE 5. Horizontal displacement for Sections (A,B).
However, the maximum horizontal displacements for Sites A and B, at the final stage of excavation, were measured at 10.86 mm and 10.13 mm, respectively. These values fall within the allowable standard (δh,max < 0.2%H, where H represents the excavation depth). With increasing excavation depth, the finite-element analysis indicated a continuous increase in displacement, while the Elastic-Plastic Beam-on-Foundation analysis exhibited a tendency to decrease to approximately 0.0 mm. This disparity can be attributed to the fact that beam–column analysis is a one-dimensional approach, lacking the continuity analysis that considers the interaction between the ground and the structure. Consequently, it is inferred that as the excavation stage progressed, the combined force of the member force and Earth pressure on the upper analysis point of the wall became excessive in the beam–column analysis.
As a result, it was found that the finite-element analysis results were generally similar to the actual inclinometer measurements compared to the results of beam–column analysis. In fact, even if the inverse analysis is performed, it is a very demanding task to perfectly match the numerical analysis results with the measured values, and it is difficult to consider all site conditions such as ground material properties. This numerical analysis is a conservative result of the 2D analysis, and Figure 5A shows that the measured values at the final excavation stage are in error at 2 m and 4 m. In addition, it is judged that the calculation of ground properties does not reflect 100% of the actual ground properties. However, the validity of the finite element analysis was confirmed by the maximum displacement and the shape of the deformation profile of the wall.
The numerical analysis results were utilized to compare the horizontal displacement of the wall for each influencing factor, as depicted in Figure 6. In terms of unit weight, it was observed that the horizontal displacement tended to increase with an increase in weight. This can be attributed to the larger load on the wall resulting from the higher unit weight. For adhesion and friction angle, factors indicating the shear strength of the ground, the horizontal displacement decreased with increasing values due to the improved ground stiffness. Notably, the friction angle had a more pronounced effect on the horizontal displacement of the wall compared to the adhesion force. This finding can be attributed to the presence of a fill layer in most excavation sites, where adhesion force is absent. As indicated in Table 2, the absence of adhesion in the fill and sedimentary layers confirms their minimal impact on the wall relative to the friction angle. In regard to the elastic modulus, its impact was smaller than that of unit weight and friction angle, but still greater than that of adhesion. Based on these results, the priority of the influencing factors in terms of subgrade properties was determined as follows: friction angle > unit weight > elastic modulus > adhesion. The effects of surcharge load and initial GL, which can be categorized as external influencing factors, were found to be smaller compared to those of the ground material. Specifically, the horizontal displacement of the wall exhibited similar behavior regardless of the size of the surcharge load. Concerning the initial GL, it was observed that a higher initial GL led to larger horizontal displacement of the wall, attributed to the water pressure exerted on the wall (Figure 7B). The results related to the stiffness of the structure are presented in Figures 7C, D, indicating that the horizontal displacement of the wall was not significantly affected. While the stiffness of the members may have a substantial impact when considering member forces, the horizontal displacement of the wall is primarily influenced by the ground properties rather than the stiffness of the members. This is in line with the results of a research case analyzed through reverse analysis of an actual embedded retaining wall (Foo et al., 2023). In this study, each influencing factor was quantitatively analyzed and prioritized to provide information that can be used in actual design. Table 5 shows the shear strain results when the variation ratio for each influencing factor is set to the minimum (0.8) and maximum (1.2), and it is helpful to visually understand the effect of the change of each factor on the retaining walls.
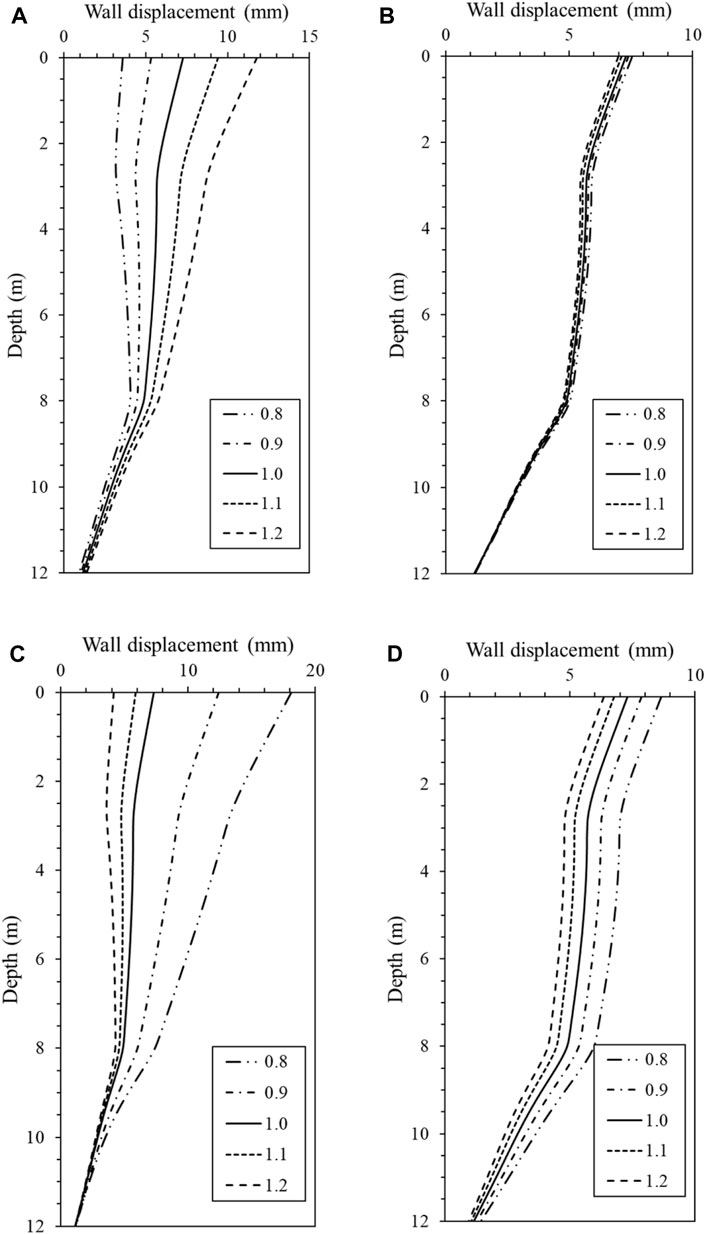
FIGURE 6. Results of numerical analysis of soil properties: (A) unit weight; (B) cohesion, (C) friction angle; and (D) elastic modulus.

FIGURE 7. Results of numerical analysis of external force and structure stiffness: (A) surcharge loading, (B) initial GL, (C) wall stiffness, and (D) strut stiffness.
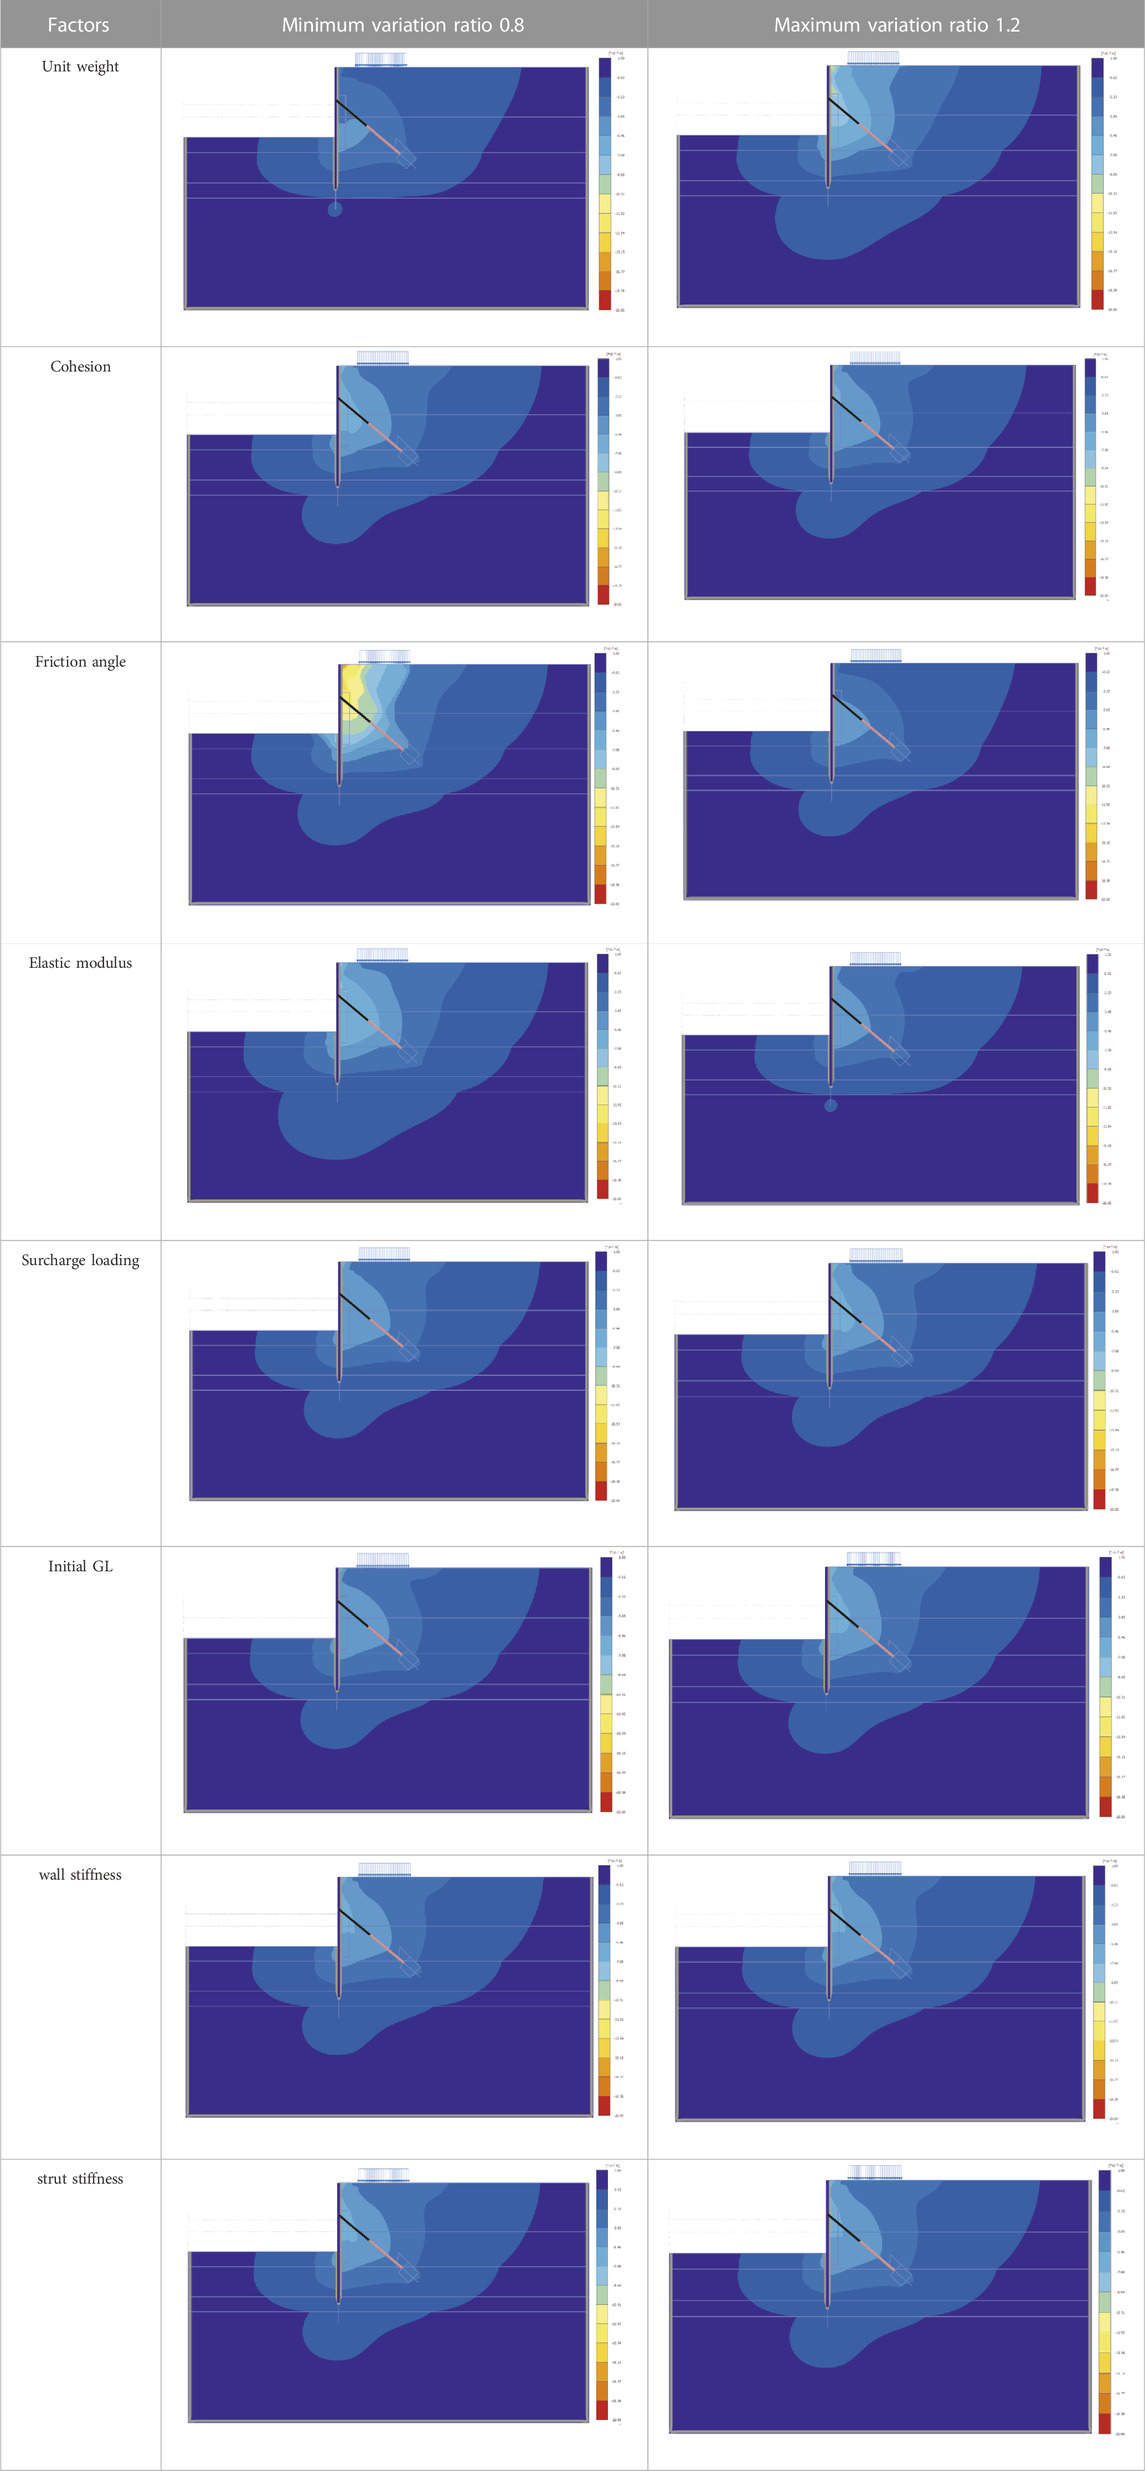
TABLE 5. Comparison of the shear strain for Earth retaining wall with variation ratio changes (Shear strain for the minimum and maximum changes of variation rate by influencing factor under the geometric conditions shown in Figure 4).
The sensitivity of the influencing factors was examined based on the displacement changes of the retaining wall as described in the previous section. Figure 8 illustrates the maximum displacement of the retaining wall in relation to the variation ratio of each influencing factor, including both increasing and decreasing ratios based on a reference ratio of one. As depicted in Figure 8A, the displacement demonstrated a substantial increase with an increase in unit weight. Conversely, as cohesion and elastic modulus values increased, the displacement exhibited a linear decrease. The friction angle displayed a significant impact on wall displacement, particularly when the value fell below the design constant. This finding is consistent with the results of the finite-element analysis conducted in this study, which demonstrated the direct influence of shear strength and friction angle on wall behavior, attributable to the M–C model. It should be noted that while this study focused on sandy soil and rocky ground, the impact of adhesion force is likely to be more pronounced in clay ground, unlike in the current investigation. Figure 8B reveals that an increase in the surcharge load and initial GL of the backfill ground corresponded to a decrease in the strength of the wall and support. This suggests that the influence of wall stiffness and support material strength, which directly affect the design of the excavation for retaining walls, is considered insignificant due to the role of the temporary structure (support material). However, the initial GL and surcharge load, acting as external loads, exhibited a substantial effect on the wall behavior.
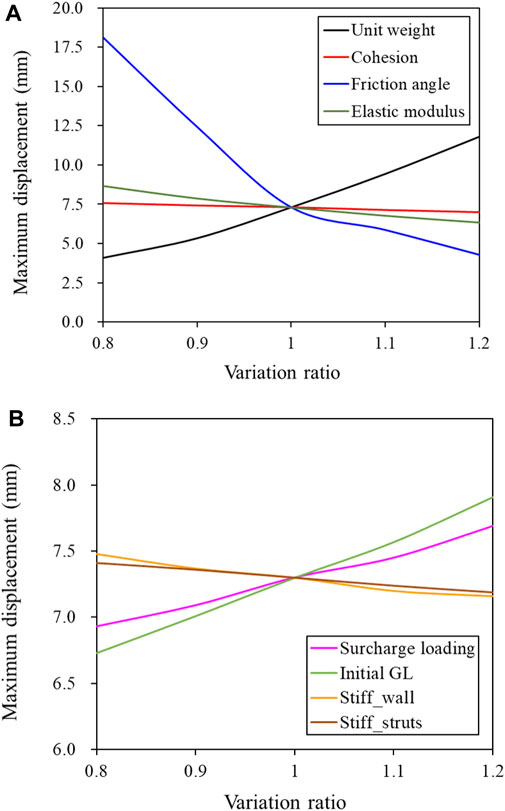
FIGURE 8. Relationship between variation ratio and maximum displacement: (A) soil properties and (B) external force and structural stiffness.
This study revealed that the variations in influencing factors had different effects depending on the soil type. Figure 9 illustrates the maximum displacement generated by each ground type as the variation ratio of the influencing factors changes. It can be observed that the extent of maximum displacement differs for each subgrade layer as the subgrade properties vary. When the variation ratio of unit weight is set to 0.8, indicating a 20% reduction from the design constant, the sedimentary layer exhibits the highest maximum displacement. The unit weights of the fill layer and the sedimentary layer, which are significantly lower in magnitude, measure 13.6 kN/m3 and 14.4 kN/m3, respectively. The lower degree of displacement change can be attributed to the presence of anchors constructed in the upper fill layer. Furthermore, it was observed that the maximum horizontal displacement occurs outside the range of anchor support during excavation with a maximum depth of 6.9 m. In terms of cohesion variability, no significant differences were observed among the various ground types, and the impact was negligible in weathered rock. Conversely, similar to unit weight, the friction angle exhibited a substantial effect on wall behavior as it increased or decreased compared to the design constant. Notably, in the fill layer, a significant change in maximum wall displacement occurs when the friction angle deviates more than 10% from the design constant. Furthermore, when the friction angle exceeds 1.2 times the design constant, the maximum displacement is observed in the sedimentary layer. This suggests that a decrease of more than 10% in the friction angle of the fill layer leads to a substantial displacement of 23°, exceeding the typical range of ground properties and resulting in displacements greater than 10 mm. In the sediment layer, with a 20% reduction in the design constant, the friction angle measures 22.4°, resulting in a wall displacement of approximately 12 mm. The relatively smaller displacement observed when the friction angle exceeds 1.2 times can be attributed to the influence of unit weight due to the presence of anchors in the upper fill layer. The effect of changes in elastic modulus value was found to be similar across the various ground types.
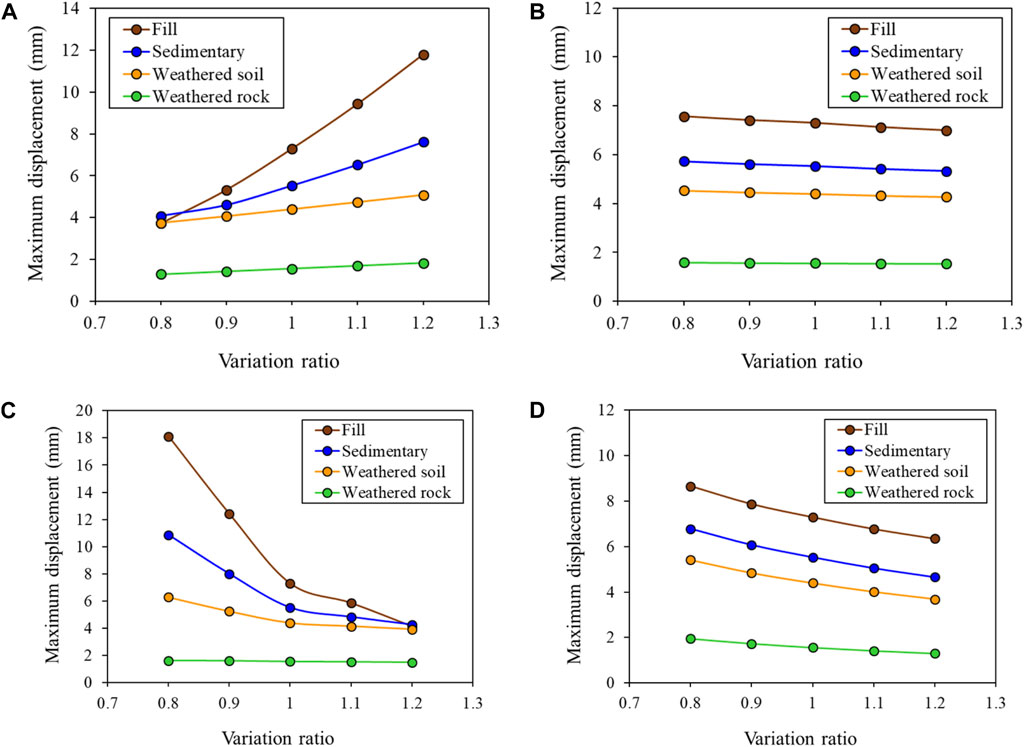
FIGURE 9. Relationship between variation ratio and maximum displacement by soil layer: (A) unit weight; (B) cohesion; (C) friction angle; and (D) elastic modulus.
Figure 10A displays the distribution of displacement data for the retaining wall based on the variation ratio of subgrade properties according to the subgrade type. The displacement values for each subgrade layer, as influenced by the variations in the four subgrade properties, follow the order of fill, sedimentary, weathered soil, and weathered rock. Regardless of the subgrade material, the average displacement value decreases from the fill layer to the weathered rock layer as the depth of excavation increases. The friction angle exerts the most significant influence among the subgrade properties, and outliers in displacement values can be observed in the sedimentary and weathered soil layers. In terms of the impact degree of subgrade type, the displacement value changes for unit weight and friction angle appear significant in the fill and sedimentary layers, while the overall subgrade material seems to be evenly affected in the weathered soil and weathered rock layers. Figure 10B presents the displacement data for the retaining wall according to ground type, considering external forces (surcharge pressure and initial GL) and structural stiffness. Unlike the results based on ground properties, it is challenging to discern specific variations in data distribution for influencing factors or ground types. However, the largest data distribution is observed in the weathered soil layer.
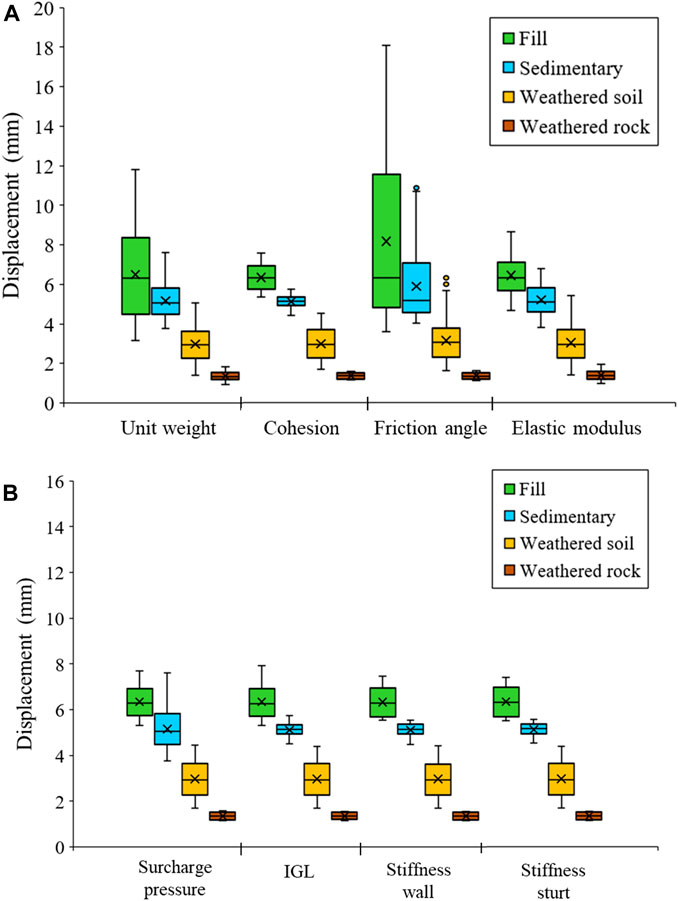
FIGURE 10. Variability of retaining wall displacement with soil type and influencing factors: (A) soil type and (B) external force and structural stiffness.
To assess the variability of data, we calculated the coefficient of variation (CV), a unitless measure widely used in various research fields to demonstrate data variation. The CV is obtained by dividing the standard deviation of the sample by the arithmetic mean. When units differ or data exhibit significant scale differences, the CV provides a means to compare variation equality. Figure 11 illustrates the CV for various influencing factors and subgrade types. Figure 11A displays the CV for all influencing factors, revealing similar variations except for the ground physical properties. The CV for subgrade material is greater compared to other influencing factors. The fill layer and sedimentary layer exhibit high variability in unit weight and friction angle, suggesting that these two properties significantly influence wall displacement in these ground types. In the weathered soil layer, the variability of all four geotechnical properties is similar, indicating that each property influences wall displacement. The weathered rock layer, located at the deepest level, demonstrates overall low variability. Unlike the other layers, the weathered rock layer exhibits a high CV for unit weight and elastic modulus.
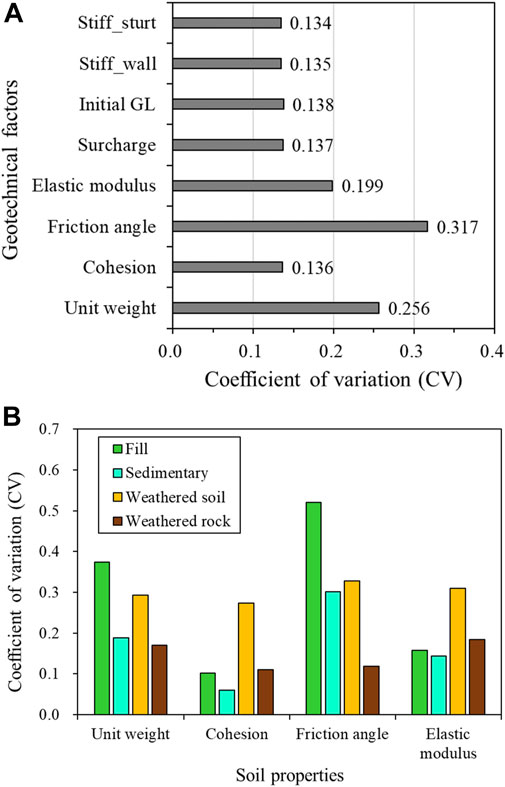
FIGURE 11. Coefficient of variation (CV) with influencing factors and soil type: (A) CV for influencing factors and (B) CV for soil properties and layers.
The results proposed in this paper can be applied to the calculation of geotechnical properties in the design stage of masonry walls. In the actual masonry wall design stage, the geotechnical properties are calculated based on the SPT N value for convenience, which is difficult to fully reflect the actual geotechnical properties. Therefore, it is believed that a more reliable wall design can be achieved if a minimum geotechnical investigation is performed for the influential factors as shown in Figure 11A.
This study aimed to analyze the key design factors influencing the stability of retaining wall-anchor-support structures during excavation in urban areas by considering field application results and conducting finite-element analysis. Based on the findings, the following conclusions can be drawn:
1) The finite-element analysis provided more accurate results compared to the conventional beam–column analysis in terms of considering soil pressure and displacement during ground excavation. The beam–column analysis, being one-dimensional, yielded a displacement of approximately 0 mm at the top of the wall, which does not correspond to the actual value. This discrepancy arises due to the excessive application of combined anchor force and Earth pressure as the excavation stage progressed. In contrast, the finite-element analysis accounted for the interaction between the ground and the structure, resulting in more realistic displacement values.
2) The selected influencing factors for the excavation of retaining walls included ground properties, external loads (such as GL and surcharge load), and structural stiffness. Variation ratios ranging from 0.8 to 1.2 were used to compare the quantitative results. The analysis revealed that an increase in unit weight and shear strength of the ground led to a decrease in the maximum horizontal displacement of the wall. On the other hand, the position of the GL, surcharge load, and structural stiffness had a negligible effect on wall displacement.
3) Sensitivity analysis of the influencing factors demonstrated that unit weight exhibited a positive correlation with ground properties, while cohesion, friction angle, and elastic modulus showed a negative correlation. Furthermore, the surcharge load and initial GL exhibited a positive correlation, whereas the stiffness exhibited a negative correlation. Of particular note is the friction angle, which proved to be a critical design variable as even small changes in its value resulted in significant variations in wall displacement.
4) The CV analysis highlighted the significance of the friction angle, unit weight, and elastic modulus as influential variables impacting the behavior of earth-membrane walls due to their substantial variability. The analysis also revealed that the fill layer exhibited variability in both friction angle and unit weight, while the weathered soil layer demonstrated uniform variability across all ground properties. Therefore, accurate property calculations for the corresponding ground layer are essential for the precise design of retaining walls.
5) A quantitative analysis of geotechnical factors affecting wall displacement during excavation was conducted to determine the ranking of factors with large influence. The calculation of ground physical parameters during the design phase of an actual Earth retaining wall is thought to be possible using this conclusion. Currently, there are limitations in considering the actual ground physical properties by calculating the ground physical properties based on SPT N-values in the design. Based on the findings of this study, it is determined that if a minimal ground survey is carried out for highly influential ground features, a more dependable wall design may be feasible. In conclusion, it is determined that by carrying out a design based on the accurate calculation of parameters, it is possible to design economically while providing stability by changing the cross section of the wall and the type of support material (anchor, strut etc.).
6) Although there are many previous studies on the deformation of Earth retaining walls during excavation, there is lack of validation study that examines the stability of various influencing factors such as wall, soil properties, and external influencing factors. Furthermore, there is no study that prioritizes these factors and presents them as a basis for Earth retaining wall design. Based on the results obtained at a specific site, this study conducted an examination of the influence for geotechnical parameters. In addition, based on an actual field case, this study conducted an influence factor analysis on one typical site for Earth retaining walls using a variety of combinations of wall types, ground conditions, and support material types. In order to execute the analysis properly, different wall types and ground conditions should be taken into consideration. However, because there are limitless combinations of these circumstances, this study concentrated on site characteristics and wall construction techniques that are primarily employed in South Korea. Further study is expected to be able to offer data that may be used to enhance the actual design effectiveness of various Earth retaining wall construction techniques.
The original contributions presented in the study are included in the article/supplementary material, further inquiries can be directed to the corresponding author.
SS: Data curation, Formal Analysis, Methodology, Visualization, Writing–original draft. JP: Formal Analysis, Writing–review and editing. YK: Resources, Writing–review and editing. GK: Writing–review and editing. MC: Funding acquisition, Resources, Writing–review and editing.
The author(s) declare financial support was received for the research, authorship, and/or publication of this article. This research was supported by the Korea Institute of Civil Engineering and Building Technology through the project “Development of Smart Complex Solution for Large-Deep Underground Space Using Artificial Intelligence” (grant No. 20230105-001).
The authors declare that the research was conducted in the absence of any commercial or financial relationships that could be construed as a potential conflict of interest.
All claims expressed in this article are solely those of the authors and do not necessarily represent those of their affiliated organizations, or those of the publisher, the editors and the reviewers. Any product that may be evaluated in this article, or claim that may be made by its manufacturer, is not guaranteed or endorsed by the publisher.
Bhatkar, T., Barman, D., Mandal, A., and Usmani, A. (2017). Prediction of behaviour of a deep excavation in soft soil: a case study. Int. J. Geotechnical Eng. 11 (1), 10–19. doi:10.1080/19386362.2016.1177309
Boscardin, M. D., and Cording, E. J. (1989). Building response to excavation-induced settlement. J. Geotechnical Eng. 115 (1), 1–21. doi:10.1061/(asce)0733-9410(1989)115:1(1)
Bowles, J. E. (1996). Foundation analysis and design. 5th Edn. New York: The McGraw-Hill Companies, Inc.
Caspe, M. S. (1966). Surface settlement adjacent to braced open cuts. J. Soil Mech. Found. Div. ASCE 92 (SM4), 51–59. doi:10.1061/JSFEAQ.0000889
Chen, S. L., Ho, C. T., and Gui, M. W. (2014). Diaphragm wall displacement due to creep of soft clay. Proc. Institution Civ. Engineers-Geotechnical Eng. 167 (3), 297–310. doi:10.1680/geng.11.00050
Clough, G. W., and O’Rourke, T. D. (1990). “Constructed induced movements of in-situ walls,” in In Proc. ASCE Specialty Conference (Cornell). doi:10.1061/(ASCE)0733-9410(1992)118:4(665)
Clough, G. W., and Tsui, Y. (1974). Performance of tied-back walls in clay. J. Geotechnical Eng. Div. 100 (12), 1259–1273. doi:10.1061/AJGEB6.0000128
Dmochowski, G., and Szolomicki, J. (2021). Technical and structural problems related to the interaction between a deep excavation and adjacent existing buildings. Appl. Sci. 11 (2), 481. doi:10.3390/app11020481
Do, T. N., and Ou, C. Y. (2020). Factors affecting the stability of deep excavations in clay with consideration of a full elastoplastic support system. Acta Geotech. 15 (7), 1707–1722. doi:10.1007/s11440-019-00886-8
Dong, Y. P., Burd, H. J., and Houlsby, G. T. (2018). Finite element parametric study of the performance of a deep excavation. Soils Found. 58 (3), 729–743. doi:10.1016/j.sandf.2018.03.006
Fearnhead, N., Maniscalco, K., Standing, J. R., and Wan, M. S. (2014). Deep excavations: monitoring mechanisms of ground displacement. Proc. Institution Civ. Engineers-Geotechnical Eng. 167 (2), 117–129. doi:10.1680/geng.13.00047
Foo, C. F., Le, T., Bailie, P., and Standing, J. R. (2023). “Back-analysis of an embedded retaining wall in stiff clay,” in Proceedings of the Institute of Civil Engineers-Geotechnical Engineering. doi:10.1680/jgeen.22.00072
Goh, A. T. C., Zhang, R. H., Wang, W., Wang, L., Liu, H. L., and Zhang, W. G. (2020). Numerical study of the effects of groundwater drawdown on ground settlement for excavation in residual soils. Acta Geotech. 15, 1259–1272. doi:10.1007/s11440-019-00843-5
Hsieh, P. G., and Ou, C. Y. (1998). Shape of ground surface settlement profiles caused by excavation. Can. geotechnical J. 35 (6), 1004–1017. doi:10.1139/t98-056
Hsiung, B. C. B. (2009). A case study on the behaviour of a deep excavation in sand. Comput. Geotechnics 36 (4), 665–675. doi:10.1016/j.compgeo.2008.10.003
Jeong, S. S., and Kim, Y. H. (2009). Characteristics of collapsed retaining walls using elasto-plastic method and finite element method. J. Korean Geotechnical Soc. 25 (4), 19–29. doi:10.7843/kgs.2020.36.1.29
Khoiri, M., and Ou, C. Y. (2013). Evaluation of deformation parameter for deep excavation in sand through case histories. Comput. Geotechnics 47, 57–67. doi:10.1016/j.compgeo.2012.06.009
Lee, S. J., Song, T. W., Lee, Y. S., Song, Y. H., and Kim, H. K. (2007). A case study of building damage risk assessment due to the multi-propped deep excavation in deep soft soil. 4th Int. Conf. Soft Soil Eng. Vancouver, London, Taylor Francis.
Mana, A. I., and Clough, G. W. (1981). Prediction of movements for braced cuts in clay. J. Geotechnical Eng. Div. 107 (6), 759–777. doi:10.1061/AJGEB6.0001150
Naylor, D. J., and Pande, G. N. (1981). Finite elements in geotechnical engineering. Swansea, UK: Pineridge Press.
Ng, C. W. W. (1992). An evaluation of soil-structure interaction associated with a multi-propped excavation. PhD thesis. Bristol, England: Univ. of Bristol.
Ou, C. Y., Hsieh, P. G., and Chiou, D. C. (1993). Characteristics of ground surface settlement during excavation. Can. geotechnical J. 30 (5), 758–767. doi:10.1139/t93-068
Park, C. S., and Joung, S. M. (2020). Numerical investigations on the excavation width and property of deformation of earth retaining wall. J. Korean Geotechnical Soc. 36 (12), 57–68. doi:10.7843/kgs.2020.36.12.57
Peck, R. B. (1969). “Deep excavations and tunneling in soft ground. State-of-the-Art report,” in Proc. of the 7th International Conference on Soil Mechanics and Foundation Engineering (Mexico City: State-of-the-Art), 225–290. Plaxis 2D ver 2022 manuals, Bentley.
Poh, T. Y., and Wong, I. H. (1998). Effects of construction of diaphragm wall panels on adjacent ground: field trial. J. geotechnical geoenvironmental Eng. 124 (8), 749–756. doi:10.1061/(asce)1090-0241(1998)124:8(749)
Powrie, W., and Kantartzi, C. (1996). Ground response during diaphragm wall installation in clay: centrifuge model tests. Geotechnique 46 (4), 725–739. doi:10.1680/geot.1996.46.4.725
Ran, L., Ye, X. W., and Zhu, H. H. (2011). Long-term monitoring and safety evaluation of a metro station during deep excavation. Procedia Eng. 14, 785–792. doi:10.1016/j.proeng.2011.07.099
Schäfer, R., and Triantafyllidis, T. (2004). Modelling of earth and water pressure development during diaphragm wall construction in soft clay. Int. J. Numer. Anal. Methods Geomechanics 28 (13), 1305–1326. doi:10.1002/nag.388
Schäfer, R., and Triantafyllidis, T. (2006). The influence of the construction process on the deformation behaviour of diaphragm walls in soft clayey ground. Int. J. Numer. Anal. methods geomechanics 30 (7), 563–576. doi:10.1002/nag.480
Son, M., and Cording, E. J. (2005). Estimation of building damage due to excavation-induced ground movements. Geotech. Geoenvironmental. Eng. 131 (2), 162–177. doi:10.1061/(ASCE)1090-0241(2005)131:2(162)
Son, M., and Cording, E. J. (2007). Evaluation of building stiffness for building response analysis to excavation-induced ground movements. Geotech. Geoenvironmental. Eng. 133 (8), 995–1002. doi:10.1061/(ASCE)1090-0241(2007)133:8(995)
Song, J. S., and Yoo, C. S. (2018). Effect of ground water table on deep excavation performance. J. Korean Geosynth. Soc. 17 (3), 33–46. doi:10.12814/jkgss.2018.17.3.033
St John, H. D. (1975). Field and theoretical studies of the behaviour of ground around deep excavations in London clay. PhD thesis. Cambridge, UK.: Cambridge University.
Symons, I. F., and Carder, D. R. (1993). “Stress changes in stiff clay caused by the installation of embedded retaining walls,” in Retaining structures (Thomas Telford Publishing), 227–236.
Tanner Blackburn, J., and Finno, R. J. (2007). Three-dimensional responses observed in an internally braced excavation in soft clay. J. Geotechnical Geoenvironmental Eng. 133 (11), 1364–1373. doi:10.1061/(asce)1090-0241(2007)133:11(1364)
Wong, I. H., and Poh, T. Y. (2000). Effects of jet grouting on adjacent ground and structures. J. Geotechnical Geoenvironmental Eng. 126 (3), 247–256. doi:10.1061/(asce)1090-0241(2000)126:3(247)
Wu, I. C., Lu, S. R., and Hsiung, B. C. (2015). A BIM-based monitoring system for urban deep excavation projects. Vis. Eng. 3, 2–11. doi:10.1186/s40327-014-0015-x
Yoo, C. S., and Kim, Y. J. (2000). Behavior of propped walls during deep excavation. J. Korean Geosynth. Soc. 20 (3), 195–204.
Zhang, D. M., Xie, X. C., Li, Z. L., and Zhang, J. (2020). Simplified analysis method for predicting the influence of deep excavation on existing tunnels. Comput. Geotechnics 121, 103477. doi:10.1016/j.compgeo.2020.103477
Zhang, W., Goh, A. T., and Xuan, F. (2015). A simple prediction model for wall deflection caused by braced excavation in clays. Comput. Geotechnics 63, 67–72. doi:10.1016/j.compgeo.2014.09.001
Keywords: Earth retaining wall, excavation, deformation, parametric study, finite-element method
Citation: Seo S, Park J, Ko Y, Kim G and Chung M (2023) Geotechnical factors influencing earth retaining wall deformation during excavations. Front. Earth Sci. 11:1263997. doi: 10.3389/feart.2023.1263997
Received: 20 July 2023; Accepted: 23 November 2023;
Published: 06 December 2023.
Edited by:
Sandipan Das, Symbiosis International University, IndiaCopyright © 2023 Seo, Park, Ko, Kim and Chung. This is an open-access article distributed under the terms of the Creative Commons Attribution License (CC BY). The use, distribution or reproduction in other forums is permitted, provided the original author(s) and the copyright owner(s) are credited and that the original publication in this journal is cited, in accordance with accepted academic practice. No use, distribution or reproduction is permitted which does not comply with these terms.
*Correspondence: Moonkyung Chung, bWtjaHVuZ0BraWN0LnJlLmty
Disclaimer: All claims expressed in this article are solely those of the authors and do not necessarily represent those of their affiliated organizations, or those of the publisher, the editors and the reviewers. Any product that may be evaluated in this article or claim that may be made by its manufacturer is not guaranteed or endorsed by the publisher.
Research integrity at Frontiers
Learn more about the work of our research integrity team to safeguard the quality of each article we publish.