 Yaokun Fu
 Yongzheng Wu2,3
 Yanjun Zhang
95% of researchers rate our articles as excellent or good
Learn more about the work of our research integrity team to safeguard the quality of each article we publish.
Find out more
ORIGINAL RESEARCH article
Front. Earth Sci. , 27 September 2023
Sec. Geoinformatics
Volume 11 - 2023 | https://doi.org/10.3389/feart.2023.1260913
This article is part of the Research Topic Instability Mechanisms and Disaster Prevention of Coal and Rock in Deep Underground Space View all 12 articles
Due to its unique geomorphological characteristics, the loess gully region is easy to produce ground fissures under the action of coal mining, destroy the ground infrastructures, induce geological disasters, and threaten the safety of people’s lives and property. Therefore, it is particularly important to accurately obtain information about the development of mining-induced ground fissures and study their spatial-temporal evolution mechanism. Based on the 1212 working face of a mining area in Yulin City, Shaanxi Province, this paper studies the extraction method and spatial-temporal evolution mechanism of ground fissures by combining remote sensing images and field survey data. The study shows that this proposed method significantly reduces noise points and mis-extraction, and the accuracy is more than 80%, improving the extraction accuracy of ground fissures and making the process more automated. By comparing the extraction accuracy of ground fissures at different flight altitudes, we determine that the optimal flight altitude for the research area is 60 m. At the beginning of the working face mining stage, the proportion of low-density areas of ground fissures continues to increase. Some low-density areas transition into high-density areas, which is consistent with the progress of the working face advancement. After the end of the working face retreat, the width of the ground fissures tends to be evenly distributed. The mining-induced ground fissures in the Loess gully and ravine region have good self-similarity. A dynamic development model of ground fissures is constructed to reveal its formation mechanism. The research conclusions can provide a technical support for geological disaster monitoring and land ecological restoration in mining areas.
Coal, often referred to as “black gold,” is one of the main sources of energy in the world, as shown in Table 1 (Brodny and Tutak, 2019; Zhang et al., 2021; IEA, 2022). As of the end of 2021, coal accounted for 26.9% of the world’s primary energy consumption structure (Chen et al., 2022). While coal mining brings significant social and economic benefits, it also brings a series of problems to the ecological environment (Wang et al., 2022; Yang et al., 2022). Ground fissures, resulting from the deformation coupling of topsoil and overlying rock layers in mined-out areas, represent a major geological disaster induced by coal mining (Cicmanec et al., 2008; Chen and Hu, 2018). Mining-induced ground fissures exacerbate soil and water loss, damage buildings, transportation routes, and other engineering facilities, and can trigger secondary geological disasters (such as landslides and collapses), endangering people’s lives and property (Yang and Fan, 2017; Tang et al., 2020). Therefore, timely and accurate identification of ground fissures is fundamental to ensuring sustainable development in mining areas and restoring the ecological environment (Zhang et al., 2013).
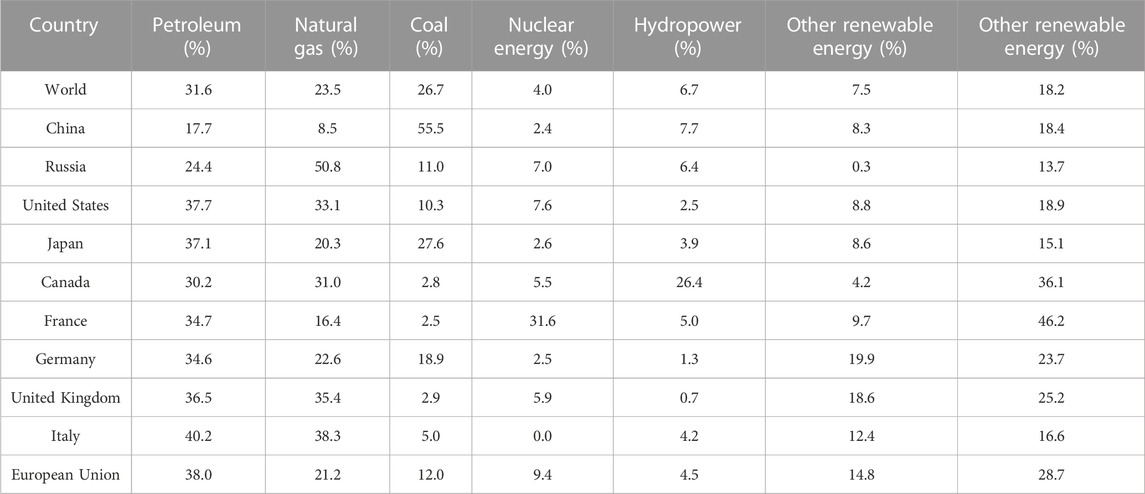
TABLE 1. The proportion of primary energy consumption in the world’s major countries in 2022.
Currently, ground fissure investigation methods mainly include manual inspections and remote sensing satellite monitoring (Hang et al., 2014; Cheng et al., 2020). Traditionally, researchers searched for ground fissures by vehicle or on foot, measuring and recording them with instruments such as tape measures, total stations, and cameras, followed by subsequent data analysis (Bian et al., 2014; Xu et al., 2021). While manual inspection methods provide high accuracy, they are time-consuming and labor-intensive, and researchers’ safety cannot be guaranteed (given the large number of ground fissures, many of which are located in dangerous areas) (Peng et al., 2018; Zhu et al., 2023). Some scholars have extracted ground fissure features using satellite remote sensing images. For example, Fan et al. (2015) identified 1,802 ground fissures in the Yushenfu mining area through remote sensing interpretation combined with field investigations, discovering that they are mainly distributed in high-intensity mining areas. Wang (2016) used World View-2 data and a method combining human-computer interaction interpretation and field verification to analyze the cause and hazard degree of geological disasters in the Wudong mining area, providing a basis for relevant departments to make geological disaster prevention and control decisions. Zhang et al. (2019) proposed a step-by-step extraction method to extract ground fissures based on GeoEye remote sensing images, achieving an accuracy rate of 85.7%. However, the use of satellite images to extract ground fissures is limited in terms of spatiotemporal resolution and fails to reflect the developmental characteristics of ground fissures (Hou et al., 2019).
In recent years, UAV remote sensing technology has developed rapidly, offering advantages such as low cost, high resolution, and rapid efficiency. It can quickly acquire high-resolution images and has been widely applied in geological disaster investigations in mining areas (Zhao et al., 2021). Compared to satellite remote sensing technology, UAV images can clearly reflect the morphology, location, and other features of ground fissures (Zhao et al., 2013; Xiang et al., 2019). Some achievements have already been made in extracting ground fissures using UAV images. For example, Zhang et al. (2022b)); Zhang et al. (2022 Y.) used low-altitude UAVs to obtain high-resolution images of the 8092 working face in a certain Ordos mining area, identifying ground fissures using a method combining primary and auxiliary methods with an accuracy of 95%; Wei et al. (2012) used UAV images and TM images from the Maji Ridge mining area in Shanxi Province as data sources and successfully extracted ground fissure information by establishing a knowledge model, proving that the method has high accuracy; Zhang et al. (2020) based on the background information of UAV images, constructed different datasets through cluster analysis and effectively extracted mining area ground fissures using a combination of machine learning and image processing algorithms, achieving an overall accuracy of 88.99%; Li et al. (2014); Wei et al. (2018) accurately extracted ground fissure information using threshold segmentation algorithms and first-order Gaussian difference matching filter algorithms based on UAV image data, providing technical support for geological disaster monitoring. However, the above studies still have the following problems: (1) Although manual visual interpretation extraction of ground fissures has high accuracy, it is time-consuming and laborious due to the complex morphology and large number of ground fissures. (2) UAV images enhance object details but increase the differences between similar objects, making classification more difficult. (3) A single image processing algorithm cannot achieve high accuracy and automated extraction of ground fissures.
In summary, this paper takes the 1212 working face of a certain mining area in Yulin City, Shaanxi Province as the research area. Based on UAV remote sensing image data, we propose a method to extract ground fissures by combining geometric morphology and optical features, achieving high accuracy and automated extraction of ground fissures. We analyze the timing characteristics of ground fissures from three aspects: density, width, and fractal dimension, aiming to provide technical support for geological disaster monitoring and protection in mining areas.
The research area is located in the northwest of Yulin City, Shaanxi Province, China (Figure 1). The terrain within the mining area is quite varied, with loess gullies and ravines crisscrossing the landscape, sparse vegetation, and characterized as a typical ecologically vulnerable area. This area has a temperate semi-arid continental climate, four distinct seasons, large temperature differences, and low annual precipitation that mainly occurs in June, July, and August. The average annual precipitation is 440.8 mm, and the average annual temperature is 8.5°C. In order to correspond the very pronounced ground fissures in Figure 1 to the mining range of the working face, we named them as fissures a-c. At the same time, these ground fissures are marked in Figure 14 (Distribution of ground fissures) in Section 4.3.3. By comparing Figure 1 and Figure 14, the relative relationship between ground fissures and the range of working face can be obtained.
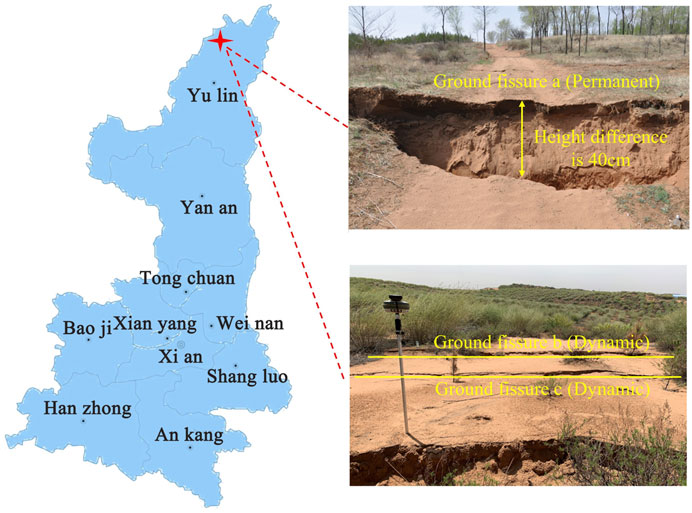
FIGURE 1. Geographical location of the study area.
Large-scale coal mining has led to many environmental problems, exacerbating the degradation of the ecological environment, such as ground fissures. Traditional underground mining methods disrupt the original stress balance of the overlying rock layers, and due to the special loess gully and ravine topography of the mining area, numerous ground fissures can form at the surface. Therefore, this paper takes the active ground fissure area of the 1212 working face in the mining area as the research object, obtaining multiple periods of UAV images through UAV photogrammetry. The size of the 1212 working face is 1965 × 170.4 m2. The mined coal seam is the #2 coal seam. The average mining depth is 178 m, and the average coal thickness is 4.8 m. The working face employs a fully mechanized top-coal caving method, with the roof managed by complete collapse.
The research area has complex terrain, requiring a preliminary field survey before actual flight. In order to determine the UAV flight altitude, it is necessary to clarify the general width of ground fissures in the observation area, as well as the presence of buildings or other factors that may affect the UAV flight. In this experiment, the control point is a cross with a size of 1m × 1 m and a width of 10–15 cm. In order to facilitate subsequent data processing, red paint is sprayed in the center of the cross, and RTK is used to record its plane position. The imaging collection equipment used in this experiment is the DJI M100 quadcopter (Figure 2). The UAV is equipped with a DJI X3 gimbal visible light sensor.
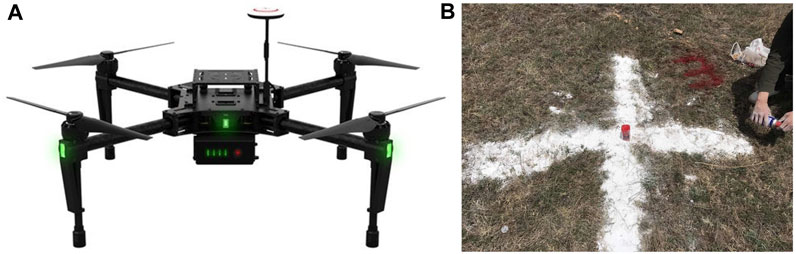
FIGURE 2. DJI M100 UAV and control point. (A) UAV, (B) Control point.
Based on the size of the pixel and the focal length of the objective lens, the UAV flight altitude was calculated to be 58 m. Considering the complex terrain of the study area (loess gully and ravine region), there are differences in the accuracy of images taken at different flight altitudes. Therefore, photogrammetric measurements were taken at three flight altitudes: 50m, 60m, and 70 m. The observation time was from May to June 2019, with an along-track overlap of 80% and a side overlap of 60%. The UAV flew six times each day (for each of the three flight altitudes), each flight height obtaining 500–600 images.
In this experiment, Pix4D software was chosen to correct and mosaic the UAV images to generate 3D model, Digital Orthophoto Map (DOM) and Digital Surface Model (DSM). During the UAV photogrammetric measurement process, factors such as unstable camera signals and lighting conditions led to uneven image color and low clarity, resulting in low ground fissure extraction accuracy. Therefore, prior to ground fissure extraction, the images needed to undergo gray-scale stretching and noise filtering (Chen et al., 2009). Gray-scale stretching, also known as contrast stretching, improves the dynamic range of gray levels during image processing through linear transformation functions. Common noise filtering includes three processing methods, namely, mean filtering, median filtering, and bilateral filtering. By comparing the results of the three filtering methods, bilateral filtering was chosen for image processing. The results of gray-scale stretching and filtering are shown in Figure 3.
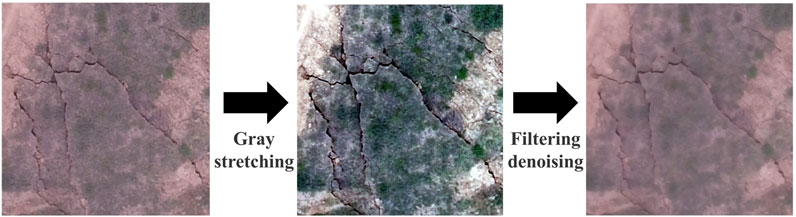
FIGURE 3. UAV image preprocessing results.
Common object extraction methods mainly include edge detection algorithms, threshold segmentation algorithms, and random forest classification algorithms. These methods often require a large volume of training samples, and determining the threshold can be challenging. In view of this, we propose a method for extracting ground fissures that does not require training samples or manual intervention. The essence of this method is the combination of geometric morphology and optical characteristics, and the application of the K-means clustering method for ground fissure extraction. Ground fissure extraction mainly includes two steps: first, combining the regional gradient changes of ground fissures in the image and the statistical feature differences with other objects to obtain an indicator that can highlight ground fissures; second, drawing on the idea of classification, using the K-means clustering method to achieve automatic extraction of ground fissures.
The purpose of the gradient is to find the extremes of a function, which is a vector. The gradient represents the maximum value of the directional derivative of the function at a certain point, and the maximum value of the function at that point is the modulus of that gradient (Chen et al., 2023). Suppose the binary function
When the directional derivative of a certain point is consistent with the gradient direction, the modulus of the gradient is the maximum value:
The K-means clustering algorithm is a widely used and versatile algorithm, and is also an unsupervised classification algorithm that does not require any prior knowledge (Liu et al., 2010). The essence of the K-means clustering algorithm is to determine K categories according to the actual situation, and to repeatedly iterate and divide different categories, so as to divide a group of unlabeled data into the specified K categories (the premise is that the samples in the K categories have common features). The main steps of the K-means clustering algorithm are: (1) determine the number of classifications to be carried out, K, that is, K sets can be obtained through clustering; (2) randomly select K samples from the data set of samples to be classified as the initial K class centers; (3) calculate the Euclidean distance from each sample point in the data set to the K class centers. If a certain sample data is closest to a certain class center, this sample is classified into the current class, and K categories of sets are obtained and the mean of each set is calculated to update the class center; (4) repeat steps (2) to (3) until the position of the class center changes little, and the samples in each category are relatively stable, and the iteration ends (Liu et al., 2010).
The equation for calculating the centroid of each category set is:
Assuming K=2, the K-means clustering algorithm can be described by Figure 4.
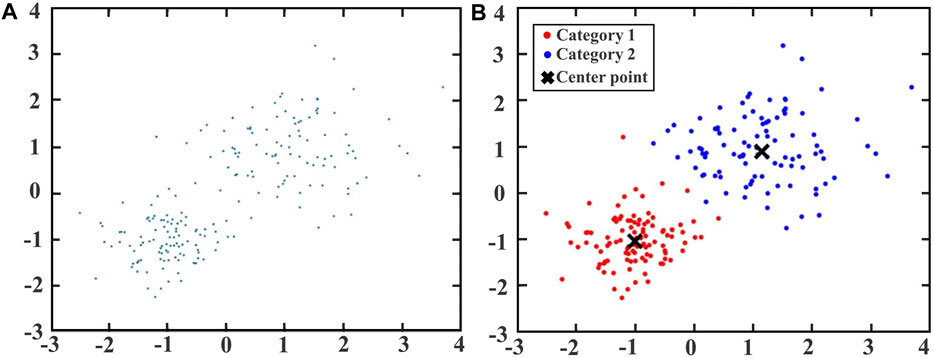
FIGURE 4. Principle of K-means clustering algorithm. (A) Randomly generate samples, (B) Clustering results.
Given the unique terrain of the Loess gully and ravine region and the shortcomings of existing methods, we propose a ground fissure extraction method that combines geometric morphology and optical features (hereafter referred to as “the method”), the main process of which is as follows:
(1) Based on the characteristic that the image gradient reaches its maximum value at the edge position, calculate the gradient value and use it as one of the statistical features of the object (Figure 5A);
(2) Calculate the number of homogeneous points in the sliding window template based on the RGB observation values of the image, as the second statistical feature of the object (Figure 5B);
(3) Combine the RGB observation values of points on the image as the third statistical feature;
(4) Use the K-means unsupervised classifier to judge object attributes based on the three statistical features. Since the selected range is small, we set K=2 in this experiment, dividing into two categories: fissures and non-fissures.
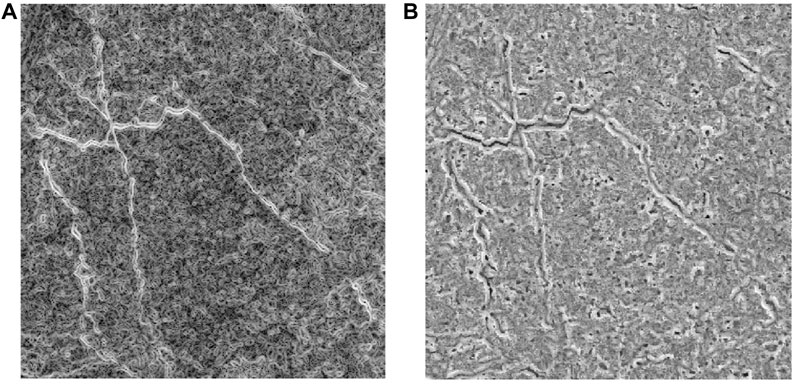
FIGURE 5. Statistical features. (A) Image gradient, (B) Homogeneous sample map.
The calculation process for the number of homogeneous samples is as follows: Suppose a 3x3 window is divided with a pixel point as the center. The 8 pixel points within its neighborhood and the central pixel point are the same type of object. Use the 9 points above to fit into a chi-square distribution model, look up the degree of freedom to obtain the quantile, and calculate the confidence interval; Determine whether the pixel values in the window (centered on the pixel point) fall within the confidence interval to obtain the number of homogeneous points corresponding to each center pixel point.
As can be seen from Figure 5, the selected two features can distinctly highlight the characteristic information of ground fissures and can well differentiate between ground fissure objects and non-ground fissure objects.
The ground fissure extraction method proposed in this paper is similar to traditional edge detection algorithms (with gradient as one of the statistical features), and the extracted ground fissures are some edge “thin lines” and have some holes. To eliminate mis-extracted targets and noise, and to fill in the holes in the ground fissures, morphological methods are used to denoise the binary images and fill in the holes in the ground fissures (Li et al., 2018).
The most common operations in mathematical morphology are dilation and erosion operations, and closing and opening operations. To avoid the global impact on the target caused by the above algorithms, some scholars have connected the fracture phenomenon using the hit or miss algorithm. We draw on this method to refine the extracted binary images of ground fissures (Figure 6). The specific process is as follows:
(1) For the initially extracted binary images of ground fissures, use closing operations to fill in the holes within the ground fissures and clear small amounts of noise points on the edge. Smooth linear edges using opening operations;
(2) Treat noise points as isolated points and remove them. In the window template range at the center of each pixel (matching the image with a 3x3 sliding window centered on the pixel), if there are no extra pixels in the window, consider this pixel point as an isolated point and remove it.
(3) After most isolated points have been eliminated, apply main filtering to further process larger isolated patches.
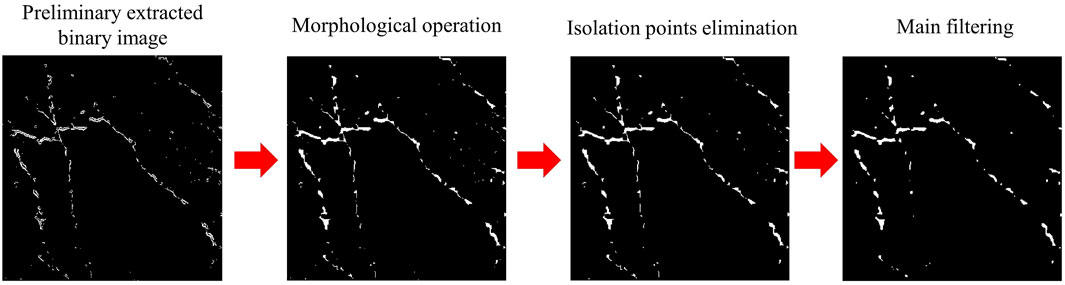
FIGURE 6. Ground fissure polishing treatment.
Noise is a random change of brightness or color information in the image, which is mainly due to the fact that the sensor is subject to factors such as homogeneous heterospectrum and homogeneous heterogeneity during the imaging process. In this paper, a variety of methods are used to remove the noise points in the image. (1) Firstly, before the extraction of ground fissures, the image is subjected to gray-scale stretching and noise filtering. By comparing the commonly used filtering methods, bilateral filtering is selected to process the image. Bilateral filtering is a kind of nonlinear filtering. The filtering method takes into account the spatial proximity information and color similarity information at the same time. While filtering out noise and smoothing the image, it also preserves the edge information. By comparing the results of visual interpretation, it is found that bilateral filtering can filter out noise points on the UAV image and retain and highlight the ground fissure information. (2) Secondly, ground fissures are extracted by the method proposed in this paper. This method combines the difference of statistical characteristics and regional gradient changes between ground fissures and other features in optical images, can obtain indicators that highlight ground fissures. This can effectively distinguish between ground fissures and non-ground fissures, and greatly reduce noise points. This is confirmed in Section 4.2 (ROC curve quantitative evaluation). (3) Finally, morphological methods are used to denoise the binary images. The methods remove the noise points as isolated points based on whether there are redundant pixels in the 3 × 3 sliding window. Due to the serious development of ground fissures in the study area, their width and length are large, so they will not be removed as noise points. It can be seen from Figure 6 that many noise points are removed by the above methods.
In order to verify the superiority of the method proposed in this paper in ground fissure extraction, we used three common methods: edge detection algorithm, threshold segmentation algorithm, and random deep forest (RF) classification algorithm, to extract ground fissures, and compared the experimental results in detail. Figure 7 is the ground fissure extraction results.
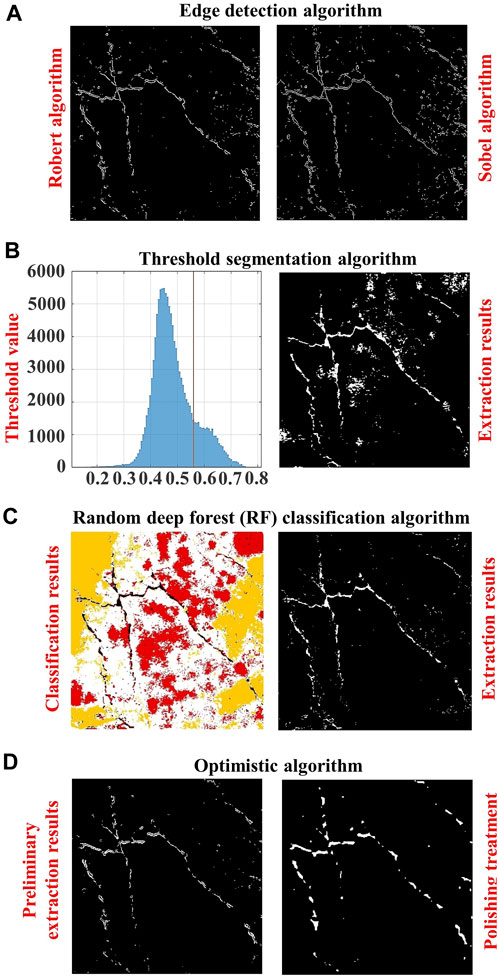
FIGURE 7. Ground fissure extraction results. (A) Edge detection algorithm, (B) Threshold segmentation algorithm, (C) Random deep forest (RF) classification algorithm, (D) Optimistic algorithm.
There are many ways to use the edge detection algorithm. After several experiments, we finally chose the Robert algorithm and the Sobel algorithm. As can be seen from Figure 7A, the overall effect of ground fissure extraction using the edge detection algorithm is not good, and obvious noise exists in the ground fissure results extracted by both methods. The extraction effect of the Robert algorithm is slightly better than the Sobel algorithm, indicating that the Robert algorithm is more suitable for extracting mining-induced ground fissures in the Loess gully and ravine region.
Through the maximum interclass variance method, we calculated that the threshold most suitable for segmenting fissures in the study area is 0.56. As can be seen from Figure 7B, there are a large number of weeds in the ground fissure results extracted using the threshold segmentation algorithm. These weeds have similar spectral features to ground fissures, resulting in a large number of mis-extractions. Therefore, the threshold segmentation algorithm is not suitable for extracting mining-induced ground fissures in the Loess gully and ravine region.
The RF classification algorithm in this experiment was completed in the random forest plugin of ENVI5.0. According to the actual situation of the Loess gully and ravine region, four types of objects including ground fissures were chosen for classification, including two types of vegetation, roads, and fissures. Finally, the other three types of objects in the classification results were combined into one type of object to obtain the ground fissure extraction results. As can be seen from Figure 7C, using the RF classification algorithm can intuitively distinguish ground fissures from other objects and highlight the features of ground fissures. Compared with the edge detection and threshold segmentation algorithms, the extraction effect of ground fissures is better, the noise in the image is significantly reduced, and the mis-extraction phenomenon is also improved, indicating that the RF algorithm is more suitable for extracting mining-induced ground fissures in the Loess gully and ravine region. However, the RF classification algorithm requires a large number of accurate training samples, and compared to other methods, it requires more work.
As can be seen from Figure 7D, the optimized algorithm proposed in this paper has a noticeably superior extraction effect on ground fissures compared to other methods, with fewer mis-extractions and less noise in the image compared to other methods. Using morphological methods to finely process the initially extracted binary images of ground fissures, we found that the holes in the ground fissures were filled and the noise points were also removed, further improving the ground fissure extraction effect. Since the optimized algorithm combines the K-means algorithm to automatically classify ground fissures, compared with the RF classification algorithm (which requires manual selection of a large number of training samples), it has more advantages.
To compare the impact of UAV images shot at different flight heights on the accuracy of ground fissure extraction, we selected an area in the study region that is representative and has a high density of ground fissures. Images were captured at flight heights of 50m, 60m, and 70 m, and the ground fissure extraction method proposed in this paper was applied to the original images. To more intuitively compare the extraction of ground fissures at different flight heights, the ground fissure extraction results were displayed as scatter points using the scatter function and overlaid on the original ground fissure images taken at the three flight heights, as shown in Figure 8.
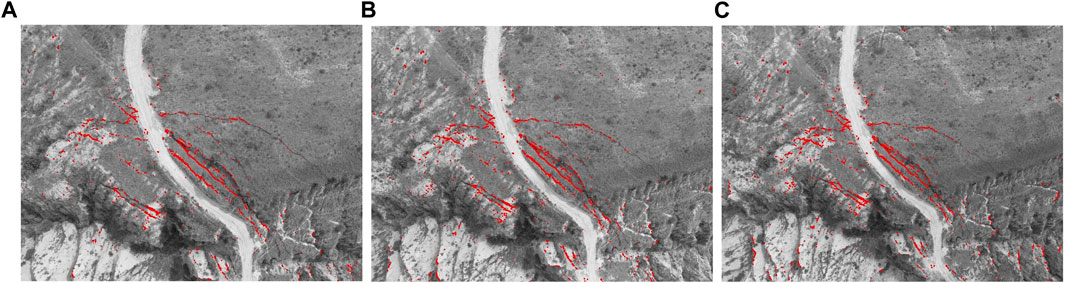
FIGURE 8. Extraction of ground fissures at different flight heights. (A) 50 m, (B) 60 m, (C) 70 m.
From Figure 8, it can be seen that some small ground fissures on the original images can be better extracted from images shot at flight heights of 60 m and 70m, while there are many instances of missed extraction in the original images shot at a flight height of 50 m. In the lower left and lower right corners of the original images, there are some ground fissures caused by terrain factors rather than mining disturbances. In the images shot at a flight height of 70 m, there are many instances of mis-extraction of these ground fissures. Therefore, images shot at a flight height of 60 m are more suitable for extracting mining-induced ground fissures, with the best extraction results and the fewest instances of mis-extraction and missed extraction.
The experiment uses the ROC (Receiver Operating Characteristic Curve) to quantitatively evaluate the accuracy of ground fissure extraction by different methods. In this ROC quantitative evaluation, the ground truth was first obtained through manual visual interpretation, and representative ground fissures were selected as the standard values for classification (Zhang, et al., 2022a). The ground fissure extraction results were overlaid with the ground truth for analysis, and the TPR (True Positive Rate) and FPR (False Positive Rate) were calculated, as shown in Figure 9. The TPR is the probability of correct extraction of mining-induced ground fissures, i.e., the hit rate; the FPR is the probability of incorrect extraction of mining-induced ground fissures, i.e., the false alarm rate. The calculation equations are as follows:
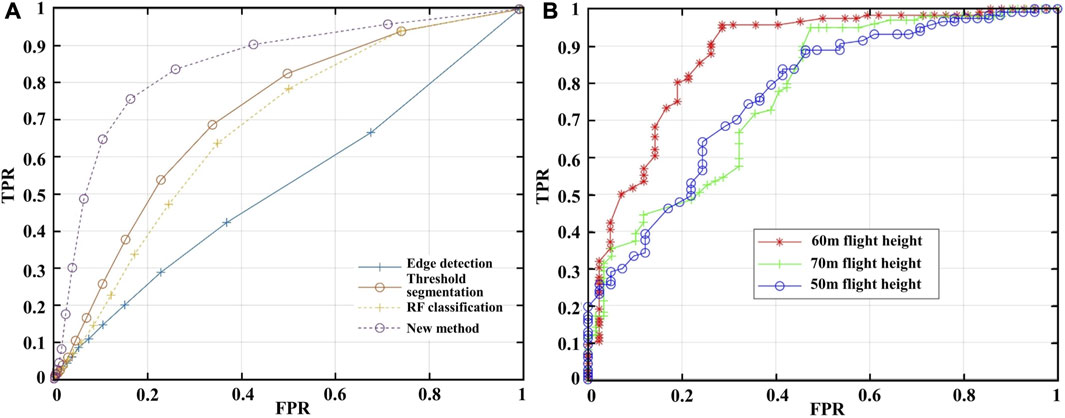
FIGURE 9. Evaluation result. (A) Different methods, (B) Different flight heights.
Where: TP represents the number of correctly extracted ground fissure pixels; FN represents the number of missed ground fissure pixels; FP represents the number of incorrectly extracted ground fissure pixels; TN represents the number of correctly unextracted ground fissure pixels.
As can be seen from Figure 9A, when the error rate is at 20%, the correct rate of the optimized algorithm proposed in this paper is close to 80%, the correct rate of the RF classification algorithm is close to 50%, and the correct rates of the threshold segmentation algorithm and edge detection algorithm are less than 40%. When the error rate is around 30%, the correct rate of the optimized algorithm is over 80%, while the correct rates of the other three methods are all less than 70%, indicating that the optimized algorithm proposed in this paper has higher accuracy.
As can be seen from Figure 9B, when the error rate is over 20%, the correct rates corresponding to the three flight heights are all over 50%, indicating that the method proposed in this paper is suitable for extracting mining-induced ground fissures in the Loess gully and ravine region. When the error rate is close to 20%, the correct rate corresponding to a flight height of 60 m is 83%, while the correct rates corresponding to other flight heights are around 50%. This indicates that for this study area, the ground fissure extraction effect is the best when the flight height is set to 60 m.
After choosing the optimal flight height, we captured multi-period original images of the study area (May 25th, June 1st, June 15th, and June 24th) and used the method proposed in this paper to extract the ground fissures. The ground fissures were also displayed as scatter points on the original images (Figure 10).
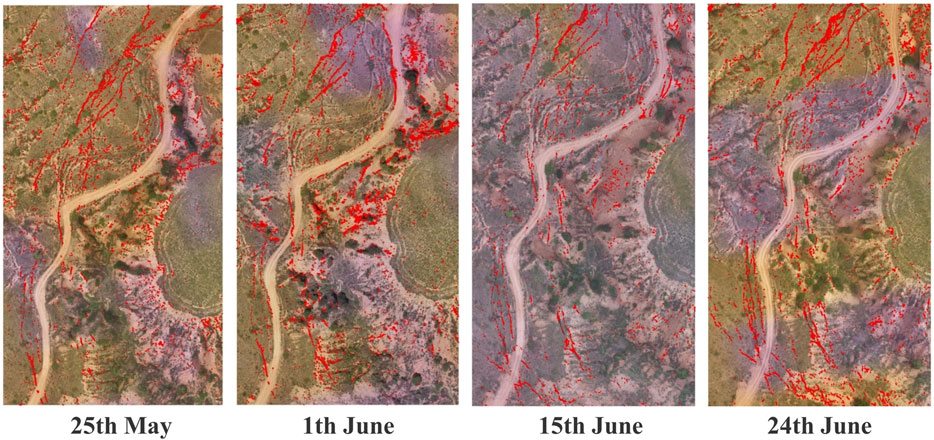
FIGURE 10. Ground fissure extraction results of different dates.
As can be seen from Figure 10, the ground fissures are mainly concentrated in the northwest of the study area, that is, the relatively flat area, and with the passage of time (the continuous advancement of the working face), the density of ground fissures in the northwest gradually increases. From May 25th to June 24th, the number and density of ground fissures in the southwest increased from small to large. Overall, the distribution of ground fissures gradually increases from east to west, extending in a “curved” state to the north and south, consistent with the direction of mining.
This paper introduces the “hydrological density” to quantitatively analyze the distribution of ground fissures. Considering that the area of ground fissures within a unit area can effectively express its development characteristics and morphological features, the area of ground fissure pixels in the unit area grid is used as the density (the unit grid scale in this paper is set to 1 m2). The calculation equation is as follows:
Where: li represents the length of each ground fissure in the unit area, cm; wi represents the width of each fissure in the unit area, cm; n represents the number of ground fissures in the unit area; D represents the ground fissure density, cm2.
Based on the actual situation, the ground fissure density of the study area is divided into 6 intervals, namely 9–180 cm2, 180–360 cm2, 360–540 cm2, 540–720 cm2, 720–900 cm2, and >900 cm2 (Figure 11). On May 25th, the ground fissure density in the study area was mainly concentrated in the 9–180 cm2 interval, accounting for 45.09%, and the development of ground fissures was weak, and there was no situation where ground fissures were densely gathered. On June 1st, the ground fissure density in the study area was mainly concentrated in the 9–180 cm2 interval, accounting for 48.99%, an increase of 3.90% compared to May 25th, and the area with a ground fissure density greater than 900 cm2 increased by 2.27%. This indicates that as the working face continues to advance, the proportion of low-density areas increases, and some low-density areas are transformed into high-density areas, that is, some small fissures develop into large fissures. On June 15th, the proportion of low-density areas (9–180 cm2) significantly decreased, decreasing by 12.44%; the proportion of medium-density and high-density areas (360–540 cm2, >900 cm2) significantly increased, indicating that the surface is affected by mining. The degree of influence has further increased, leading to more low-density areas transitioning into high-density areas. On June 24th, the proportion of low-density areas (9–180 cm2) and high-density areas (>900 cm2) increased, increasing by 5.48% and 5.17% respectively, indicating that new ground fissures have been generated in some areas. Due to the continuous development of ground fissures, some low-density areas have transitioned into high-density areas.
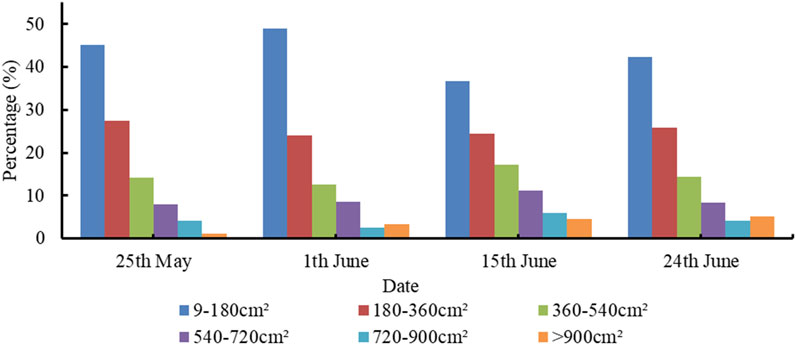
FIGURE 11. Statistical results of ground fissure density.
In summary, in the early stage of the working face advancement, the proportion of low-density areas of ground fissures continues to increase, indicating that the surface is continuously generating new fissures due to the influence of mining; due to the continuous development of ground fissures (increasing width and length), some low-density areas are transitioning into high-density areas. The proportion of high-density areas continues to increase, which is consistent with the progress of the working face advancement.
Based on the actual situation, the ground fissure width in the study area is divided into five intervals, namely 0–9 cm, 9–18 cm, 18–27 cm, 27–36 cm, and >36 cm (Figure 12). On May 25th, the width of ground fissures was concentrated in the 9–18 cm range, accounting for 49.47%. On June 1st, the ground fissure width was concentrated in the 9–18 cm range, accounting for 43.92%, a decrease of 5.55% compared to May 25th. The proportion of ground fissure widths greater than 18 cm in each range increased, among which the proportion of ground fissure widths greater than 36 cm increased by 2.3%, indicating a continued development of ground fissures. On June 15th, the ground fissure width was concentrated in the 9–18 cm range, accounting for 40.36%, which continued to decrease compared to June 1st. The proportion of ground fissure widths greater than 18 cm in each range continued to increase, among which the proportion of ground fissure widths greater than 36 cm increased by 6%, indicating that some small fissures gradually developed into larger ones. On June 24th, the difference in the proportion of ground fissures in each width range was small, indicating that the number of new ground fissures decreased as the working face retreat ended. Compared with June 15th, the proportion of ground fissure widths in the 9–18 cm range decreased significantly, but the proportion greater than 36 cm increased significantly, even exceeding the proportions in the 0–9 cm and 27–36 cm ranges, indicating that the development of ground fissures is nearing its peak.
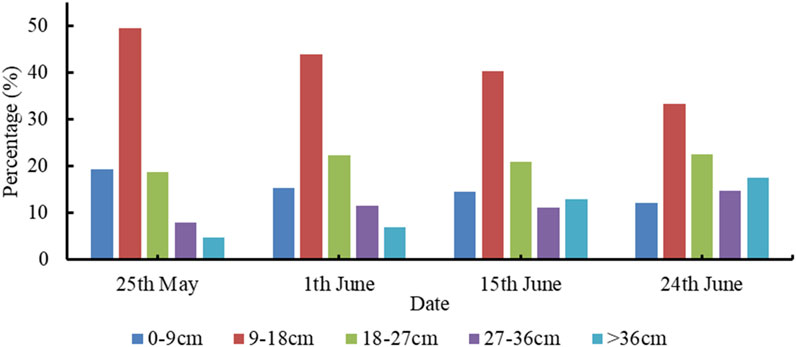
FIGURE 12. Statistical results of ground fissure width.
In summary, as the working face continues to advance, the width of the ground fissures tends to be evenly distributed, with small differences in the proportions of each width range. After the end of the working face retreat, the number of new ground fissures decreases, and the development of the ground fissures is nearing its peak.
To further study the distribution characteristics and development of ground fissures in the Loess gully and ravine region, the fractal dimension is introduced to describe the degree of filling and density in two-dimensional space (Su et al., 2006). The box-counting method is usually used to calculate the fractal dimension, with the equation as follows:
Where: r is the grid side length of different scales, and N(r) represents the number of grids containing fissure pixels at the current scale. Using different grid scales r, the corresponding N(r) values can be obtained. With log r as the horizontal coordinate and log N(r) as the vertical coordinate for regression analysis, if the two have a good linear relationship, it shows that the fissures have good fractal characteristics and comply with statistical self-similarity. The slope value is the fractal dimension. The scales r corresponding to different periods are 2.5 m, 5 m, 10m, 20m, and the fractal dimension diagram is shown in Figure 13.
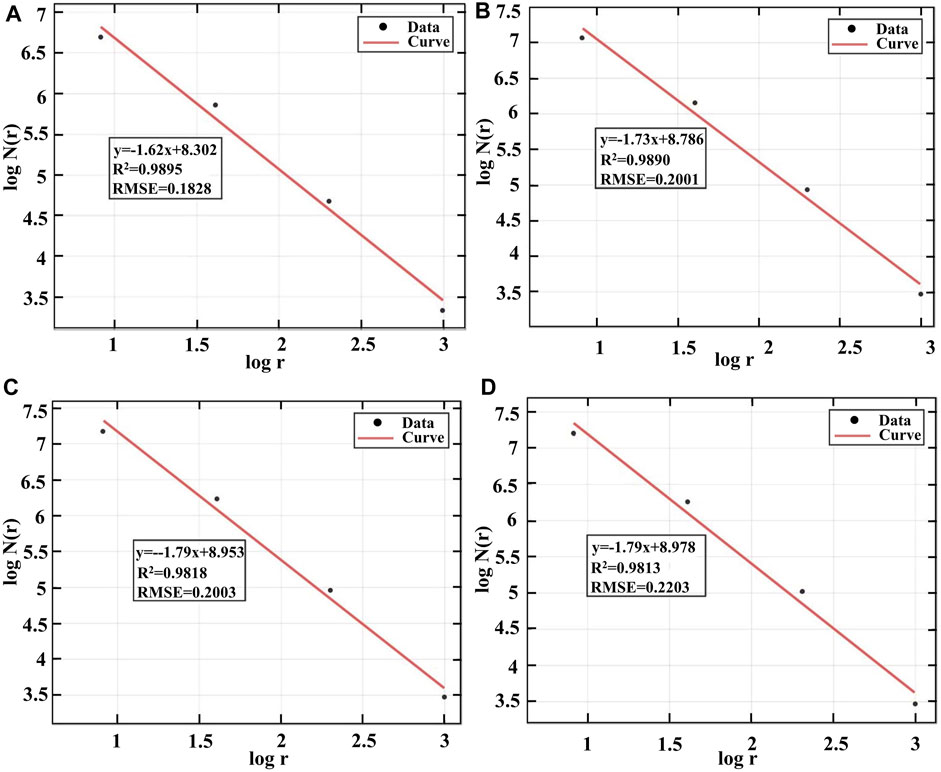
FIGURE 13. Fractal dimension. (A) 25th May, (B) 1st May, (C) 15th May, (D) 24th May.
According to Figure 13, the ground fissures at different times in the study area have good fractal characteristics under different scales, and the correlation between log N(r) and log r is high, with R2 all above 0.98, indicating that the ground fissures in the Loess gully and ravine region caused by mining have good self-similarity. The fractal dimensions of each period range from 1.618 to 1.787. Generally speaking, the larger the fractal dimension, the more complex the fissure morphology, and the greater the density and development degree. Comparing the fitting results of the four periods, it can be seen that the fractal dimension is constantly increasing, reaching the maximum value on June 24th, indicating that the fissure density and development degree are the largest at this time, which is consistent with the conclusion in Section 4.3.1.
To better understand the distribution of ground fissures after the 1212 working face retreat, researchers used the method proposed in this paper to draw a schematic diagram of the ground fissure distribution (active fissure area), as shown in Figure 14. Dynamic development fissures are located at the end of half of the 1212 working face range, with violent development and high density. Overall, a large number of ground fissures are distributed directly above the working face, and the distribution range is larger than the working face range, most of which are arc-shaped, and the overall shape is “C"-shaped, with the opening direction opposite to the direction of the working face advancement, consistent with the research results of scholars such as Hou et al. (2019).
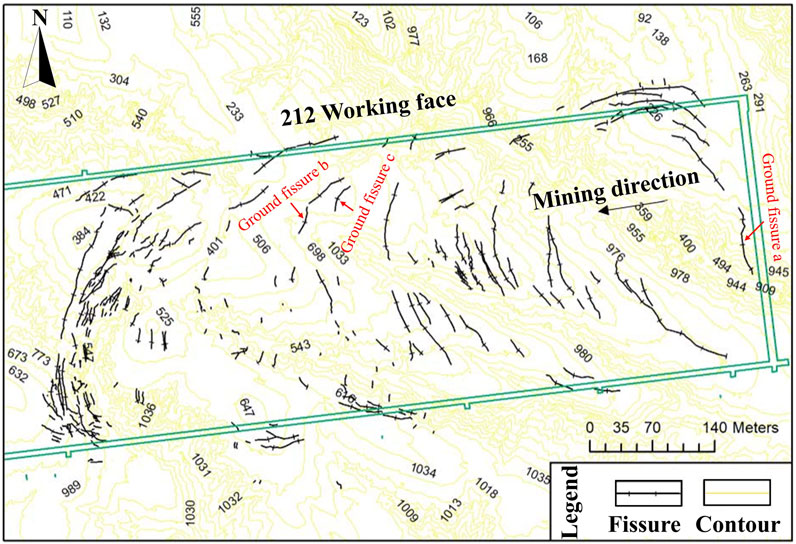
FIGURE 14. Distribution of ground fissures.
According to the distribution of ground fissures (Figure 14), mining-induced ground fissures can be divided into two types: boundary fissures (open-off cut in working face, near stop line and roadway) and dynamic fissures (inside working face). The formation and development of mining-induced ground fissures is a bottom-up dynamic evolution process covering “underground mining-overburden rock movement-surface damage”. When the tensile deformation of the local surface loess layer exceeds its own strain limit, ground fissures will be formed. The development of ground fissures causes the non-uniformity of surface subsidence. Its essence is the discontinuous deformation and failure of rock-soil mass on both sides of the ground fissure. Under the influence of mining, the local rock-soil mass on the surface will slip, sink and tilt relative to its adjacent area, which will induce the continuous development of ground fissures. Therefore, this paper constructs a dynamic development model of mining-induced ground fissures, as shown in Figure 15.
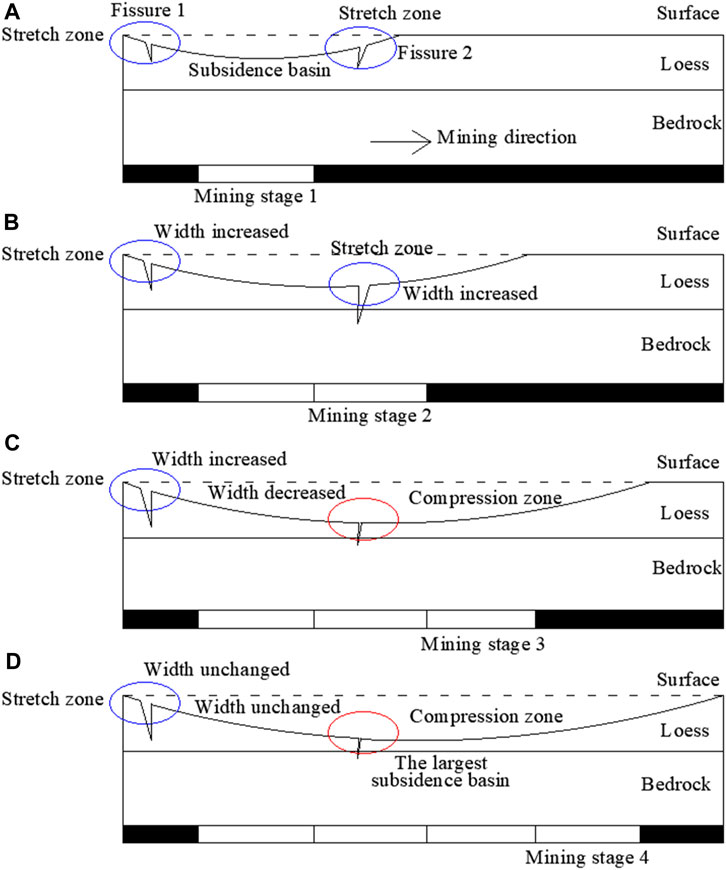
FIGURE 15. Dynamic development model of ground fissure. (A) Mining stage 1, (B) Mining stage 2, (C) Mining stage 3, (D) Mining stage 4.
When the working face is mined to stage 1, the horizontal tensile deformation of the surface reaches the limit, resulting in ground fissures 1 and 2. At this time, both fissures are located in the surface tensile zone; when the working face is mined to stage 2, the range of the surface subsidence basin increases, and the width of fissures 1 and 2 increases due to the influence of tensile stress. At this time, both fissures are located in the surface tensile zone; when the working face is mined to stage 3, fissure 1 is in the surface tensile zone, and the width continues to increase. Fissure 2 is in the center of the sinking basin, from the tensile zone to the compression zone, and the width of fissure 2 begins to decrease. When the working face is mined to stage 4, the range of subsidence basin reaches the maximum, and the surface subsidence tends to be stable. At this time, the width of fissure s 1 and 2 does not change (Chen et al., 2023).
When the rock strata movement and deformation are transmitted to the surface, a subsidence basin with a much larger area than the goaf will be formed. With the continuous mining of the working face (before full mining), the surface subsidence curve takes the inflection point of surface deformation as the demarcation point, which can be divided into tensile zone and compression zone. The tensile zone is dominated by expansion deformation, and the compression zone is dominated by compression deformation, and the range of these two zones is constantly changing (Figure 15). Therefore, for boundary fissures, because they are always in the surface tension zone, they are continuously stretched, and the fissure width gradually increases. After the local surface subsidence tends to be stable, the fissure width remains unchanged, as shown in fissure 1 in Figure 15. For dynamic fissures, they are first in the surface tension zone and then in the surface compression zone. They undergo a transformation process from tension to compression. The fissure width increases first and then decreases, and it is stable with the surface subsidence, showing a “closure effect”, such as the fissure 2 in Figure 15.
This paper, taking the 1212 working face of a mining area in Yulin City, Shaanxi Province as the research background, uses low-altitude UAV imagery. Based on the comparison of common ground fissure extraction methods, we propose a method suitable for extracting mining-induced ground fissures in the Loess gully and ravine region and study its spatial and temporal evolution mechanism. The main conclusions are as follows:
(1) A ground fissure extraction method is proposed. This method, by combining the regional gradient changes of ground fissures in images and the statistical feature differences with other ground objects, can obtain indicators that highlight ground fissures. It greatly reduces noise points and mis-extraction, improving the extraction accuracy of ground fissures and making the process more automated. In addition, morphological methods are used to refine the initially extracted binary images of ground fissures, which further improves the extraction effect of ground fissure.
(2) The optimal flight height for the study area is determined to be 60 m. In the initial stage of the working face advancement, the proportion of low-density areas of ground fissures continues to increase, some low-density areas transition into high-density areas, which is consistent with the progress of the working face advancement. After the end of the working face retreat, the width of the ground fissures tends to be evenly distributed.
(3) The ground fissures at different times in the study area have good fractal characteristics and self-similarity under different scales. As the working face continues to advance, the larger the fractal dimension, the greater the density, and the more complex the morphology. Overall, the distribution range of ground fissures is larger than the working face range, and the opening direction is opposite to the direction of the working face advancement.
(4) A dynamic development model of ground fissures is constructed to reveal its formation mechanism. Under the influence of mining, the local rock-soil mass on the surface will slip, sink and tilt relative to its adjacent area, which will induce the continuous development of ground fissures. The surface subsidence curve takes the inflection point of surface deformation as the demarcation point, which can be divided into tensile zone and compression zone. For boundary fissures, they are continuously stretched, and the fissure width gradually increases. For dynamic fissures, they undergo a transformation process from tension to compression, and the fissure width increases first and then decreases.
The ground fissure extraction method proposed in this paper has high accuracy. Considering that the extraction process combines the geometric morphology and optical features of ground fissures, the extraction accuracy will be affected in the more complex environment of the mining area. Therefore, the extraction of ground fissures in complex environments will be the focus of future research.
The original contributions presented in the study are included in the article/Supplementary material, further inquiries can be directed to the corresponding author.
YF: Data curation, Methodology, Writing–original draft, Writing–review and editing. YW: Funding acquisition, Writing–review and editing. XY: Funding acquisition, Writing–review and editing. YZ: Data curation, Writing–review and editing.
The authors declare financial support was received for the research, authorship, and/or publication of this article. This research was funded by the National Key Research and Development Program funded project, grant number (2022YFB4102100), Shaanxi Provincial Department and City Linkage Key Funding Project, grant number (2022GD-TSLD-40).
We thank all the reviewers for their valuable.
Authors YF, YW, and XY were employed by Tiandi Science and Technology Co., Ltd and China Coal Technology and Engineering Group, Beijing.
The remaining author declares that the research was conducted in the absence of any commercial or financial relationships that could be construed as a potential conflict of interest.
All claims expressed in this article are solely those of the authors and do not necessarily represent those of their affiliated organizations, or those of the publisher, the editors and the reviewers. Any product that may be evaluated in this article, or claim that may be made by its manufacturer, is not guaranteed or endorsed by the publisher.
Bian, H. F., Zhang, S. B., Zhang, Q. Z., and Zheng, N. S. (2014). Monitoring large-area mining subsidence by GNSS based on IGS stations. Trans. Nonferrous Metals Soc. China 24 (2), 514–519. doi:10.1016/s1003-6326(14)63090-9
Brodny, J., and Tutak, M. (2019). Analysing the utilisation effectiveness of mining machines using independent data acquisition systems: A case study. Energies 12, 2505. doi:10.3390/en12132505
Chen, C., Chen, J., Zhang, H., Cai, L., and Xue, Y. R. (2023). Review on interpretability of deep learning. Comput. Sci. 50, 52–63. doi:10.11772/j.issn.1001-9081.2021122118
Chen, C., and Hu, Z. (2018). Research progress on formation mechanism of mining ground fractures in China. J. China Coal Soc. 43, 810–823. doi:10.13225/j.cnki.jccs.2017.0942
Chen, F., Li, J. W., Zhang, Y. J., Zhu, G. Z., Zhu, Y. H., and Zhu, H. (2022). Study on the development Law of ground cracks in extra-thick coal seam mining in loess gully area. Metal. Mine 4, 229–235. doi:10.19614/j.cnki.jsks.202304035
Chen, F., Yao, J. G., Yang, Y. J., Li, Z. S., and Liu, X. (2009). Segmentation algorithm of infrared image based on gray stretching and edge scanning. Comput. Eng. Appl. 14, 167–169. doi:10.3778/j.issn.1002-8331.2009.14.051
Cheng, J., Ye, L., Guo, Y. N., and Wang, R. B. (2020). An aerial image detection method of ground crack in goaf based on deformable convolutional network with hybrid domain attention. J. China Coal Soc. 45 (S2), 993–1002. doi:10.13225/j.cnki.jccs.2020.0164
Cicmanec, P., Hrabovsky, J., and Durove, J. (2008). Mechanized mining of might coal seams into complicated geological and underground conditions. Gospod. Surowcami Miner. 24, 37–47.
Fan, L. M., Zhang, X. T., Xiang, M. X., Zhao, H. Q., Shen, T., and Lin, P. Y. (2015). Characteristics of ground fissure development in high intensity mining area of shallow seam in Yushenfu coal field. J. China Coal Soc. 40, 1442–1447. doi:10.13225/j.cnki.jccs.2014.1707
Hang, K. F., Kang, J. R., Wang, Z. S., and Wu, K. (2014). Prediction of surface fissure in high relief areas induced by underground coal mining. J. Min. Saf. Eng. 31 (6), 896–900. doi:10.13545/j.issn1673-3363.2014.06.011
Hou, E. K., Zhang, J., Xie, X. S., and Xu, Y. N. (2019). Contrast application of unmanned aerial vehicle remote sensing and satellite remote sensing technology relating to ground surface cracks recognition in coal mining area. Geol. Bull. China 38, 443–448. doi:10.3969/j.issn.1001-1986.2017.06.017
Li, S., Hou, D. J., Gao, J., and Tong, Z. (2018). Research on preprocessing method of pavement crack image via mathematical morphology. Highw. Eng. 43, 270–274.
Li, W., Liu, G. S., and Yao, T. (2014). Improvement of methods for crack image processing and crack feature extraction of expansive soil. Rock Soil Mech. 35, 3619–3626. doi:10.16285/j.rsm.2014.12.042
Liu, Y., Xue, A., Shi, X., Sun, L., Mei, C., Yao, W., et al. (2010). The effect of epidermal growth factor receptor variant III on glioma cell migration by stimulating ERK phosphorylation through the focal adhesion kinase signaling pathway. Appl. Res. Comput. 3, 89–95. doi:10.1016/j.abb.2010.07.014
Peng, J. B., Wang, F. Y., Cheng, Y. X., and Lu, Q. Z. (2018). Characteristics and mechanism of sanyuan ground fissures in the weihe basin, China. Eng. Geol. 247, 48–57. doi:10.1016/j.enggeo.2018.10.024
Su, Y. P., Lv, Y. F., Fu, X. F., Fu, G., and Liang, Y. J. (2006). Application of fractal theory on the fracture prediction in the buried hill of bed rock in beier depression. J. Jilin Univ. (Earth Sci. Ed. 4, 563–569. doi:10.13278/j.cnki.jjuese.2006.04.011
Tang, F., Li, L. K., Li, X. T., and Liu, S. W. (2020). Research on characteristics of mining-induced surface cracks based on UAV images. Coal Sci. Technol. 48 (10), 130–136. doi:10.13199/j.cnki.cst.2020.10.016
Wang, R. G. (2016). Remote sensing investigation and analysis of geological disasters in the Wudong coal mine based on World View-2 data. Remote Sens. Land Resour. 28, 132–138. doi:10.6046/gtzyyg.2016.02.21
Wang, R., Wu, K., He, Q. M., He, Y. B., Gu, Y. Y., and Wu, S. (2022). A novel method of monitoring surface subsidence Law based on probability integral model combined with active and passive remote sensing data. Remote Sens. 14, 299. doi:10.3390/rs14020299
Wei, B. W., Liu, G. X., and Wang, Z. H. (2018). Extracting ground fissures in loess landform area using modified F-fdog algorithm and UAV images. Surv. Mapp. 41, 51–56+61.
Wei, C. J., Wang, Y. J., Wang, J., and Zhao, H. (2012). The technical research of extracting ground fissure information in mining area with the UAV image. Metal. Mine 10, 90–92+96. doi:10.3969/j.issn.1001-1250.2012.10.024
Xiang, Y., Zhao, Y. D., and Dong, J. H. (2019). Remote sensing image mining area change detection based on improved UNet siamese network. J. China Coal Soc. 44, 3773–3780.doi:10.13225/j.cnki.jccs.SH19.1026
Xu, J. M., Zhu, W. B., Xu, J. L., Wu, J. Y., and Li, Y. C. (2021). High-intensity longwall mining-induced ground subsidence in Shendong coalfield, China. Int. J. Rock Mech. Min. Sci. 141, 104730. doi:10.1016/j.ijrmms.2021.104730
Yang, K., Hu, Z. Q., Liang, Y. S., Fu, Y. K., Yuan, D. Z., Guo, J. X., et al. (2022). Automated extraction of ground fissures due to coal mining subsidence based on UAV photogrammetry. Remote Sens. 14, 1071. doi:10.3390/rs14051071
Yang, Z., and Fan, L. (2017). Influence of fissures due to coal mining on moisture transportation in the vadose zone in the blown-sand region of the northern Shaanxi Province: model establishment. J. China Coal Soc. 42, 155–161.doi:10.13225/j.cnki.jccs.2016.5037
Zhang, F., Hu, Z. Q., Fu, Y. K., Yang, K., Wu, Q. Y., and Feng, Z. W. (2020). A new identification method for surface cracks from UAV images based on machine learning in coal mining areas. Remote Sens. 12, 1571. doi:10.3390/rs12101571
Zhang, J. Y., Wang, H. F., Zhang, B., Li, H. W., Chen, Q. T., and Li, W. (2013). Exploration of mining goaf and comprehensive control technology of safety hidden dangers. Coal Sci. Technol. 41 (10), 76–80. doi:10.13199/j.cnki.cst.2013.10.028
Zhang, X. H., Zhu, L., Wang, W., Meng, L. S., Li, X. J., and Ren, Y. C. (2019). Study and application of sequential extraction method of ground fissures based on object. Remote Sens. Land Resour. 31, 87–94. doi:10.6046/gtzyyg.2019.01.12
Zhang, Y. J., Kong, J. Y., Long, S. F., Zhu, Y. H., and He, F. S. (2022a). Convolutional block attention module U-Net, a method to improve attention mechanism and U-Net for remote sensing images. J. Appl. Remote Sens. 16, 026516. doi:10.1117/1.jrs.16.026516
Zhang, Y. J., Kong, J. Y., Long, S. F., Zhu, Y. H., Zhu, W. X., and Wu, T. H. (2022b). Study on the ground fissure development Law of coal mining based on UAV photogrammetry and the particle flow theory. Front. Environ. Sci. 10, 915645. doi:10.3389/fenvs.2022.915645
Zhang, Y., Lian, X. G., Yan, Y. G., Zhu, Y. H., and Dai, H. Y. (2022c). Study on the development Law of mining-induced ground cracks under gully terrain. Remote Sens. 14, 5985. doi:10.3390/rs14235985
Zhang, Y., Yan, Y. G., Dai, H. Y., Zhu, Y. H., and Wu, T. H. (2021). Stability and force chain characteristics of inclined step cutting body in stope. Appl. Sci. 11, 10276. doi:10.3390/app112110276
Zhao, H. J., Ma, F. S., Zhang, Y. M., and Guo, J. (2013). Monitoring and mechanisms of ground deformation and ground fissures induced by cut and-fill mining in the Jinchuan mine 2, China. Environ. Earth Sci. 68, 1903–1911. doi:10.1007/s12665-012-1877-7
Zhao, Y. X., Xu, D., Sun, B., Jiang, Y. D., Zhang, C., and He, X. (2021). Investigation on ground fissure identification using UAV infrared remote sensing and edge detection technology. J. China Coal Soc. 46, 624–637. doi:10.13225/j.cnki.jccs.xr20.1948
Keywords: geological disaster monitoring, ground fissures, extraction method, evolution mechanism, UAV image, mining subsidence
Citation: Fu Y, Wu Y, Yin X and Zhang Y (2023) Mapping mining-induced ground fissures and their evolution using UAV photogrammetry. Front. Earth Sci. 11:1260913. doi: 10.3389/feart.2023.1260913
Received: 17 August 2023; Accepted: 18 September 2023;
Published: 27 September 2023.
Edited by:
Yubing Liu, China University of Mining and Technology, ChinaReviewed by:
Weijing Xiao, East China Jiaotong University, ChinaCopyright © 2023 Fu, Wu, Yin and Zhang. This is an open-access article distributed under the terms of the Creative Commons Attribution License (CC BY). The use, distribution or reproduction in other forums is permitted, provided the original author(s) and the copyright owner(s) are credited and that the original publication in this journal is cited, in accordance with accepted academic practice. No use, distribution or reproduction is permitted which does not comply with these terms.
*Correspondence: Yaokun Fu, ZmFsY29uZUAxNjMuY29t
Disclaimer: All claims expressed in this article are solely those of the authors and do not necessarily represent those of their affiliated organizations, or those of the publisher, the editors and the reviewers. Any product that may be evaluated in this article or claim that may be made by its manufacturer is not guaranteed or endorsed by the publisher.
Research integrity at Frontiers
Learn more about the work of our research integrity team to safeguard the quality of each article we publish.