 Yudi Wang1,2
 Yungui Xu
 Xuri Huang
94% of researchers rate our articles as excellent or good
Learn more about the work of our research integrity team to safeguard the quality of each article we publish.
Find out more
ORIGINAL RESEARCH article
Front. Earth Sci., 07 September 2023
Sec. Solid Earth Geophysics
Volume 11 - 2023 | https://doi.org/10.3389/feart.2023.1257481
This article is part of the Research TopicRock Physics of Unconventional Reservoirs, volume IIView all 15 articles
Fracture modelling is essential for understanding fluid flow in fractured hydrocarbon reservoirs, particularly in the phase of production; however, traditional discrete fracture network (DFN) modelling methods lack constraints that reflect characteristics of fracture development. Fractures or fracture networks exhibit a high degree of randomness; as such, it is difficult to model fracture characteristics. This paper proposes a new approach for DFN modelling constrained by seismic attributes. Firstly, the steerable pyramid method is adopted to improve seismic data resolution; secondly, multiple seismic attributes are extracted and combined into a composite attribute to characterize fracture spatial distribution; finally, a DFN modelling method is established by using the composite attribute as a location constraint. To verify the effectiveness of the approach, a case study is conducted in the Bonan Depression, in East China. The results show that, compared with the traditional DFN modelling methods, the DFN modelling with the location constraint create a more realistic fracture model which accurately reflects fracture distribution characteristics. The application demonstrates the potential of wide application prospects in fractured reservoirs.
Fractures including joints, faults, pressure solution seams, and deformation bands are pervasive in crustal rocks (Welch et al., 2022). These features interconnect to form complex fracture networks that provide crucial storage space for oil and gas reservoirs, as well as important channels for their transportation and exploitation. For example, Hardebol et al. (2015); Azim (2016) studied the impact of fracture network geometry on fluid flows in fractured reservoirs. Hunziker et al. (2018) studied the impact of stochastic fracture networks on seismic attenuation. Understanding the spatial distribution of fractures is essential for efficiently developing oil and gas reservoirs.
The Discrete Fracture Network (DFN) (Shi et al., 2021) method is an important tool for studying the spatial distribution patterns of fractures. This method directly uses fractures of various sizes and shapes to form a network, and then uses discrete data to characterize the fracture system. Since Baecher et al. (1977); Baecher, (1983) introduced the DFN method for evaluating reservoirs in 1977, many scholars have tried to improve it. For example, Mardia et al. (2007) used a Markov Monte Carlo method to update fracture locations, achieving a dynamic simulation with a changing sampling distribution. Xu and Dowd (2010) and Dong et al. (2018b) created the shape of a random polygon with a fixed number of sides that more accurately follows geological laws. Singh et al. (2022) combined DFN with the discrete element method to improve fracture stability. Kolyukhin et al. (2023) perform the statistical analysis of model realization on different spatial scales to investigate the possibility to evaluate the corresponding correlation fractal dimension and power exponent. However, many of these methods focus on improving the fracture shape and probability distribution pattern, and for realistic fracture modeling, integrating more geological or geophysical knowledge is essential.
In recent years, many scholars have attempted to integrate various constraints to enhance DFN modelling accuracy. Dong et al. (2018a) introduced a fracture density-constrained cast point modelling method, which improved fracture modelling accuracy to a certain extent. However, the method has high randomness and low accuracy in measuring fracture density parameters. To further enhance fracture modelling accuracy, Lei et al. (2020) applied constraints using various parameters from well logs, such as ground stress, lithology, and permeability. However, obtaining these parameters directly from wells in real-world applications can be difficult as they are typically obtained by examining rock samples from wells in laboratories, which only reflect fractures at sparse well locations. Also, in this paper, we study the possibility of using seismic data to characterize the DFN. Seismic attributes have been used to determine the probability distribution of fault lengths (Torabi et al., 2017). Schneider et al. (2016) employed seismic attributes to estimate fracture orientation and intensity. To overcome the limitation of a possible wide spatial constraint, Yang et al. (2022) utilized a single seismic attribute for DFN fracture modelling, but this approach suffers from inaccuracy and large randomness because fracture characterization using a single seismic attribute tends to be incomplete and biased. Nevertheless, to achieve realistic DFN modelling, more robust constraints with less randomness and higher accuracy are required.
This paper presents a novel approach for DFN modelling by integrating a new location constraint of multiple seismic attributes extracted using the steerable pyramid technology. Firstly, the steerable pyramid method is employed to decompose seismic data and enhance its resolution. Secondly, multiple seismic attributes are meticulously integrated to create a high-resolution composite attribute that serves as both a fracture identification tool and a DFN location constraint. Finally, an accurate fracture model is established with the constraint to reflect the realistic fracture distribution and reproduce spatial fracture characteristics more accurately. To validate the effectiveness of this approach, a real case study is conducted in the Bonan Depression of East China.
To overcome the problems addressed in the current DFN modelling technology, this paper developed an approach to constrain the DFN modelling with multiple seismic attributes extracted from high resolution seismic data obtained with the steerable pyramid method. The goal is to integrate different seismic attributes to identify spatial fracture distribution and characterize fracture network in a quantitative sense.
The basis of this approach lies in selecting the optimal seismic data and integrating multiple seismic attributes to identify fractures and fracture networks. Three major phases are involved in the method are as follows.
(1) Seismic data decomposition and data selection. The original seismic data are decomposed into 7 volumes with different dominant frequencies, or called ‘Levels’ using the steerable pyramid method. The method is able to decompose seismic data into different levels, while maintaining the geological structure information. Lower levels of higher dominant frequencies are stacked to produce a new seismic data of a high resolution for later stage processing.
(2) Composite attribute building and fracture identification. Multiple seismic attributes are carefully extracted from the lower levels data of high-resolution produced in the previous step. The selected attributes are merged with proper weights to form a composite seismic attribute, which holds advantages of each attribute to enhance the fracture representation and identification.
(3) DFN modelling with the location constraint of composite seismic attribute. The composite seismic attribute (holding high resolution content) is utilized as the constraint of DFN modelling, which is essentially the DFN modelling process constrained with multiple seismic attributes.
Before we go to the details of this study, a brief review of the steering pyramid method is given here. The steering pyramid method is an algorithm for multi-scale, multi-directional decomposition and reconstruction of seismic data. The method decomposes an image into a group of images (called Levels) of the same size as the original one but with different resolution or different frequency band (Mathewson and Hale, 2008). In the process of decomposition, different radial filters and directional filters are designed to enhance data intrinsic features of discontinuity as well as the original structure of the input image remain unchanged. The following filter formulas are defined based on different angles:
where
In the seismic application of the decomposition method, seismic data are normally decomposed into 7 levels of different frequency band. The levels holding high-frequency can be stacked to one, and for example Level 0 and 1 are stacked to form a high-frequency stack, which improves seismic data resolution and enhances the discontinuity for the purpose of identification of edges, joints, faults, fractures or cavities. Zhao et al. (2021) used the steerable pyramid technology on seismic data to recognize geological structure. This method effectively removes background noise and enhances the potential geological structures.
Following the seismic decomposition and level stack, a comparison analysis is performed to evaluate the benefits of the process in both frequency domain and time domain, depending on the study objective. For example, high-resolution stacks can exhibit clearer or more consistent images of fault development in 3D space for fault interpretation. This process is shown in a workflow of Figure 1.
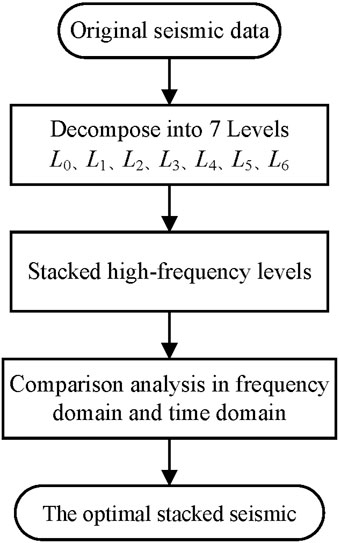
FIGURE 1. The processing workflow with the steerable pyramid method.
Once the seismic decomposition is complete, seismic attributes can be extracted from the stack with high resolution. For fracture identification in this paper, the seismic attributes, variance, curvature and mean consistent curvature are selected.
The variance attribute is a seismic attribute that describes the variability of seismic amplitudes in neighboring seismic traces. It is more sensitive to fractures caused by faults with strong discontinuities and is suitable for identifying faults at median-scale (Zhang et al., 2021). Curvature can provide information about the spatial distribution of structural features in a rock formation, and is most sensitive to fractures developed by fold; it is suitable for identifying large-scale fractures (Al-Dossary and Marfurt, 2006). The mean consistent curvature, a specific curvature derivative, is a type of seismic attribute that measures the curvature of a seismic horizon or event in a consistent manner throughout the entire seismic volume. The mean consistent curvature attribute is designed to be more sensitive to small-scale fractures and other subtle structural features, as it is able to capture variations in the seismic response that are not evident in the original seismic data (Chilès and Marsily, 1993).
The attributes above represents different characteristics of fractures or fracture networks (e.g., geometry, scales and accuracy). To combine the advantages of each of the seismic attributes, a composite seismic attribute with high accuracy is generated using a linear superposition method. The steps to achieve this are as follows.
① Seismic attributes are normalized to ensure that they be superposed.
② Giving each seismic attribute a weight. This weight is represented by the fracture-related fill ratio, which is the ratio of the fault area described by the seismic attribute to the existing geologically recognizable fault area. The closer to 1 the ratio is, the better the seismic attributes fit with the actual, and the higher the correlation is.
③ The linear superposition is applied to generate a composite attribute and the process can be represented with the mathematical relationships between multiple seismic attributes using the Eq. 3.
where
Assuming that the geological survey large fault area
In this section, the composite seismic attribute generated from the previous section is utilized as the fracture location constraint in the DFN modelling (Chopra and Marfurt, 2013) by introducing the Poisson process. DFN modelling is a numerical modelling approach used to simulate fluid flow and transport in fractured rock masses.
The principle of the Poisson process is a mathematical model used to describe the occurrence of random events over time or space. It is particularly useful in modelling systems where events occur randomly, or in this paper, fractures distribute randomly. Therefore, the Poisson process can be used in DFN modelling to generate random fractures in a rock mass to create a DFN model simulate the development of natural fractures or fracture network in rocks.
When generating fractures in 3D space, the flow chart of the traditional approach is shown in Figure 2. In this paper, we use the composite seismic attribute to constraint fracture location distribution as the attribute is much related to the development of fractures or fracture network. The steps are as follows.
① The composite seismic attribute is regularized, shown in Eq. 4. The generation probability
where
② With the composite seismic attribute, a fracture network can be generated by randomly placing fractures in rock mass according to the Poisson distribution. The Poisson process is used to generate the fracture center locations
③ The probability values
④ When the value of effective fractures is less than the preset value

FIGURE 2. Flow chart of DFN fracture modelling.
Overall, using the Poisson process as an input for DFN simulations can help create more realistic and representative models of fractured rock masses, which can be useful for understanding and predicting fluid flow and transport in geological systems.
The study area, the Bonan Depression, is located in the middle of the Zhanhua Oil field, in East China. In spite of the long production history, the geological structure and fault systems are not fully understood due to the presence of the complex faults and fault system. Seismic interpretation shows that the depression is crossed by two major faults indicated by two bold red curves (Kang et al., 2002; Wang and Zhang, 2023) shown in Figure 3. Many minor faults develop as branches of the two majors.
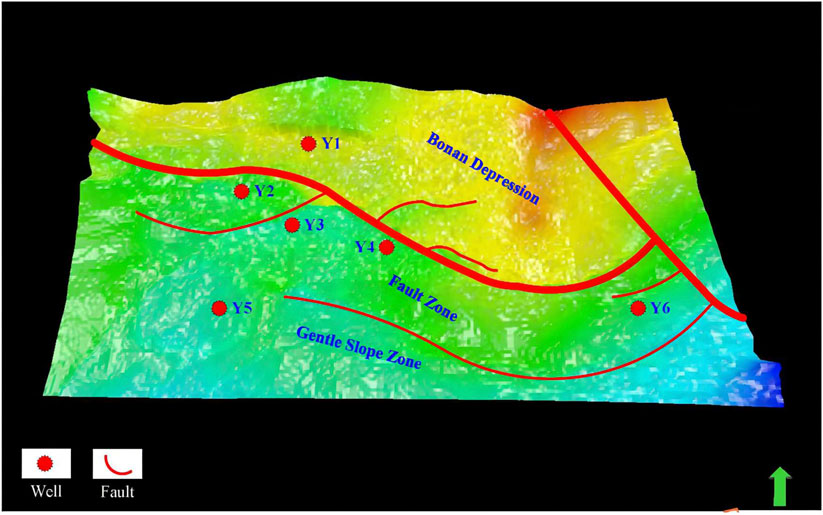
FIGURE 3. Study area map.
The study area is approximately 16.2 km from east to west and 9.2 km from north to south, and the thickness of the target layer, the Shasi Interval, is around 15 m. High-angle tectonic fractures are developed within the distance of hundreds of meters of the faults, and there are six wells in the study area. The reservoir model is not effective based on the traditional DFN modelling approach, and the workflow proposed in the previous section will be tested and verified in the study area in order to improve the understanding of the reservoir model.
For the case application, seismic data from the Bonan Depression area were decomposed, and seismic attributes were extracted before the composite attribute was generated. The steerable pyramid technique decomposed the seismic data into seven levels, from Level 0 to 6. Level 0 contained much noise and was not considered. The higher levels (Level 4, 5, and 6), holding low-frequency content, indicated the large-scale trend of the fault system. The other levels (Level 1, 2, and 3) of the high-frequency band were stacked to improve the resolution and prediction of small-scale faults. To examine the workflow, crossline 803 was extracted and presented in Figure 4A. The section stacked with Level 1, 2, and 3 is shown in Figure 4B for comparison. The area highlighted in the ellipses indicates the improved clarity of the two faults (enhancement of the discontinuity), which facilitates seismic interpretation.
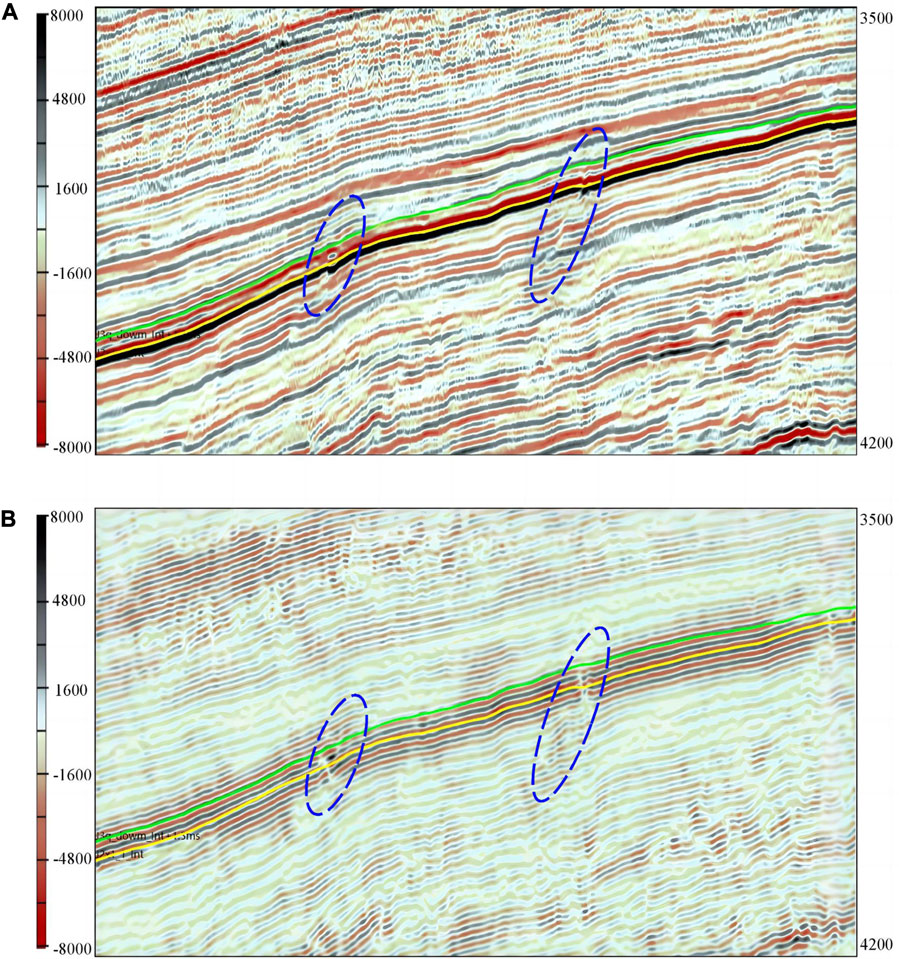
FIGURE 4. Seismic profiles: (A) original seismic profile, (B) stacked seismic profile.
Following the decomposition, three seismic attributes, variance, curvature and mean consistent curvature are extracted using the stack. Figure 5B shows the variance for the window parameter of 3*3. Figure 5D shows the variancefor a vertical radius parameter of 12. Figure 5F shows the mean consistent curvature for the window parameter of 3*3. Figures 5A, C, E are the three attributes extracted from the original seismic using the same parameters. It can be seen that the attributes from the original seismic are much noisier, compared with the ones from the stack, from which the outlines of the faults and fault system are more clearly observed. Since fractures develop along the faults or within the fault system. These clear images will reflect more logical fracture distribution if they are utilized to constrain the DFN modelling in this area.
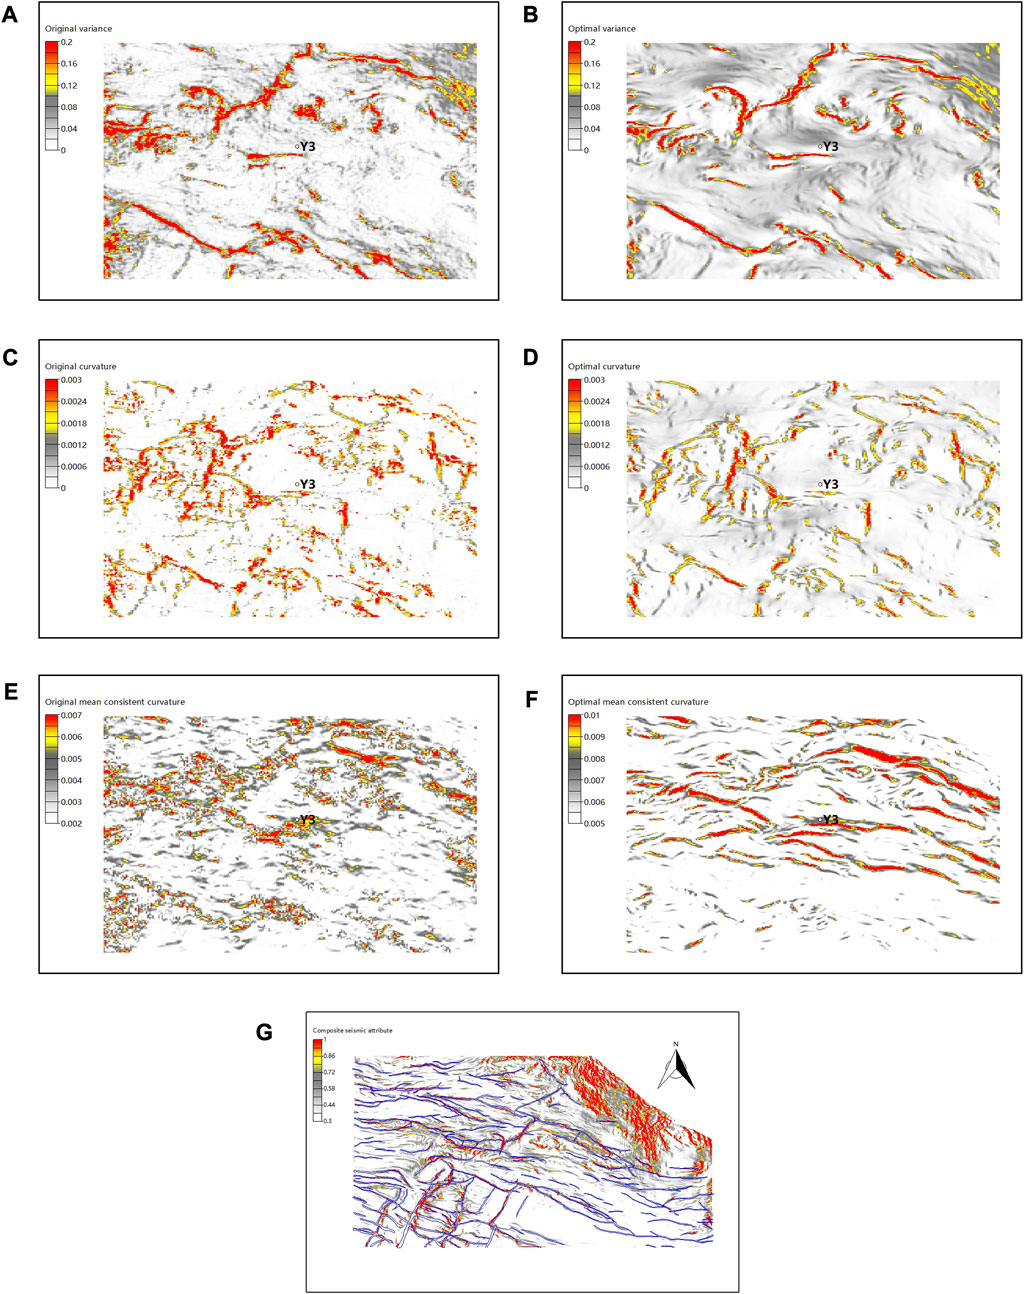
FIGURE 5. Map showing different seismic attributes: (A) original variance, (B) optimal variance, (C) original curvature, (D) optimal curvature, (E) original mean consistent curvature, (F) optimal mean consistent curvature, (G) composite seismic attribute map.
With the extracted seismic attribute, a composite attribute is computed according to the Eq. 3 in the previous section shown in Figure 5G. The composite attribute combines the advantage of the three, reflecting the potential fractures along the fault or within the fault system. And it will be used as the final resulting attribute constrain the DFN modelling in the next section.
With the composite attribute extracted, it is served as the location constraint of the DFN modelling in this section. The modelling process is constructed with the approach presented in the section II(C). In addition, Fracture density distribution (or the number of fractures in one location) is created from wells in the method presented in (Jian et al., 2021) and the details are not discussed here as we focus on the location constraint. By examining the fracture properties at the wells, its orientation is determined as 30° and 135° with the variance of 0.1. The fracture dip angle is mainly high-angle, and the mean value and variance are 75° and 0.5, respectively. In the process of fracture generating, each fracture is created with 4 edges, and the mean fracture length is 10 m, and its width is around 3–4 m.
With the parameters above, the DFN model created with the location constraint is shown in Figure 6B. Figure 6A is the model built without the constraint. By comparison, fractures in Figure 6A distribute across the full area; however, in tectonic sense, they should only emerge along the faults or within the fault system. Therefore, with the location constraint, Figure 6B indicates the consistency of the spatial relation between fractures and the regional faults. For example, many fractures develop in the two ellipses (see Figure 6A) there are no faults, which is not correct in geological sense; at the same locations (the two ellipses in Figure 6B), few fractures develop as the location constraint is applied.
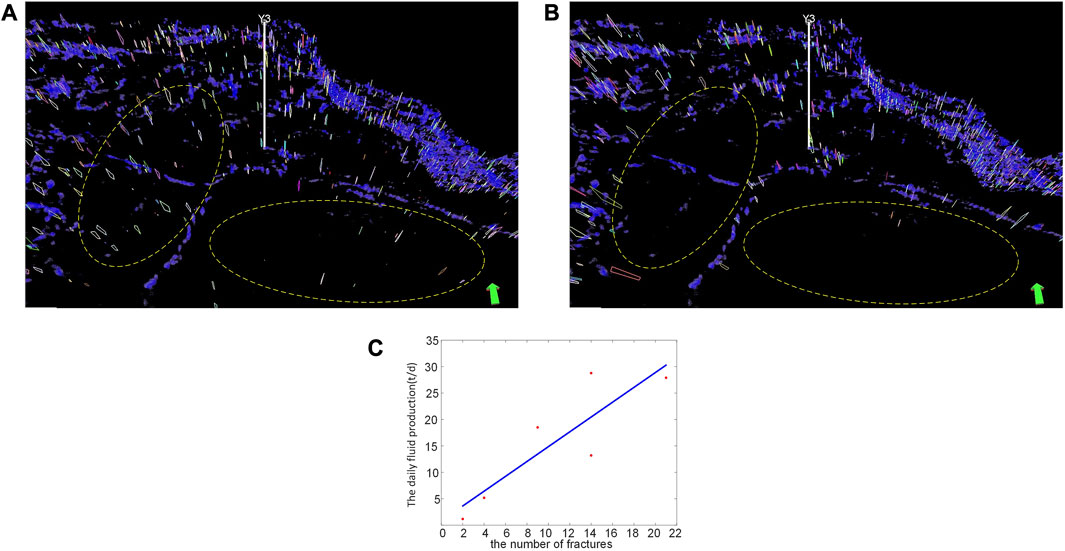
FIGURE 6. Fracture modelling and analysis in study area in the southern Bonan Depression: (A) fracture model constrained by fracture density, (B) fracture model constrained by composite seismic attribute, (C) number of fractures near the well in the model and the daily fluid production.
As the same time, we compare the number of fractures near the well with the daily fluid production. The number of fractures within a square with the side length of 100 m, centered at the well. The number of fractures for Wells Y1–Y6 are 2, 4, 21, 14, 14 and 9, respectively. The corresponding daily fluid productions per well were 1.18, 5.19, 27.9, 28.77, 13.2 and 18.5. The fracture distribution at the wells is consistent with the production with the correction coefficient of 0.755 (Figure 6C). This demonstrates the effectiveness of the DFN method.
To improve DFN modelling, a new approach is developed by integrating high resolution seismic attributes as a location constraint into a more realistic modelling workflow in this paper. The steerable pyramid technology is able to enhance seismic resolution, which make it possible to generate a high-resolution fracture prediction map along with seismic attribute extraction techniques. For fractured reservoir modelling, DFN modelling provides a powerful tool for simulate fractured reservoir models, helping understand the characteristics of fractures or fracture network in rock masses. With the map as a spatial and geological constraint, DFN modelling is able to generate a more logical and realistic fracture models, promoting the ability of more fracture modelling. The correlation between the logging daily production rate and the fracture model is as high as 70%, and there is an obvious positive correlation. At the same time, the fracture model has a higher degree of overlap with the fracture development zones predicted by seismic attribute results. All the above real case application shows that the approach in this paper can effectively improve the accuracy of fracture modelling, reducing randomness in the traditional DFN modelling. Also, the real case demonstrates the potential of this approach in wide application prospect.
The seismic data that support the findings of this study are available from the Sinopec Shengli Oilfield Company. Restrictions apply to the availability of these data, which were used under license for this study. The seismic data are available from the authors with the permission of the Sinopec Shengli Oilfield Company. Requests to access these datasets should be directed to YW, d2FuZ3l1ZGkwMjE5QDE2My5jb20=.
YW: Writing–original draft. YX: Writing–review and editing. LD: Writing–review and editing. SG: Data curation, Writing–review and editing. WY: Data curation, Writing–review and editing. XH: Conceptualization, Writing–review and editing.
The authors declare financial support was received for the research, authorship, and/or publication of this article. This research was funded by the China Natural Science Foundation (42241206), and the China Natural Science Foundation (U20B2016).
Authors SG and WY were employed by the company Sinopec Shengli Oilfield Company.
The remaining authors declare that the research was conducted in the absence of any commercial or financial relationships that could be construed as a potential conflict of interest.
All claims expressed in this article are solely those of the authors and do not necessarily represent those of their affiliated organizations, or those of the publisher, the editors and the reviewers. Any product that may be evaluated in this article, or claim that may be made by its manufacturer, is not guaranteed or endorsed by the publisher.
Al-Dossary, S., and Marfurt, K. J. (2006). 3D volumetric multispectral estimates of reflector curvature and rotation. Geophysics 71 (5), 41–51. doi:10.1190/1.2242449
Azim, R. A. (2016). Integration of static and dynamic reservoir data to optimize the generation of subsurface fracture map. J. Petroleum Explor. Prod. Technol. 6, 691–703. doi:10.1007/s13202-015-0220-8
Baecher, G. B., Lanney, N. A., and Einstein, H. H. (1977). “Statistical description of rock properties and sampling,” in The 18th U.S. Symposium on rock mechanics (USRMS)).
Baecher, G. B. (1983). Statistical analysis of rock mass fracturing. Math. Geol. 15 (2), 329–348. doi:10.1007/BF01036074
Chilès, J.-P., and Marsily, G. d. (1993). Stochastic models of fracture systems and their use in flow and transport modeling. Flow Contam. Transp. Fract. Rock, 169–236. doi:10.1016/b978-0-12-083980-3.50008-5
Chopra, S., and Marfurt, K. J. (2013). Structural curvature versus amplitude curvature. Lead. Edge 32 (2), 178–184. doi:10.1190/tle32020178.1
Dong, S., Zeng, L., Cao, H., Xu, C., and Wang, S. (2018a). Principle and implementation of discrete fracture network modeling controlled by fracture density. Geol. Rev. 64 (5), 1302–1314. doi:10.16509/j.georeview.2018.05.020
Dong, S., Zeng, L., Xu, C., Cao, H., Wang, S., and Lü, W. (2018b). Some progress in reservoir fracture stochastic modeling research. Oil Geophys. Prospect. 3, 625–641. doi:10.13810/j.cnki.issn.1000-7210.2018.03.023
Hardebol, N. J., Maier, C., Nick, H., Geiger, S., Bertotti, G., and Boro, H. (2015). Multiscale fracture network characterization and impact on flow: A case study on the latemar carbonate platform. J. Geophys. Res. Solid Earth 120 (12), 8197–8222. doi:10.1002/2015JB011879
Hunziker, J., Favino, M., Caspari, E., Quintal, B., Rubino, J. G., Krause, R., et al. (2018). Seismic attenuation and stiffness modulus dispersion in porous rocks containing stochastic fracture networks. J. Geophys. Res. Solid Earth 123 (1), 125–143. doi:10.1002/2017JB014566
Jian, S., Fu, L., Cao, C., Han, T., and Du, Q. (2021). 3D finite-element modeling of effective elastic properties for fracture density and multiscale natural fractures. J. Geophys. Eng. 18 (4), 567–582. doi:10.1093/jge/gxab036
Kang, R., Liu, K., Zhao, C., Jin, P., Peng, D., Luo, S., et al. (2002). Sedimentary facies of the shahejie formation of paleogene in bonan sag of jiyang depression. J. Palaeogeogr. 4 (4), 19–29.
Kolyukhin, D., Protasov, M. J. C., and Geosciences, (2023). Multiscale study of statistical fractal DFN model and corresponding seismic images. Comput. Geosciences 171, 105285. doi:10.1016/j.cageo.2022.105285
Lei, C., Xu, Q.-y., Yuan, X.-t., Kang, C.-j., and He, F. (2020). “The method of DFN in granite buried hill reservoir based on multiple attribute constraints: A case study of B field, Chad,” in Proceedings of the international field exploration and development conference 2019 (Springer Singapore), 1934–1946.(
Mardia, K., Nyirongo, V., Walder, A., Xu, C., Dowd, P., Fowell, R., et al. (2007). Markov chain Monte Carlo implementation of rock fracture modelling. Math. Geol. 39 (4), 355–381. doi:10.1007/s11004-007-9099-3
Mathewson, J., and Hale, D. (2008). “Detection of channels in seismic images using the steerable pyramid,” in SEG international exposition and annual meeting: SEG). SEG-2008-0859.
Schneider, S., Eichkitz, C., Schreilechner, M., and Davis, J. (2016). Interpretation of fractured zones using seismic attributes—case study from teapot dome, Wyoming, USA. InterpreCtation 4 (2), T249–T260. doi:10.1190/INT-2015-0210.1
Shi, C., Jiang, X., Kou, Y., and Zhang, Z. (2021). Research status and prospect of theoretical model of shale gas seepage. Petrochem. Ind. Appl. 40 (8), 10–16. doi:10.3969/j.issn.1673-5285.2021.08.003
Singh, J., Pradhan, S. P., Singh, M., and Hruaikima, L. (2022). Control of structural damage on the rock mass characteristics and its influence on the rock slope stability along national highway-07, garhwal himalaya, India: an ensemble of discrete fracture network (DFN) and distinct element method (DEM). Bull. Eng. Geol. Environ. 81 (3), 96. doi:10.1007/s10064-022-02575-5
Torabi, A., Alaei, B., and Kolyukhin, D. (2017). Analysis of fault scaling relations using fault seismic attributes. Geophys. Prospect. 65 (2), 581–595. doi:10.1111/1365-2478.12440
Wang, Y., and Zhang, S. (2023). Formation mechanism of high-quality reservoirs in deep strata of paleogene, bonan subsag, Zhanhua sag, bohai bay basin. Petroleum Geol. Exp. 45 (1), 11–19. doi:10.11781/sysydz202301011
Welch, M. J., Lüthje, M., and Oldfield, S. J. (2022). DFN generator v2.0: A new tool to model the growth of large-scale natural fracture networks using fundamental geomechanics. Geosci. Model Dev. Discuss., 1–42. doi:10.5194/gmd-2022-22
Xu, C., and Dowd, P. (2010). A new computer code for discrete fracture network modelling. Comput. Geosciences 36 (3), 292–301. doi:10.1016/j.cageo.2009.05.012
Yang, Z., Zhao, H., Huang, Y., Yang, H., Tang, X., Wang, T., et al. (2022). A small heat shock protein, GmHSP17.9, from nodule confers symbiotic nitrogen fixation and seed yield in soybean. Petroleum Geol. Oilfield Dev. Daqing 41 (3), 103–115. doi:10.1111/pbi.13698
Zhang, X., Yu, J., Li, N., and Wang, C. (2021). Multi-scale fracture prediction and characterization method of a fractured carbonate reservoir. J. Petroleum Explor. Prod. Technol. 11 (1), 191–202. doi:10.1007/s13202-020-01033-w
Keywords: seismic attributes, seismic data decomposition, composite attribute, fracture modelling, discrete fracture network (DFN)
Citation: Wang Y, Xu Y, Du L, Gai S, Yu W and Huang X (2023) DFN modelling constrained by multiple seismic attributes using the steering pyramid technology. Front. Earth Sci. 11:1257481. doi: 10.3389/feart.2023.1257481
Received: 12 July 2023; Accepted: 29 August 2023;
Published: 07 September 2023.
Edited by:
Qiaomu Qi, Chengdu University of Technology, ChinaReviewed by:
Yang Zhou, Chengdu University of Technology, ChinaCopyright © 2023 Wang, Xu, Du, Gai, Yu and Huang. This is an open-access article distributed under the terms of the Creative Commons Attribution License (CC BY). The use, distribution or reproduction in other forums is permitted, provided the original author(s) and the copyright owner(s) are credited and that the original publication in this journal is cited, in accordance with accepted academic practice. No use, distribution or reproduction is permitted which does not comply with these terms.
*Correspondence: Yungui Xu, eXVuZ3VpLnh1QG91dGxvb2suY29t; Libing Du, ZHVsaWJpbmcwNjIyQDEyNi5jb20=
Disclaimer: All claims expressed in this article are solely those of the authors and do not necessarily represent those of their affiliated organizations, or those of the publisher, the editors and the reviewers. Any product that may be evaluated in this article or claim that may be made by its manufacturer is not guaranteed or endorsed by the publisher.
Research integrity at Frontiers
Learn more about the work of our research integrity team to safeguard the quality of each article we publish.