 Jiajun Cai1,2,3
 Wenjie Huang
95% of researchers rate our articles as excellent or good
Learn more about the work of our research integrity team to safeguard the quality of each article we publish.
Find out more
ORIGINAL RESEARCH article
Front. Earth Sci. , 27 December 2023
Sec. Geohazards and Georisks
Volume 11 - 2023 | https://doi.org/10.3389/feart.2023.1257440
This article is part of the Research Topic Prevention, Mitigation, and Relief of Compound and Chained Natural Hazards View all 10 articles
Short-term heavy rainfall often causes large-scale rainstorm debris flows in mountainous areas of Southwest China. Aiming to investigate the accumulation and movement of potential source material for the formation of debris flow hazards under extreme short-term heavy rainfall, this paper takes the Xiangbizui debris flow gully, Southwest China, as a case study. A detailed field engineering and geological investigation was carried out on the valley characteristics, formation conditions, provenance types, distribution range, loose solid material reserves that can be transformed into debris flows, and characteristics showing the variation in the grain size of the accumulated solids along the gully to further explore the characteristics of rainstorm-induced debris flow movement. The dynamic processes of debris flow movement and accumulation are numerically simulated to analyze the maximum velocity, accumulation height, range of influence, and evolutionary process based on the theory of continuous media of the approximate Voellmy solution and a high-precision three-dimensional model. The results indicated that rainstorms and steep terrain are the main factors stimulating debris flows. The amount of loose solid material in the channel is approximately 1550.61 × 104 m3, and the dynamic material reserves are approximately 396.41 × 10⁴ m3. The maximum flow depth and velocity are approximately 3.5 m/s and 13 m/s, respectively, which mainly occur in the upper and middle reaches of the channel and in the accumulation fan at the outlet of the channel. The evolutionary process of the debris flow includes four stages: a 0–1,500 m initial acceleration stage, a 1,500–2,200 m fast forward movement stage, a 2,200–3,400 m acceleration stage in the middle and lower reaches, and a 3,400–4,300 m deceleration and end of accumulation stage. The research findings can provide a scientific basis and strong support for risk assessment and avoidance, as well as prevention and control of debris flows in mountainous areas with severe climate change.
Debris flows, which are sudden hazards in mountainous areas, are characterized by a fast flow, high flow, intense energy for carrying solid materials, and high destructive force, making them one of the primary categories of geohazards in Southwest China and worldwide (Tang et al., 2012; Hu et al., 2014; Ni et al., 2014; Gao and Sang, 2017; Liu et al., 2020; Chen and Song, 2021; Chen et al., 2023; Chen and Song, 2023). With recent global climate change, rainfall-induced debris flow disasters feature high volumes and concentrations of rainfall, extreme solid rainfall, a unimodal shift in rain patterns, and short durations. Debris flow frequently lead to severe impacts and significant losses to the economic production and lives of residents (Chen and Song, 2021; Chen et al., 2023; Chen and Song, 2023). Examples include the multiple outbreaks of debris flows in the Xiangbizui gully in Southwest China on 23 October 2017, 26 June 2018, 11 July 2018, and 18 May 2019. Among these, the larger-scale debris flow on 18 May 2019, flushed out approximately 1.3×10⁴ m3 of solid material at once, causing a road blockage, a river blockage, and blockage of a road culvert under construction, which led to direct economic loss. Thus, analyzing debris flow hazards and predicting the debris flow distance and flooding extent to propose prevention and control measures are of great importance for national road access as well as human safety in the study area (Collins, 2008; Jakob et al., 2012; Thouret et al., 2020).
The general approach to examining debris flows is a statistical evaluation and dynamic analysis based on data from regional surveys of water sources, physical sources, and circulation conditions. Such approaches have high confidence in the results but are costly and cumbersome, and numerical simulations with parameter correction can also provide a rational analysis (Canuti et al., 1999; Thiebes, 2012). Utilizing a new generation of geographic information systems (GISs) combined with theoretical modeling of two-phase fluid analysis of debris flows to simulate the debris flow movement and accumulation process, as well as providing critical parameters for the later evaluation of debris flow hazard zoning and prevention, are the current research areas and difficulties in the theoretical study of debris flows, as well as the design of engineering prevention and control (Xu et al., 2021; Chen et al., 2023). As a nonhomogeneous mixed medium, debris flows have complex physical processes and kinetic characteristics. With the development and maturity of computer technology, numerical algorithms, and intrinsic models, numerical simulation has been the primary way to characterize debris flow motion (Harris et al., 2009; Fischer-Kowalski et al., 2011; Ciurean et al., 2017). By establishing numerical models of debris flows with numerical analysis methods, the initiation, flow, and accumulation processes of debris flows are simulated. The obtained results reveal the movement process of debris flows with the help of data and graphics, which can be used as references for debris flow disaster prevention and planning and design of controlling measures (Christen et al., 2010; Zhou et al., 2013; Gan and Zhang, 2019; Zhang et al., 2019; Musumeci et al., 2021).
Dynamic modeling is one of the current research approaches to predicting debris flow movement and accumulation; it generally employs numerical techniques to simulate debris flow transport and accumulation processes using energy and motion conversion laws (Kang et al., 2022; Wang et al., 2022). For different debris flow dynamics issues, Bao et al. (2021) compared and investigated the Eulerian method, the CEL method, and the FEM-SPH method based on the Abaqus software in landslide barrage simulation by applying the method of fluid-solid coupling a coupled fluid-solid coupling (Bao et al., 2021). Liu et al. (2021a) proposed a complex fluid-particle-structure interaction impact estimation model a coupled fluid-particle-structure numerical model for predicting debris flow propagation and building structural damage using the coupled SPH-DEM-FEM method (Liu et al., 2021). Bao et al. (2023a) proposed a new SPH integrated 3D numerical method for quantitatively evaluating and solving the problem of 3D debris flow dynamic simulation process (Bao et al., 2023a). Kong et al. (2022) used a coupled physically based computational fluid dynamics (CFD) and discrete element method (CFD-DEM) to numerically analyse the different blocking mechanisms of flexible, slit and rigid blocking two-phase geophysical flows (Kong et al., 2022). Bao et al. (2023b) used a coupled finite discrete element method-smoothed particle hydrodynamics (FDEM-SPH) approach to reconstruct a three-dimensional model of a weir landslide and simulate its dynamic process and proposed an evolutionary mechanism of high level flow-like landslide-induced waves in a deep valley (Bao et al., 2023b).
The constant medium dynamic model is based on hydrodynamics and uses the material–motion–energy dissipation conversion equation to describe the dynamic process of a debris flow. Therefore, the continuum model can more rationally portray the kinematic properties of the solid material of a debris flow and is thus widely used (Tang et al., 2023). Massflow adopts a depth integral-based numerical analysis method of continuous medium mechanics, which can reveal the whole process of the temporal and spatial evolution of landslides, debris flows, flash floods, and other mountain hazards and simplifies the three-dimensional computational problem into two dimensions, effectively improving the computational efficiency (Huang et al., 2022). In particular, it has been applied in debris flow research, featuring a fast speed, large scale, and scalability (Hungr et al., 1984; Ouyang, 2021; Li et al., 2022). Related applications have been used in dam failure debris flow simulation, risk assessment, and calculation of parameters, such as the maximum rise height, impact force, flow depth, and flow velocity, to enable debris flow simulation and prediction of movement characteristics under complex terrain conditions (Ouyang et al., 2015; Wu and Lan, 2020; Zhu et al., 2023).
Despite extensive research on the mechanism of debris flow movement, fluidization and accumulation characteristics, as well as numerical simulation, owing to the relative lack of basic geological and research data, detailed investigations on the characteristics of channel siltation and accumulation of material sources during the process of debris flow movement have not been carried out. Moreover, the simulated movement of debris flows has relatively poor accuracy due to complicated topographic conditions at the sites where debris flows develop and the inability to conduct large-scale and high-precision topographic mapping in the whole basin area. Therefore, we identify the detailed source conditions of debris flow formation based on indoor data collection and field investigation in this paper, including the source type, distribution range, storage of loose solids that can be transformed into debris flows, and the changes in the solid accumulation size of debris flows along the channel. In addition, the 1:50,000 high-resolution topographic data of the Nose Mouth Gully are combined with the Voellmy numerical analysis model to conduct numerical simulations of the movement characteristics of a storm-type debris flow, revealing the dynamics of the debris flow accumulation process, flooding extent, and accumulation thickness. The research results can not only provide a reference for debris flow disaster prevention and control in mountainous areas affected by climate change but also supply computational methods for in-depth research on storm-induced debris flows in the future.
The Xiangbizui gully is located in Pingwu County, Sichuan Province, Southwest China. The geographic coordinates of the mouth of the ditch are 104° 2′41.93“E, 32° 31′7.76“N (Figure 1). The drainage area is 2.55 km2, and it is mainly 4.45 km in length, with a maximum elevation of approximately 3,145 m and an outlet elevation of 1,484.6 m. Intersecting the main Tiger River, the relative height difference reaches 1,660 m, and the average slope drop of the main ditch is 358.9‰.
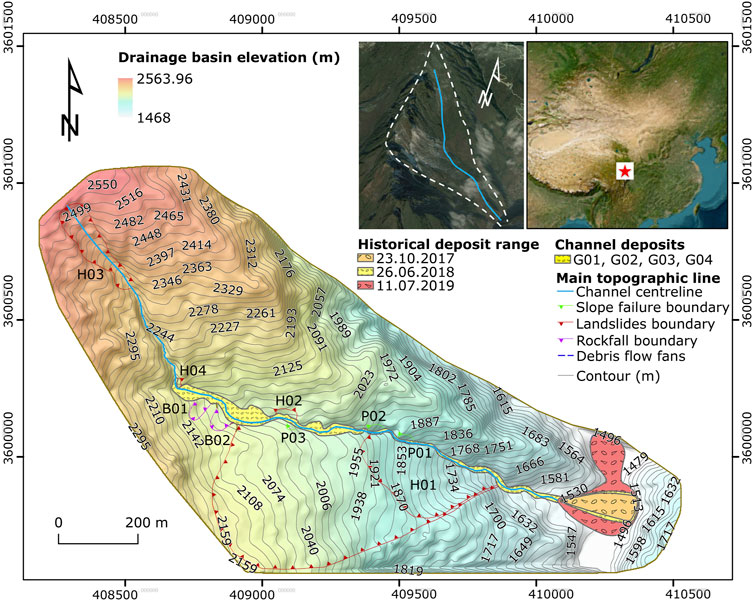
FIGURE 1. Regional location and basic developmental characteristics of the debris flow channel in Xiangbizui Gully, Southwest China (1:50,000 watershed topographic data derived from high-resolution UAV (Phantom 4 RTK) photogrammetry. The coordinate system uses the China Geodetic Coordinate System 2000).
The topography of the upper part of the gully is steeply inclined, the middle and lower parts of the gully are narrow, and steep local canyons are present. Following the characteristics showing each stage of movement of the gully and the topography, the gully channel mainly consists of three parts: the material source area, circulation area, and accumulation area. The material source area primarily comprises medium alpine landslides; the area is prone to landslides, channel blockages during rainfall and channel scouring due to the loose material structure. The channel of the flow area is narrower compared to that in the source area, with a greater slope and less vegetation on both sides of the channel, which quickly causes undercutting of the channel and increases the scale of the debris flow disaster. Finally, the accumulation area is located in the outlet channel, where the debris flow washed out of the outlet and deposited itself in the area, forming a large-scale debris flow accumulation fan.
The research area lies on the eastern edge of the high mountain–valley zone in the transition from the Qinghai-Tibet Plateau to the Sichuan Basin; the area is doubly influenced by the southeast and southwest monsoons and the cold air of the Tibetan Highlands, and the climate elements are vertically distributed according to the change in altitude. Consequently, the precipitation is highly variable, with an average annual rainfall of 806.0 mm, and is unevenly distributed, with May to September accounting for 80% of the annual rainfall within the region.
The central river valleys and valley slopes have widely distributed loose accumulations of the Quaternary system. They have experienced multiperiod glacial activities in the Quaternary period, with glacial geomorphic relics, moraines, and ice-water deposits. The types of Quaternary deposits in the riverbeds and terraces of the main channel and its tributaries is complex and include alluvial deposits, flood deposits, moraines, ice and water deposits, and crumbling slope deposits. The most widely distributed metamorphic rocks in the area are mainly metamorphic sandstone and sandy slate, followed by crystalline greywacke and migmatite. In the river valleys and valley slopes, there are loos Quaternary accumulations caused by metamorphic rock weathering and accumulation. The causes of Quaternary accumulations in channels, riverbeds and terraces are complicated, and these accumulations include alluvial and floodplain types (Figure 2).
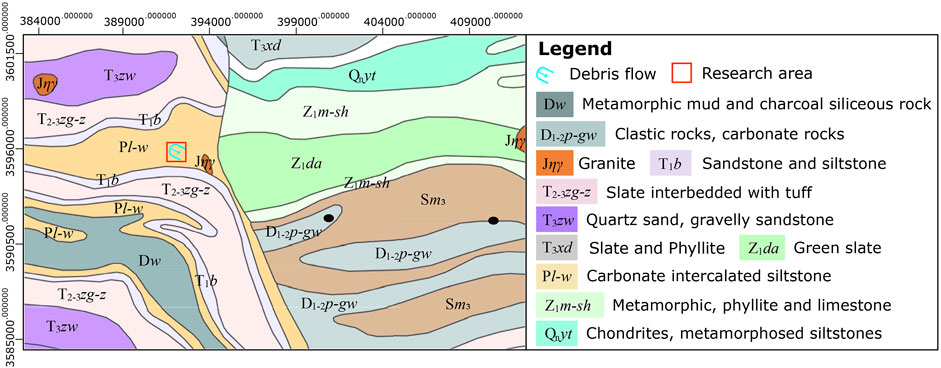
FIGURE 2. Regional stratigraphic background of the Xiangbizui debris flow gully (The coordinate system uses the China Geodetic Coordinate System 2000).
The debris flow ditch erupted on 23 October 2017, 26 June 2018, 11 July 2018, and 18 May 2019. On 23 October 2017, a large-scale burst occurred as a slide, and the one-off volume of material washed out by the debris flow was approximately 1.3×10⁴ m3, causing road blockage, river blockage, and under-construction road culvert blockage, resulting in direct economic losses of approximately 800,000 yuan. On 26 June 2018, Pingwu County, Hu Ya Tibetan Township, experienced a heavy rainfall that lasted approximately 4 h. Then, the debris flow ditch once again initiated the debris flow, which washed out approximately 1.0×10⁴ m3 of material, resulting in the blockage of roads and river channels, and buried roads, overwater culverts and retaining walls. As of 11 July 2018, the area again suffered from a heavy rainstorm, which continued for approximately 6 h, and precipitation exceeded 100 mm, triggering the breakdown of a debris flow in this debris flow channel and creating a pile-up of approximately 1.5×10⁴ m3 material at the ditch outlet. Initiating large-scale debris flows on 18 May 2019, the channel again flushed out nearly 50,000 square meters of solid material, destroying high-voltage line pylons, burying farmhouses, and washing away 600 m of road. In addition, an extensive debris flow jammed the Tiger River, posing a threat to the Tiger Township field town approximately 1.5 km downstream.
Combining the emergency field investigation of typical debris flow cases in Xiangbizui with relevant regional geological background and related literature, field geological survey statistics and unmanned aerial vehicles (UAVs) were used. The UAV equipment model and postprocessing software were Phantom 4 RTK and PhotoScan, respectively. The specific processing flow included image import, alignment (estimation of the camera position and overlap position), creation of point clouds, 3D models, DEMs, and orthophotos. To observe, record, and describe the internal structural characteristics of the flow phase in a typical profile of the primary channel and determine the topographic, geomorphic and water source conditions of debris flow formation, as well as the movement and scale of debris flows, 6 groups of particle size distribution tests on the debris flow deposit were completed; these tests were conducted on samples from the areas of formation, circulation, and accumulation of debris flows to reveal the particle size distribution, superposition characteristics, and genetic characteristics of debris flow deposits.
Based on a gridded the DEM of before and after debris flow occurrence in Xiangbizui Gully, the modeling and numerical analysis of debris flow movement and accumulation processes were carried out by using the improved finite difference principal fluid dynamics method; important characteristic parameters, such as the fluid movement velocity, maximum accumulation thickness, accumulation range, and evolutionary process of the thickness, were obtained. As a result, the stages of debris flow movement in Xiangbizui Gully were identified and divided.
In the continuum model, the debris flow fluid is assumed to be an unstable and heterogeneous fluid that can be characterized by the average velocity U (
where Ux and Uy are the velocities in the x and y directions, respectively. T is the transpose matrix of the average velocity. The magnitude of the speed can be defined as:
where
The Voellmy rheological model is represented by the following mass balance formula:
where H (
where
where φ is the internal friction angle of the debris flow fluid. Integrating the above equations, the Voellmy rheology equation can be derived as:
where the variables are measured by length L, speed (gl)/2, and time (L/g)/2 to obtain a unified Froude value. The gravity vector z = (0, 0, −1), and the perturbation coefficient is defined by the formula ζ'=ξ/g and has no dimension. The detailed operations and processes of the model are shown in Figure 3.
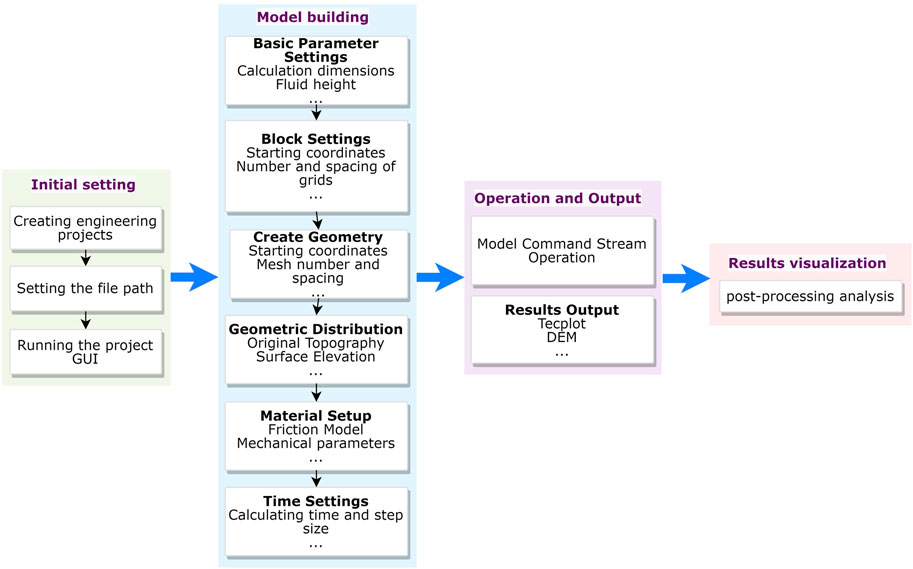
FIGURE 3. Construction and flow of the numerical simulation model of the study area.
The area of clear water in the upper reaches of Xiangbizui Gully and its branch ditches generally has a significant slope, mostly approximately 40°, and the longitudinal slope of valleys is steep (generally greater than 400‰) (Figure 4A). The characteristics of the movement of substantial uplift determine the regional crustal movement. In addition, the catchment area is large, the branches and shallow ditches are developed, and the channel is narrow. These characteristics make sediment in this area converge rapidly under rainfall, and the runoff that forms has a high velocity and scouring ability of solid material. Therefore, the features created by scouring and silting in areas where clear water converges are characterized by scouring.
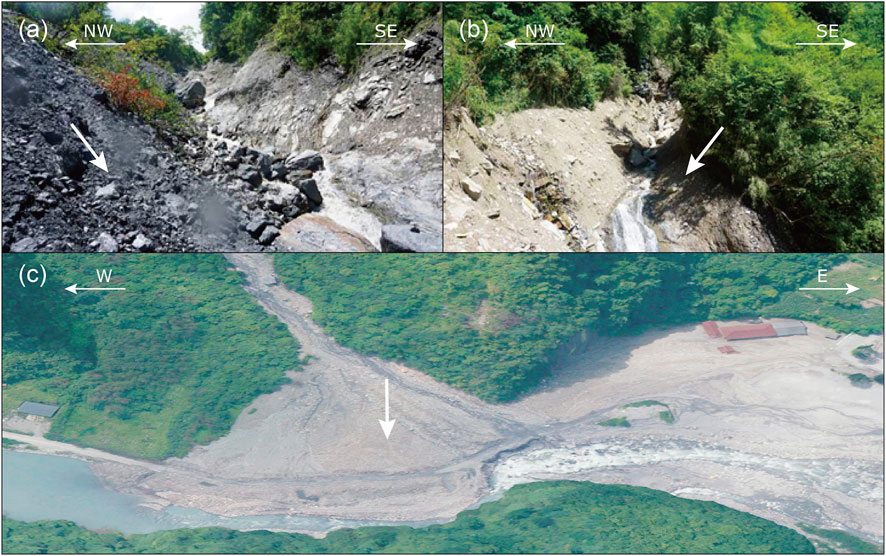
FIGURE 4. The circulation area in the upper (A) and lower (B) sections of the formation area and the accumulation fan at the outlet (C).
The scouring and silting characteristics of the area where clear water converges have an overall longitudinal gradient in the circulation area formed by the Xiangbizui debris flow of approximately 438.24‰, with a slope of approximately 25° (Figure 4B). Therefore, a steep–gentle–steep terrain change appears in the channel. The terrain of the upper section of the circulation area from 2,531 m to 215 m is also steep, with a longitudinal gradient of more than 350‰; in this area, a large landslide is present, and it is the primary source of the debris flow that broke out on 18 May 2019. The middle section of the circulation area that formed lies in the middle reaches, where the terrain is gradual and the longitudinal gradient is approximately 220‰. The channel is bayonet-shaped, which leads to the accumulation of solid materials, so this channel has mainly siltation characteristics. The lower section of the flow area is narrow and steep, with a longitudinal gradient of the channel bed of 647‰. At the same time, multiple scarps are present in the channel, most of which are bedrock. Consequently, this terrain is conducive to the accelerated movement of debris flows, and this channel section has mainly erosional characteristics.
The height difference of the area with alluvial siltation in the accumulation area is approximately 350 m, with a 65.4 m channel length and only a 167.8‰ specific longitudinal drop. Its accumulation fan is developed, and much debris flow material is accumulated in it. Thus, the alluvial characteristics of this section of the channel are predominantly those of siltation. The debris flow formed a large alluvial fan at the beginning of the channel. The fan is 200 m long and 200 m wide, with an average thickness of approximately 7.0 m and a volume of approximately 28×104 m3 (Figure 4C).
The analysis of the morphology of the debris flow accumulation fan and the characteristics of the extrusion of the main river indicate that Xiangbizui Gully is a relatively old debris flow trench. The topography of the debris flow accumulation area is trumpet-shaped, with the front edge directly reaching the Tiger River. The front edge is 150–200 m in width, and the back part is 30–50 m long, with a vertical length of 200 m (Figure 4C). The total area of the accumulation fan is approximately 0.04 km2, and the mound thickness is approximately 7–10 m, accounting for approximately 28×104 m3 of mounded material. Since the survey work is focused on the perspective of debris flow management, no special survey work has been arranged to explore the history of debris flow formation and development, and the changes in the mound fan structure are complex. More intense human farming activities make studying its mounded superposition relationship and analysis very difficult. Hence, the present investigation is based only on the ground survey and mapping, and some superficial speculations are proposed based on the relationship of stacking and superposition of the mounded fan body.
To examine the particle size of sediments in the channel pile, the method is to collect soil samples from 0 to 50 cm in the surface layer for a field sieving test and obtain the weight and percentage of particles with sizes of <5 mm, 5–20 mm, 20–50 mm, 50–100 mm, 100–150 mm, 150–200 mm, and >200 mm, as well as those in other particle classes. Some of the sieved soil samples with particle sizes <5 mm were then sent to the laboratory for further sieve tests, and the results of field sieving and indoor tests were integrated to calculate the percentages of particles of different particle sizes, as shown in Table 1.
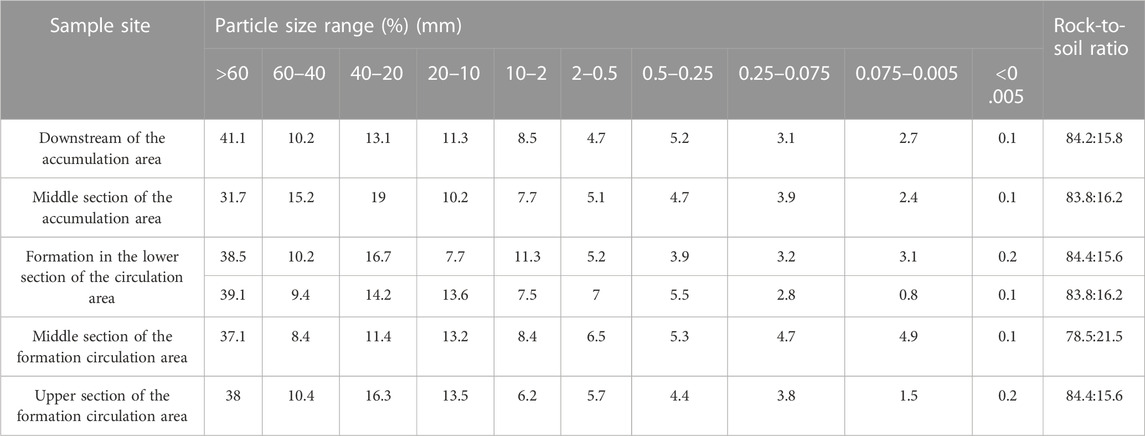
TABLE 1. Statistical analysis of the particle composition of the deposit in Xiangbizui Gully.
The chart shows that the grain size distribution of the debris flow reflects the hydrodynamic conditions and scouring and depositional characteristics of different gully sections, which is basically consistent with the field investigation results; this is mainly reflected in all the test results reflecting a large rock-to-soil ratio, with the maximum ratio of 84.4:15.6 being the result of the particle size analysis in the upper section of the accumulation area of Xiangbizui channel ditch 04. The lowest value is 78.5:21.5 in the midstream 05 region of the circulation area, with a sizeable rock-to-soil ratio; the further downstream the ditch is, the weaker the hydrodynamic conditions are, and the further upstream the ditch is, the stronger the hydrodynamic conditions are.
Xiangbizui Gully has abundant and reliable open source areas for debris flows. The distribution of sources is relatively concentrated, and they are mainly distributed in the 2,531–1,550 m section of the ditch and both sides of the ditch. There are 13 source points that were investigated in this research, and the source types mainly include landslides, collapse accumulations, slope erosion sources, and trench accumulation sources (Figure 5). Moreover, the areas where the channel does not have large avalanches and landslides were calculated as light erosion areas. According to the survey statistics, the total amount of accumulated solid material in the trench is 15.22×10⁴ m3, and the dynamic storage volume that may be involved in debris flow activities is 4.84×10⁴ m3. A total of 1521.81×104 m3 of loose material was obtained from the avalanche slide, and the dynamic storage volume that may be involved in debris flow activity was approximately 386.91×10⁴ m3. The erosion sources on the slope surface totaled 13.58×10⁴ m3, and the dynamic storage volume that may be involved in debris flow activities was 4.6×10⁴ m3. Therefore, 1550.61×104 m3 of loose solid material was available, and 396.41×10⁴ m3 of dynamic storage volume may be involved in debris flow activities.
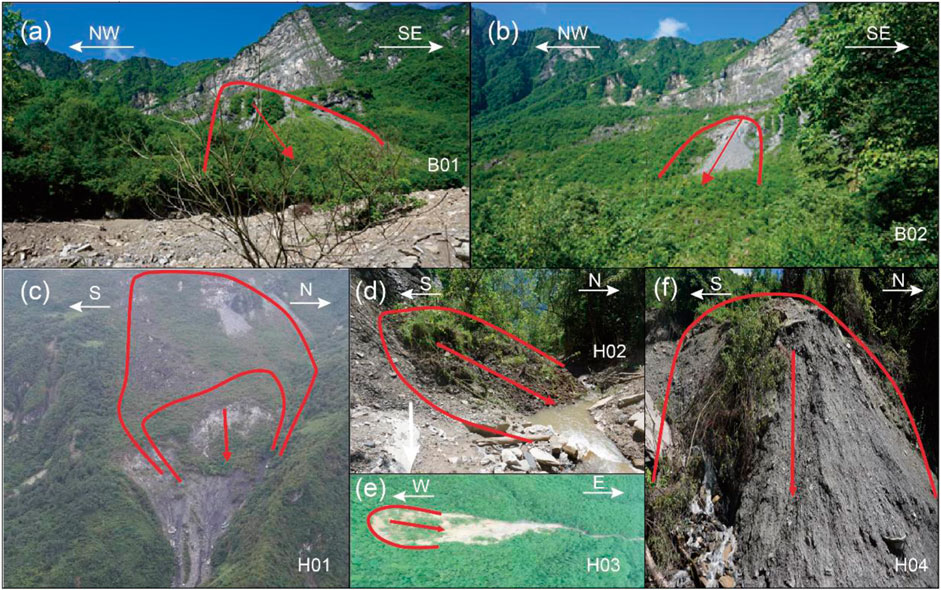
FIGURE 5. Main source types and distribution characteristics of debris flows in Xiangbizui Gully.
Regarding topography and geomorphology, the relative height differences in the Xiangbizui drainage basin are significant, the terrain is steep, and the longitudinal slope of the ditch is vast, which is conducive to the collection of debris flow materials and resulting disasters. For the material source conditions, the total accumulation of more material in the ditch, which is now the open ditch that houses a solid material amount of 439.68 × 10⁴ m3, may be involved in debris flow activities that fill a dynamic storage volume of 56.05 × 10⁴ m3; this is equivalent to 35 times the annual 20 debris flows per year; the critical rainfall intensity of debris flows may be reduced. Therefore, both the frequency and scale of debris flow outbreaks may increase. A future debris flow in the main ditch will occur once every 1–5 years. In the future, as vegetation recovers and some of the material sources stabilize, its frequency may gradually decrease. Accordingly, it is estimated that approximately 2 debris flow disasters may occur within 20 years of the designed lifespan, and the amount of solid material that washes out is approximately 4.62×10⁴ m3.
The primary water source for debris flows in Nose Mouth Gully is atmospheric precipitation. Since debris flows occur in the rainy season, snow and ice meltwater in spring generally do not become water sources for debris flows. In addition, the channel area is not enriched in groundwater; hence, it does not constitute the primary water source for debris flows, and no reservoirs, lakes, or other concentrated surface water bodies exist in the channel area. Therefore, surface runoff from heavy rainfall is the primary water source and stimulus for debris flows.
Precipitation statistics according to the 2019 rainfall data in the district show that the rainfall in the Xiangbuzui ditch is low but relatively concentrated, often occurring with localized geographically defined rainstorms and hail, and precipitation is concentrated in the rainy season (May to September) (Figure 6), which accounts for 80% of the annual rainfall. Based on the contour map attached to the “Manual for the Calculation of Storm Floods in Small- and Medium-sized Watersheds in Sichuan Province”, the average values of 1/6, 1, 6, and 24 h multiyear maximum rainfall in the study area are 9.0, 12.5, 33, and 45 mm, respectively. Under the condition of p=2%, the rain intensities at 1/6, 1, 6, and 24 h can reach 22.32, 26.88, 59.4, and 86.4 mm, respectively. For p=5%, the 1/6, 1, 6, and 24 h rain intensities reach 18.27, 22.75, 52.47, and 75.15 mm, respectively, while the latest debris flow disaster in Xiangbuzui Gorge received 83.3 mm of rainfall, far exceeding the pre-disaster rainfall. However, the distribution is relatively sparse despite the seasonal snow accumulation in the upper reaches. Thus, snow and ice meltwater are used only as water conditions for forming debris flows, while heavy rainfall mobilizes mud. Moreover, the slopes of the upper part of the valley and each side of the valley accelerate the runoff and accumulation of surface precipitation, providing favorable water conditions for the formation of Xiangbizui Gully.
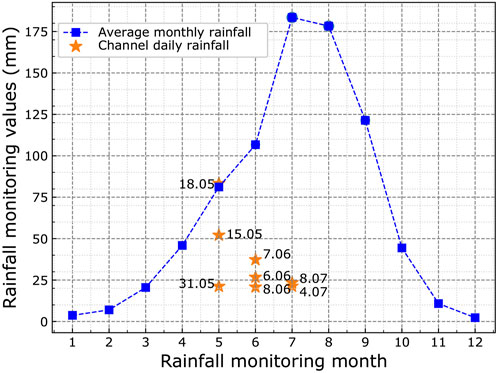
FIGURE 6. Annual rainfall and rainfall in the flood season in Xiangbizui Gully.
This research simulated the debris flow movement in Xiangbizui Gully under actual rainfall frequencies using Massflow software and obtained the flow velocity, mud depth, and characteristics of mound fan movement of this debris flow ditch at this frequency. Three modes of topographic data in the Massflow model are z+h, z-h, and z+surface, and they are used for geometric assignment; this numerical simulation is based on the post-slide DEM of the landslide in Nixu village. Then, the topography raster data before the landslide are subtracted from the topography raster data after the landslide (the size and range of both raster elements should be kept the same) to obtain the topography raster data h within the slide area. However, the original topographic conditions were not input into the digital elevation model (DEM) and image data because the Xiangbigou debris flow trench is located in a high mountain canyon area, and many outbreaks of short-duration heavy rainfall-type debris flows occur in the trench. Therefore, a raster interpolation method is used to recover the undamaged terrain with a high-precision digital elevation model that shows the flow from UAV aerial photography. Finally, a raster image element size of 2 m*2 m is obtained for the preslippage terrain raster data. Due to the limitation of computational performance, the study resampled the numerical computation grid accuracy to 7 m×7 m, the number of computational grids ranks 335*212, giving a total of 71,020 grids, a time interval of 50 s, and a total computation time of approximately 6 h.
To select a suitable friction model and corresponding motion parameters for the numerical simulation of debris flows in Xiangbigou and to research and compare debris flow events with similar conditions for disasters in this area, the Voellmy base friction model and three parameters, namely, debris flow bulk density γ, friction coefficient μ and turbulence coefficient ξ, which are the most suitable for the actual situation, are selected. The paper used the debris flow deposits at the five locations in Table 1 to mix the debris flow slurry with the floodwater in the ditch, mix the slurry into the debris slurry consistency, weigh it, and measure the volume of the slurry on-site, and then calculating its gravity as the gravity of the debris flow fluid according to the “Specification for Debris flow Hazard Prevention and Control Engineering Investigation” (DZ/T0220--2006) (Varnes, 1958; Geological and Environmental Department of the Ministry of Land and Resources, 2006; Hungr et al., 2014). The friction coefficient (μ) and turbulence coefficients (ζ) were determined by preferential calibration of the model parameters using the methodology of Luna et al. (2011) and Liu et al. (2021) (Luna et al., 2011; Liu et al., 2021). The judgment was based on the iterative selection of the parameters until the simulation results matched the observed characteristics with the velocity and height of the debris flow along the channel (Luna et al., 2011). The debris flow γ = 1800 kg/m3, μ = 0.25, and ζ= 200 (m/s2); the total simulation time is 2,400 s, and different mud depths, flow intensities, and accumulation ranges of debris flows are obtained. The simulation results show that the maximum flow depth of the debris flow reaches 2.5 m in the first 100 s and 3 m within 300 s. The flow velocity is fast, the flow accumulates in front of the impact fan at the gully mouth, and then the accumulation velocity slows down. The final accumulation thickness is approximately 3.5 m. After 600 s of simulation, the source material is transformed into fluid, moves downstream along the channel, and accumulation accelerates at the accumulation fan at the groove mouth. At 900 s, the thicknesses of some fluids in the upper reaches of the debris flow channel gradually decrease, and the thickness of the fan accumulation gradually increases and begins to progressively diffuse. At 1,200 s, most of the fluid accumulates in the channel mouth and slowly accumulates, and the maximum flow depth in the channel decreases to less than 1 m. At 2,400 s, debris flow movement ends, and the maximum flow depth of the accumulation fan diffuses outward and is reduced compared with that at 1,200 s. In this simulation, the maximum flow depth in the debris flow movement is as high as 9. 6 m. In the process of fluid movement, the debris flow direction is consistent with the process of movement. From the starting point of the H03 landslide, the source material first flows into the formation area, forming initial accumulation area D1; from the starting point of the H02 landslide, material flows into the gully accumulation area, creating accumulation fan D2. After that, the material in accumulation area D1 and the landslide at starting point H02 further meet in the circulation–formation area in the middle of the debris flow gully, and the debris flow depth and velocity all show an enhancement effect based on superposition; this effect accelerates the speed (c-e) of debris flow movement in the lower section of the gully. After moving to the gully mouth, the open terrain causes the debris flow to stabilize and accumulate rapidly, forming the final typical fan-shaped accumulation area D3 (Figure 7). The measured area and volume of the deposition fan resulting from the latest debris flow event in Xiangbigou are compared with the numerical simulation results under actual rainfall frequencies. The results show that the measured area of the deposition fan is 0.04 km2, the deposition fan’s depth and numerical simulation area are 0.377 km2, and the simulation accuracy of the stacking depth reaches 92%.
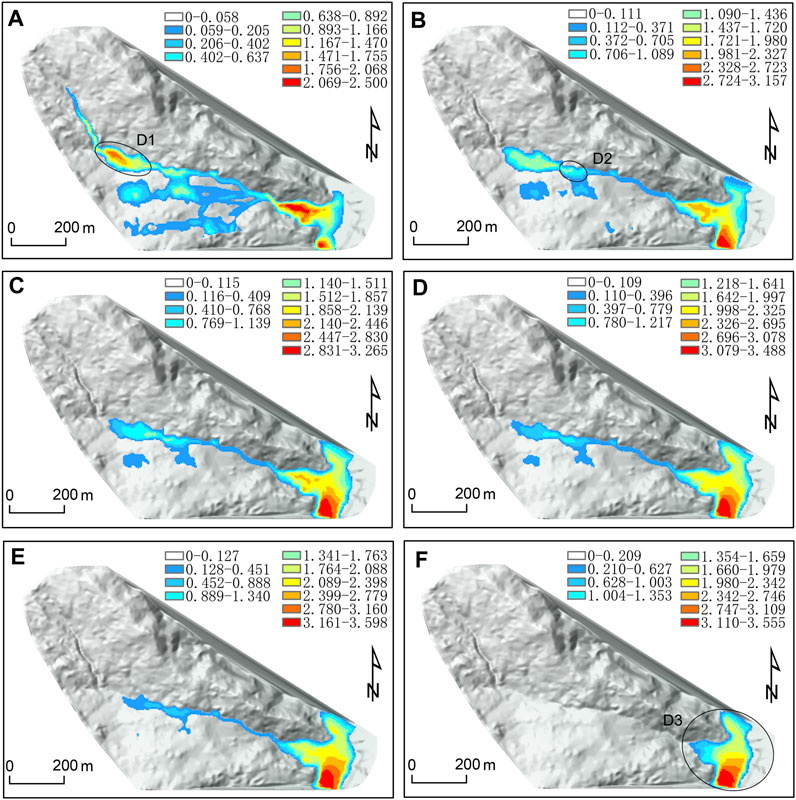
FIGURE 7. Variation in debris flow depth (m) in Xiangbizui Gully at different times.
The curve showing the evolution of the accumulated thickness in the longitudinal section of the main gully obtained from the raster data of the fluid depth in the debris flow gully at different times shows that the accumulated thickness in the longitudinal section of the main gully changes most drastically within 0–100 s; the maximum thickness appears at distances of 0–1.5 and 3.2–3.6 km in the gully formation area, which occurs in the stage of rapid transformation of gravitational potential energy into kinetic energy of the sliding body. After t = 300 s the maximum accumulated thickness in the channel increases over time, its speed of decline slows down obviously, and its ability to move forward gradually weakens, but the accumulation depth deepens. When t=600–1200 s, the maximum accumulated thickness in the channel is approximately 1.3 m, and the change in the accumulated thickness in the source region of the channel decreases obviously, but the range of change is smaller than that in the whole front edge of the accumulation fan. When t=2,400 s, the comparison of the thickness evolution curves shows that the residual fluid in the front edge of the accumulation fan has stopped moving overall, the distance of horizontal movement has reached the maximum value of 4.45 km, and the accumulated thickness in the whole accumulation area no longer changes, reaching the final accumulation form (Figure 8).
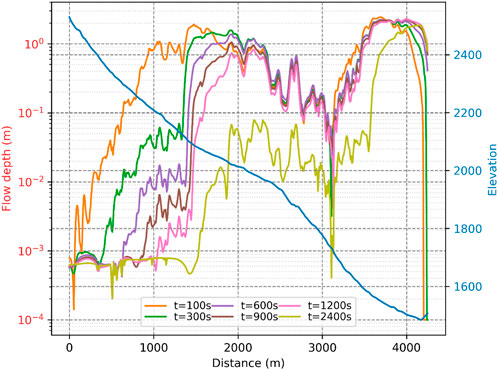
FIGURE 8. Evolutionary process of the fluid flow depth in the channel and response of topographic elevation during 6 monitoring periods along the channel.
To further study and compare the velocity change when the fluid moves to each position in the longitudinal section of the gully, the velocities at all monitoring points in the main gully in six periods are extracted along the main gully containing the debris flow, and the curve showing the velocity change (Figure 9) is generated. The results show that the overall velocities of the fluid are approximately 0–13 m/s within 0–100 s. The velocity is relatively high during the whole flow process, and the range of distance of the sliding body movement can be monitored at the upstream position of the corresponding source area as 0–1,300 m. During 100–300 s, the distribution begins to disperse and the velocity begins to decrease due to the expansion of the range of fluid accumulation in the channel and the synchronous expansion of the range of fluid velocity. The region with higher velocity is the transition between the upstream front edge of the channel and the source area, and the maximum velocity of the sliding body remains at 0–8 m/s during this period. From 300 to 600 s, the velocity of the fluid decreases obviously from the leading edge to the trailing edge, and the velocity of the leading edge decreases to approximately 5 m/s. At 600–1,200 s, the maximum velocity of the leading edge of the sliding body drops to less than 1 m/s. When t=2,400 s, the velocity at the stacking fan in the valley drops to zero, and only the residual sliding body in the source region maintains a certain flow velocity. During 300–6,000 s, the leading edge of the source region and the flow region upstream of the channel have the longest fluid movement time, and the peak velocities are 0–8 m/s. Moreover, there are oscillations in velocity in the distance range of 0–1,000 m, which may be related to the different phases of the flow of debris flow itself, which may show some instability during the initiation and acceleration of the debris flow.
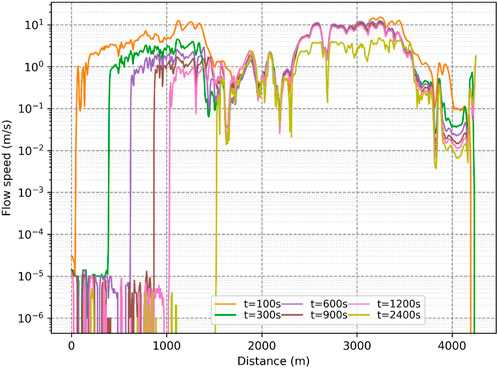
FIGURE 9. Evolutionary process of the flow velocity along the channel at different times.
Through the above analysis, the whole process of debris flow movement from initiation to stoppage can be divided into four stages: the starting and accelerating stage of the fluid body is in the range of 0–1,500 m upstream of the main channel, and the maximum velocity reaches 13 m/s in this period. During 1,500–22,200 m, the sliding body moves forward rapidly, the maximum velocity of the sliding body is approximately 1 m/s, and the horizontal movement distance reaches 700 m. At 2,200–3,400 m, the fluid accelerates to the middle and lower reaches of the channel, and the horizontal movement distance reaches the maximum of 1,200 m, which is the core stage of the long-distance movement of fluid. During 3,400–4,300 m, as the flow velocity gradually slows, the accumulated thickness in most areas of the accumulation fan continuously accumulates to 3.5 m, and the front edge of the debris flow stops moving and reaches the final accumulation state.
The relative height difference in the upper reaches of the Xiangbizui Gully channel is approximately 1660.4 m, and the average gradient of the main channel is 358.9‰. The terrain is steep, and the longitudinal slope of the valley is large, which provides favorable topographic conditions for the development of debris flows. The regional structure has an area of strong uplift, and the undercutting valley and erosion of the side are strong, which increases the erosion of the debris flow gully. The vegetation coverage in the basin is generally high, with an average vegetation coverage rate of approximately 70%. The recent (2019 debris flow) range of debris flow scouring and silting in the valley is approximately 2 m, and the debris flow activity intensity is high. Metamorphic sandstone, phyllite, limestone, loose Quaternary residual slope deposits, colluvium, ice water deposits, etc., are mainly exposed in the area. The total reserves of loose materials along the ditch are abundant, and the average thicknesses of loose materials in the sand-producing area are 1–55 m. The slope of the gully bank is generally greater than 30, and the shape of the gully valley is V-shaped, which is beneficial to the convergence of source material and source water and the formation of debris flows. The degree of gully blockage is average. In addition, slippage in the area, side erosion of the gully bank, and re-transport of loose material at the bottom provide abundant solid source conditions for the occurrence of debris flows, while good catchment conditions and sufficient hydrodynamic forces in the gully provide better water source conditions for the development of debris flows, thereby providing basic requirements for the formation of debris flows.
According to a previous investigation, four large-scale debris flows occurred in Xiangbizui Gully on 23 October 2017, 26 June 2018, 11 July 2018, and 18 May 2019. Among them, the latest incident had an occurrence period of once in 50 years, with a 24-h rainfall of 83.3 mm, which caused a large-scale debris flow in the gully. The debris flow rushed out of the gully mouth and buried the highway for approximately 600 m, and the debris flow volume was approximately 5 × 10⁴ m3. The debris flow rushed into the Huya River, which is the main river, blocking the Huya River. According to the classification, i.e., high-frequency debris flows (multiple times a year to once every 5 years), medium-frequency debris flows (1 time/5–20 years), low-frequency debris flows (1 time/20–50 years), and extremely low-frequency debris flows (>1 time/50 years), the debris flows in this gully are classified as high-frequency debris flows. In the debris flow formation area, loose materials, such as mud and sand, are collected in valleys under the action of concentrated rainfall. Because the fluid contains much sediment, has a large specific gravity, and the relative height difference in the basin is large, the terrain is steep, the potential energy is converted into kinetic energy during collection, the flow velocity is fast, and the ability to impact erosion is strong. Because of its rapid erosion, the sediment forms the foot of the gully bank slope in the circulation area, which leads to a large area of gully bank slippage, and the loose source material quickly replenishes to the fluid. In addition, its downward erosion is intense, and the loose deposits at the original gully bottom also enter the debris flow, rapidly increasing the content of solid matter in the fluid (Ouyang et al., 2013).
The scale of a debris flow is mainly related to the accumulation and dynamic changes in loose solid source material in the gully and the rainstorm causing the debris flow. When loose solid source material accumulates more in gullies and encounters concentrated rainstorms, large-scale debris flow disasters often occur (Nettleton et al., 2005; Hungr and McDougall, 2009; Iverson and Ouyang, 2015; Wang et al., 2015; Wang et al., 2021). After the occurrence of a debris flow, some solid source material that can participate in a debris flow in the gully area are transported away by the debris flow. According to reconnaissance of the site, there is currently a large amount of loose solid source material that can participate in debris flow activities in the gully area. The solid source material in the gully area accumulates again and encounters heavy rain that can stimulate debris flows, which causes the loose solid materials that can participate in debris flow activities to rush into the accumulation area again. However, the shortening of the debris flow development and occurrence period are important factors influencing the increase in the scale of activity and destruction ability of Xiangbizui Gully.
This research adopts a field geological survey, low-altitude unmanned aerial survey (UAV), numerical simulation and other methodologies to explore the characteristics of the development conditions, surface accumulation, and kinematics of the Xiangbizui debris flow gully in southwestern China and mainly draws the following three conclusions:
1) The detailed field results showed that rainstorms and topographic conditions are the main conditions for debris flows, while the scale of the debris flows is primarily correlated with the accumulated volume of loose solid source material in the gully and the dynamics of the triggering conditions. At present, there are a total of 1550.61×104 m3 of loose solid source material in Xiangbizui Gully and 396.41×10⁴ m3 of movable deposits that may be involved in debris flow events; thus, a large-scale debris flow hazard may occur in the case of heavy rainfall.
2) Numerical analysis revealed that the movement and accumulation processes of the Xiangbizui debris flow gully are characterized by remarkable phased flow and uneven accumulation in the topographic domain. The maximum debris flow depth of approximately 3.5 m is mainly distributed in the gully channel and the accumulation fan at the outlet, and the maximum flow velocity of 13 m/s is concentrated in the middle and upper reaches of the channel where the topography is steep. The whole flow process consists of four stages: initial acceleration, fast forward movement, acceleration, deceleration and stopping.
3) This research was carried out to assess the geo-environmental conditions after the outbreak of debris flows, which were influenced by the variability of local heavy rainfall events in the middle–high zone, and it was hypothesized that new landslide bodies would be formed within the debris flow source area to further replenish the source material. Therefore, the monitoring of debris flows should be increased in the later stage of monitoring and control project operation, and it is necessary to supplement and update the research results according to the specific changing characteristics.
The original contributions presented in the study are included in the article/Supplementary Material, further inquiries can be directed to the corresponding author.
JC: Investigation, Software, Writing–original draft. WH: Conceptualization, Funding acquisition, Methodology, Visualization, Writing–review and editing. QY: Investigation, Validation, Writing–original draft.
The author(s) declare financial support was received for the research, authorship, and/or publication of this article. This research was sponsored by the Sichuan Natural Science Foundation Project “Evaluation System of Debris flow Activity in Earthquake Zone Based on Spatial and Temporal Evolution Law” (No. 2023NSFSC0809). The Natural Resources Geological Survey Ministry Integrated Natural Resources Survey Project (Tibetan Plateau Lakes Survey) (No. DD20230509).
The authors would like to acknowledge the insightful comments and suggestions of the editor and anonymous referees that were very helpful for an earlier version of the manuscript.
Author WH was employed by Chengdu Huajian Geological Engineering Technology Co Ltd.; Author QY was employed by Sichuan Province Geological Engineering Co Ltd.
The remaining author declares that the research was conducted in the absence of any commercial or financial relationships that could be construed as a potential conflict of interest.
All claims expressed in this article are solely those of the authors and do not necessarily represent those of their affiliated organizations, or those of the publisher, the editors and the reviewers. Any product that may be evaluated in this article, or claim that may be made by its manufacturer, is not guaranteed or endorsed by the publisher.
The Supplementary Material for this article can be found online at: https://www.frontiersin.org/articles/10.3389/feart.2023.1257440/full#supplementary-material
Bao, Y., Su, L., Chen, J., Ouyang, C., Yang, T., Lei, Z., et al. (2023b). Dynamic process of a high-level landslide blocking river event in a deep valley area based on FDEM-SPH coupling approach. Eng. Geol. 319, 107108. doi:10.1016/j.enggeo.2023.107108
Bao, Y., Su, L., Chen, J., Zhang, C., Zhao, B., Zhang, W., et al. (2023a). Numerical investigation of debris flow–structure interactions in the Yarlung Zangbo River valley, north Himalaya, with a novel integrated approach considering structural damage. Acta Geotech. 18, 5859–5881. doi:10.1007/s11440-023-02079-w
Bao, Y., Sun, X., Zhou, X., Zhang, Y., and Liu, Y. (2021). Some numerical approaches for landslide river blocking: introduction, simulation, and discussion. Landslides 18, 3907–3922. doi:10.1007/s10346-021-01725-2
Canuti, P., Casagli, N., and Catani, F. (1999). “Successes and failures in fighting landslides: some experiences from Italy and elsewhere,” in Sub-forum on science and technology in support of natural disaster reduction (World Meteorological Organization WMO), 89–110.
Chen, Z., and Song, D. (2021). Numerical investigation of the recent Chenhecun landslide (Gansu, China) using the discrete element method. Nat. Hazards 105, 717–733. doi:10.1007/s11069-020-04333-w
Chen, Z., and Song, D. (2023). Modeling landslide susceptibility based on convolutional neural network coupling with metaheuristic optimization algorithms. Int. J. Digital Earth 16 (1), 3384–3416. doi:10.1080/17538947.2023.2249863
Chen, Z., Song, D., and Dong, L. (2023). An innovative method for landslide susceptibility mapping supported by fractal theory, GeoDetector, and random forest: a case study in Sichuan Province, SW China. Nat. Hazards 118, 2543–2568. doi:10.1007/s11069-023-06104-9
Christen, M., Kowalski, J., and Bartelt, P. (2010). RAMMS: numerical simulation of dense snow avalanches in three-dimensional terrain. Cold Regions Sci. Technol. 63 (1-2), 1–14. doi:10.1016/j.coldregions.2010.04.005
Ciurean, R. L., Hussin, H., Van Westen, C. J., Jaboyedoff, M., Nicolet, P., Chen, L., et al. (2017). Multi-scale debris flow vulnerability assessment and direct loss estimation of buildings in the Eastern Italian Alps. Nat. hazards 85, 929–957. doi:10.1007/s11069-016-2612-6
Collins, T. K. (2008). Debris flows caused by failure of fill slopes: early detection, warning, and loss prevention. Landslides 5 (1), 107–120. doi:10.1007/s10346-007-0107-y
Fischer-Kowalski, M., Krausmann, F., Giljum, S., Lutter, S., Mayer, A., Bringezu, S., et al. (2011). Methodology and indicators of economy-wide material flow accounting: state of the art and reliability across sources. J. Industrial Ecol. 15 (6), 855–876. doi:10.1111/j.1530-9290.2011.00366.x
Gan, J., and Zhang, Y. S. (2019). Numerical simulation of debris flow runout using Ramms: a case study of Luzhuang Gully in China. Comput. Model. Eng. Sci. 121, 981–1009. doi:10.32604/cmes.2019.07337
Gao, J., and Sang, Y. (2017). Identification and estimation of landslide-debris flow disaster risk in primary and middle school campuses in a mountainous area of Southwest China. Int. J. disaster risk Reduct. 25, 60–71. doi:10.1016/j.ijdrr.2017.07.012
Geological and Environmental Department of the Ministry of Land and Resources (2006). Specification for debris flow hazard prevention and control engineering investigation. DZ/T0220--2006.
Harris, C., Arenson, L. U., Christiansen, H. H., Etzelmüller, B., Frauenfelder, R., Gruber, S., et al. (2009). Permafrost and climate in Europe: monitoring and modelling thermal, geomorphological and geotechnical responses. Earth-Science Rev. 92 (3-4), 117–171. doi:10.1016/j.earscirev.2008.12.002
Hu, W., Xu, Q., Van Asch, T. W. J., and Zhu, X. (2014). Flume tests to study the initiation of huge debris flows after the Wenchuan earthquake in SW China. Eng. Geol. 182, 121–129. doi:10.1016/j.enggeo.2014.04.006
Huang, G., Lv, G., Zhang, S., Huang, D., Zhao, L., Ni, X., et al. (2022). Numerical analysis of debris flows along the Sichuan-Tibet railway based on an improved 3D sphere DDA model and UAV-based photogrammetry. Eng. Geol. 305, 106722. doi:10.1016/j.enggeo.2022.106722
Hungr, O., Leroueil, S., and Picarelli, L. (2014). The Varnes classification of landslide types, an update. Landslides 11, 167–194. doi:10.1007/s10346-013-0436-y
Hungr, O., and McDougall, S. (2009). Two numerical models for landslide dynamic analysis. Comput. geosciences 35 (5), 978–992. doi:10.1016/j.cageo.2007.12.003
Hungr, O., Morgan, G. C., and Kellerhals, R. (1984). Quantitative analysis of debris torrent hazards for design of remedial measures. Can. Geotechnical J. 21 (4), 663–677. doi:10.1139/t84-073
Iverson, R. M., and Ouyang, C. (2015). Entrainment of bed material by Earth-surface mass flows: review and reformulation of depth-integrated theory. Rev. Geophys. 53 (1), 27–58. doi:10.1002/2013rg000447
Jakob, M., Stein, D., and Ulmi, M. (2012). Vulnerability of buildings to debris flow impact. Nat. hazards 60, 241–261. doi:10.1007/s11069-011-0007-2
Kang, T., Jang, C. L., Kimura, I., and Lee, N. (2022). Numerical simulation of debris flow and driftwood with entrainment of sediment. Water 14 (22), 3673. doi:10.3390/w14223673
Kong, Y., Guan, M., Li, X., Zhao, J., and Yan, H. (2022). How flexible, slit and rigid barriers mitigate two-phase geophysical mass flows: a numerical appraisal. J. Geophys. Res. Earth Surf. 127 (6), e2021JF006587. doi:10.1029/2021jf006587
Li, Y., Chen, J., Zhou, F., Li, Z., and Mehmood, Q. (2022). Stability evaluation and potential damage of a giant paleo-landslide deposit at the east himalayan tectonic junction on the southeastern margin of the qinghai–tibet plateau. Nat. Hazards 111, 2117–2140. doi:10.1007/s11069-021-05132-7
Liu, B., Hu, X., Ma, G., He, K., Wu, M., and Liu, D. (2021b). Back calculation and hazard prediction of a debris flow in Wenchuan meizoseismal area, China. Bull. Eng. Geol. Environ. 80, 3457–3474. doi:10.1007/s10064-021-02127-3
Liu, C., Yu, Z., and Zhao, S. (2021a). A coupled SPH-DEM-FEM model for fluid-particle-structure interaction and a case study of Wenjia gully debris flow impact estimation. Landslides 18, 2403–2425. doi:10.1007/s10346-021-01640-6
Liu, M., Zhang, Y., Tian, S., Chen, N. S., Mahfuzr, R., and Javed, I. (2020). Effects of loose deposits on debris flow processes in the Aizi Valley, southwest China. J. Mt. Sci. 17 (1), 156–172. doi:10.1007/s11629-019-5388-9
Luna, Q. B., Blahut, J., Van Westen, C. J., Sterlacchini, S., van Asch, T. W. J., and Akbas, S. O. (2011). The application of numerical debris flow modelling for the generation of physical vulnerability curves. Nat. hazards earth Syst. Sci. 11 (7), 2047–2060. doi:10.5194/nhess-11-2047-2011
Musumeci, R. E., Foti, E., Rosi, D. L., Sanfilippo, M., Stancanelli, L. M., Iuppa, C., et al. (2021). Debris-flow hazard assessment at the archaeological UNESCO world heritage site of Villa Romana del Casale (Sicily, Italy). Int. J. Disaster Risk Reduct. 64, 102509. doi:10.1016/j.ijdrr.2021.102509
Nettleton, I. M., Martin, S., and Hencher, S. (2005). Debris flow types and mechanisms. Scottish road network landslides study, 45–67.
Ni, H., Zheng, W., Song, Z., and Xu, W. (2014). Catastrophic debris flows triggered by a 4 July 2013 rainfall in Shimian, SW China: formation mechanism, disaster characteristics and the lessons learned. Landslides 11, 909–921. doi:10.1007/s10346-014-0514-9
Ouyang, C. (2021). “Massflow—a software for dynamic modeling and risk evaluation of earth-surfaced flow,” in EGU general assembly conference abstracts (EGU General Assembly), EGU21–14914.
Ouyang, C., He, S., and Tang, C. (2015). Numerical analysis of dynamics of deb-ris flow over erodible beds in Wenchuan earthquake-induced area. Eng. Geol. 194, 62–72. doi:10.1016/j.enggeo.2014.07.012
Ouyang, C., He, S., Xu, Q., Luo, Y., and Zhang, W. (2013). A MacCormack-TVD finite difference method to simulate the mass flow in mountainous terrain with variable computational domain. Comput. Geosciences 52, 1–10. doi:10.1016/j.cageo.2012.08.024
Savage, S. B., and Hutter, K. (1989). The motion of a finite mass of granular material down a rough incline. J. fluid Mech. 199, 177–215. doi:10.1017/s0022112089000340
Tang, C., van Asch, T. W. J., Chang, M., Chen, G., Zhao, X., and Huang, X. (2012). Catastrophic debris flows on 13 August 2010 in the Qingping area, southwestern China: the combined effects of a strong earthquake and subsequent rainstorms. Geomorphology 139, 559–576. doi:10.1016/j.geomorph.2011.12.021
Tang, J., Liu, C., and Mao, J. (2023). Numerical simulation and hazard analysis of debris flows in guxiang gully, tibet, China. Front. Rock avalanche, landslide debris flow hazards Mt. areas 4, 16648714.
Thiebes, B. (2012). Landslide analysis and early warning systems: local and regional case study in the Swabian Alb, Germany. Springer Science and Business Media.
Thouret, J. C., Antoine, S., Magill, C., and Ollier, C. (2020). Lahars and debris flows: characteristics and impacts. Earth-Science Rev. 201, 103003. doi:10.1016/j.earscirev.2019.103003
Wang, F., Wang, J., Chen, X., Zhang, S., Qiu, H., and Lou, C. (2022). Numerical simulation of boulder fluid–solid coupling in debris flow: a case study in zhouqu county, gansu Province, China. Water 14 (23), 3884. doi:10.3390/w14233884
Wang, Y., Nie, L., Liu, C., Zhang, M., Xu, Y., Teng, Y., et al. (2021). Rainfall warning model for rainfall-triggered channelized debris flow based on physical model test—a case study of laomao mountain debris flow in dalian city. Water 13 (8), 1083. doi:10.3390/w13081083
Wang, Z. Y., Lee, J. H. W., and Melching, C. S. (2015). Debris flows and landslides. River dynamics and integrated river management, 193–264.
Wu, Y., and Lan, H. (2020). Debris flow analyst (DA): a debris flow model considering kinematic uncertainties and using a GIS platform. Eng. Geol. 279, 105877. doi:10.1016/j.enggeo.2020.105877
Xu, W., Wang, S., Qi, W., Li, X., and Wang, C. (2021). Disaster chain analysis of landfill landslide: scenario simulation and chain-cutting modeling. Sustainability 13 (9), 5032. doi:10.3390/su13095032
Zhang, N., Matsushima, T., and Peng, N. (2019). Numerical investigation of post-seismic debris flows in the epicentral area of the Wenchuan earthquake. Bull. Eng. Geol. Environ. 78, 3253–3268. doi:10.1007/s10064-018-1359-6
Zhou, J., Cui, P., and Yang, X. (2013). Dynamic process analysis for the initiation and movement of the Donghekou landslide-debris flow triggered by the Wenchuan earthquake. J. Asian Earth Sci. 76, 70–84. doi:10.1016/j.jseaes.2013.08.007
Keywords: rainstorm debris flow, numerical analysis, process of accumulation movement, numerical simulation, field investigation
Citation: Cai J, Huang W and Yang Q (2023) Detailed investigation and analysis of the dynamic evolutionary process of rainstorm debris flows in mountain settlements: a case study of Xiangbizui Gully. Front. Earth Sci. 11:1257440. doi: 10.3389/feart.2023.1257440
Received: 12 July 2023; Accepted: 30 October 2023;
Published: 27 December 2023.
Edited by:
Chong Xu, Ministry of Emergency Management, ChinaReviewed by:
Danqing Song, South China University of Technology, ChinaCopyright © 2023 Cai, Huang and Yang. This is an open-access article distributed under the terms of the Creative Commons Attribution License (CC BY). The use, distribution or reproduction in other forums is permitted, provided the original author(s) and the copyright owner(s) are credited and that the original publication in this journal is cited, in accordance with accepted academic practice. No use, distribution or reproduction is permitted which does not comply with these terms.
*Correspondence: Wenjie Huang, aHdlbmppZUBtYWlsLmNncy5nb3YuY24=
Disclaimer: All claims expressed in this article are solely those of the authors and do not necessarily represent those of their affiliated organizations, or those of the publisher, the editors and the reviewers. Any product that may be evaluated in this article or claim that may be made by its manufacturer is not guaranteed or endorsed by the publisher.
Research integrity at Frontiers
Learn more about the work of our research integrity team to safeguard the quality of each article we publish.