
95% of researchers rate our articles as excellent or good
Learn more about the work of our research integrity team to safeguard the quality of each article we publish.
Find out more
ORIGINAL RESEARCH article
Front. Earth Sci. , 19 October 2023
Sec. Volcanology
Volume 11 - 2023 | https://doi.org/10.3389/feart.2023.1254855
 J-L. Le Mouël1
 D. Gibert2
 V. Courtillot1
 S. Dumont3,4*
 J. de Bremond d'Ars5
 S. Petrosino6
 P. Zuddas7
 F. Lopes1
 J-B. Boulé8
 M. C. Neves9
 S. Custódio3
 G. Silveira3,10
 V. Kossobokov11L. Coen12M. Gèze13
The decryption of the temporal sequence of volcanic eruptions is a key step in better anticipating future events. Volcanic activity results from a complex interaction between internal and external processes, with time scales spanning multiple orders of magnitude. We review periodicities that have been detected or correlated with volcanic eruptions/phenomena and interpreted as resulting from external forces. Taking a global perspective and longer time scales than a few years, we approach this interaction by analyzing three time-series using singular spectral analysis: the global number of volcanic eruptions (NVE) between 1700 and 2022, the number of sunspots (ISSN), a proxy for solar activity, and polar motion (PM) and length of day (lod), two proxies for gravitational force. Several pseudo-periodicities are common to NVE and ISSN, in addition to the 11-year Schwabe cycle that has been reported in previous work, but NVE shares even more periodicities with PM. These quasi-periodic components range from −5 to −130 years. We interpret our analytical results in light of the Laplace’s paradigm and propose that, similarly to the movement of Earth’s rotation axis, global eruptive activity is modulated by commensurable orbital moments of the Jovian planets together with Pluto, whose influence is also detected in solar activity.
Volcanic eruptions represent the ultimate expression of a long series of physico-chemical processes initiated in the mantle with the generation of magma. Isotopic studies, mainly based on U-series, have shown that the formation, accumulation, and evolution of magma are processes that occur over long time scales, typically ranging from a few hundred years to a few millennia. On the other hand, magma transport, ascent to the surface, and other processes leading to eruption, as identified by geophysical and petro-geochemical studies, are much faster, occurring over days to decades (Cashman and Sparks, 2013, and associated references). Closely linked to plate tectonics and mantle dynamics, volcanic activity can also be seen as a response to changes in stress fields resulting from regional or global processes, such as large tectonic earthquakes or tidal effects from the Earth and oceans. Thus, volcanic eruptions reflect the internal dynamics of our planet, often acting as a “regulator” of accumulated stresses in the lithosphere over a wide range of time scales, from decades to centuries and beyond, as illustrated by rifting episodes along divergent plate margins (Björnsson, 1985) or the effect of variations in ice cap thickness on magma plumbing systems (Watt et al., 2013; Lucas et al., 2022). Deciphering the temporal pattern of volcanic activity is therefore crucial for assessing triggers of volcanic eruptions. This would not only help understand the dynamics of their internal plumbing system, but also unravel the interaction with potential external processes that may contribute to the destabilization of volcanoes on variable time scales (Dzurisin, 1980; McNutt and Beavan, 1987; Kutterolf et al., 2013; Watt et al., 2013; Canon-Tapia, 2014; Coussens et al., 2016; Watt, 2019; Seropian et al., 2021; Bilham et al., 2022; Dumont et al., 2022; Lucas et al., 2022). Furthermore, the recognition of specific temporal patterns in eruptive activity is a crucial objective in volcanology, as it would allow for anticipation of future events and thus better mitigation of volcanic hazards.
The coverage of volcanic eruptions has become increasingly systematic and comprehensive over the past two centuries (e.g., Simkin, 1993; Gusev, 2008). However, for most individual volcanic systems, only a few dozen events are recorded, making any statistical study of local structures at this timescale particularly challenging. Nevertheless, when considered collectively for regional or global analysis, volcanic eruptions can reveal specific spatial and temporal patterns that can ultimately be correlated and linked to global processes. This approach has already contributed to demonstrating that the spatial and temporal distribution of eruptive events can be related to sea level variations (e.g., Mason et al., 2004; Kutterolf et al., 2013). Recently, Dumont et al. (2022) showed that the major decadal periodicities present in both the global mean sea level and the monthly number of eruptions are also present in the movement of Earth’s rotation axis. This has led the authors to hypothesize that there could be a causative link between polar motion (i.e., movement of Earth’s rotation axis), a global process, and local events, i.e., volcanic eruptions occurring worldwide. The redistribution of fluid masses in the crust would act as the coupling link between these two processes; it would enable the transfer of stresses, a link already suggested at seasonal scale (e.g., McNutt and Beavan, 1987; Mason et al., 2004) and over several thousand years (e.g., Kutterolf et al., 2013; Kutterolf et al., 2019; Satow et al., 2021).
Some studies (some dating back over a century) have highlighted an apparent correlation between global, regional, and local volcanic activity and solar cycles (e.g., Lyons, 1899; Jensen, 1902; Stothers, 1989). Similar observations have been made for large earthquakes as well (e.g., Jensen, 1902; Mazzarella and Palumbo, 1988; Marchitelli et al., 2020). Furthermore, it appears that the occurrence of some of these major events, whether seismic or volcanic (such as the eruption of Pinatubo in 1991), is associated with specific planetary alignments (e.g., Greco and Krasnyy, 2021; Safronov, 2022). However, most of these correlations/associations between local geological phenomena and global processes such as solar activity or planetary alignment are widely debated (e.g., Akhoondzadeh and De Santis, 2022), primarily due to a major challenge: the lack of a credible physical mechanism (e.g., Jensen, 1902; Stothers, 1989; Marchitelli et al., 2020). How do these interactions work and why do only certain geological structures seem to be sensitive to such external influences?
In the following, we revisit these correlations between volcanic eruptions and global processes from a global perspective, in light of recent studies (Lopes et al., 2021a, Lopes et al., 2022a). We address the interaction between local eruptive phenomena occurring worldwide on planet Earth, i.e., the global number of volcanic eruptions (Global Volcanism Program, 2013), and global processes using a two-step approach. First, we analyze two time series: the global number of volcanic eruptions (NVE) and solar activity recorded by the international sunspot number (ISSN). Then, we perform a similar analysis/comparison with Earth’s polar motion (PM), considering that a link between the coordinates of the rotation pole, sea level variations, and global volcanic eruptions has already been introduced in Dumont et al. (2022). These analyses involve extracting, identifying, and comparing the common quasi-periodic components present in the different time series since 1700. This two-step procedure first allows us to assess whether volcanic eruptions on Earth are consistent with Laplace’s global theory, the main principles of which are summarized in Section 3; and second, to shed light on a possible common external force that could influence processes occurring in the Sun and in the Earth. In the latter case, the common external force could participate in the processes leading to volcanic eruptions and act as a trigger through a global mechanism of mass redistribution and stress. It is important to note that we do not hypothesize a solar force on volcanic activity, unlike a number of previous studies (e.g., Mazzarella and Palumbo, 1988; Mazzarella and Palumbo, 1989; Stothers, 1989; Strestik, 2003; Herdiwijaya et al., 2014; Vasilieva and Zharkova, 2020).
Periodic behaviors have been detected in short-term studies on volcanoes, using either physical parameters or recorded visual observations during phases of unrest, eruptions, and/or relative quiescence (Dumont et al., 2022 and references therein). Some of these periodicities correspond to those of terrestrial and oceanic tides and have been observed in various records, such as changes in eruptive behavior and explosion rates (e.g., Sottili and Palladino, 2012), seismic tremor (e.g., Custódio et al., 2003; Dumont et al., 2020; 2021; Petrosino and Dumont, 2022), seismicity (e.g., Petrosino et al., 2018), deformation (e.g., De Lauro et al., 2018), gas fluxes (e.g., Dinger et al., 2018; Dumont et al., 2021), and surface lava flow - radiated energy and emitted volume (e.g., Dumont et al., 2020; Dumont et al., 2021). These observations show that magmatic and hydrothermal fluids, as well as the volcanic structure, primarily respond to tidal forces with oscillatory behavior ranging from hours to months. However, so far, the available observations have been too scattered to deduce the main conditions that make a volcano more sensitive or capable of responding to lunisolar tides. Nevertheless, a critical state, open or fluid-rich systems represent the main characteristics of volcanoes for which tidal influence has been reported.
On longer timescales, the triggering of volcanic eruptions, typically considered through the eruptive history of individual volcanoes or analyzed in the context of global or regional catalogs, may also be influenced by lunar cycles, particularly the fortnightly cycle (Machado, 1960; Hamilton, 1973; Mauk and Johnston, 1973; Dzurisin, 1980). The signature of gravitational forces induced by the relative motion of the Moon and the Sun at these timescales is also present in global parameters recorded on Earth, such as polar motion (e.g., Chao et al., 2014; Le Mouël et al., 2019b) and local parameters that respond to global processes on Earth, such as the geomagnetic field (Courtillot and Le Mouël, 1988), atmospheric pressure and sea level (Wunsch, 1972; Chelton and Enfield, 1986; Lambeck, 2005), or tectonic plate motion (Zaccagnino et al., 2020; Nesi et al., 2023).
Seasonal variations correspond to oscillations that occur over a year or half a year. They are associated with the Earth’s revolution around the Sun. Seasonal variations have been observed in eruptive sequences, both at the level of individual volcanoes and regionally (McNutt and Beavan, 1987; Mason et al., 2004). Their correlation with sea level variations has led to the interpretation that some volcanic eruptions are the result of redistribution of oceanic mass. The influence of the Sun (through variations in sunspot numbers) on eruptive activity has also been suggested over longer timescales. Some eruptive events or episodes seem to occur during phases of solar minimum or maximum activity, with cycles mainly of −11 years and −22 years, but also of −80 years and more (Lyons, 1899; Jensen, 1902; Machado, 1960; Schneider and Mass, 1975; Stothers, 1989; Strestik, 2003; Khain and Khalilov, 2009; Qu et al., 2011; Casati, 2014; Herdiwijaya et al., 2014; Ma et al., 2018; Vasilieva and Zharkova, 2020; Dumont et al., 2022). Similarly to short-term timescales and tidal periodicities, these multi-annual to centennial variations are present in other geophysical parameters. Most of them record both tidal and solar periodicities, as illustrated by the magnetic field (e.g., Bartels, 1932; Le Mouël, 1984; Courtillot and Le Mouël, 1988; Jault, 1990; Le Mouël et al., 2019), polar motion (Lopes et al., 2017; Lopes et al., 2021a; Lopes et al., 2022a), sea level observed from local and global data (e.g., Chambers et al., 2012; Wahl and Chambers, 2015; Le Mouël et al., 2021a; Courtillot et al., 2022a), global surface air temperatures (e.g., Courtillot et al., 2013; Le Mouël et al., 2020b; Scafetta, 2021), and more generally, climate (e.g., Wood and Lovett, 1974; Schlesinger and Ramankutty, 1994; Scafetta, 2010; Courtillot et al., 2013; Scafetta, 2016; Le Mouël et al., 2019c; Le Mouël et al., 2021b). Moreover, these links also seem to exist 1) on much longer timescales of millennia, governed by astronomical configurations and impacting climate and sedimentation (e.g., Milanković, 1920; Kutterolf et al., 2013; Coussens et al., 2016; Kutterolf et al., 2019; Lopes et al., 2021b; Satow et al., 2021); and 2) also for earthquakes, as suggested by numerous studies (e.g., Tamrazyan, 1968; Mazzarella and Palumbo, 1988; Marchitelli et al., 2020).
In this section, we sought to highlight the fact that among the many geophysical observables associated with the various processes occurring on and within the Earth (see also Lopes et al., 2021a), volcanic phenomena are no exception. Although still poorly understood, volcanic phenomena are influenced by periodicities across a wide range of time scales, as is the case for many other geophysical observables measured on Earth, as suggested by various methodologies - computational approach (e.g., Le Mouël, 1984; Jault and Le Mouël, 1991), statistical (e.g., Mason et al., 2004), spectral analysis (e.g., Scafetta, 2010), or decomposition approach (e.g., Lopes et al., 2017; Le Mouël et al., 2019b). This first-order analogy between the periodic components detected in volcano-related parameters and other geophysical parameters only pertains to the observations of these periodicities and not the interpretations drawn from them. In fact, although luni-solar gravitational forces and solar activity have both been considered as external forcings acting on the dynamics of our planet and particularly its fluid envelopes, the way they interact is still debated, as we will see in the next section.
In his treatise on celestial mechanics, Laplace (1799) asserted that all masses on the surface and interior of the Earth are influenced by orbital moments, also known as angular moments, generated not only by the Moon and the Sun, but also by other celestial bodies present in the solar system. The same applies to the complete motion of the Earth’s rotation axis. This theory has been revisited and validated in light of recent analyses based on time series data spanning approximately 300 years of the Earth’s rotation axis motion (cf. Lopes et al., 2021a; Lopes et al., 2022a; Lopes et al., 2022c). This recent theory contradicts the currently most accepted theory (e.g., Lambeck, 2005), which attributes a key role to atmospheric dynamics (Brzeziński et al., 2002). In this latter theory, seasonal oscillations present in many datasets, including polar motion (e.g., Lambeck, 2005; Le Mouël et al., 2021a; Courtillot et al., 2022b; Lopes et al., 2022b), have generally been considered in terms of angular momentum and interpreted as resulting from mass redistribution of the atmosphere on the rotating Earth. This current theory has not yet been quantitatively validated (see Lambeck (2005), introduction of chapter 7). Both of these theories can be considered as a transfer of energy from an undefined energy source to the fluid and solid envelopes of the Earth, as described by the Liouville-Euler equations system (cf. Eq. 1; Lambeck (2005), chapter 3). The direct implication of this description is that any changes in the motions of the Earth’s rotation axis and the length of day (lod) inevitably lead to a reorganization of mass on the surface and interior of the Earth, and thus a redistribution of stresses on the Earth’s surface.
In the system of Liouville-Euler equations (relation 1), j represents the complex number such
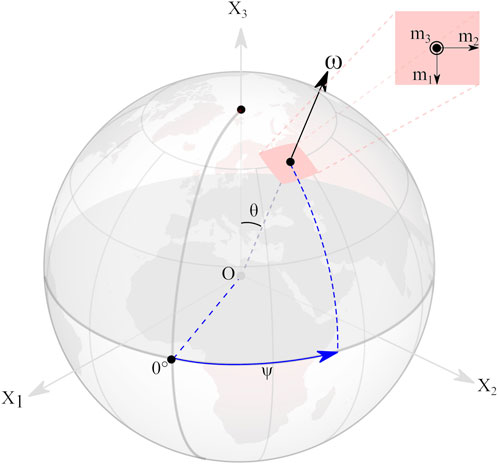
FIGURE 1. Geophysical reference system used for describing the system of Liouville-Euler equations (see relation 1 in main text). In the terrestrial reference frame associated with the (X1, X2, X3) axes, the rotation of the pole ω can be described as a function of the inclination (θ) and declination (ψ) of the rotation axis and the apparent position of the pole at the surface of the Earth given by the components m1, m2 and m3. The components m1 and m2 are defined with respect to Greenwich (0°) and 90°E meridians. Figure from Lopes et al. (2022a).
This is about identifying common periodic components present in the various envelopes of the Earth that enable the evaluation of these two theories. These periodicities can be divided into two main categories. First, periodicities shorter than 1 year (except for lunar nutation which has a period of 18.6 years). These periods have been attributed to tides induced by luni-solar gravitational forces. Second, periodicities longer than 1 year. The most frequently detected periods in this group are approximately 11, 22, 30, 90, and 160 years, many of which are common to solar physics (e.g., Milanković, 1920; Gleissberg, 1939; Gleissberg, 1944; Jose, 1965; Coles et al., 1980; Courtillot and Le Mouël, 1988; Charvátová and Střeštík, 1991; Frick et al., 1997; Le Mouël et al., 2017; Usoskin, 2017; Le Mouël et al., 2020a; Courtillot et al., 2021). In particular, they have been associated with the Schwabe, Hale, an unnamed 30-year cycle linked to Saturn, Gleissberg, and José solar cycles, respectively (cf. Schwabe, 1844; Hale et al., 1919; Gleissberg, 1939; Jose, 1965).
Mörth and Schlamminger (1979) show that these different solar cycles can also be recognized in the orbital motions (specifically, the orbital moments) of pairs and groups of pairs of the four Jovian planets together with Pluto, a dwarf planet; results that have been confirmed by several recent studies (e.g., Bank and Scafetta, 2022; Lopes et al., 2022c).
Let us explore this idea by first considering the Sun. Located at the center of the solar system, it directly exerts on all planets of the solar system the strongest gravitational attraction, yet it does not carry any orbital momentum. According to the law of action-reaction in a Galilean referential, we can convert dimensionally the value of Earth’s force of attraction exerted by the Sun (F = 3.57*1022 kg m s−2) into an angular momentum (F*Sun-Earth distance*Earth’s revolution period), which corresponds to the angular momentum exerted by the Sun on the Earth, and which is of 1.68*1041 kg m2 s−1. This value is smaller by 1–3 orders of magnitude than that of the Jovian planets which are of 1.93*1043 kg m2 s−1 for Jupiter (revolution: ∼11 years), 7.82*1042 kg m2 s−1 for Saturn (revolution: −30 years), 1.69*1042 kg m2 s−1 for Uranus (revolution −90 years) and 2.50*1042 kg m2 s−1 for Neptune (revolution: −165 years). Mörth and Schlamminger (1979) studied this physical quantity through the “commensurability” of different pairs and groupings of planet pairs that make up our solar system. This quantity, which should be rational, represents the ratio of the average orbital period of one or more pairs of planets. It highlights their ability to transmit energy through angular momentum and is associated with periodicities, expressing specific orbital configurations, such as alignment or quadrature. For example, the neighboring pair of planets Jupiter and Saturn induces periodic variations in planetary angular moments of about 12, 29, 18, and 41 years, and the Uranus-Neptune pair induces variations of about 84, 165, 81, and 250 years. These pairs can be grouped together to obtain another set of periodicities, and so on (see Mörth and Schlamminger, 1979; Lopes et al., 2021a; Courtillot et al., 2021). Thus, a 270-year oscillation can be associated with the Uranus-Neptune pair, the Jose cycle (cf. Jose, 1965) with Uranus, the 30-year cycle (unnamed, Usoskin, 2017) with Saturn, the Hale cycle (cf. Hale et al., 1919) with the Jupiter-Saturn pair, and finally, the famous Schwabe cycle (cf. Schwabe, 1944) with Jupiter. Hence, these Jovian planets and their combinations act through their angular momentum on the solar spots of our star, as illustrated by Courtillot et al. (2021) who used these results to predict the upcoming solar cycle. These commensurabilities result in closely grouped periodicities (cf. Le Mouël et al., 2020a), explaining in particular the variations of the Schwabe cycle between 9 and 14 years since 1700, with an average of 10.8 years. These orbital moments act as an external force on the Sun, and possibly on the Earth itself, and on volcanic activity in particular, as we will examine in this article.
First, we analyze the datasets of global volcanic eruptions and solar sunspot activity. This link has been studied extensively in the literature, leading to the assumption of a causality relationship between the two phenomena (e.g., Stothers, 1989; Strestik, 2003; Herdiwijaya et al., 2014; Vasilieva and Zharkova, 2020). Similar studies conducted with other datasets, such as polar movements, have instead concluded common influence (see Lopes et al., 2021a; Lopes et al., 2021b; Courtillot et al., 2021; Lopes et al., 2022c). By jointly analyzing global volcanic eruptions and solar sunspots and proceeding step by step, we aim to better understand this interaction. To do so, we focus on a time interval of 322 years from January 1700 to February 2022, which begins with the start of the time series of the ISSN.
The catalog of volcanic eruptions (Global Volcanism Program, 2013) lists 5829 events over the time span of interest. It includes a majority (55%) of moderately explosive events associated with a Volcanic Explosivity Index (VEI) of 2 (see Newhall and Self, 1982), 28% of effusive eruptions (0 ≤ VEI ≤1), 14% of moderate to cataclysmic eruptions (VEI ≥3), and 3% of unknown VEI. While these estimates provide general information on volcanic phenomena between 1700 and 2022, we did not consider them to calculate the number of volcanic eruptions per year. In reality, we considered each of these events as an expression of a disruption of the magmatic system balance at a specific location on Earth and at a specific time. These worldwide volcanic eruptions can also be considered as a kind of global parameter highlighting the dynamics of our planet, which is consistent with our global-scale approach. Moreover, the respective analyses of “events with VEI ≥2″and “all events” conducted in Dumont et al. (2022) have led to the detection of similar decadal periodicities.
We have taken into account a time interval for which the catalog of volcanic eruptions is only partially complete, which is a critical aspect that must be considered. It is estimated that for VEI ≥3, the GVP catalog is complete since 1960, and for VEI ≥4, since 1820 (cf. Gusev, 2008). As highlighted by various studies (e.g., Guttorp and Thompson, 1991; Simkin, 1993; Gusev, 2008; Gusev, 2014), a significant increase in the number of volcanic eruptions appears in the second half of the 18th century (Figure 2A), resulting in a general upward trend (Figure 5A). This trend is mainly related to a more systematic reporting of eruptive events worldwide rather than a real increase in global volcanic activity (Simkin, 1993). Furthermore, it reverses around the year 2000 (Figures 2A, 5A), suggesting that 1) over the past 2 decades, the catalog of global volcanic eruptions is likely to be nearly complete, and 2) this global eruptive activity may not be associated with a stationary process, as generally assumed (e.g., Gusev, 2008; Marzocchi and Bebbington, 2012; Gusev, 2014). In this study, we will focus on the oscillations composing the time series.
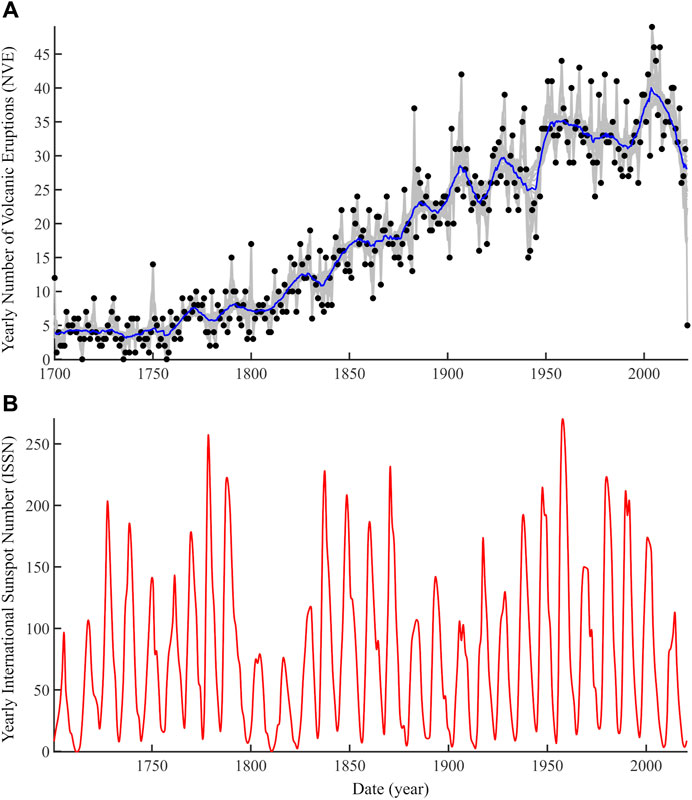
FIGURE 2. Number of worldwide volcanic eruptions (NVE) (A) and international sunspot number (ISSN) (B) spanning 1700–2022. (A) The black dots represent the number of worldwide volcanic eruptions per year, connected by the gray curves representing the bootstrapped series, the blue curve representing their median. (B) Temporal evolution of the yearly number of sunspots since 1700.
We used the bootstrap technique (cf. Efron and Tibshirani, 1994) to construct what we consider as the most representative temporal evolution of volcanic activity over the past 322 years. A thousand iterations were performed to randomly sample the annual number of eruptions listed in the catalog, thus avoiding biases that could be introduced by a time window using a moving average. The various sub-samples range from a minimum of 2 years to a maximum of 40 years and define a family of curves, with the median curve presented in Figure 2A. In this study, we considered the median curve as the reference for these temporal variations and will refer to it as NVE.
The ISSN has been measured for more than three centuries to monitor solar activity, with the first yearly records going back to 1700. We used the yearly mean total sunspot number (Figure 2B) from the World Data Center SILSO, Royal Observatory of Belgium, Brussels (http://www.sidc.be/silso/datafiles).
The time series of ISSN and NVE were analyzed using iterative Singular Spectrum Analysis (iSSA). For more details on the SSA method, you can refer to Golyandina and Zhigljavsky (2013). For the properties of Hankel and Toeplitz matrices, you can consult Lemmerling and Van Huffel (2001), and for the Singular Value Decomposition (SVD) algorithm, you can refer to Golub and Reinsch (1971). The periodicity of each component identified by iSSA is then evaluated using the Fourier transform, with uncertainties given by the full width at half maximum of the peak. In the following text, we prefer to use the term “pseudo-period” to emphasize that these oscillations are not pure oscillatory signals.
We also provide a comparison of the 22-year solar cycle extracted by iSSA and by continuous wavelet transform analysis (cf. Gibert et al., 1998), a widely used technique in the analysis of solar spot time series (e.g., Frick et al., 1997). We considered a Morse wavelet which is particularly well-suited for signals with variable spectra (cf. Olhede and Walden, 2002; Lilly and Olhede, 2012). The scalogram of NVE is shown in Figure 3A. We perform the comparison between the two techniques for the 22-year period which represents an important component in the NVE time series (Figure 3). Based on the redundancy of information of the wavelet kernels, it is possible to extract the peak corresponding to a specific periodicity within the time scale of interest to reconstruct the ad hoc signal (cf. Gibert et al., 1998). The difficulty in applying such an approach lies in the spreading of energy over multiple time scales, as illustrated in the 22-year period in Figure 3A. This effect can be reduced using a reassignment method (e.g., Auger and Flandrin, 1995) to optimize the reconstruction of the period of interest. This would require an additional processing step that we have not implemented in the context of this comparison. In our case, we relied solely on the inverse wavelet transform to reconstruct the pseudo-oscillation corresponding to the peak’s maximum energy.
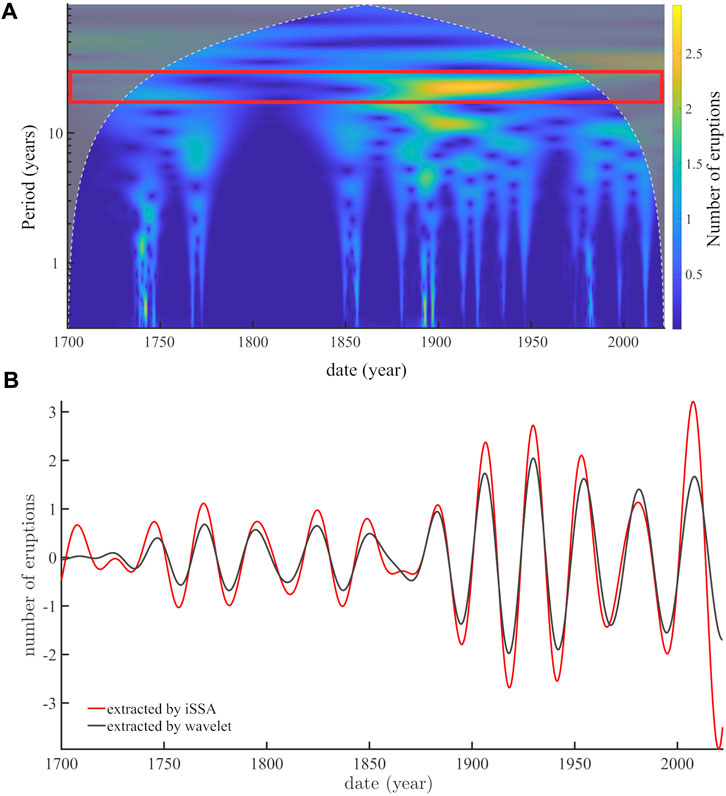
FIGURE 3. Extraction of pseudo-oscillations in the NVE time-series: comparison between the continuous wavelet transform and iterative SSA with the example of the 22-year cycle. (A) Scalogram associated with the NVE curve spanning 1700 to 2022. The gray area bordered by the white dashed curve delineates the no-definition sector of the wavelet transform. The red rectangle points out the wavelet coefficients for the 22-year period and illustrates the non-stationary of the signal whose energy is spread over different scales (see text for more details).(B) The 22-year pseudo-cycle extracted by iSSA (red curve) and the same cycle extracted by continuous wavelet transform (black). The latter corresponds to the wavelet scales boxed in (A).
The application of iSSA to the NVE time series has allowed us to directly extract various pseudo-cycles, including the one identified with the Scalogram and centered around 22 years. The resulting component is shown in Figure 3B and overlaid with the one obtained from continuous wavelet analysis. This figure reveals excellent agreement for the pseud-oscillations extracted by both techniques, iSSA and continuous wavelet transform, confirming the reliability of the results obtained by iSSA (which is not only faster and easier to implement, but also more precise than wavelet analysis).
Similarly as for Figure 3, our approach consists of comparing waveforms extracted in various time-series such as NVE and ISSN, which exhibit very similar pseudo-periods, while taking into account their associated uncertainties. This method is comparable to some algorithms used in the “matching pattern” (Keogh et al., 2001; Keogh and Ratanamahatana, 2005) in which the similarity of two data series is evaluated by comparing their Fourier spectra. While establishing a causal link between two signals requires more than just similarity, it is an essential first step toward exploring their connection. This is the approach we have taken in the present study.
We have identified thirteen components in the NVE time series using iSSA. These correspond to the first thirty-five components of the original time series. In addition to the trend, twelve periodic components with durations ranging from 4.91 ± 0.05 to 132.32 ± 37.57 years have been identified (Table 1). They account for a total variance of 77.4% of the NVE curve, allowing for the reconstruction of most of its variations (Figure 4A). Similarly, we analyzed the ISSN time series and found seven pseudo-periods ranging from 8.4 ± 0.2 to 90.9 ± 17.5 years, in addition to the trend, using the first fifteen components (Table 1). They account for 79.5% of the total variance (Figure 4B), as previously shown in the works of Le Mouël et al. (2017), Le Mouël et al. (2020a) and Courtillot et al. (2021). Among these seven periodic components, four are common to those extracted from NVE. The four common periodicities are all less than 30 years, with periods of approximately 9, 11, 13, and 27 years (Table 1 and Figure 5).
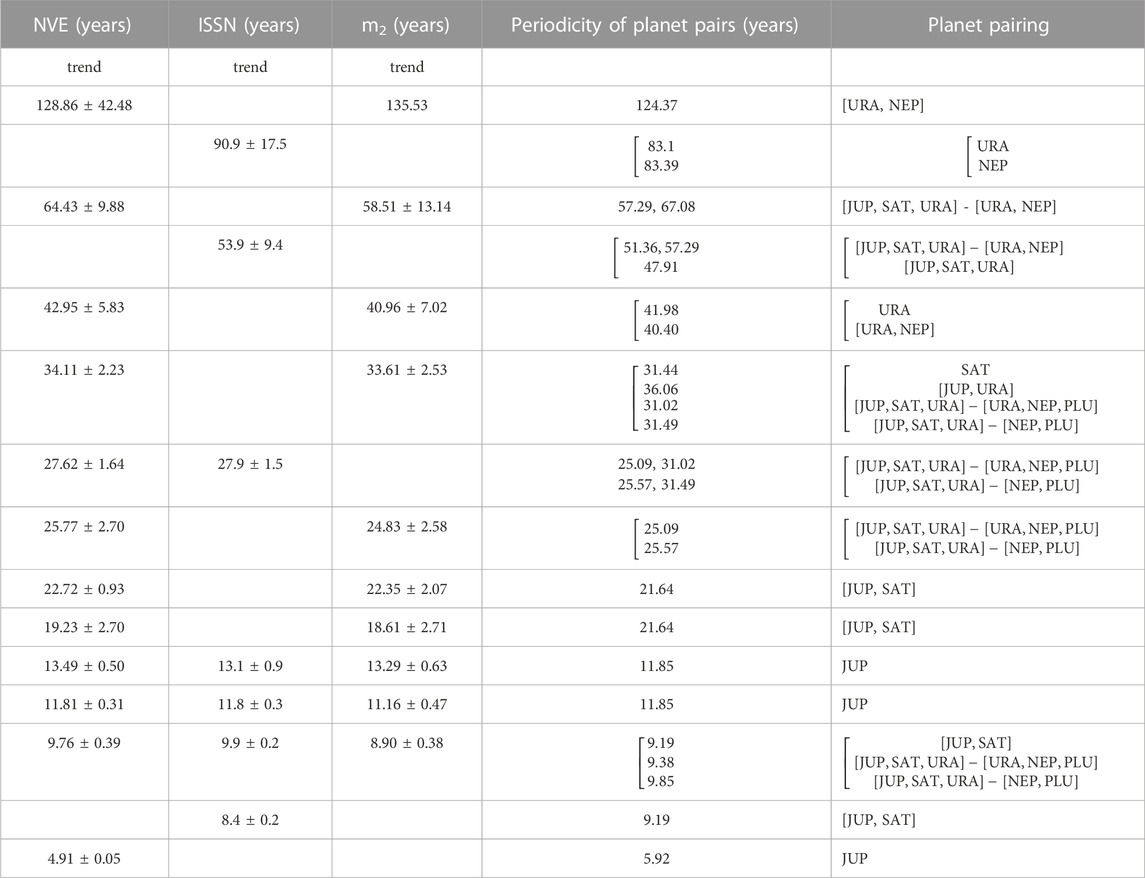
TABLE 1. List of common periodicities extracted from the time-series of NVE, ISSN and m2 component of the PM, using iSSA for the 1700-2022 time interval. All periodicities in the NVE are also present in the m2 time-series, except that of ∼27 and ∼5 years. The last two columns indicate the combination of planet pairing and the associated periodicities as reported in Courtillot et al., (2021) and Lopes et al., (2021a), Lopes et al., (2021b). The planets are listed as follows: JUP for Jupiter, NEP for Neptune, PLU for Pluto, SAT for Saturn, URA for Uranus. The brackets separate different pairing.
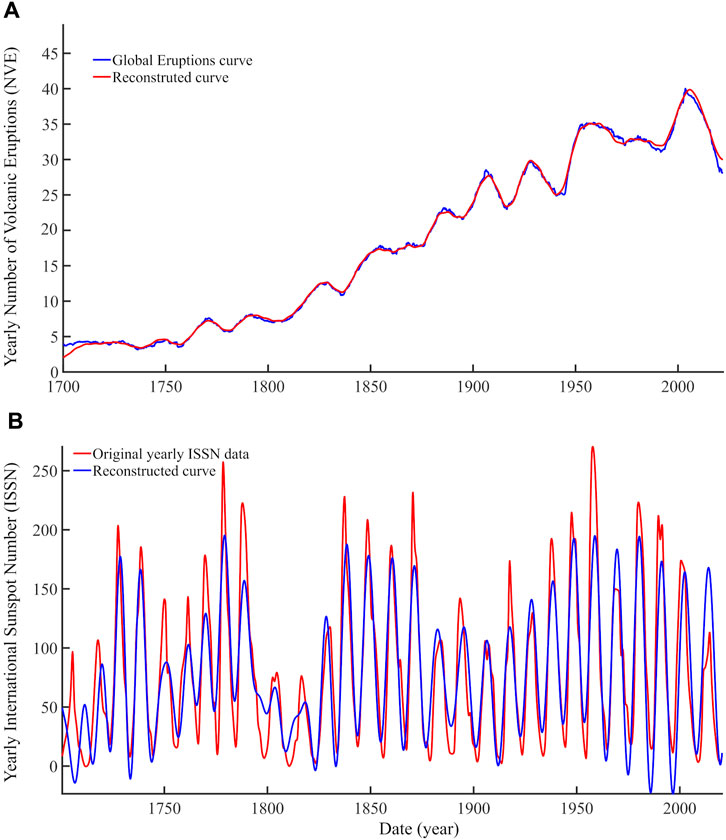
FIGURE 4. Original and Reconstructed time-series of NVE (A) and ISSN (B). (A) The NVE curve is represented by the median of bootstrapped series (blue curve aforementioned as original time-series) and its reconstruction (red curve). (B) The original ISSN time-series is shown in red and its reconstruction in blue. See text for more details.
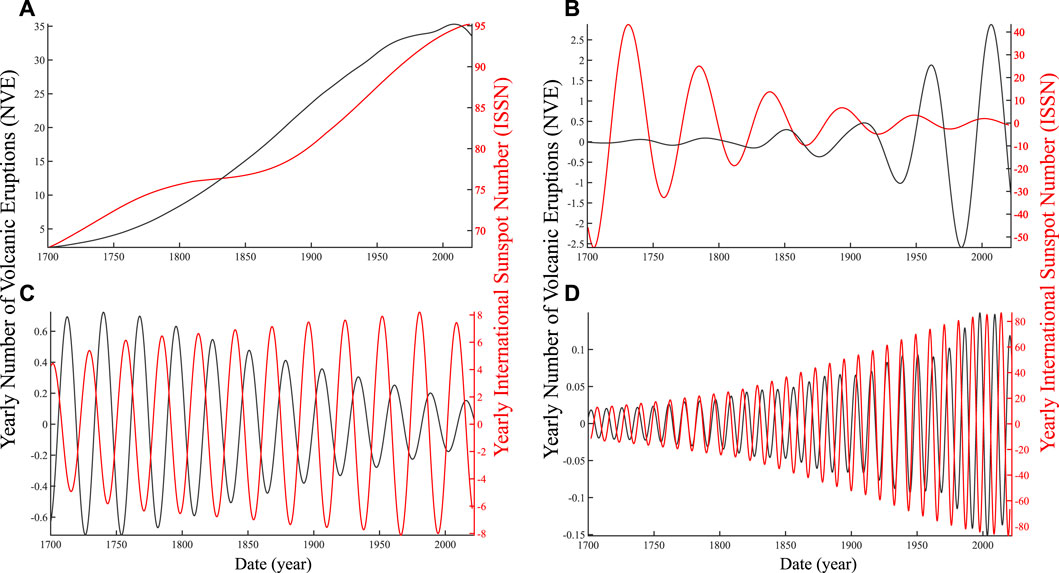
FIGURE 5. Trends and some quasi-periodic components present in both the NVE (black) and ISSN (red) extracted using iSSA. (A) The trends of the NVE and ISSN time-series, (B) the ∼50–60-year, (C) the ∼27-year and (D) the ∼11-year pseudo-periodic components.
We now present some of the common pseudo-cycles found in NVE and ISSN time series. First, trends extracted from NVE and ISSN time series show a monotonous increase from 1700 to −2000 for both datasets, followed by a plateau starting from 2000 (Figure 5A). Although their uncertainties are about 10 years (Table 1), the amplitude modulations of the approximately 60-year and 50-year cycles extracted from NVE and ISSN data are clearly different: while the amplitude of the approximately 50-year component of the solar cycle decreases over time, the amplitude of the approximately 60-year component of NVE increases (Figure 5B). This approximately 60-year cycle is well known in climate studies (e.g., Scafetta, 2010; Mazzarella and Scafetta, 2012; Courtillot et al., 2013).
In Figure 5D, the well-known 11-year solar cycle, also known as the Schwabe cycle (cf. Schwabe, 1844), shows an increase in amplitude in both time series. This similar behavior of amplitudes is accompanied by phases that occasionally synchronize, such as between 1760 and 1800 or between 1910 and 1950. Finally, we illustrate the pseudo-oscillations of 27 years extracted by iSSA from the NVE and ISSN time series (Figure 5C). The amplitude variations for both time series do not show a clear correlation as in the cases of approximately 50–60 years cycles and 11-year cycles.
These common periodicities could explain the numerous correlations obtained between solar and volcanic activity that are discussed in the literature (e.g., Lyons, 1899; Jensen, 1902; Schneider and Mass, 1975; Mazzarella and Palumbo, 1988; 1989; Stothers, 1989; Strestik, 2003; Herdiwijaya et al., 2014; Vasilieva and Zharkova, 2020). We have found that several periodicities are common to the NVE and ISSN time series, suggesting a possible link between the two. However, this relationship varies from one cycle to another and evolves over time. This is illustrated with the approximately 50–60 years cycle (Figure 5B) whose amplitude evolves in opposite directions for the components extracted from the NVE and ISSN, or with the 11-year cycle, whose modulation evolves similarly but whose phase apparently synchronizes every −150 years (Figure 5D). Considering that not all the pseudo-cycles detected in the NVE are present in solar activity (Table 1) and that the common periodicities have also been detected in other geophysical measurements (e.g., Schlesinger and Ramankutty, 1994; Scafetta, 2016; Lopes et al., 2017; Le Mouël et al., 2019; Le Mouël et al., 2020a; Le Mouël et al., 2020b), we hypothesize that a single common external forcing could explain both the different and common oscillations of these two parameters, NVE and ISSN, whose physics are completely different (e.g., Bank and Scafetta, 2022; Lopes et al., 2022c).
In Laplace’s theory (Laplace, 1799), it is clearly stated that celestial bodies comprising our solar system carry energy that is transferred through exchanges of angular momentum to the Sun and to the Earth’s rotation axis. In this section, we examine the periods present in the polar motion (PM) that have already been extracted by Lopes et al. (2021a), as well as detected in the length of day (lod) by Le Mouël et al. (2019b). With the exception of the free Chandler oscillation (−1.19 years) and the annual forced oscillation (1 year), all the periods detected in the variation of day length are also present in the polar motion (Lopes et al., 2022a). The periods of 1.0 years and −1.19 years cannot be detected in the variation of day length because annual sampling has been used. This does not question their existence; for example, the annual component has already been suggested in the analysis of regional volcanic activity (e.g., Mason et al., 2004).
Now let’s look at the common periodicities extracted from the variation of day length and polar motion, specifically in the E-W component of polar motion called m2 (Figure 6A). Although this component varies very similarly to component m1 (the N-S component), it shows the largest variations of the two polar motion coordinates, which is why we chose to focus on this component. The time series of polar motion starts in 1846, and we present the components extracted by iSSA for the variation of day length and polar motion over the past 176 years, as well as the evolution of their phase lag over time (Figures 7 and 8). We have also considered day length to complement some observations. Since day length is measured by satellites, this time series is much shorter than the others, starting only in 1962 (Figure 6B). Therefore, the comparison between the components of day length variation and day length will be presented over the last 60 years. We draw the reader’s attention to the inversion of the axis representing the component in Figures 7B–E and 8. Positive values of m2 indicate an east-west direction, a sign convention that has no physical significance. The inversion of the axis of the components allows for a better evaluation of the different correlations. In the following, we present the pseudo-periodicities extracted in decreasing order.
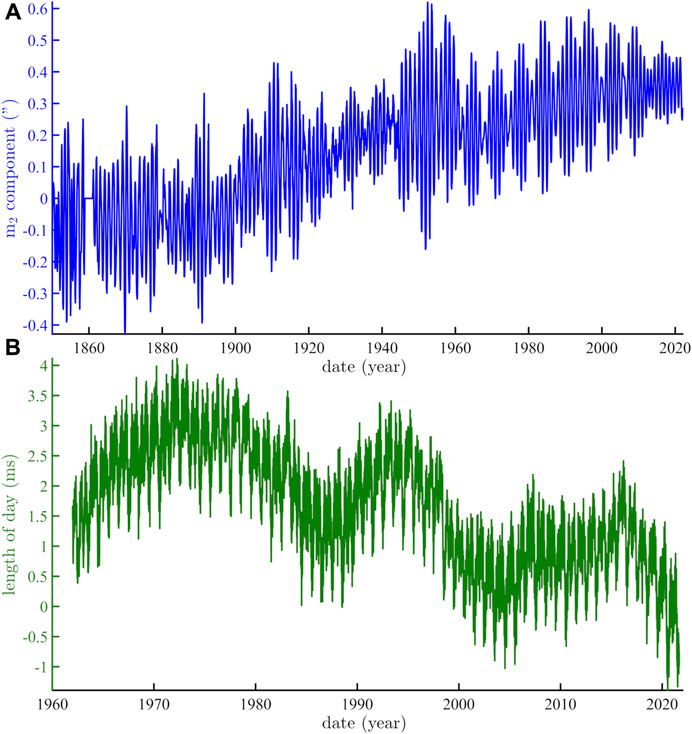
FIGURE 6. Temporal evolution of the m2 component of PM since 1846 (A) and the lod since 1962 (B).
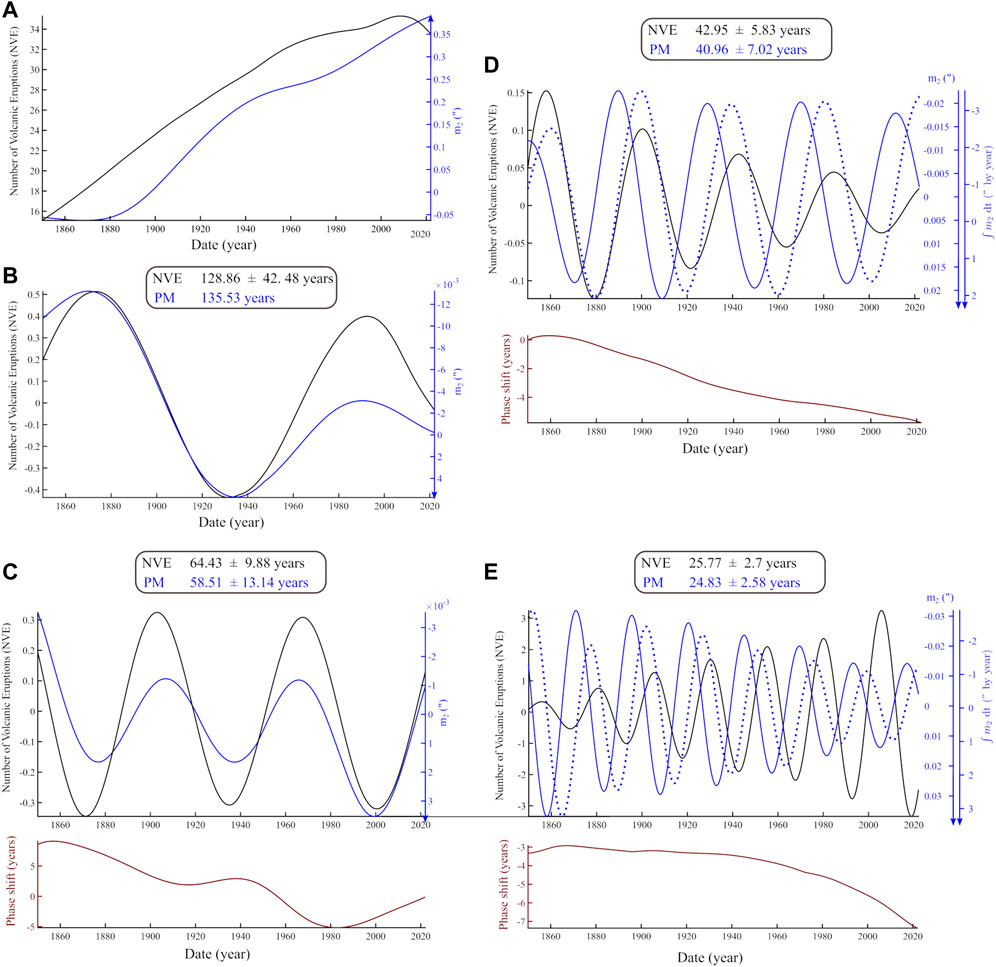
FIGURE 7. Examples of some common periodicities extracted in the NVE (black curve) and m2 component of the PM (blue curve, from Lopes et al., 2021a) using iSSA with (A) the trends, (B) the ∼130–140 years, (C) ∼60-year, (D) ∼40-year, and (E) the ∼25-year pseudo-cycles. For some periodicities (D–E), the integral of m2 over time is also represented by a blue dotted curve. For each periodicity, the phase shift between NVE and m2 component (A–C) or between NVE and the integral of m2 over time (D–E) was calculated and reported in years over the time interval considered.
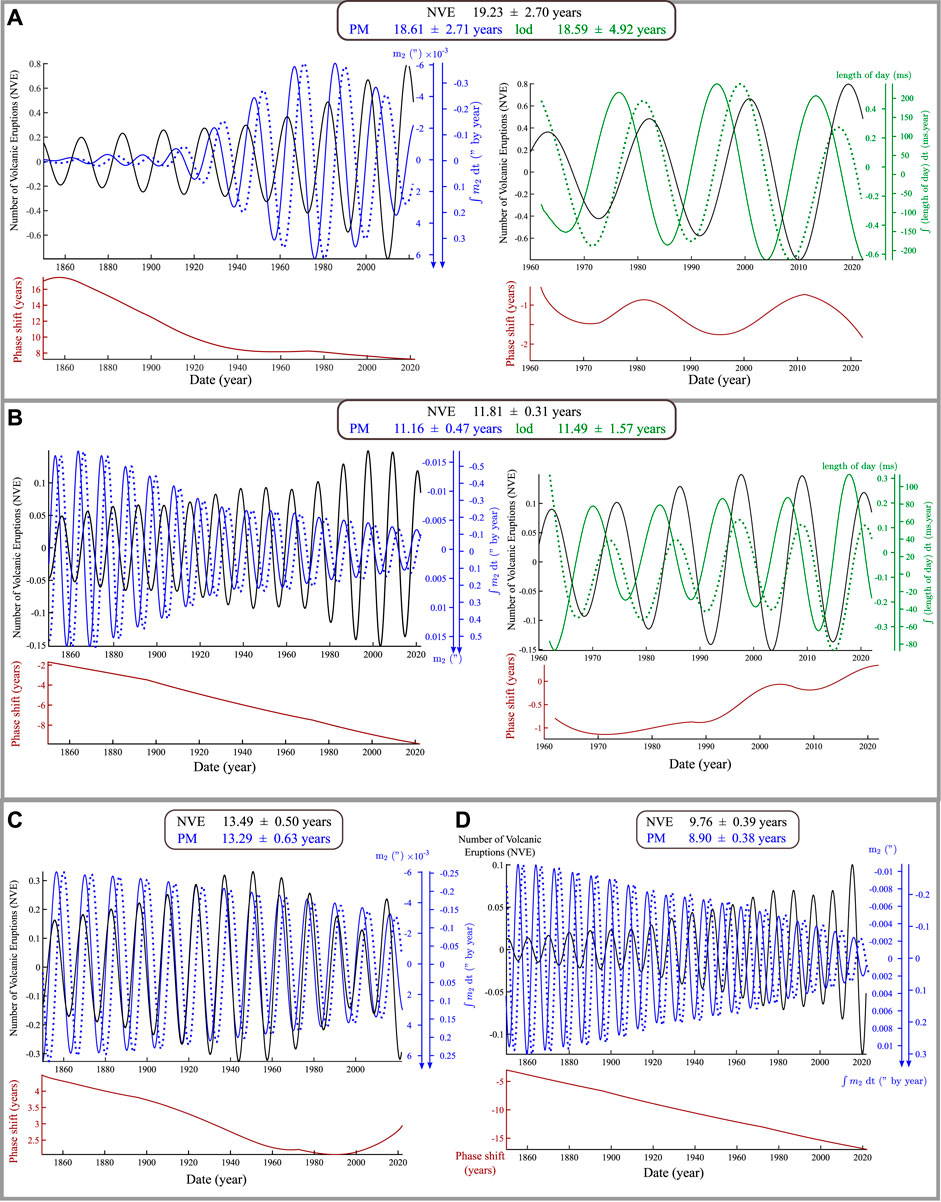
FIGURE 8. Examples of some common periodicities extracted in the NVE (black curve) and m2 component of the PM (blue curve, from Lopes et al., 2021a) using iSSA with (A) the ∼19-year, (B) the ∼11-year, (C) the ∼13-year and (D) the ∼9-year pseudo-cycles. For each periodicity, the integral of m2 over time is also represented by a blue dotted curve and, the phase shift between NVE and the integral of m2 over time was calculated and reported in years over the time interval considered. For the ∼19 and ∼11-year pseudo-cycles, the NVE components was similarly represented but together with that of the lod and its integral over time (green full and dotted lines, respectively).
As observed in Figure 7A, the two trends extracted from the NVE and PM data show an overall increase over the 176-year interval, although the PM trend begins after a low plateau that ends around 1880. Figure 7B represents a cycle centered around ∼130–140 years, with a period of 128.86 years ±42.48 years for NVE and 135.53 years for the m2 component. It should be noted that there are no uncertainties provided for the PM period (Table 1). This is due to the relatively short time interval considered for the time series analysis, which is not sufficient to capture such a long component. Considering the uncertainty in the NVE data, which is approximately 40 years, it can be suggested that this period corresponds to a cycle of approximately 160 years (cf. Jose, 1965). Figure 7B shows that these two components, NVE and m2, are in phase, and although only two oscillations are observed for 1846–2022, their amplitudes evolve similarly, decreasing over time.
A cycle of approximately 60 years has also been extracted, centered at 64.43 ± 9.88 years for NVE and 58.51 ± 13.14 years for (Figure 7C). As for the cycle of approximately 130–140 years, this cycle for the NVE and PM components is also highly correlated. For this pseudo-cycle and subsequent ones, we calculated the instantaneous phase shift using the phase differences between the Hilbert transforms of NVE and m2. The phase shift for the components of about 60 years varies smoothly, averaging about 1 year. Such a phase shift is small compared to the pseudo-cycle of about 60 years to which it is associated, indicating that this component for NVE and m2 can be considered in phase. In Figure 7D, we show a pseudo-cycle of about 40 years extracted in both NVE and m2, approximately 42.95 ± 5.83 years and 40.96 ± 7.02 years, respectively. The phase correlation appears clearer when it is integrated over time, a transformation for which we will provide further explanations later in this section. We also calculated the continuous phase shift and obtained an average value of about 2 years between these two components, confirming that NVE and the integrated component of m2 are in phase for the considered time interval. The time series of NVE and m2 include a component of about 25 years whose amplitudes vary in opposite directions (Table 1 and Figure 7E). As for the periodicity of about 40 years, we considered the integral of the component on time to compare it with NVE. Thus, the approximately 25-year component of NVE is shifted by about 3.5 years in 1846, a phase shift that is relatively stable until around 1960 and is in the order of quadrature for the 25-year cycle. This suggests that these two pseudo-cycles are mainly linked by a phase quadrature, which represents a special characteristic that we will explain later in this section.
In Figure 8A (left), we present the pseudo-cycle of approximately 19 years with a period estimated at 19.23 ± 2.70 years for NVE and m2 18.61 ± 2.71 years for the component. The amplitude of both components is characterized by a strong increase since 1846, with the increase being more pronounced for the PM component, which has almost zero amplitude until 1900. This cycle is well known and corresponds to the large lunar nutation. As for the approximately 25-year cycle, the phase lag is much larger than the uncertainties on the extracted pseudo-cycle, resulting in evolving phase lags within the considered time interval. Moreover, this lunar periodicity is also detected in the length of day (lod), as shown in Figure 8A (right), although the lod time series is much shorter, starting in 1962. By proceeding similarly to what we have done for the previous periodicities, but this time for the lod, we show that the phase lag between NVE and the integral of the lod over time is small and relatively stable over time, averaging about 1 year. This suggests that NVE and the integral of the lod over time are almost in phase. With a similar approach for the approximately 11-year periodicity (Figure 8B and Table 1), we observe that the amplitudes of NVE and the m2 component vary inversely, and their phase lag increases steadily over time (Figure 7G, left). This component was also extracted from the lod, with a period of 11.49 ± 1.57 years. Thus, NVE and the integral of the lod over time are clearly in phase, as shown by the small variations in the phase lag over the time interval from 1962 to 2022 (Figure 8B, right).
Finally, pseudo-cycles of approximately 13 and 9 years (Figures 8C,D and Table 1) are shown for NVE and for the m2 component as well as its time integral. For the pseudo-cycle of approximately 13 years, NVE and m2 are in phase, while NVE and the integral of m2 are in quadrature phase. Their phase lag decreases mainly from 1846 to around 2000, while that of the approximately 9-year periodicity increases. Moreover, this phase lag, being much larger (>20 times) than the uncertainties of the extracted periodicity, it results in an evolving phase shift between the NVE component and m2.
In Figures 7 and 8, we conducted comparative analyses of the extracted periodic components in the NVE, the E-W coordinate of the polar motion (PM) and the length of day (lod), which represents the rotational component of PM, for two periodicities. We completed this comparison by including the time integral of PM and lod, whose phase relationships with NVE appear clearer in certain cases. This approach stems from the Louville-Euler equations (Eq. 1). In reality, PM, lod (related to polar motion variations), and the excitation functions, which are part of mass and stress redistribution, are connected by temporal derivatives. As stated by Laplace (1799), demonstrated again by Lopes et al. (2021a), Lopes et al. (2022a), and explained in more details by a mechanism proposed by Lopes et al. (2022c), the lod represents the temporal derivative of polar motion. The latter is modulated by exchanges of moments of inertia with other planets in the solar system in a similar way to how the weight of a spinning top interferes with its rotation (Lagrange, 1788). Thus, the stresses resulting from these interactions correspond to the time integral of polar motion, resulting in a quadrature phase relationship, similar to a differentiation link, explaining why we integrated PM and lod over time in Figures 7 and 8.
The analysis of volcanic activity over the past 300 years is challenging at the scale of individual structures due to the low number of events. However, when considered in the context of a global analysis, volcanic eruptions can provide new insights into worldwide phenomena on Earth that may contribute to triggering eruptions. We have taken a global approach to show that the temporal evolution of the global number of volcanic eruptions is mainly composed of cycles of approximately ∼9–∼130 years. Most of these periodicities are observed in both volcanic activity and the motion of the Earth’s rotation pole. Some of these cycles are also found in solar activity (Table 1) and have been used for predicting the solar cycle 25 (Courtillot et al., 2021). By using a two-step analysis, we suggest that there is a common external force acting on volcanic eruptions on Earth and solar activity, but not necessarily a causal link between solar spots and volcanic eruptions. Such a link would not be favored, as illustrated by various interpretations suggested in the past (e.g., Lyons, 1899; Jensen, 1902; Schneider and Mass, 1975; Mazzarella and Palumbo, 1988; 1989; Stothers, 1989; Strestik, 2003; Herdiwijaya et al., 2014; Vasilieva and Zharkova, 2020).
Dumont et al. (2022) have identified a link between global volcanic eruptions and the global mean sea level, which is known to exhibit planetary-scale periodicities (Le Mouël et al., 2021a; Courtillot et al., 2022a). Such a link can be understood in the case of insular, submarine and coastal magmatic plumbing systems, which are the most abundant (Dumont et al., 2022): stress variations can be induced by pressure changes imposed by oceanic water mass transport at different timescales. However, for volcanic systems located further inland, the redistribution of oceanic masses likely has a residual effect on their dynamics. Therefore, there must be another causal link that applies to all volcanic systems to explain the common periodicities detected in worldwide volcanic eruptions and solar activity. Recent studies, including Courtillot et al. (2021), Le Mouël et al. (2021a), and Lopes et al. (2021a), Lopes et al. (2022a), have shown that the temporal evolution of planetary orbital moments is reflected in sunspots and polar motion, as evidenced by their common periodicities. Transfer of energy through planetary orbital moments could represent this external force that is common to volcanic and solar activity.
In Figures 7 and 8, we show the components of iSSA that illustrate the common periodicities in NVE and PM (we only present the results for the m2 coordinate of the rotation pole). The most significant evidence of a shared signature and a chain of direct or indirect causality links among the phenomena analyzed in this study comes from Table 1. Out of the list of 12 periodicities identified in NVE, only two are apparently absent in m2 (∼27 and ∼5 years). All the others fall within the uncertainty range of the extracted components for m2 and NVE. All these shared pseudo-cycles can be associated with a commensurable periodicity that corresponds to the Jovian planets and Pluto or their combinations in pairs and pairs of pairs (see Table 1, Mörth and Schlamminger, 1979; Courtillot et al., 2021; Lopes et al., 2021a).
For longer periods than ∼19 years, which is associated with the lunar great nutation cycle, good correlations are obtained between the components of the NVE and the polar motion that are either in phase or in anti-phase (Figures 7B–E). For shorter periods (Figures 8A–D), this phase relationship appears to be lost, and no clear phase relationship between NVE and PM is observed due to higher phase lags. However, the correlations can be improved by considering the time integral of the length of day (lod). Therefore, the phase relationship between NVE, PM and lod indicates that the period from which the perturbations in the length of day prevail over those of polar motion is that of the great lunar nutation cycle.
These observations are consistent with Laplace’s theory (Laplace, 1799), particularly the system of linear differential equations of Liouville-Euler (see Eq. 1). Furthermore, our results suggest that the long periods resulting from the commensurability of planet pairs affect the precession and nutation of the Earth, which describe the major changes in the orientation of the Earth’s rotation axis. Shorter periods appear to have a stronger influence on the length of day, i.e., the component that measures the rotation speed around the polar axis. The link between volcanic activity and day length has been explored or suggested in past and recent studies (Hamilton, 1973; Stothers, 1989; Palladino and Sottili, 2014; Sottili et al., 2015; Tuel et al., 2017; Bilham et al., 2022). Thus, two parallel causal chains of forces could be involved, one acting directly on the tilt of the Earth’s rotation axis, and the other on its rotation, both modulating crustal stresses and fluid movements that in turn influence the triggering of global-scale volcanic system activity (Figure 9). In light of this study, it is likely that the orbital moments of the Jovian planets and more generally planetary orbits modulate other dynamic processes on Earth, as suggested by other studies (Zaccagnino et al., 2020; Boulila et al., 2021; Cionco et al., 2021; Yndestad, 2022; Amaya et al., 2023). The mathematical and physical mechanisms by which energy transfer to Earth occurs through planetary torques are discussed in Lopes et al. (2022c).
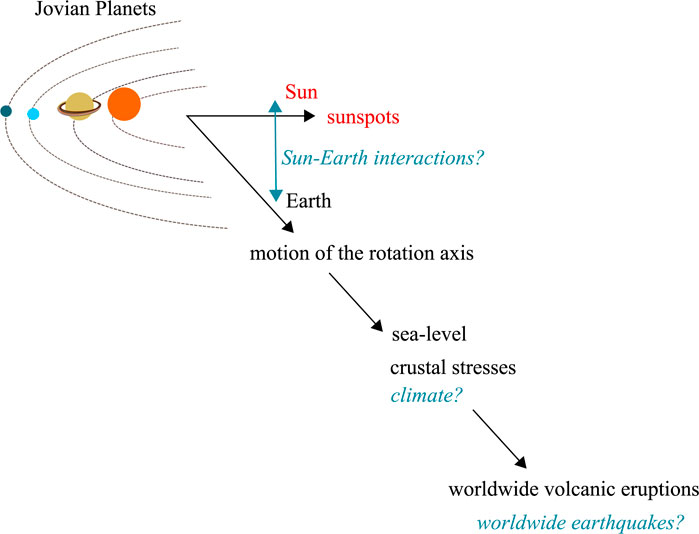
FIGURE 9. Cartoon summarizing the action of the Jovian planets on the Sun and Earth dynamics. In blue, a series of other interactions and phenomena that could possibly be affected by the passage of Jovian planets, but not considered in this study.
As suggested for large explosive eruptions in ice core records (Tuel et al., 2017), our findings reinforce the idea that volcanic eruptions on Earth cannot be considered as entirely random processes and are partially controlled by external influences related to the ephemerids of celestial bodies in our solar system, acting on mass redistribution and thus stress variations at multi-annual, multi-decanal, centennial, or even longer timescales. Further investigations would help better understand this interaction, its spatial distribution as well as the local and regional conditions that cause volcanic systems to respond to these global stress changes, which could potentially contribute to anticipating phases of increased volcanic activity, as suggested by Bilham et al. (2022).
In conclusion, we have analyzed the global number of volcanic eruptions (NVE), as well as the number of sunspots (ISSN) and the motion of the Earth’s rotation pole (PM) over a time interval of 322 years (1700–2022). We have demonstrated the presence of a set of common periodicities in global volcanic activity, sunspots, and polar motion. These periodicities range from approximately 5 years to around 130–140 years. We interpret these results within the framework of the Laplace paradigm, the same one used by Milanković (1920) for much longer cycles. With more shared periodicities between NVE and PM than between NVE and ISSN, we propose that these periodic signals are the signature of a common external forcing on solar activity and various global phenomena on Earth, including changes in the tilt of Earth’s rotation axis. This results in changes in stress that impact global volcanic activity. The ultimate source of these changes lies in the energy transmitted by the orbital moments of individual Jovian planets and/or their combinations in pairs and pairs of pairs including Pluto.
Publicly available datasets were analyzed in this study. This data can be found here: https://volcano.si.edu/, http://www.sidc.be/silso/datafiles and https://www.iers.org/IERS/EN/DataProducts/EarthOrientationData/eop.html.
J-LM: Conceptualization, Writing–review and editing. DG: Writing–review and editing. VC: Writing–review and editing. SD: Writing–review and editing. JB: Writing–review and editing. SP: Writing–review and editing. PZ: Writing–review and editing. FL: Writing–review and editing. J-BB: Writing–review and editing. MN: Writing–review and editing. SC: Writing–review and editing. GS: Writing–review and editing. VK: Writing–review and editing. LC: Writing–review and editing. MG: Writing–review and editing.
This work was performed as part of the contract 2021.000876.CEECIND and the fellowship SFRH/BPD/117714/2016 funded by the Portuguese Fundação para a Ciência e Tecnologia (FCT—I.P./MCTES) and the European Union, co-financed by the Ministério da Ciência, Tecnologia e Ensino Superior (MCTES), Fundo Social Europeu (FSE), and Programa Operacional Regional Centro (POR-Centro, Centro 2020). This work was co-financed by the FEDER funds through the Programa Operacional Competitividade e Internacionalização—COMPETE 2020 and through national funds through the (FCT I.P./MCTES) as part of the SHAZAM (PTDC/CTA-GEO/31475/2017—POCI-01-0145-FEDER-031475) project and by the FCT I.P./MCTES through national funds (PIDDAC)—UIDB/50019/2020- IDL and PTDC/CTA-GEF/6674/2020—RESTLESS.
SD acknowledges Edward Venzke from the Smithsonian Global Volcanism Program for his support in data access. SD acknowledges the FCT for its financial support.
The authors declare that the research was conducted in the absence of any commercial or financial relationships that could be construed as a potential conflict of interest.
The reviewer ADS declared a shared affiliation with the author SP to the handling editor at time of review.
All claims expressed in this article are solely those of the authors and do not necessarily represent those of their affiliated organizations, or those of the publisher, the editors and the reviewers. Any product that may be evaluated in this article, or claim that may be made by its manufacturer, is not guaranteed or endorsed by the publisher.
Akhoondzadeh, M., and De Santis., A. (2022). Is the apparent correlation between solar-geomagnetic activity and occurrence of powerful earthquakes a casual artifact? Atmosphere 13 (7), 1131. doi:10.3390/atmos13071131
Amaya, D. J., Jacox, M. G., Alexander, M. A., Scott, J. D., Deser, C., Capotondi, A., et al. (2023). Bottom marine heatwaves along the continental shelves of North America. Nat. Commun. 14 (1), 1038. doi:10.1038/s41467-023-36567-0
Auger, F., and Flandrin, P. (1995). Improving the readability of time-frequency and time-scale representations by the reassignment method. IEEE Trans. signal Process. 43 (5), 1068–1089. doi:10.1109/78.382394
Bank, M. J., and Scafetta, N. (2022). Scaling, mirror symmetries and musical consonances among the distances of the planets of the solar system. Front. Astronomy Space Sci. 8, 758184. doi:10.3389/fspas.2021.758184
Bartels, J. (1932). Terrestrial-magnetic activity and its relations to solar phenomena. Terr. Magnetism Atmos. Electr. 37 (1), 1–52. doi:10.1029/te037i001p00001
Bilham, R., Szeliga, W., Mencin, D., and Bendick, R. (2022). Increased Caribbean seismicity and volcanism during minima in Earth’s rotation rate: search for a physical mechanism and a 2030 forecast. Front. Earth Sci. 10, 1041311. doi:10.3389/feart.2022.1041311
Björnsson, A. (1985). Dynamics of crustal rifting in NE Iceland. J. Geophys. Res. Solid Earth 90 (B12), 10151–10162. doi:10.1029/jb090ib12p10151
Boulila, S., Haq, B. U., Hara, N., Müller, R. D., Galbrun, B., and Charbonnier, G. (2021). Potential encoding of coupling between Milankovitch forcing and Earth's interior processes in the Phanerozoic eustatic sea-level record. Earth-Science Rev. 220, 103727. doi:10.1016/j.earscirev.2021.103727
Brzeziński, A., Bizouard, C., and Petrov, S. D. (2002). Influence of the atmosphere on Earth rotation: what new can be learned from the recent atmospheric angular momentum estimates? Surv. Geophys. 23 (1), 33–69. doi:10.1023/a:1014847319391
Canon-Tapia, E. (2014). Volcanic eruption triggers: a hierarchical classification. Earth-Science Rev. 129, 100–119. doi:10.1016/j.earscirev.2013.11.011
Casati, M. (2014). Significant statistically relationship between the great volcanic eruptions and the count of sunspots from 1610 to the present. EGU General Assem. Conf. Abstr. 16, 1385.
Cashman, K. V., and Sparks, R. S. J. (2013). How volcanoes work: a 25 year perspective. GSA Bull. 125 (5/6), 664–690. doi:10.1130/b30720.1
Chambers, D. P., Merrifield, M. A., and Nerem, R. S. (2012). Is there a 60-year oscillation in global mean sea level? Geophys. Res. Lett. 39 (18). doi:10.1029/2012gl052885
Chao, B. F., Chung, W., Shih, Z., and Hsieh, Y. (2014). Earth's rotation variations: a wavelet analysis. Terra nova. 26 (4), 260–264. doi:10.1111/ter.12094
Charvátová, I., and Střeštík, J. (1991). Solar variability as a manifestation of the Sun's motion. J. Atmos. Terr. Phys. 53 (11-12), 1019–1025. doi:10.1016/0021-9169(91)90047-b
Chelton, D. B., and Enfield, D. B. (1986). Ocean signals in tide gauge records. J. Geophys. Res. Solid Earth 91 (B9), 9081–9098. doi:10.1029/jb091ib09p09081
Cionco, R. G., Kudryavtsev, S. M., and Soon, W. W.-H. (2021). Possible origin of some periodicities detected in solar-terrestrial studies: earth's orbital movements. Earth Space Sci. 8 (8), e2021EA001805. doi:10.1029/2021ea001805
Coles, W. A., Rickett, B. J., Rumsey, V. H., Kaufman, J. J., Turley, D. G., Ananthakrishnan, S. A. J. W., et al. (1980). Solar cycle changes in the polar solar wind. Nature 286, 239–241. doi:10.1038/286239a0
Courtillot, V., Le Mouël, J. L., Kossobokov, V., Gibert, D., and Lopes, F. (2013). Multi-decadal trends of global surface temperature: a broken line with alternating ∼30 yr linear segments? Atmos. Clim. Sci. 3 (3), 364–371. doi:10.4236/acs.2013.33038
Courtillot, V., and Le Mouël, J. L. (1988). Time variations of the Earth's magnetic field: from daily to secular. Annu. Rev. Earth Planet. Sci. 16 (1), 389–476. doi:10.1146/annurev.ea.16.050188.002133
Courtillot, V., Lopes, F., and Le Mouël, J.-L. (2021). On the prediction of solar cycles. Sol. Phys. 296 (1), 21–23. doi:10.1007/s11207-020-01760-7
Courtillot, V., Mouël, J. L., Lopes, F., and Gibert, D. (2022b). On the nature and origin of atmospheric annual and semi-annual oscillations”. arXiv, arXiv:2206.12133.
Courtillot, V., Mouël, J. L., and Lopes, F. (2022a). On Sea-level change in coastal areas”. arXiv, arXiv:2205.03895.
Coussens, M., Coussens, M., Wall-Palmer, D., Talling, P. J., Watt, S. F., Cassidy, M., et al. (2016). The relationship between eruptive activity, flank collapse, and sea level at volcanic islands: a long-term (>1 Ma) record offshore Montserrat, Lesser Antilles. Geochem. Geophys. Geosystems 17 (7), 2591–2611. doi:10.1002/2015gc006053
Custódio, S. S. I., Fonseca, J. F., d'Oreye, N. F., Faria, B. V., and Bandomo, Z. (2003). Tidal modulation of seismic noise and volcanic tremor. Geophys. Res. Lett. 30 (15). doi:10.1029/2003gl016991
De Lauro, E., Petrosino, S., Ricco, C., Aquino, I., and Falanga, M. (2018). Medium and long period ground oscillatory pattern inferred by borehole tiltmetric data: new perspectives for the Campi Flegrei caldera crustal dynamics. Earth Planet. Sci. Lett. 504, 21–29. doi:10.1016/j.epsl.2018.09.039
Dinger, F., Bobrowski, N., Warnach, S., Bredemeyer, S., Hidalgo, S., Arellano, S., et al. (2018). Periodicity in the BrO∕SO<sub>2</sub> molar ratios in the volcanic gas plume of Cotopaxi and its correlation with the Earth tides during the eruption in 2015. Solid earth. 9 (2), 247–266. doi:10.5194/se-9-247-2018
Dumont, S., Le Mouël, J. L., Courtillot, V., Lopes, F., Sigmundsson, F., Coppola, D., et al. (2020). The dynamics of a long-lasting effusive eruption modulated by Earth tides. Earth Planet. Sci. Lett. 536, 116145. doi:10.1016/j.epsl.2020.116145
Dumont, S., Petrosino, S., and Neves, M. C. (2022). On the link between global volcanic activity and global mean sea-level. Front. Earth Sci. 10, 845511. doi:10.3389/feart.2022.845511
Dumont, S., Silveira, G., Custódio, S., Lopes, F., Le Mouël, J.-L., Gouhier, M., et al. (2021). Response of Fogo volcano (Cape Verde) to lunisolar gravitational forces during the 2014–2015 eruption. Phys. Earth Planet. Interiors 312, 106659. doi:10.1016/j.pepi.2021.106659
Dzurisin, D. (1980). Influence of fortnightly Earth tides at Kilauea volcano, Hawaii. Geophys. Res. Lett. 7 (11), 925–928. doi:10.1029/gl007i011p00925
Frick, P., Galyagin, D., Hoyt, D. V., Nesme-Ribes, E., Schatten, K. H., Sokoloff, D., et al. (1997). Wavelet analysis of solar activity recorded by sunspot groups. Astronomy Astrophysics 328, 670–681.
Gibert, D., Holschneider, M., and Le Mouël, J. L. (1998). Wavelet analysis of the Chandler wobble. J. Geophys. Res. Solid Earth 103 (B11), 27069–27089. doi:10.1029/98jb02527
Gleissberg, W. (1939). A long-periodic fluctuation of the sun-spot numbers. Observatory 62, 158–159.
Gleissberg, W. (1944). A table of secular variations of the solar cycle. Terr. Magnetism Atmos. Electr. 49 (4), 243–244. doi:10.1029/te049i004p00243
Golub, G. H., and Reinsch, C. (1971). Singular value decomposition and least squares solutions”. Linear Algebra: Springer, 134–151.
Golyandina, N., and Zhigljavsky, A. (2013). Singular Spectrum analysis for time series”. Berlin, Heidelberg: Springer, 71–119.
Greco, F., and Krasnyy, I. V. (2021). The novel pushing gravity model and volcanic activity. Is alignment of planets with compact stars a possible cause of natural phenomena? J. Phys. Conf. Ser. (1), 012019. IOP Publishing. doi:10.1088/1742-6596/2081/1/012019
Gusev, A. A. (2008). Temporal structure of the global sequence of volcanic eruptions: order clustering and intermittent discharge rate. Phys. Earth Planet. interiors 166 (3-4), 203–218. doi:10.1016/j.pepi.2008.01.004
Gusev, A. A. (2014). The fractal structure of the sequence of volcanic eruptions worldwide: order clustering of events and episodic discharge of material. J. Volcanol. Seismol. 8 (1), 34–53. doi:10.1134/s0742046314010023
Guttorp, P., and Thompson, M. L. (1991). Estimating second-order parameters of volcanicity from historical data. J. Am. Stat. Assoc. 86 (415), 578–583. doi:10.1080/01621459.1991.10475082
Hale, G. E., Ellerman, F., Nicholson, S. B., and Joy, A. H. (1919). The magnetic polarity of sun-spots. Astrophysical J. 49 (153), 153. doi:10.1086/142452
Hamilton, W. L. (1973). Tidal cycles of volcanic eruptions: fortnightly to 19 yearly periods. J. Geophys. Res. 78 (17), 3363–3375. doi:10.1029/jb078i017p03363
Herdiwijaya, D., Arif, J., and Nurzaman, M. Z. (2014). “On the relation between solar and global volcanic activities,” in In international conference on physics, (ICP-14) (Atlantis Press), 105–108.
Jault, D., and Le Mouël, J.-L. (1991). Exchange of angular momentum between the core and the mantle. J. geomagnetism Geoelectr. 43 (2), 111–129. doi:10.5636/jgg.43.111
Jault, D. (1990). Variation séculaire du champ géomagnétique et fluctuations de la longueur du jour. Dr. Diss. Paris. PhD thesis 7.
Jensen, H. I. (1902). Possible relation between sunspot minima and volcanic eruptions. Jr. Soc. N. S. W. 36, 42–60. doi:10.5962/p.359379
Keogh, E., Chakrabarti, K., Pazzani, M., and Mehrotra, S. (2001). Dimensionality reduction for fast similarity search in large time series databases. Knowl. Inf. Syst. 3, 263–286. doi:10.1007/pl00011669
Keogh, E., and Ratanamahatana, C. A. (2005). Exact indexing of dynamic time warping. Knowl. Inf. Syst. 7, 358–386. doi:10.1007/s10115-004-0154-9
Khain, V., and Khalilov, E. (2009). About possible influence of solar activity on seismic and volcanic activities: long-term forecast. Sci. without borders 316.
Kutterolf, S., Jegen, M., Mitrovica, J. X., Kwasnitschka, T., Freundt, A., and Huybers, P. J. (2013). A detection of Milankovitch frequencies in global volcanic activity. Geology 41 (2), 227–230. doi:10.1130/g33419.1
Kutterolf, S., Schindlbeck, J. C., Jegen, M., Freundt, A., and Straub, S. M. (2019). Milankovitch frequencies in tephra records at volcanic arcs: the relation of kyr-scale cyclic variations in volcanism to global climate changes. Quat. Sci. Rev. 204, 1–16. doi:10.1016/j.quascirev.2018.11.004
Lambeck, K. (2005). The Earth's variable rotation: geophysical causes and consequences”. Cambridge University Press.
Le Mouël, J. L., Lopes, F., and Courtillot, V. (2019c). A solar signature in many climate indices. J. Geophys. Res. Atmos. 124 (5), 2600–2619. doi:10.1029/2018jd028939
Le Mouël, J. L., Lopes, F., and Courtillot, V. (2021b). A strong link between variations in sea-ice extent and global atmospheric pressure? Cryosphere Discuss. 1-28. doi:10.5194/tc-2021-216
Le Mouël, J. L., Lopes, F., and Courtillot, V. (2020b). Characteristic time scales of decadal to centennial changes in global surface temperatures over the past 150 years. Earth Space Sci. 7 (4), e2019EA000671. doi:10.1029/2019ea000671
Le Mouël, J. L., Lopes, F., Courtillot, V., and Gibert, D. (2019b). On forcings of length of day changes: from 9-day to 18.6-year oscillations. Phys. Earth Planet. Interiors 292, 1–11. doi:10.1016/j.pepi.2019.04.006
Le Mouël, J. L., Lopes, F., and Courtillot, V. (2017). Identification of Gleissberg cycles and a rising trend in a 315-year-long series of sunspot numbers. Sol. Phys. 292 (3), 43–49. doi:10.1007/s11207-017-1067-6
Le Mouël, J. L., Lopes, F., and Courtillot, V. (2021a). Sea-level change at the brest (France) tide gauge and the markowitz component of Earth's rotation. J. Coast. Res. 37 (4), 683–690. doi:10.2112/JCOASTRES-D-20-00110.1
Le Mouël, J. L., Lopes, F., and Courtillot, V. (2020a). Solar turbulence from sunspot records. Mon. Not. Roy. Astr. Soc. 492 (1), 1416–1420. doi:10.1093/mnras/stz3503
Le Mouël, J. L., Lopes, F., and Courtillot, V. (2019a). Singular spectral analysis of the aa and Dst geomagnetic indices. J. Geophys. Res. Space Phys. 124 (8), 6403–6417. doi:10.1029/2019ja027040
Le Mouël, J. L. (1984). Outer-core geostrophic flow and secular variation of Earth's geomagnetic field. Nature 311 (5988), 734–735. doi:10.1038/311734a0
Lemmerling, P., and Van Huffel, S. (2001). Analysis of the structured total least squares problem for Hankel/Toeplitz matrices. Numer. Algorithms 27 (1), 89–114. doi:10.1023/a:1016775707686
Lilly, J. M., and Olhede, S. C. (2012). Generalized Morse wavelets as a superfamily of analytic wavelets. IEEE Trans. Signal Process. 60 (11), 6036–6041. doi:10.1109/tsp.2012.2210890
Lopes, F., Courtillot, V., Gibert, D., Le Mouël, J.-L., and Boulé, J.-B. (2022c). On power-law distributions of planetary rotations and revolutions as a function of aphelia, following Lagrange's formulation. arXiv:2209.07213 [physics.geo-ph].
Lopes, F., Courtillot, V., and Le Mouël, J.-L. (2022b). Triskeles and symmetries of mean global sea-level pressure. Atmosphere 13 (9), 1354. doi:10.3390/atmos13091354
Lopes, F., Courtillot, V., Mouël, J. L., and Gibert, D. (2022a). On two formulations of polar motion and identification of its sources. Geosciences 12 (11), 398. doi:10.3390/geosciences12110398
Lopes, F., Le Mouël, J. L., and Gibert, D. (2017). The mantle rotation pole position. A solar component. Comptes Rendus Geosci. 349 (4), 159–164. doi:10.1016/j.crte.2017.06.001
Lopes, F., Le Mouël, J. L., Courtillot, V., and Gibert, D. (2021a). On the shoulders of Laplace. Phys. Earth Planet. Interiors 316, 106693. doi:10.1016/j.pepi.2021.106693
Lopes, F., Zuddas, P., Courtillot, V., Le Mouël, J. L., Boulé, J. B., Maineult, A., et al. (2021b). Milankovic pseudo-cycles recorded in sediments and ice cores extracted by singular Spectrum analysis. Clim. Past Discuss. doi:10.5194/cp-2021-126
Lucas, L. C., Albright, J. A., Gregg, P. M., and Zhan, Y. (2022). The impact of ice caps on the mechanical stability of magmatic systems: implications for forecasting on human timescales. Front. Earth Sci. 717. doi:10.3389/feart.2022.868569
Lyons, C. J. (1899). Sun spots and Hawaiian eruptions. Mon. Weather Rev. 27 (4), 144. doi:10.1175/1520-0493(1899)27[144a:ssahe]2.0.co;2
Ma, L., Yin, Z., and Han, Y. (2018). Possible influence of solar activity on global volcanicity. Earth Sci. Res. 7 (110), 110–5539. doi:10.5539/esr.v7n1p110
Machado, F. (1960). Secular variation of seismo-volcanic phenomena in the Azores. Bull. Volcanol. 23 (1), 101–108. doi:10.1007/bf02596634
Marchitelli, V., Harabaglia, P., Troise, C., and De Natale, G. (2020). On the correlation between solar activity and large earthquakes worldwide. Sci. Rep. 10 (1), 11495–11510. doi:10.1038/s41598-020-67860-3
Marzocchi, W., and Bebbington, M. (2012). Probabilistic eruption forecasting at short and long time scales. Bull. Volcanol. 74 (8), 1777–1805. doi:10.1007/s00445-012-0633-x
Mason, B. G., Pyle, D. M., Dade, W. B., and Jupp, T. (2004). Seasonality of volcanic eruptions. J. Geophys. Res. Solid Earth 109 (B4). doi:10.1029/2002jb002293
Mauk, F. J., and Johnston, M. J. S. (1973). On the triggering of volcanic eruptions by Earth tides. J. Geophys. Res. 78 (17), 3356–3362. doi:10.1029/jb078i017p03356
Mazzarella, A., and Palumbo, A. (1989). Does the solar cycle modulate seismic and volcanic activity? J. Volcanol. Geotherm. Res. 39 (1), 89–93. doi:10.1016/0377-0273(89)90023-1
Mazzarella, A., and Palumbo, A. (1988). Solar, geomagnetic and seismic activity. Il Nuovo Cimento C 11 (4), 353–364. doi:10.1007/bf02533129
Mazzarella, A., and Scafetta, N. (2012). Evidences for a quasi 60-year North Atlantic Oscillation since 1700 and its meaning for global climate change. Theor. Appl. Climatol. 107, 599–609. doi:10.1007/s00704-011-0499-4
McNutt, S. R., and Beavan, R. J. (1987). Eruptions of Pavlof volcano and their possible modulation by ocean load and tectonic stresses. J. Geophys. Res. Solid Earth 92 (B11), 11509–11523. doi:10.1029/jb092ib11p11509
Milanković, M. (1920). Théorie mathématique des phénomènes thermiques produits par la radiation solaire”. Gauthier-Villars.
Mörth, H. T., and Schlamminger, L. (1979). “Planetary motion, sunspots and climate,” in Solar-terrestrial influences on weather and climate (Dordrecht: Springer), 193–207.
Nakiboglu, S. M., and Lambeck, K. (1980). Deglaciation effects on the rotation of the Earth. Geophys. J. Int. 62, 49–58. doi:10.1111/j.1365-246x.1980.tb04843.x
Nesi, V., Bruno, O., Zaccagnino, D., Mascia, C., and Doglioni, C. (2023). Tidal drag and westward drift of the lithosphere. Geosci. Front. 14 (6), 101623. doi:10.1016/j.gsf.2023.101623
Newhall, C. G., and Self, S. (1982). The volcanic explosivity index (VEI) an estimate of explosive magnitude for historical volcanism. J. Geophys. Res. Oceans 87 (C2), 1231–1238. doi:10.1029/jc087ic02p01231
Olhede, S. C., and Walden, A. T. (2002). Generalized morse wavelets. IEEE Trans. Signal Process. 50 (11), 2661–2670. doi:10.1109/tsp.2002.804066
Palladino, D. M., and Sottili, G. (2014). Earth's spin and volcanic eruptions: evidence for mutual cause-and-effect interactions? Terra nova. 26 (1), 78–84. doi:10.1111/ter.12073
Petrosino, S., Cusano, P., and Madonia, P. (2018). Tidal and hydrological periodicities of seismicity reveal new risk scenarios at Campi Flegrei caldera. Sci. Rep. 8 (1), 13808–13812. doi:10.1038/s41598-018-31760-4
Petrosino, S., and Dumont, S. (2022). Tidal modulation of hydrothermal tremor: examples from Ischia and Campi Flegrei volcanoes, Italy. Front. Earth Sci. 9, 775269. doi:10.3389/feart.2021.775269
Qu, W. Z., Huang, F., Du, L., Zhao, J. P., Debg, S. G., and Cao, Y. (2011). The periodicity of volcano activity and its reflection in some climate factors. Chin. J. Geophys. 54 (2), 135–149. doi:10.1002/cjg2.1595
Safronov, A. N. (2022). New theory of effusive and explosive volcanic eruptions. Int. J. Geosciences 13 (2), 115–137. doi:10.4236/ijg.2022.132007
Satow, C., Gudmundsson, A., Gertisser, R., Ramsey, C. B., Bazargan, M., Pyle, D. M., et al. (2021). Eruptive activity of the Santorini Volcano controlled by sea-level rise and fall. Nat. Geosci. 14 (8), 586–592. doi:10.1038/s41561-021-00783-4
Scafetta, N. (2010). Empirical evidence for a celestial origin of the climate oscillations and its implications. J. Atmos. Solar-Terrestrial Phys. 72 (13), 951–970. doi:10.1016/j.jastp.2010.04.015
Scafetta, N. (2016). High resolution coherence analysis between planetary and climate oscillations. Adv. Space Res. 57 (10), 2121–2135. doi:10.1016/j.asr.2016.02.029
Scafetta, N. (2021). Reconstruction of the interannual to millennial scale patterns of the global surface temperature. Atmosphere 12 (2), 147. doi:10.3390/atmos12020147
Schlesinger, M. E., and Ramankutty, N. (1994). An oscillation in the global climate system of period 65–70 years. Nature 367 (6465), 723–726. doi:10.1038/367723a0
Schneider, S. H., and Mass, C. (1975). Volcanic Dust, Sunspots, and Temperature Trends: a calculated global surface temperature history has some similarities to known temperature histories. Science 190 (4216), 741–746. doi:10.1126/science.190.4216.741
Seropian, G., Kennedy, B. M., Walter, T. R., Ichihara, M., and Jolly, A. D. (2021). A review framework of how earthquakes trigger volcanic eruptions. Nat. Commun. 12 (1), 1004–1013. doi:10.1038/s41467-021-21166-8
Simkin, T. (1993). Terrestrial volcanism in space and time. Annu. Rev. Earth Planet. Sci. 2, 427–452. doi:10.1146/annurev.ea.21.050193.002235
Sottili, G., Palladino, D. M., Cuffaro, M., and Doglioni, C. (2015). Earth’s rotation variability triggers explosive eruptions in subduction zones. Earth, Planets Space 67 (1), 208–209. doi:10.1186/s40623-015-0375-z
Sottili, G., and Palladino, D. M. (2012). Tidal modulation of eruptive activity at open-vent volcanoes: evidence from Stromboli, Italy. Terra nova. 24 (3), 233–237. doi:10.1111/j.1365-3121.2012.01059.x
Stothers, R. B. (1989). Volcanic eruptions and solar activity. J. Geophys. Res. Solid Earth 94 (B12), 17371–17381. doi:10.1029/jb094ib12p17371
Strestik, J. (2003). Possible correlation between solar and volcanic activity in a long-term scale. Sol. Var. as Input Earth's Environ. 535, 393–396.
Tamrazyan, G. P. (1968). Principal regularities in the distribution of major earthquakes relative to solar and lunar tides and other cosmic forces. Icarus 9 (1-3), 574–592. doi:10.1016/0019-1035(68)90050-x
Tuel, A., Naveau, P., and Ammann, C. M. (2017). Skillful prediction of multidecadal variations in volcanic forcing. Geophys. Res. Lett. 44 (6), 2868–2874. doi:10.1002/2016gl072234
Usoskin, I. G. (2017). A history of solar activity over millennia. Living Rev. Sol. Phys. 14 (1), 3–97. doi:10.1007/s41116-017-0006-9
Vasilieva, I., and Zharkova, V. V. (2020). Terrestrial volcanic eruptions and their link with solar activity. Available at: https://solargsm.com/wp-content/uploads/2022/04/volcanos_sr_rev3_v2a.pdf.
Global Volcanism Program (2013). “Volcanoes of the World, v. 4.11.2 (02 Sep 2022),” in Smithsonian Institution. Editor E. Venzke (GVP). doi:10.5479/si.GVP.VOTW4-2013
Wahl, T., and Chambers, D. P. (2015). Evidence for multidecadal variability in US extreme sea level records. J. Geophys. Res. Oceans 120 (3), 1527–1544. doi:10.1002/2014jc010443
Watt, S. F. L., Pyle, D. M., and Mather, T. A. (2013). The volcanic response to deglaciation: evidence from glaciated arcs and a reassessment of global eruption records. Earth-Science Rev. 122, 77–102. doi:10.1016/j.earscirev.2013.03.007
Watt, S. F. (2019). The evolution of volcanic systems following sector collapse. J. Volcanol. Geotherm. Res. 384, 280–303. doi:10.1016/j.jvolgeores.2019.05.012
Wood, C. A., and Lovett, R. R. (1974). Rainfall, drought and the solar cycle. Nature 251 (5476), 594–596. doi:10.1038/251594a0
Wunsch, C. (1972). Bermuda sea level in relation to tides, weather, and baroclinic fluctuations. Rev. Geophys. 10 (1), 1–49. doi:10.1029/rg010i001p00001
Yndestad, H. (2022). Jovian planets and lunar nodal cycles in the Earth’s climate variability. Front. Astronomy Space Sci. 9, 839794. doi:10.3389/fspas.2022.839794
Keywords: worldwide volcanic eruptions, polar motion, sunspot number, planetary orbital moments, Laplace theory, external forcing
Citation: Le Mouël J-L, Gibert D, Courtillot V, Dumont S, de Bremond d'Ars J, Petrosino S, Zuddas P, Lopes F, Boulé J-B, Neves MC, Custódio S, Silveira G, Kossobokov V, Coen L and Gèze M (2023) On the external forcing of global eruptive activity in the past 300 years. Front. Earth Sci. 11:1254855. doi: 10.3389/feart.2023.1254855
Received: 07 July 2023; Accepted: 02 October 2023;
Published: 19 October 2023.
Edited by:
Yosuke Aoki, The University of Tokyo, JapanReviewed by:
Angelo De Santis, National Institute of Geophysics and Volcanology (INGV), ItalyCopyright © 2023 Le Mouël, Gibert, Courtillot, Dumont, de Bremond d'Ars, Petrosino, Zuddas, Lopes, Boulé, Neves, Custódio, Silveira, Kossobokov, Coen and Gèze. This is an open-access article distributed under the terms of the Creative Commons Attribution License (CC BY). The use, distribution or reproduction in other forums is permitted, provided the original author(s) and the copyright owner(s) are credited and that the original publication in this journal is cited, in accordance with accepted academic practice. No use, distribution or reproduction is permitted which does not comply with these terms.
*Correspondence: S. Dumont, c3NkdW1vbnRAY2llbmNpYXMudWxpc2JvYS5wdA==
Disclaimer: All claims expressed in this article are solely those of the authors and do not necessarily represent those of their affiliated organizations, or those of the publisher, the editors and the reviewers. Any product that may be evaluated in this article or claim that may be made by its manufacturer is not guaranteed or endorsed by the publisher.
Research integrity at Frontiers
Learn more about the work of our research integrity team to safeguard the quality of each article we publish.