
94% of researchers rate our articles as excellent or good
Learn more about the work of our research integrity team to safeguard the quality of each article we publish.
Find out more
ORIGINAL RESEARCH article
Front. Earth Sci., 10 October 2023
Sec. Volcanology
Volume 11 - 2023 | https://doi.org/10.3389/feart.2023.1254547
This article is part of the Research TopicMultiscale Approach and Integrated Multiplatform Techniques to Study the Volcanic and Geothermal EnvironmentsView all 4 articles
 G. Chiodini1
 G. Bini1,2*
 S. Massaro3
 S. Caliro4
 C. Kanellopoulos5
 F. Tassi6,7
 O. Vaselli1,6,7
 G. Vougioukalakis8
 O. Bachmann2
Hydrothermal explosions occur through the sudden expansion of fluids at or near boiling condition with little or no precursors, making any kind of forecast difficult. Here, we investigate the processes occurring within hydrothermal systems in a potential critical state for explosions through a new methodology based on mass balances of thermal water solutes. The usage of this method reveals that the pore water samples of the Paleochori Bay (Milos, Greece; <20 m depth below sea level), chosen as a case study, are binary mixtures of a geothermal component and seawater, from which steam is either added through condensation of underlying, ascending vapors or separates through boiling. This new method enables us to quantify and map both the fraction of the original geothermal liquid in each pore water sample and that of the vapor supplied or separated from the solutions. Furthermore, the method allows us to compute the composition of the geothermal endmember. The map of the fraction of supplied vapor shows that decompressional boiling of ascending liquids predominantly focuses in the central part of the Paleochori Bay. Both the estimated composition and temperature (324°C) of the geothermal liquid endmember overlap those measured in geothermal well fluids at or near-boiling condition, except SO4 and SiO2. The lower SiO2 and higher SO4 content in the pore waters may be ascribed to the current production of an impermeable cap, which enables underlying fluids to accumulate and pressure to buildup. The evidence of liquid at or near boiling conditions and self-sealing processes in the Paleochori Bay suggests that decompressional boiling during abrupt pressure drawdowns might have caused hydrothermal explosions at Milos in historical times, whose occurrence is testified by several hydrothermal craters. Finally, our work shows that similar conditions favoring explosions still affect the hydrothermal system of Milos. The new methodology described in this work can find useful applications in the study of submerged hydrothermal systems and in understanding the physicochemical conditions that favor hydrothermal explosions.
Volcanic eruptions are very dynamic natural phenomena that may occur over a wide range of types and magnitudes, posing a severe hazard for humanity. The hazard related to these events is not only associated with the eruption of magma, but also with the occurrence of violent explosions triggered by the decompression of hydrothermal fluids (e.g., Muffler et al., 1971). These steam driven events include both phreatic and hydrothermal explosions. The former are related to rapid vaporization of water bodies due to fluids and heat released from intruding magmas (Stearns and Macdonald, 1946; Germanovich and Lowell, 1995; Stix and de Moor, 2018), and are generally characterized by the absence of juvenile material (Rosi et al., 2018). On the other hand, hydrothermal explosions occur in geothermal areas without the involvement of magma or magmatic fluids (e.g., Mufler et al., 1971; Fournier et al., 1991; Browne and Lawless, 2001; Montanaro et al., 2022), and produce craters spanning from a few meters up to more than 2 km in diameter (Montanaro et al., 2016 and references therein). Hydrothermal explosions are numerous, for example, at Yellowstone, where the ascent and decompressional boiling of geothermal liquids have produced numerous craters (e.g., Fournier et al., 1991; Morgan et al., 2009). The trigger of these explosions is thought to only rely on the sudden volume expansion of the hot liquid, flashing to steam, after an abrupt decrease in confining pressure favored by deglaciation, seasonal effects, and earthquakes (Muffler et al., 1971; Fournier et al., 1991; Morgan et al., 2009).
Hydrothermal explosions are favored where geothermal fluids are at or near boiling point conditions, and associated high-flow-rate thermal springs ascend and separate steam as geysers and/or fumaroles through decompressional boiling (Muffller et al., 1971; Fytikas and Marinelli, 1976; Smith and McKibbin, 2000; Morgan et al., 2009). These two elements are present in close relationship with the hydrothermal craters of Yellowstone, where about 3,000 L·s−1 of hot liquids with a thermal energy of ∼4.5–6 GW are discharged over the geothermal area (Lowenstern and Hurwitz, 2008 and reference therein). In many of the hydrothermal sites of Yellowstone, the thermal waters rise from depth, depressurize, and boil (decompressional boiling; Fournier, 1989), separating a vapor phase that is released close to the liquid discharges. Similar conditions are also found in the South Aegean Volcanic Arc (Greece; Figure 1A), such as in Milos and Nisyros volcanoes, where several hydrothermal craters opened in the past (the last of which occurred at Nisyros in 1871–1873 and 1887 AD) after steam driven explosions (Fytikas and Marinelli, 1976; Marini et al., 1993; Fontaine et al., 2003).
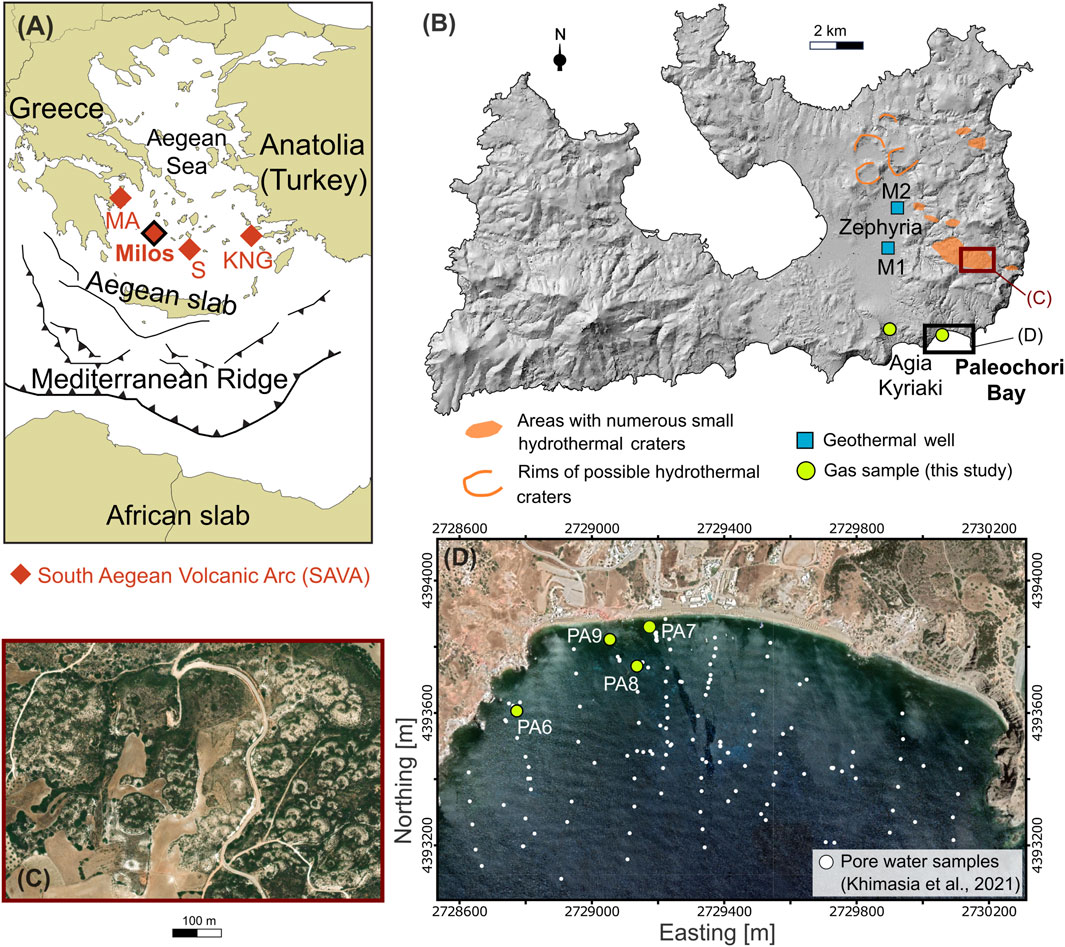
FIGURE 1. Locations of the (A) The South Aegean Volcanic Arc [SAVA; modified after Bini et al. (2022)], (B) Milos, (C) a cluster of hydrothermal craters, and (D) the Paleochori Bay. (A) Milos extends in the central-western part of the SAVA, which formed through the northward subduction of the African slab below the Aegean microplate, and also includes Methana-Aegina (MA), Santorini (S), and Kos-Nisyros-Gyali (KNG) volcanoes. Hydrothermal explosions predominantly occurred in the easter sector of Milos Island (B), forming craters of various dimensions. Clusters of small craters (C) (diameter < 100 m) are also common in this part of the island. Locations of gas samples collected from submerged hydrothermal vents in the Paleochori Bay and the Agia Kyriaki fumarole, and pore water samples from Khimasia et al. (2021) are shown in (B,D). Background (D) is from Google satellite imagery. Coordinates (D) refer to WGS 84/UTM zone 35 N.
Numerous hydrothermal craters and large volumes of hydrothermally altered rocks characterize the Island of Milos (Figure 1B), which is thought to host the highest geothermal potential of Greece at relatively shallow depth (320°C at 1,000–1,200 m; Fytikas and Marinelli, 1976). The circulation of hydrothermal fluids induced an extensive alteration of the volcanic deposits outcropping in the eastern part of the island, creating favorable conditions for the occurrence of hydrothermal or phreatic explosions during the Pleistocene (likely younger than 0.2 Ma; Fytikas et al., 1986; Figure 1B). The older one, described by Fytikas and Marinelli (1976) as the “Green Lahar” formation, consisted of a massive mud-matrix and schist-rich lithic breccia (Fytikas, 1977; Stewart and Mc Phie, 2006) and it widely diffused over the eastern sector of the island. At Paleochori Bay, thick deposits of similar lithology appear with signs of extinct hydrothermal circulation. The hydrothermal activity continued during the historical time (80-200 AD; Traineau and Dalabakis, 1989) in the Agia Kyriaki area, which currently hosts a fumarolic field. Clusters of small craters (diameter less than 100 m; Figure 1C) are scattered along the NW direction of the main fault system acting on the island (Figure 1B), with their maximum occurrence to the north of the Zephyria plain (Fytikas and Marinlli, 1976; Massaro et al., 2022).
Favorable conditions for the occurrence of hydrothermal explosions appear to characterize the current hydrothermal fluid circulation at Milos. In fact, boiling or near-boiling conditions predominantly extend throughout the whole depth of the hydrothermal system, as shown by the overlap of the temperature measured downhole in two geothermal wells (M1 and M2; Figure 1B; Mendrinos and Sullivan, 1987) with the Boiling Point with Depth (BPD) curves (Figure 2). Furthermore, although thermal springs are rare inland Milos, impressive submarine emissions of thermal fluids and gas occur in many sites of the eastern and northern coasts of the island (Figures 1B, D; Dando et al., 1995).
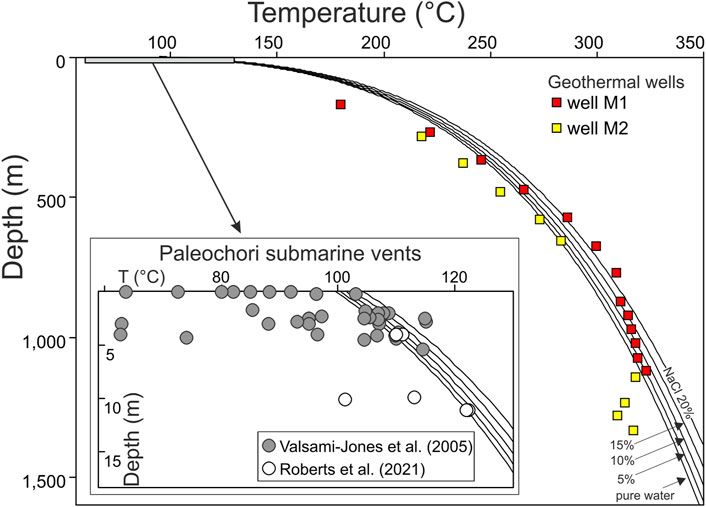
FIGURE 2. Temperature with depth of both geothermal well fluids of Milos [M1 and M2 from Mendrinos and Sullivan (1987)] and pore waters collected from the Paleochori Bay [from Valsami-Jones et al. (2005) and Roberts et al. (2021)]. Geothermal well fluids plot along the Boiling Point with Depth (BPD) curve of water, calculated for different fraction of dissolved NaCl. A few pore water samples also overlap the BPD curve (inset).
The Paleochori Bay is the best known and studied of these submerged hydrothermal sites (e.g., Valsami-Jones et al., 2005; Wu et al., 2012; Price et al., 2013; Daskalopoulou et al., 2018; Khimasia et al., 2021; Figures 1B, D), emitting large amount of hydrothermal fluids and associated heat flow (Khimasia et al., 2021; Puzenat et al., 2021). Previous studies already recognized a mixing process between sea water and a high-temperature deep geothermal component in the Paleochori Bay, similar to that found by geothermal wells (e.g., Fitzsimons et al., 1997; Valsami-Jones et al., 2005; Wu et al., 2011). In the inset of Figure 2, the seawater depths of some thermal emissions of the Paleochori Bay are plotted against their temperatures [data from Valsami-Jones et al. (2005) and Roberts et al. (2021)]. Numerous measurements plot along or above the BPD curve, indicating the occurrence of boiling in the sea floor of the bay. In detail, about 30% of the hydrothermal vents reported by Valsami-Jones et al. (2005) have indeed temperatures higher than the boiling temperature at the sampling depth. Photos of the high-temperature submarine vents [Figure 2 in Valsami-Jones et al. (2005)] illustrate that in many cases these emissions can form sand plumes up to 0.5 m high.
The aim of this work is to investigate the physicochemical processes that are currently affecting the hydrothermal system of the Paleochori Bay by using a novel approach for the contemporary quantification of the seawater-thermal component mixtures and the boiling process (i.e., steam added or removed from the solutions). The work is based on: (i) published data of the geothermal wells drilled in the island during 1970’s −1980’s (Karabelas et al., 1989; Liakopoulos et al., 1991; Koutroupis, 1992; Dotsika et al., 2009); (ii) data of thermal vents and pore waters from the literature (Valsami-Jones et al., 2005; Wu et al., 2012; Price et al., 2013; Khimasia et al., 2021; Roberts et al., 2021); (iii) composition of some submerged gas emission and geothermal vapors sampled in October 2021. Finally, the results are discussed to characterize the processes that likely caused the high number of hydrothermal explosions at Milos in the past and that could possibly cause other events in the future.
Eight gas samples were collected from a fumarolic vent at Agia Kyriaki (AK) and 4 submarine gas emissions at Paleochori Bay (PA6, PA7, PA8, and PA9; Figures 1B, D) to analyze their chemical composition. These gases were collected in pre-evacuated glass bottles equipped with two Thorion stopcocks and partly filled with a solution of 4N NaOH. To sample the fumarole gas, we used a titanium tube inserted into the vent and connected to a Pyrex glass sampling line. The submarine gas emissions were instead sampled through an inverted funnel placed on the vent and connected to the glass bottles through silicon tubing. The gas samples were then analyzed at the laboratory of the INGV-Napoli, Osservatorio Vesuviano, using gas chromatography (He, H2, Ar, O2, N2, and CH4), ionic chromatography (H2S as SO42−), and acidimetric titration (CO2 as CO32−). These sampling techniques and analytical methods are discussed in detail in Bini et al. (2022) and Caliro et al. (2015).
To better understand the physicochemical processes that might drive hydrothermal explosions, we also used both geothermal well fluid and submarine thermal water data available from the literature. In particular, we used the chemical composition of the liquid sampled from the geothermal well Milos 2 [Table 1; data from Karabelas et al. (1989), Liakopoulos et al. (1991), Koutroupis (1992), and Dotsika et al. (2009)], and many pore waters from the Paleochori Bay recently published by Khimasia et al. (2021). This latter dataset consists of 152 analyses of thermal (T ≤ 122°C) and cold waters, and 13 analyses of seawater (Figure 1D). Nine water samples were excluded from our treatment since the electroneutrality parameter was >15% [according to Appelo and Postma (1993)]. Submarine thermal vent data from Valsami-Jones (2005), Wu et al. (2012), Price et al. (2013), and Roberts et al. (2021) were also used in this study.
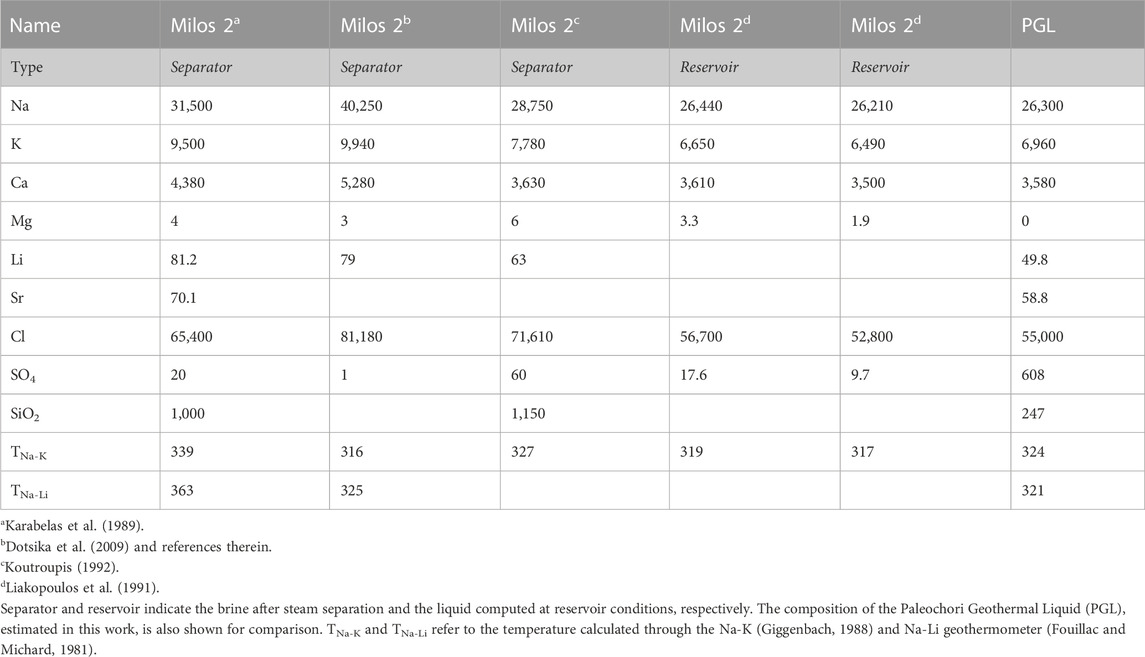
TABLE 1. Chemical composition (in mg·L−1) of the deep geothermal fluids recovered from the Milos 2 well.
Thermal waters can be affected by separation of vapor through boiling and/or addition of steam condensate from underlying ascending vapors. Both effects of steam removal and addition to the liquid can be estimated through a simple mass balance. The original concentration of the dissolved species i (Ci) is given by the number of moles (ni) divided by the mass in kg of the original water (mH2Oo). Considering the addition or removal of steam (mH2Ov), Ci can be written as
where mH2Ov is positive if steam is added and negative if it is removed from the solution. Dividing both the numerator and denominator by mH2Oo, we obtain the following equation
where Ci,o is the initial concentration and Y is the mass ratio ± mH2Ov/mH2Oo. Consequently, the measured concentration of the i solute (Ci,m) dissolved in a seawater-geothermal liquid mixture affected by steam separation or addition of vapor condensate can be expressed as
where Ci,g and Ci,s are the concentrations of the species i in the geothermal and seawater endmembers, respectively, and X is the fraction of the geothermal component in the binary mixture. Similarly, for the j species
Noteworthily, the ratio between two mobile species (Eq. 3 divided by Eq. 4) is not dependent on the Y value, according to
Writing the Ci,m/Cj,m ratio as Ri,j, Eqs 3, 5 can conveniently be expressed as
Equations 6, 7 can be solved with respect to X and Y, given the concentrations of the 2 species i and j in the endmembers.
To estimate the temperature at which the thermal waters of the Paleochori Bay equilibrated, we used the Na-K-Mg graphical geothermometer of Giggenbach (1988). Considering the Na-K exchange reaction between feldspars (Na-feldspar + K+ = K-feldspar + Na+) and the reaction involving K-feld, K-Mica, Chlorite and silica (2–2.8 K-feldspar + 1.6 H2O + Mg2+ = 0.8 K-mica + 0.2 Chlorite + 5.4 SiO2 + 2K+), Giggenbach (1988) derived the following geothermometric functions based on Na/K and K2/Mg log ratios:
In a suitable Na-K-Mg0.5 triangular diagram, Eqs 8, 9 define isothermal straight lines and the so-called full equilibrium curve (where TNa-K = TK-Mg). In the diagram are also reported the field of partially equilibrated waters and that of immature waters (see Giggenbach (1988) for further details).
The spatial extent of temperature, fraction of geothermal liquid (X), and vapor added/removed from the pore waters (Y) of the Paleochori Bay has been defined using sequential Gaussian simulations (sGs). This method enables the unsampled locations of the considered variable to be simulated, thus helping us in spatially constraining the zones of ascent and decompressional boiling of geothermal liquids. First, the spatial variability of these variables was modeled by fitting empirical variograms through weighted least squares. Since the measured variables do not extend over a regularly spaced grid, measurements very close to each other with very different values can significantly increase the nugget of the variogram. To reduce the weight of these outliers on the nugget, we therefore computed empirical variograms through a robust method (Cressie, 1993). Then, the variogram models were used to simulate the variables over the grid nodes of 5 m × 5 m rectangular cells covering the Paleochori Bay, through sGs (e.g., Cardellini et al., 2003). At each node of the grid, nearby measured values are used to construct a conditional distribution by kriging, from which drawing simulated values. This computation proceeds at each node of the grid following a random path, also using the simulated values together with the measured ones. Finally, we averaged the results of 1,000 sGs in the center of each cell of the regularly spaced grid. Both variogram modeling and sGs were performed though the gstat package (Pebesma, 2004) for R (R Core Team, 2023). For a detailed description of the methodology used, we suggest reading Cardellini et al. (2003), who originally employed the gslib library (Deutsch and Journel, 1998) for similar computations.
In order to investigate the thermal-water origin of the Paleochori Bay and the eventual mixing processes between different sources, the concentration of Na and K in the porewater samples [from Khimasia et al. (2021)] are plotted against those of Mg in Figure 3. Samples are grouped according to the classification used in the original work of Khimasia et al. (2021) in “High Cl,” “Low Cl,” and “Background” samples (red, blue, and grey circles, respectively, in Figure 3 and the following Figures). Magnesium in a geothermal liquid equilibrates with the hosting-aquifer rocks and its concentration decreases with temperature according to water-rock equilibria (Giggenbach, 1988). At relatively high temperatures, such as >300°C, the equilibrium Mg content of a geothermal liquid approaches 0, if compared to that of seawater (∼1,330 mg·L−1 at the Paleochori Bay). Figure 3 shows that Na and K are negatively correlated with Mg, suggesting a mixing between seawater and a deep geothermal component more saline than seawater. However, many samples are scattered (e.g., the “Low Cl” samples) likely due to the occurrence of other processes that overlap with those produced by a simple mixing. A process that explains this behavior is the boiling of ascending thermal waters, which experience steam separation and condensation of the separated vapor into the overlying liquids. Steam separation increases the concentration of the solutes in the liquid, while steam condensation would produce the opposite effect. However, hydrothermal steam separation and vapor condensation do not modify the ratios among the considered solutes, since “pure” water is either added or removed (see Eq. 5). In fact, the Na/K ratio plotted against the Mg/K precisely distributes along a mixing line between seawater and a Mg-poor geothermal component (PGL, Paleochori Geothermal Liquid in Figure 3C). Assuming the Mg content of PGL equals to 0, a Na/K ratio of 3.78 is extrapolated at the intercept of the best fit regression line at Mg/K = 0 (Figure 3C). It is worth noting that the inferred PGL Na/K ratio agrees with both that measured in the geothermal liquids encountered by the deep wells at Milos (3.81 ± 0.31; Table 1), and that extrapolated through linear regression from data of hydrothermal fluids discharged from the Paleochori Bay vents (3.67–4.03; Figure 3D).
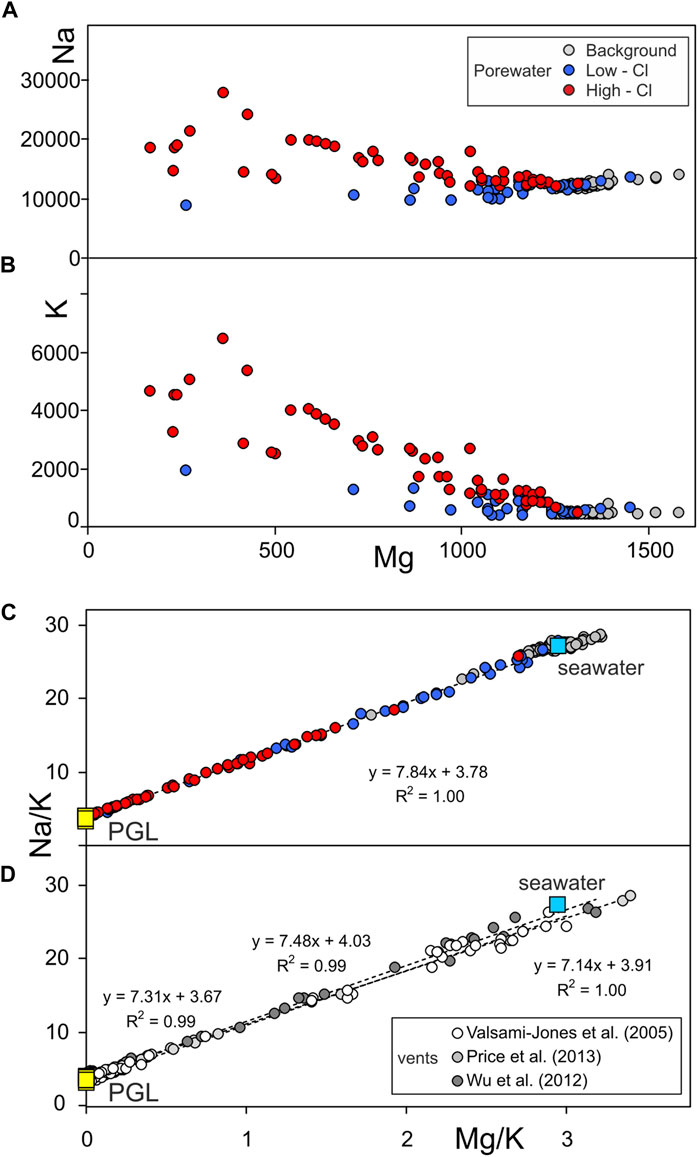
FIGURE 3. (A,B) Na and K contents of the Paleochori Bay pore waters plotted against Mg, and (C) Na/K vs. Mg/K. (C) The almost perfect alignment of the points in the Na/K vs. Mg/K diagram (C) indicates that these pore waters are binary mixtures between seawater and a geothermal liquid endmember. The extrapolation at the intercept Mg/K = 0 of the best linear regression line returns the Na/K of the Paleochori Geothermal Liquid (PGL) (see Section 3.1.1 for further explanation). The best linear fit refers to the High Cl samples. (D) Extrapolation from linear regression models of data of hydrothermal fluids discharged from vents (dashed lines) returns a PGL endmember [Na/K equals to 3.67, 4.03, and 3.91 for Valsami-Jones et al. (2005), Wu et al. (2012), and Price et al. (2012) data, respectively] consistent with that estimated through pore water samples (Na/K = 3.78).
We here estimate the PGL fraction and the amount of the vapor added or lost for each sample of the Paleochori Bay pore waters by applying the mass balance described in Section 2.2. Eqs 6, 7 can in fact be solved with respect to X and Y (XPGL and Yvap hereafter), given the concentrations of the 2 species i and j, namely, Na and K, in the endmembers. The seawater concentrations of Na and K were assumed as the mean of the 13 seawater samples from the Paleochori Bay (Khimasia et al., 2021). The Na concentration of PGL was assumed at 26,300 mg·L−1, i.e., that of the liquid of Milos 2 well at reservoir conditions (Table 1). The K concentration was computed at 6,960 mg·L−1 dividing the Na concentration by the estimated Na/K ratio of 3.78 (Figure 3C).
The validity of this model, i.e., the PGL equals to the Milos 2 liquid at reservoir conditions and the reliability of the computed XPGL and Yvap, was then tested with the following procedure. First, we corrected each porewater composition by eliminating the effect of the steam added or removed through the computed Yvap [i.e., the corrected concentration Ci,corrected = Ci,measured × (1+ Yvap)]. Then, we plotted the corrected concentrations versus XPGL (Figure 4), and we estimated the original concentrations in the pure geothermal component for each solute at XPGL = 1. The estimated concentrations of Cl, Ca, Mg, Sr, and Li for PGL are practically equal to those measured in the deep well Milos 2 (Figure 4). Both the high correlations and overlaps between estimated and measured concentrations of the geothermal component strongly support the reliability of the method, i.e., the used mass balance approach gives reliable XPGL and Yvap values. Furthermore, Figure 4 shows that the unmixed geothermal component at the Paleochori Bay is very similar to that of Milos 2 well and that Na, K, Cl, Ca, Mg, Sr, and Li behave as mobile species. It is worth nothing that, contrarily, SO4 and SiO2 are not conservative species. The estimated SO4 concentration of 608 mg·L−1 is in fact much larger than that of Milos 2 (10–18 mg·L−1), while SiO2 is much lower (Figure 4). This is of utmost importance for our aim of evaluating the conditions that favor hydrothermal explosions, as it highlights the extensive occurrence of two processes that contribute to form the impermeable cover of the hydrothermal system: (i) silica precipitation and (ii) addition of SO4 from H2S oxidation to sulfuric acid. The interaction of acidic solutions with the hosting rocks indeed causes the formation of the so-called advanced argillic alteration (kaolinite, alunite, gypsum, and so forth; Steiner, 1977). The development of these silica and clay caps enables fluid accumulation and pressure buildup in the subsurface.
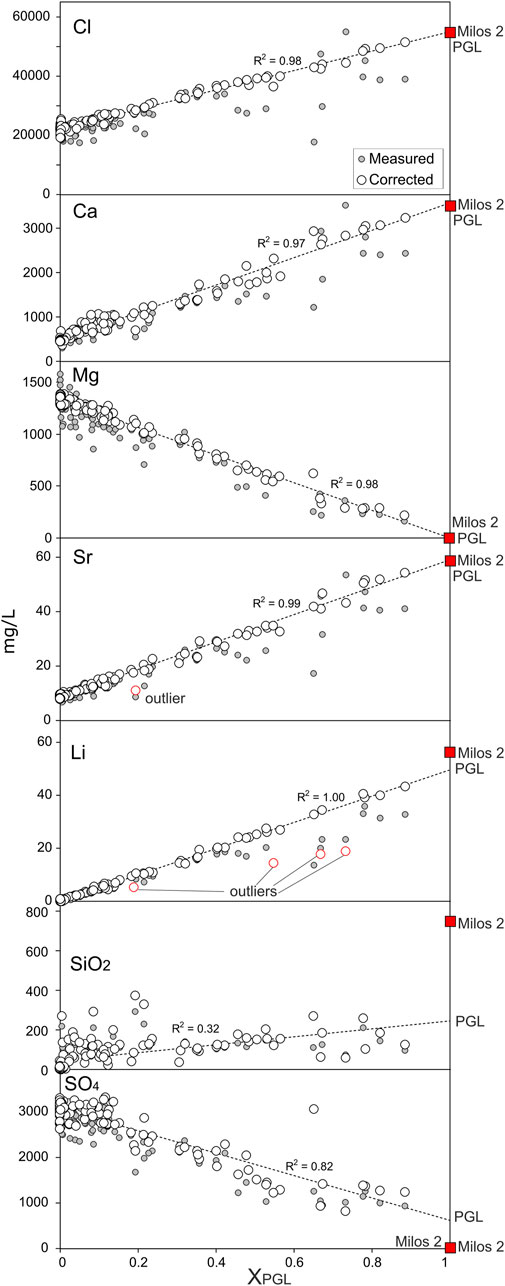
FIGURE 4. Solute concentrations of the Paleochori Bay pore waters (in mg·L−1) plotted against the fraction of the geothermal liquid endmember (XPGL). Grey circles reflect the measured concentration, while white circles are the concentration corrected from steam addition/removal (see Section 3.1.2). PGL composition is extrapolated from the best linear regression lines at XPGL = 1. The overlap between the Cl, Ca, Mg, Sr, and Li of PGL and Milos 2 well reveals that these elements behave as mobile species. On the other hand, the discrepancy between the SiO2 and SO4 estimated for the PGL endmember and that of Milos 2 well, likely reflects SiO2 removal and SO4 addition due to self-sealing processes (e.g., silica precipitation).
The very similar composition of PGL with that of the liquid of Milos 2 is also suggested by the stable isotopes of water, which are plotted against the XPGL values in Figure 5. To minimize the effects due to steam addition-separation in Figure 5, we only report the samples with −0.1 < Yvap < 0.1. These two independent variables also highlight the mixing between seawater (local Mediterranean water, δD = 9.5 ± 1.2; δ18O = 1.65 ± 0.15) and PGL, for which we estimated, from the best-fit regressions at XPGL = 1, a δD = −1.6‰ and a δ18O = 2.9‰. These values are very close to those reported for the fluids of the geothermal well Milos 2 (δD = −2.3‰ and δ18O = 3.2‰; Dotsika et al., 2009 and references therein).
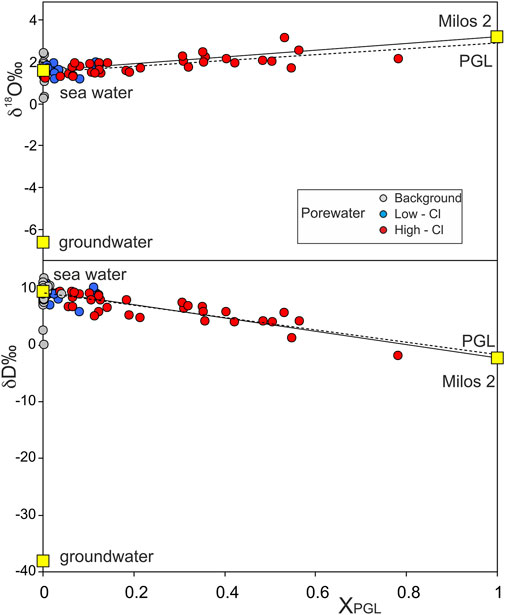
FIGURE 5. Stable isotopes of pore waters plotted against the fraction of the geothermal liquid endmember (XPGL). The graph only reports those samples affected by minor steam addition-removal (−0.1 < Yvap < 0.1). The solid line reflects a theoretical binary mixing between seawater and the measured composition of the Milos 2 liquid at reservoir conditions (yellow squares; Table 1, Dotsika et al., 2009). The dashed line is the best fit for the High Cl samples. The isotopic composition of PGL is extrapolated from this regression line at XPGL = 1.
The original temperature of PGL is investigated using the graphical approach based on the Na-K-Mg contents in Figure 6 (Giggenbach, 1988; Section 2.3). The Paleochori Bay pore waters plot along a mixing line between seawater and the PGL, whose Na and K concentrations are estimated at 26,300 and 6,960 mg·L−1, respectively (see Section 3.1.2). Figure 6 also shows mixing lines constructed using a PGL with different salinities (i.e., different Na contents). The Paleochori pore waters roughly overlap the curve with Na content of 26,300 mg·L−1, giving independent evidence of the validity of the Na content of Milos 2 as representative of that of the PGL. The Mg content, which in Figure 3C was assumed equal to 0, is here inferred through the binary mixing hyperbola method (Bini et al., 2022 and references therein) in the Na/Mg-Mg/K space (inset in Figure 6), using the High Cl waters (i.e., the most representative of the thermal component). Practically, we computed the Mg/K ratio of PGL as the vertical asymptote (0.0014 ± 0.0017) of the hyperbolic binary mixing between PGL and seawater (Figure 6). The Mg content is then estimated at 9.7 mg·L−1 by multiplying 0.0014 by the K content.
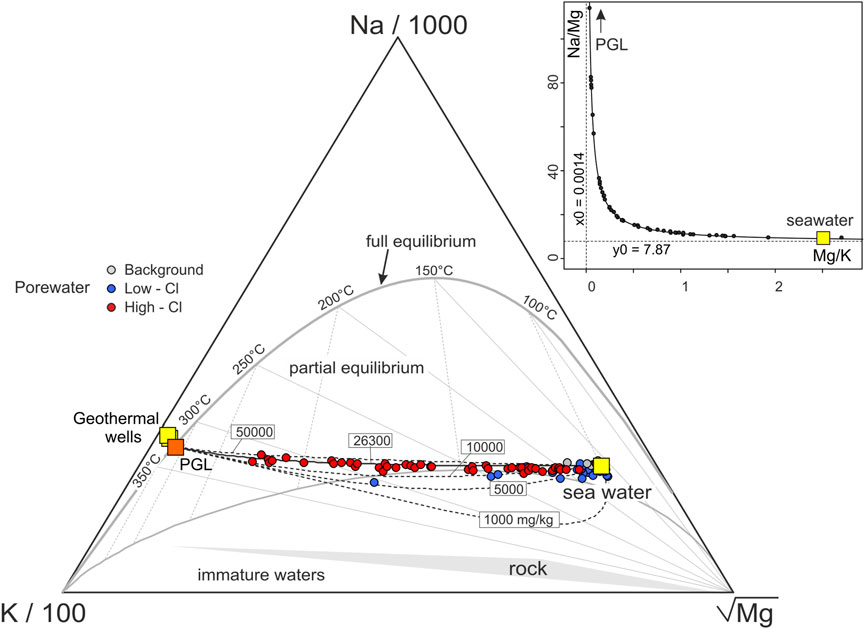
FIGURE 6. Na-K-Mg contents of the Paleochori Bay pore waters and their equilibrium temperatures [after Giggenbach (1988)]. Dashed curves reflect binary mixtures between seawater and a geothermal endmember (PGL) with different Na contents (i.e., salinity). The pore waters overlap the mixing curve corresponding to a Na concentration equals to 26,300 mg·L−1, that is that estimated for PGL in Section 3.1.2, together with its K content. The Mg content of PGL is estimated through the hyperbola method (Bini et al., 2022 and reference therein) in the inset. The High Cl pore waters plot on a hyperbolic binary mixing between a high Mg/K, low Na/Mg endmember (i.e., the seawater) and a low Mg/K, high Na/Mg endmember (i.e., a geothermal component). The Na/Mg of the PGL is then assumed equals to the vertical asymptote and used with the Na and K concentrations from Section 3.1.2 to calculate its Mg content. Notably, the estimated PGL composition plots on the full equilibrium curve at 324°C.
It is worth noting that this Na-K-Mg composition of the PGL plots on the full equilibrium curve (Figure 6), showing a temperature of 324°C. Notably, this high temperature estimated for PGL is supported by both direct temperature measurements (up to 323°C at ∼1,000 m depth in Milos 1; Figure 2; Mendrinos and Sullivan, 1987) and other geothermometers (Table 1). For example, the Na/Li geothermometer (Fouillac and Michard, 1981) returns a temperature of 321°C for PGL (Table 1).
Maps of temperature, fraction of geothermal component (XPGL), and steam added/removed from pore waters (Yvap; Figure 7), constructed using sequential Gaussian simulations (sGs; see Section 2.4), enable us to spatially constrain the ascent and decompressional boiling of geothermal fluids. All these three variables are spatially correlated (Figure 7), showing high values particularly in the western and central coastal sectors of the Paleochori Bay. The upflow of PGL predominantly occurs from the western part of the bay (Figure 7C), characterized by values of XPGL > 0.2 (Figure 7C). Notably, steam condensation processes, that is high Yvap values, focus on a few spots aligned along the NW-SE direction in the center of the bay, in correspondence of a known fault (Figure 7B).
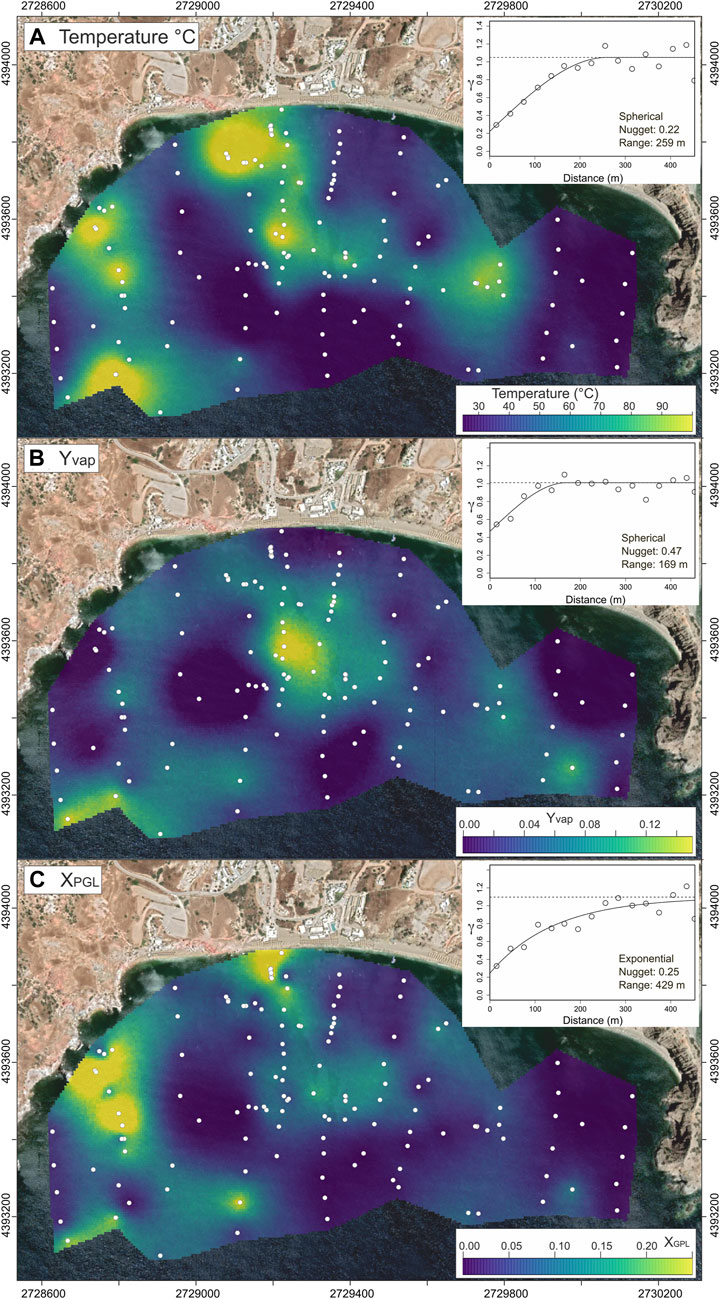
FIGURE 7. Maps of (A) pore water temperature [data from Khimasia et al. (2021)], (B) amount of steam added to the pore waters (Yvap, kg of steam per kg of pore water), and (C) fraction of PGL (XPGL) in the Paleochori Bay. The maps are the result of 1,000 sequential Gaussian simulations (sGs; Section 2.4) performed using the gstat (Pebesma, 2004) package for R (R Core Team, 2023). The values are simulated over a regular grid with a square cell of 5 m × 5 m according to the respective robust variogram models (insets). Background is from Google satellite imagery. Coordinates refer to WGS 84/UTM zone 35 N.
The chemical composition of the eight gas samples collected from both the Agia Kyriaki fumarolic vent (AK) and the submarine gas emissions at high temperatures (>100°C) in the Paleochori Bay (PA6, PA7, PA8, and PA9; Figure 1D) is reported in Table 2, together with a geothermal vapor of Milos (MIL) available from the literature (Giggenbach, 1997). The gas composition is dominated by CO2 with relatively high contents of H2S (2.4%–4%) and H2 (up to 2%). These high H2 contents in the Paleochori Bay submerged vents were also reported by other authors [up to 3% in Daskalopoulou et al. (2018) and Dando et al. (1995)]. Notably, the H2/CO2 ratio of PA7 and PA8 (0.01–0.02) does not significantly differ from that measured at AK (0.022) and MIL (0.018), where the steam (99.3% and 99.6%, respectively) is the main component. These high H2 contents, much higher than those normally measured in CO2-dominated gas emissions from geothermal fields (such as in Italy and Greece; Chiodini and Cioni, 1989; Daskalopoulou et al., 2018), suggest a steam-dominated gas phase separated through boiling, whose vapor is quickly removed in the “cold” submarine environment. This is further evidence of a boiling process at the Paleochori Bay, as previously shown by the many hydrothermal vents close to or above the boiling point (inset in Figure 2) and the composition of the pore waters (see Section 3.1).
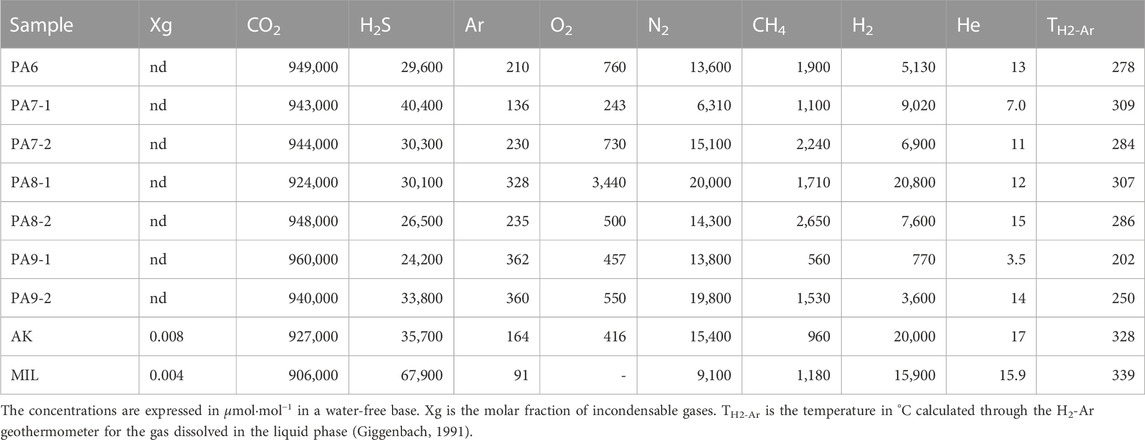
TABLE 2. Chemical composition of the submerged gas emissions (PA samples) from the Paleochori Bay, the Agia Kyriaki fumarole (AK), and that of a high-temperature geothermal vapor (MIL) discharged from a well [from Giggenbach (1997)].
Mixing between different gas sources is supported by the chemical composition of these gases, particularly by their content of chemically inert species, such as N2, He, and Ar. The relative composition of these species is reported in the N2-He-Ar triangular diagram (Giggenbach, 1996) of Figure 8 and compared with those of the air and air saturated water (ASW), or seawater. The submerged gas emissions plot between the composition of geothermal vapors (AK and MIL) and that of ASW. This trend reflects a thermal water variably mixed with seawater, which supplies to the gas phase, separated through boiling, N2, Ar, and He originally dissolved in the marine solutions (i.e., the ASW endmember). The gas samples collected in October 2021 thus represent the incondensable fraction of the vapor generated during the boiling of solutions formed by the mixing of seawater with a geothermal component. Notably, this binary mixing is also supported by the equilibrium temperature of the gases (TH2-Ar; Table 2; Figure 8), estimated through the H2-Ar geothermometer (Giggenbach, 1991) for a gas phase dissolved in liquid water. High TH2-Ar of 328°C–339°C, similar to those measured in the geothermal wells and estimated for PGL through the Na-K-Mg content of pore waters (Section 3.1.3), characterize the AK fumarole and the geothermal vapor MIL. On the other hand, submerged gas emissions show decreasing TH2-Ar down to 200°C, consistently with the addition of seawater (Figure 8).
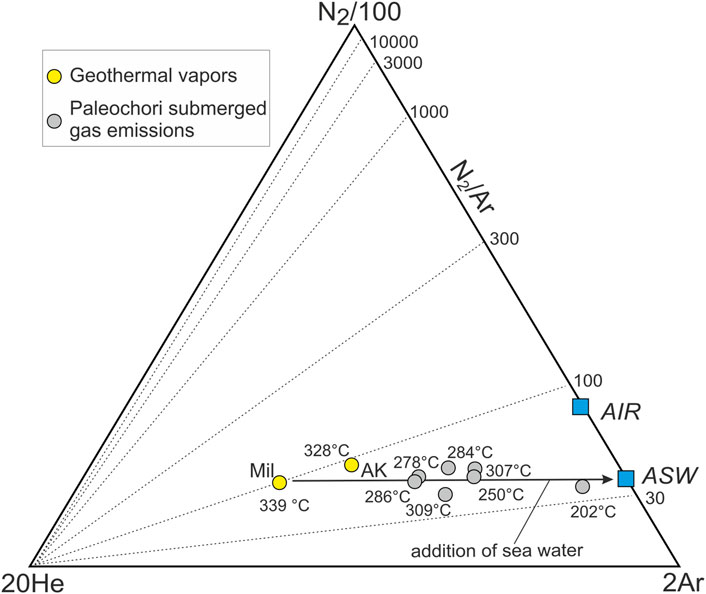
FIGURE 8. N2-Ar-He ternary diagram (Giggenbach, 1996) of the Paleochori Bay gases and Milos geothermal vapors. These gases exsolve through boiling of liquids formed through mixing of seawater (or ASW) with a geothermal component, such as Mil. Each sample also reports the correspondent equilibrium temperature estimated through the H2-Ar geothermometer of Giggenbach (1991).
Decompressional boiling and high flow rates of thermal springs in the subsurface of geothermal areas favor the occurrence of hydrothermal explosions. For example, many steam driven eruptions occurred in thermal areas of the Yellowstone National Park (United States), which discharge 3,000 L·s−1 of undiluted original geothermal liquid with an energy of ∼4.5–6 GW (Lowenstern and Hurwitz, 2008 and reference therein). Within these areas, emissions of vapors separated through the ascent and depressurization of thermal waters (decompressional boiling; Fournier, 1989) can be found nearby liquid discharges. A similar large emission of hot waters characterizes other Earth’s thermal zones, such as the Domuyo volcanic complex (North Patagonia, Argentina), where boiling thermal springs with a total discharge >1,000 L·s−1 and an advective heat flux > 1 GW (Chiodini et al., 2014) are accompanied by the emission of steam, separated from the ascending fluids. Numerous craters formed by hydrothermal explosions not only in the thermal areas of Yellowstone (Morgan et al., 2009) but also in those of Domuyo. There, two hydrothermal explosions occurred from the thermal zone named “El Humazo” (“The Great Smoke”) in February 2003, when a 300 m-high steam column was visible up to a distance of 20 km and the burst displaced rock blocks up to 1 ton (Mas et al., 2009).
Decompressional boiling and high-flow rate emission of thermal water are also evident in the Paleochori Bay, as suggested by our novel approach used to quantify and map this process. Although this case study is rather peculiar, since the hydrothermal site extends below the sea level, the usage of this new technique reveals that high-temperature geothermal fluids ascend, mix with seawater, and boil, causing steam loss and/or steam (condensate) addition. The flow rate of the hydrothermal fluids and the associated thermal energy release, although not precisely quantified, appear to be remarkably high, as shown by both the high soil temperatures of a large sector of the bay [Figure 7A; Figure 6 in Khimasia et al. (2021)] and two recent works (Khimasia et al., 2021; Puzenat et al., 2021). Khimasia et al. (2021) indeed estimated a hydrothermal liquid flow of ∼11,300 ± 1,100 m3·day−1, corresponding to a mass flow QL ∼ 131 kg·s−1. This estimate relies on the modeling of the advection and cooling of the hot solutions (average temperature Tr of 87.3°C; Khimasia et al., 2021) located at depth in the area characterized by bacterial mats, whose extensions was estimated at about 16,000 m2. Considering an ambient temperature (TSW; seawater temperature) of 20.1°C, we can compute an associated heat flow QH of 37 MW through the relation QH = QL × (hTR–hTSW) × 10−3, where hTr is the specific enthalpy of the liquid at Tr (365.6 kJ·kg−1) and hTSW is the specific enthalpy of the seawater (84.4 kJ·kg−1). A much higher heat flow was reported by Puzenat et al. (2021), who for the same zones of bacterial mats (White Hydrothermal Patches in Puzenat et al. (2021) estimated a value between 2,352 and 11,761 MW. This difference in orders of magnitude is mostly due to the vertical velocity of the fluids that was modeled at 0.004–0.01 mm·s−1 by Khimasia et al. (2021), while it was assumed to be of 1–5 mm·s−1 by Puzenat et al. (2021), based on the diffuse flow through bacterial mats in other areas.
This difference in the heat flow suggests that both estimates might not be accurate for the Paleochori Bay case. On one hand, Puzenat et al. (2021) likely overestimated the heat flow, which would be of the same order of magnitude, or higher, of the total heat flow at Yellowstone (4,500–6,000 MW; Lowenstern and Hurwitz, 2008 and references therein), where the numerous thermal areas (126) extend for 65 km2 (Vaughan et al., 2014). On the other hand, the estimate of Khimasia et al. (2021) is probably too low because (i) the area of bacterial mats is likely larger [e.g., Puzenat et al. (2021) doubled the value reported by Khimasia et al. (2021)], (ii) the emission of hot fluids also occurs outside the bacterial mat areas, and (iii) the flow rate of the vents was not considered. In any case, the heat flow associated with the upflow of hot liquids at the Paleochori Bay is significant and appears to be similar to that of a typical thermal area of Yellowstone [36–53 MW; computed from data in Vaughan et al. (2012) and Vaughan et al. (2014)].
Summing up, the high flow rate of the ascending high temperature (>300°C) geothermal liquids and their decompressional boiling are favorable conditions for the occurrence of hydrothermal explosions in the Paleochori Bay. This substantial amount of fluids and steam accumulates below clay and silica caps that naturally develop at the top of hydrothermal systems, due to advanced argillic alteration promoted by acidic fluid-rock reactions and silica precipitation. The fluid accumulation enables pressure buildup in the subsurface. Once the pressure reaches a critical threshold, which can be roughly considered higher than the hydrostatic pressure, the accumulated fluids decompress and rapidly expand into steam, breaking the impermeable cap and escalating in a violent explosion. The trigger of a hydrothermal explosion can imply either the simple pore pressure increase due to fluid accumulation, or be favored by a crustal permeability increase-pressure decrease due seismic events. The tectonically active area of the Aegean is a site of frequent earthquakes with significant magnitude. The erthquake-related permeability control on hydrothermal explosions has also been suggested for both Nisyros and Milos hydrothermal eruptions (Fytikas and Marinelli, 1976; Marini et al., 1993). Furthermore, evidence of an active process of self-sealing along the ascending path of the Paleochori thermal emission is provided by the loss of the SiO2 and the increase of SO4 with respect to the original geothermal liquids. These processes, together with the significant flow of high-temperature fluids and decompressional boiling, might set the ground for future hydrothermal explosions. We can thus hypothesize that these factors could have probably played a pivotal role in the numerous hydrothermal explosions that occurred at Milos in historical times, which could be fed by the same geothermal reservoir extending below the island nowadays. In addition, we cannot exclude that the fault controlling the NW-SE alignment of the Yvap anomalies (Figure 7B) could reflect hydrothermal explosions that occurred in the past.
This work aimed to investigate the physical-chemical processes affecting the submerged thermal waters of the Paleochori Bay, where a large data set of pore waters and vent compositions is available in the literature. In addition, we considered the chemical composition of gas emissions specifically sampled during a survey carried out in October 2021. Water and gas compositions indicate that the ascending high-temperature geothermal fluids mix with seawater and boil, causing steam loss and/or steam (condensate) addition. Through a new methodology based on mass balance equations, we simultaneously quantified the fraction of the original unmixed thermal component (PGL; XPGL) in the mixtures and the amount of steam added or removed from the solutions (Yvap). Among the obtained results, the most relevant are the maps of XPGL and Yvap, which enable us to spatially constrain the decompressional boiling of ascending fluids, and the computation of both chemical and isotopic compositions of PGL and its temperature (estimated at 325°C through the Na-K-Mg geothermometer). These compositions and temperature are practically the same of the liquids encountered downhole geothermal wells at 1.1–1.2 km depth, located a few km NW from the bay. The discrepancy between the SiO2 and SO4 contents in the estimated PGL and those measured in geothermal wells suggests the occurrence of an impermeable cap due to silica precipitation and argillic alteration, which favors fluid accumulation and pressure buildup. Fluid accumulation, the high discharge rates of the thermal component (thermal energy release likely >40 MW), and the occurrence of decompressional boiling point to critical conditions of the system, which could favor hydrothermal explosions. These events frequently occurred at Milos in the past and appear to be related to seismic activity. The new method proposed in this work can find valuable applications in the study of submerged hydrothermal systems and in understanding the physicochemical conditions leading to steam driven explosions.
The original contributions presented in the study are included in the article/Supplementary Material, further inquiries can be directed to the corresponding author.
GC: Conceptualization, Data curation, Formal Analysis, Investigation, Methodology, Writing–original draft, Visualization, Writing–review and editing. GB: Formal Analysis, Investigation, Writing–original draft, Writing–review and editing, Methodology, Visualization, Conceptualization. SM: Writing–original draft, Writing–review and editing, Investigation. SC: Formal Analysis, Investigation, Resources, Writing–review and editing. CK: Formal Analysis, Investigation, Writing–review and editing. FT: Formal Analysis, Investigation, Writing–review and editing. OV: Formal Analysis, Investigation, Writing–review and editing. GV: Funding acquisition, Writing–review and editing. OB: Funding acquisition, Writing–review and editing.
This research was supported by the HSGME Operational Program Competitiveness, Entrepreneurship and Innovation (2014–2020), Project “Studies and researches support to the energy sector, industry and entrepreneurship,” Sub-Project “Susceptibility assessment of landslides in the Greek territory-Volcanic study and risk assessment,” financed by the European Regional Development Fund, and by the Swiss National Science Foundation grant 200021_178928 to OB. Open access funding by ETH Zurich.
We thank Alessandro Santi from INGV Napoli, Osservatorio Vesuviano, for support during gas sample analyses. We acknowledge the authors that contributed to the published data sets, of excellent quality, which we used in this work. We would like to thank two reviewers EN and DM for their constructive comments on this manuscript, and LD for editorial handling.
The authors declare that the research was conducted in the absence of any commercial or financial relationships that could be construed as a potential conflict of interest.
All claims expressed in this article are solely those of the authors and do not necessarily represent those of their affiliated organizations, or those of the publisher, the editors and the reviewers. Any product that may be evaluated in this article, or claim that may be made by its manufacturer, is not guaranteed or endorsed by the publisher.
Appelo, C. A. J., and Postma, D. (1993). Groundwater, geochemistry and pollution. Rotterdam, Netherlands: Balkema.
Bini, G., Chiodini, G., Caliro, S., Tassi, F., Vaselli, O., Rizzo, A. L., et al. (2022). Nitrogen, helium, and argon reveal the magmatic signature of fumarole gases and episodes of outgassing from upper-crustal magma reservoirs: the case of the nisyros caldera (aegean arc, Greece). Geochimica Cosmochimica Acta 335, 68–84. doi:10.1016/j.gca.2022.08.028
Browne, P., and Lawless, J. (2001). Characteristics of hydrothermal eruptions, with examples from New Zealand and elsewhere. Earth Sci. Rev. 52, 299–331. doi:10.1016/s0012-8252(00)00030-1
Caliro, S., Viveiros, F., Chiodini, G., and Ferreira, T. (2015). Gas geochemistry of hydrothermal fluids of the S. Miguel and terceira islands, azores. Geochimica Cosmochimica Acta 168, 43–57. doi:10.1016/j.gca.2015.07.009
Cardellini, C., Chiodini, G., and Frondini, F. (2003). Application of stochastic simulation to CO2 flux from soil: mapping and quantification of gas release. J. Geophys. Res. 108, 2425. doi:10.1029/2002jb002165
Chiodini, G., and Cioni, R. (1989). Gas geobarometry for hydrothermal systems and its application to some Italian geothermal areas. Appl. Geochem. 4 (5), 465–472. doi:10.1016/0883-2927(89)90004-8
Chiodini, G., Liccioli, C., Vaselli, O., Calabrese, S., Tassi, F., Caliro, S., et al. (2014). The Domuyo volcanic system, an enormous geothermal resource in Argentine Patagonia. J. Volcanol. Geotherm. Res. 274, 71–77. doi:10.1016/j.jvolgeores.2014.02.006
Dando, P. R., Hughes, J. A., Leahy, Y., Niven, S. J., Taylor, L. J., and Smith, C. (1995). Gas venting rates from submarine hydrothermal areas around the island of Milos, Hellenic Volcanic Arc. Cont. Shelf Res. 15 (8), 913–929. doi:10.1016/0278-4343(95)80002-u
Daskalopoulou, K., Calabrese, S., Grassa, F., Kyriakopoulos, K., Parello, F., Tassi, F., et al. (2018). Origin of methane and light hydrocarbons in natural fluid emissions: A key study from Greece. Chem. Geol. 479, 286–301. doi:10.1016/j.chemgeo.2018.01.027
Deutsch, C. V., and Journel, A. G. (1998). Gslib: geostatistical software libraryand users guide. New York, NY, USA: Oxford Univ. Press.
Dotsika, E., Poutoukis, D., Michelot, J. L., and Raco, B. (2009). Natural tracers for identifying the origin of the thermal fluids emerging along the aegean Volcanic Arc (Greece): evidence of arc-type magmatic water (ATMW) participation. J. Volcanol. Geoth. Res. 179, 19–32. doi:10.1016/j.jvolgeores.2008.09.024
Fitzsimons, M. F., Dando, P. R., Hughes, J. A., Thiermann, F., Akoumianaki, I., and Pratt, S. M. (1997). Submarine hydrothermal brine seeps off Milos, Greece. Observations and geochemistry. Mar. Chem. 57 (3-4), 325–340. doi:10.1016/s0304-4203(97)00021-2
Fontaine, F. J., Rabinowicz, M., and Boulegue, J. (2003). Hydrothermal processes at Milos Island (Greek Cyclades) and the mechanisms of compaction-induced phreatic eruptions. Earth Planet. Sci. Lett. 210 (1-2), 17–33. doi:10.1016/s0012-821x(03)00103-1
Fouillac, C., and Michard, G. (1981). Sodium/lithium ratio in water applied to geothermometry of geothermal reservoirs. Geothermics 10 (1), 55–70. doi:10.1016/0375-6505(81)90025-0
Fournier, R. O. (1989). Geochemistry and dynamics of the Yellowstone national Park hydrothermal system. Annu. Rev. Earth Planet. Sci. 17, 13–53. doi:10.1146/annurev.ea.17.050189.000305
Fournier, R. O., Thompson, J. M., Cunningham, C. G., and Hutchinson, R. A. (1991). Conditions leading to a recent small hydrothermal explosion at Yellow stone National Park. Geol. Soc. Am. Bull. 103 (8), 1114–1120. doi:10.1130/0016-7606(1991)103<1114:cltars>2.3.co;2
Fytikas, M., Innocenti, F., Kolios, N., Manetti, P., Mazzuoli, R., Poli, G., et al. (1986). Volcanology and petrology of volcanic products from the island of Milos and neighbouring islets. J. Volcanol. Geotherm. Res. 28 (3–4), 297–317. doi:10.1016/0377-0273(86)90028-4
Fytikas, M., and Marinclli, G. (1976). Geology and geothermics of the island of Milos (Greece). NP-22876. Washington, D.C., USA: U.S. Department of Energy. doi:10.2172/5149399
Germanovich, L. N., and Lowell, R. P. (1995). The mechanism of phreatic eruptions. J. Geophys Res. 100, 8417–8434. doi:10.1029/94jb03096
Giggenbach, W. F. (1997). in The origin and evolution of fluids in magmatic-hydrothermal systems” in Geochemistry of hydrothermal ore deposits. Editor H. L. Barnes (New York, NY, USA: Wiley), 737–796.
Giggenbach, W. F. (1996). “Chemical composition of volcanic gases,” in Monitoring and mitigation of volcano hazards. Editors R. Scarpa, and R. I. Tilling (Berlin, Germany: Springer), 221–256.
Giggenbach, W. F. (1991). “Chemical techniques in geothermal exploration,” in Application of geochemistry in geothermal reservoir development. Editor F. D’Amore (New York, NY, USA: UNITAR), 119–144.
Giggenbach, W. F. (1988). Geothermal solute equilibria. Derivation of Na–K–Mg–Ca geoindicators. Geochim. Cosmochim. Acta 52, 2749–2765. doi:10.1016/0016-7037(88)90143-3
Karabelas, A. J., Andritsos, N., Mouza, A., Mitrakas, M., Vrouzi, F., and Christanis, K. (1989). Characteristics of scales from the milos geothermal plant. Geothermics 18 (1/2), 169–174. doi:10.1016/0375-6505(89)90024-2
Khimasia, A., Renshaw, C. E., Price, R. E., and Pichler, T. (2021). Hydrothermal flux and porewater geochemistry in Paleochori bay, milos, Greece. Chem. Geol. 571, 120188. doi:10.1016/j.chemgeo.2021.120188
Koutroupis, N. (1992). Update of geothermal energy development in Greece. Geotherrmics 21 (5/6), 881–890. doi:10.1016/0375-6505(92)90039-c
Liakopoulos, A., Athanassios, K., Markopoulos, T., and Boulegue, J. (1991). A mineralogical, petrographic and geochemical study of samples from wells in the geothermal field of Milos island (Greece). Geothermics 20 (4), 237–256. doi:10.1016/0375-6505(91)90035-t
Lowenstern, J. B., and Hurwitz, S. (2008). Monitoring a supervolcano in repose: heat and volatile flux at the Yellowstone caldera. Elements 4, 35–40. doi:10.2113/gselements.4.1.35
Marini, L., Principe, C., Chiodini, G., Cioni, R., Fytikas, M., and Marinelli, G. (1993). Hydrothermal eruptions of Nisyros (Dodecanese, Greece). Past events and present hazard. J. Volcanol. Geotherm. Res. 56, 71–94. doi:10.1016/0377-0273(93)90051-r
Mas, G. R., Bengochea, L., Mas, L. C., and Lopez, N. (2009). Hydrothermal explosion due to seal effect in el Humazo geothermal manifestation, Domuyo volcano, Neuquén, Argentina. Stanford, California: Thirty-Fourth Workshop on Geothermal Reservoir Engineering Stanford University.
Massaro, S., Vogioukalakis, G., Sulpizio, R., Lucchi, F., Tranne, C., Chiodini, G., et al. (2022). Historical hydrothermal explosive activity at Milos island, Greece. Abstr. Volume, Cities Volcanoes, Heraklion (Crete, Greece) 11, 12–17.
Mendrinos, D., and Sullivan, M. J. (December 1987). Modelling of the milos geothermal field in Greece. Proceedings of the 9th NZ geothermal workshop California, CA, USA.
Montanaro, C., Mick, E., Salas-Navarro, J., Caudron, C., Cronin, S. J., de Moor, J. M., et al. (2022). Phreatic and hydrothermal eruptions: from overlooked to looking over. Bull. Volcanol. 84, 64. doi:10.1007/s00445-022-01571-7
Montanaro, C., Scheu, B., Gudmundsson, M. T., Vogfjörd, K., Reynolds, H. I., Dürig, T., et al. (2016). Multidisciplinary constraints of hydrothermal explosions based on the 2013 Gengissig lake events, Kverkfjöll volcano, Iceland. Earth Planet. Sci. Lett. 434, 308–319. doi:10.1016/j.epsl.2015.11.043
Morgan, L. A., Shanks, W. C., and Pierce, K. L. (2009). Hydrothermal processes above the Yellowstone magma chamber: large hydrothermal systems and large hydrothermal explosions. Geol. Soc. Am. Special Pap. 459, 1–95. doi:10.1130/2009.2459
Muffler, L. J. P., White, D. E., and Truesdell, A. H. (1971). Hydrothermal explosion craters in Yellowstone national Park. Geol. Soc. Am. Bull. 82, 723–740. doi:10.1130/0016-7606(1971)82[723:heciyn]2.0.co;2
Pebesma, E. J. (2004). Multivariable geostatistics in S: the gstat package. Comput. Geosciences 30, 683–691. doi:10.1016/j.cageo.2004.03.012
Price, R. E., Savov, I., Planer-Friedrich, B., Bühring, S. I., Amend, J., and Pichler, T. (2013). Processes influencing extreme as enrichment in shallow-sea hydrothermal fluids of Milos island, Greece. Chem. Geol. 348, 15–26. doi:10.1016/j.chemgeo.2012.06.007
Puzenat, V., Escartín, J., Martelat, J. E., Barreyre, T., Le Moine Bauer, S., Nomikou, P., et al. (2021). Shallow-water hydrothermalism at milos (Greece): nature, distribution, heat fluxes and impact on ecosystems. Mar. Geol. 438, 106521. doi:10.1016/j.margeo.2021.106521
R Core Team (2023). R: A language and environment for statistical computing. Vienna, Austria: R Foundation for Statistical Computing. https://www.R-project.org/.
Roberts, H., Price, R., Brombach, C. C., and Pichler, T. (2021). Mercury in the hydrothermal fluids and gases in Paleochori Bay, Milos, Greece. Marine Chemistry, 233, 103984. doi:10.1016/j.marchem.2021.103984
Rosi, M., Di Traglia, F., Pistolesi, M., Ongaro, T. E., Vitturi, M. D. M., and Bonadonna, C. (2018). Dynamics of shallow hydrothermal eruptions: new insights from vulcano’s breccia di Commenda eruption. Bull. Volcanol. 80 (12), 83. doi:10.1007/s00445-018-1252-y
Smith, T., and McKibbin, R. (May 2000). An investigation of boiling processes in hydrothermal eruptions, in Proceedings of the world geothermal congress, v. 1, Kyushu, Japan.
Stearns, H. T., and Macdonald, G. A. (1946). Geology and ground-water resources of the island of Hawaii. Hawaii Div. Hydrogr. Bull. 9, 1–363. Available at: https://scholarspace.manoa.hawaii.edu/server/api/core/bitstreams/c56b8d7a-4cea-4573-bd3d-64e997e1e5c9/content.
Stewart, A. L., and McPhie, J. (2006). Facies architecture and Late Pliocene–Pleistocene evolution of a felsic volcanic island, Milos, Greece. Bull. Volcanol. 68, 703–726. doi:10.1007/s00445-005-0045-2
Steiner, A. (1977). The Wairakei Geothermal Area, North Island, New Zealand: its subsurface geology and hydrothermal rock alteration. New Zealand Geological Survey, 90–134.
Stix, J., and de Moor, J. M. (2018). Understanding and forecasting phreatic eruptions driven by magmatic degassing. Earth, Planets Space 70, 83–19. doi:10.1186/s40623-018-0855-z
Traineau, H., and Dalabakis, P. (1989). Mise en evidence d’une eruption phreatique historique sur l’ile de Milos (Grece). CR Acad. Sci. Paris, 1–38. Available at: https://www.researchgate.net/publication/262944019_Traineau_H_Dalabakis_P_1989_Mise_en_evidence_d%27une_eruption_phreatique_historique_sur_l%27ile_de_Milos_-_GR_C_R_Acad_Sc_Paris_t_308_serie_II_p_247-252.
Valsami-Jones, E., Baltatzis, E., Bailey, E. H., Boyce, A. J., Alexander, J. L., Magganas, A., et al. (2005). The geochemistry of fluids from an active shallow submarine hydrothermal system: milos island, hellenic volcanic Arc. J. Volcanol. Geotherm. Res. 148, 130–151. doi:10.1016/j.jvolgeores.2005.03.018
Vaughan, R. G., Heasler, H., Jaworowski, C., Lowenstern, J. B., and Keszthelyi, L. P. (2014). Provisional maps of thermal areas in Yellowstone National Park, based on satellite thermal infrared imaging and field observations. U.S. Geol. Surv. Sci. Investig. doi:10.3133/sir20145137
Vaughan, R. G., Keszthelyi, L. P., Lowenstern, J. B., Jaworowski, C., and Heasler, H. (2012). Use of ASTER and MODIS thermal infrared data to quantify heat flow and hydrothermal change at Yellowstone National Park. J. Volcanol. Geotherm. Res. 233–234, 72–89. doi:10.1016/j.jvolgeores.2012.04.022
Wu, S. F., You, C. F., Valsami-Jones, E., Baltatzis, E., and Shen, M. L. (2012). Br/Cl and I/Cl systematics in the shallow-water hydrothermal system at Milos Island, Hellenic Arc. Mar. Chem. 140, 33–43. doi:10.1016/j.marchem.2012.07.004
Keywords: geothermal systems, submerged hydrothermal vents, hydrothermal explosions, decompressional boiling, geothermometry
Citation: Chiodini G, Bini G, Massaro S, Caliro S, Kanellopoulos C, Tassi F, Vaselli O, Vougioukalakis G and Bachmann O (2023) Ascent and decompressional boiling of geothermal liquids tracked by solute mass balances: a key to understand the hydrothermal explosions of Milos (Greece). Front. Earth Sci. 11:1254547. doi: 10.3389/feart.2023.1254547
Received: 07 July 2023; Accepted: 25 September 2023;
Published: 10 October 2023.
Edited by:
Luca De Siena, Johannes Gutenberg University Mainz, GermanyReviewed by:
Eugenio Nicotra, University of Calabria, ItalyCopyright © 2023 Chiodini, Bini, Massaro, Caliro, Kanellopoulos, Tassi, Vaselli, Vougioukalakis and Bachmann. This is an open-access article distributed under the terms of the Creative Commons Attribution License (CC BY). The use, distribution or reproduction in other forums is permitted, provided the original author(s) and the copyright owner(s) are credited and that the original publication in this journal is cited, in accordance with accepted academic practice. No use, distribution or reproduction is permitted which does not comply with these terms.
*Correspondence: G. Bini, Z2l1bGlvLmJpbmlAaW5ndi5pdA==
Disclaimer: All claims expressed in this article are solely those of the authors and do not necessarily represent those of their affiliated organizations, or those of the publisher, the editors and the reviewers. Any product that may be evaluated in this article or claim that may be made by its manufacturer is not guaranteed or endorsed by the publisher.
Research integrity at Frontiers
Learn more about the work of our research integrity team to safeguard the quality of each article we publish.