 Weiyun Zhan1
 Chenxi Liu
 Dongming Zhang
- 1Exploration and Development Research Institute of PetroChina Southwest Oil and Gas Field Company, Chengdu, China
- 2College of Resources and Security, Chongqing University, Chongqing, China
With the gradual decline of natural gas production, reserve upgrading has become one of the important issues in natural gas exploration and development. However, the traditional reserve upgrade forecasting method is often based on experience and rules, which is subjective and unreliable. Therefore, a prediction method based on neural network is proposed in this paper to improve the accuracy and reliability of reserve upgrade prediction. In order to achieve this goal, by collecting the relevant data of natural gas exploration and development in Sichuan Basin, including geological parameters, production parameters and other indicators, and processing and analyzing the data, the relevant characteristics of reserves increase are extracted. Then, a neural network model based on multi-layer perceptron (MLP) is constructed and trained and optimized using backpropagation algorithm. The results show that the prediction accuracy of the constructed neural network model can reach more than 90% and can effectively predict the reserve upgrading. Experiments show that the model has high accuracy and reliability, and is significantly better than the traditional prediction methods. The method has good stability and reliability, and is suitable for a wider range of natural gas fields.
1 Introduction
With the continuous development of the global economy and the increasing demand for sustainable energy, natural gas has gradually become a mainstream choice as a clean, efficient, and renewable energy source. This article focuses on the Sichuan Basin, one of China’s important natural gas production bases. The Sichuan Basin ranks among the top in terms of total natural gas resources, characterized by abundant gas reservoirs (Figure 1). Over 200 gas fields and gas-bearing structures have been discovered in the region, forming the main exploration and development areas, including the Sichuan central gas zone dominated by deep conventional gas and continental tight gas, the Sichuan southern gas zone dominated by shale gas, the Sichuan eastern gas zone dominated by medium-to-high sulfur gas reservoirs, and the Sichuan western gas zone dominated by ultra-deep conventional gas and volcanic rock gas reservoirs. As of 2021, the proven natural gas reserves in the Sichuan Basin reached around 4.7 trillion cubic meters, accounting for approximately 13.6% of the national total, with an annual gas production exceeding 35 billion cubic meters, representing nearly 17% of the national total.
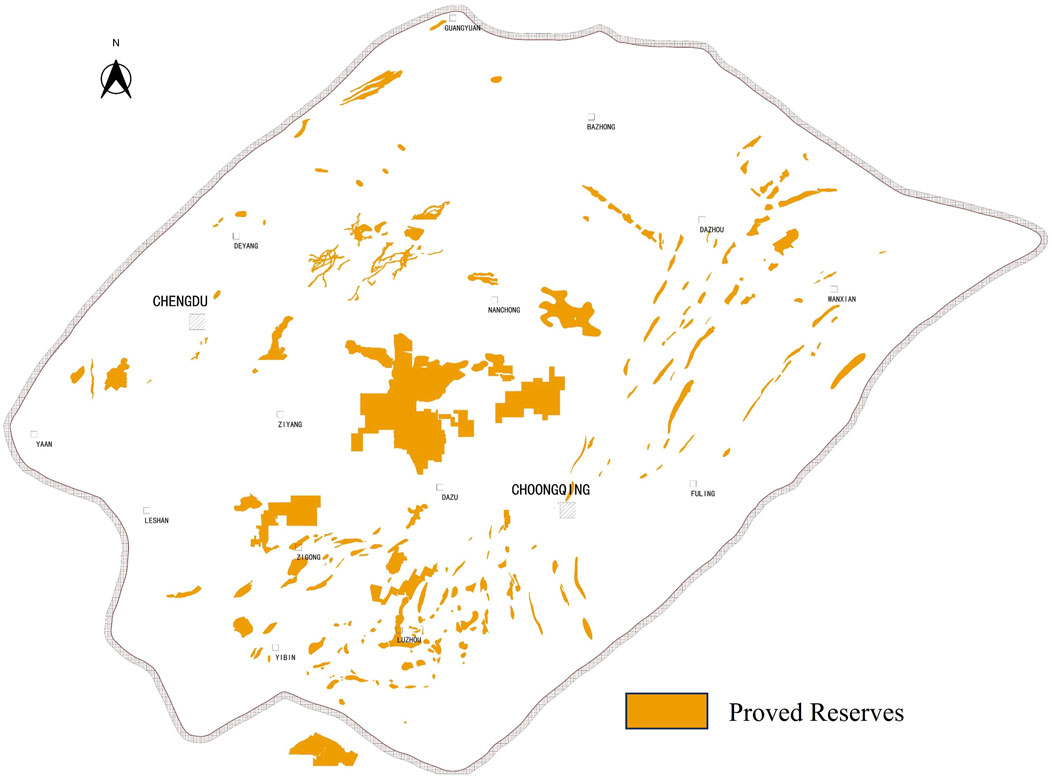
FIGURE 1. Natural gas exploration results in sichuan basin.
The natural gas industry in the Sichuan Basin has a long history of development. In the early 1950s, exploration and development of natural gas began in the southern part of Sichuan, marking the start of large-scale exploration and development in the basin. Over the following decades, with continuous improvement in exploration and development technologies and the expansion of exploration areas, the natural gas resources in the basin have been efficiently developed and utilized, leading to the establishment of the country’s first complete natural gas industrial system. Currently, the natural gas business in the Sichuan Basin is in a phase of rapid development, with continuous breakthroughs in theoretical and technological advancements. Gas reserves and production have entered a period of rapid growth, and the quality of reserves is continuously improving. It is expected that more major gas fields will be discovered, and the natural gas industry will enter a new golden period. With the increasing demand for new and clean energy, the future development prospects of natural gas in the Sichuan Basin will be even broader, with the potential to become a world-class natural gas production and supply base.
In the development of the natural gas industry, accurate prediction of the upgrading of low-grade reserves is crucial as it directly impacts the decision-making process for the deployment of natural gas exploration and development, thereby significantly influencing the efficiency and economic benefits of gas extraction. Recent studies have shown that China has largely achieved its goals in the second round of oil and gas exploration, and remaining economically recoverable reserves and production are starting to decline. Therefore, in addition to enhancing production and cost-effectiveness in mature oil regions, it is even more important to strategically explore new areas and domains to ensure the sustained development of natural gas production. Consequently, how to predict the upgrading of low-grade natural gas reserves more accurately will be an important research direction in the field of natural gas exploration and development. (Li, 2021).
There are many factors affecting the upgrading of natural gas reserves, so in-depth analysis of relevant indicators should be carried out in the prediction of the upgrading of natural gas reserves. The composition can be analyzed from a microscopic perspective. For example, the chemical microstructure of rock samples has been quantitatively analyzed by using element analyzer, X-ray diffraction instrument and Fourier infrared spectrometer, including the reverse of the chemical composition of elements, organics and functional groups. (Liu and Li, 2022). We can also test the pore structure and fractal characteristics under different rocks, as well as the changes of the specific surface area of BET, BJH total pore and adsorption pore, and study the influence of natural gas porosity on the scale of natural gas reserve upgrading (Liu et al., 2023a). Liu et al. (2022) pointed out that the splints and permeability changed by CO2 injection are the key issues to improve the production of coalbed methane and the geological storage of CO2 to coal seams, indicating that permeability also determines the scale of gas reserve upgrading. Liu et al. (2023b) conducted an experimental study on the ground stress and permeability and found that when the deviator stress was applied parallel to the plywood in coal, the intermediate stress had a greater impact on the permeability reduction, so the prediction of natural gas reserves upgrading should be considered in many aspects. A key evaluation index for the upgrading of natural gas reserves is 3D seismic monitoring, but seismic data are affected by multiple indicators at the same time. Xue et al. found that seismic attenuation has a great impact on the reduction of seismic data resolution and the increase of main frequency period. Xue et al. (2023) proposed a seismic absorption coefficient estimation method based on quantum mechanics to detect hydrocarbons, and used model and field data. The results show that the proposed method has great potential for oil and gas detection. Xue et al. (2022b) also proposed a stable seismic Q estimation method based on quantum mechanics signal representation. Compared with traditional methods, the Q estimation method based on quantum mechanics shows higher stability and noise robustness. The effectiveness and superiority of the proposed method are verified by synthetic and field data application. Q estimation methods based on quantum mechanics provide a new field and a complementary method for measuring seismic attenuation. At the same time, relevant numerical simulation software can be used to analyze natural gas reserves combined with on-site data. (Xue et al., 2022a; Liu et al., 2023c; Zhang et al., 2023).
In order to achieve the purpose of upgrading and predicting natural gas reserves, many scholars at home and abroad have conducted in-depth research on this topic. Liu et al. (2018) conducted detailed modeling and description of the gas-bearing effective sand bodies based on the geological characteristics of a certain gas field. They also studied and determined the classification evaluation criteria for reservoirs and the volumetric method for reserve recalculation. Additionally, they have developed a reservoir evaluation technology based on well network control, specifically suitable for this type of gas reservoir. Furthermore, they researched and formulated a fine evaluation method for the stable production potential of the gas field by combining multiple factors. Shi et al. (2021) first employed the Distance-based Comprehensive Evaluation Method (TOPSIS) to evaluate the geological factors influencing reserve upgrade. This method was applied to clastic reservoirs in the Bohai Bay Basin, resulting in the selection of 11 blocks with upgrade potential and achieving favorable application effects. Furthermore, corresponding upgrade strategies were proposed for blocks expected to be upgraded in the near future. Li et al. (2021a) conducted an analysis of the status of upgraded reserves and studied methods for determining reasonable initial production rates and decline rates. They established a two-tier standard for controlling reserve upgrade from contingent resources to proved reserves in deep, low-permeability sand and conglomerate reservoirs under different geological conditions and oil prices. This enabled the evaluation of reserve upgrades. Sun et al. (2017) studied the upgrading patterns and characteristics of oil-controlled reserves in complex fault block reservoirs by comparing the upgrading rates, upgrading coefficients, and conversion rates of different reservoirs. This research provides a reliable basis for making exploration and development strategic decisions. Xiao et al. (2021) found that low-grade reserves are characterized by complex geological conditions, strong reservoir heterogeneity, limited data availability, and limitations in understanding at different stages, leading to poor performance of conventional evaluation methods. To address these issues, they developed a quantitative uncertainty-based method for evaluating the potential of reserve upgrade and utilization. Zhang (2007) proposed an evaluation method for assessing the risk of reserve upgrade by comparing before and after the reserve upgrade. The method involves utilizing cumulative probability graphs to analyze the final upgraded proved reserves data, including controlled reserves, predicted reserves, and trap resources in the Jiyang Depression. A risk evaluation chart for upgrading lower-level reserves to proved reserves was established. Based on the analysis of the characteristics of controlled reserve upgrade, Cui (2013) studied the influencing factors of reserve upgrade. Utilizing statistical methods, the research clarified the potential for reserve upgrade of un-upgraded controlled reserves. The results showed that production capacity, reservoir properties, and crude oil properties are key factors that constrain the upgrade of controlled reserves. Zhang et al. (2018) focused on the Su 14 Block, Box 8, and Shan 1 Formation in the Sulige Gas Field. They employed the volumetric method to recalculate the reserves of the target layer. Taking into account the existing well network conditions and different degrees of well network control, they used different methods to calculate the geological reserves that have been produced under different well network conditions. The scale and distribution of the produced geological reserves were established in this study, thereby achieving reserve evaluation.
According to the survey conducted on the research status, it has been found that the majority of studies on reserve upgrading primarily rely on traditional reserve upgrading prediction methods. These methods are mainly based on statistical techniques and empirical formulas, such as Kriging interpolation, variogram analysis, and regression analysis. Although these methods are straightforward and practical, their predictive performance is often unstable and unreliable due to factors such as data quality and subjective human influence. Therefore, finding more accurate and reliable prediction methods has become a current research hotspot and challenge.
In recent years, artificial intelligence (AI) technology has been widely applied in the field of natural gas reserve upgrading prediction. Neural networks, as AI methods with nonlinear mapping capabilities, exhibit strong adaptability and generalization, and have been extensively used in reserve upgrading prediction. Compared to traditional statistical methods, neural network methods can better explore data features, improving prediction accuracy and reliability. However, there are still some challenges and issues in current research. On one hand, existing studies often rely on a single neural network structure for prediction, lacking comparative analysis of multiple neural network architectures. On the other hand, comprehensive evaluations of model performance, stability, and reliability in predicting effectiveness are lacking in current research.
Therefore, we aim to construct a neural network-based reserve upgrading prediction model specifically for the Sichuan Basin natural gas field. Multiple indicator data will be collected and processed, relevant features for reserve upgrading will be extracted, and a multilayer perceptron (MLP) neural network model will be built. The model will be further optimized and trained. Additionally, comprehensive evaluations of the model’s performance, including stability, prediction accuracy, and reliability, will be conducted. Validation and comparative analysis of the model will be carried out using methods such as cross-validation and error analysis to enhance prediction accuracy and reliability. The goal is to provide a novel and efficient method for natural gas reserve upgrading prediction, offering scientific and reliable technical support for gas exploration and development.
2 Determination of factors influencing natural gas reserves
2.1 Analysis of factors influencing the upgrade of natural gas reserves
2.1.1 Cluster analysis method
Cluster analysis is a commonly used unsupervised learning method that discovers the underlying structure and patterns in data by grouping similar data points together. In the study of natural gas production upgrading, analyzing the influencing factors is crucial for achieving the desired objectives. However, the influencing factors vary among different gas reservoirs. To achieve more accurate predictions of natural gas reserve upgrades, a pre-processing step using cluster analysis is performed on the target gas reservoirs to classify them into distinct clusters. Subsequently, predictions of natural gas reserve upgrades based on BP neural networks are conducted separately for each cluster. The principle of cluster analysis primarily involves identifying production data with similar characteristics and categorizing them into clusters. (Khater et al., 2020; Marietta et al., 2023).
The commonly used formulas in cluster analysis are distance formulas and similarity coefficient formulas. Distance formulas are used to calculate the distance between two data points, enabling the determination of whether they belong to the same cluster during the clustering process. Common distance formulas include Euclidean distance, Manhattan distance, and Chebyshev distance, which are calculated as follows:
Euclidean distance:
Manhattan distance:
Chebyshev distance is a commonly used distance metric method that extends from the Euclidean distance and is used to calculate the distance between two vectors in multi-dimensional space. Chebyshev distance:
In the formula,
The similarity coefficient formulas are used to measure the similarity between two data points and are commonly employed in calculating similarity matrices in clustering methods, enabling the selection of the most similar data points for aggregation during the clustering process. Common similarity coefficient formulas include the inverse of Euclidean distance and cosine similarity, which are calculated as follows:
The inverse of Euclidean distance:
Cosine similarity:
In the formula,
By using the aforementioned formulas, different influencing factors such as porosity, permeability, sedimentary microfacies, well control degree, etc., are employed as indicators in the clustering analysis. The existing natural gas reservoirs are subjected to cluster analysis, and the similar and correlated reservoirs are grouped together to achieve the preprocessing of natural gas reservoirs, laying the foundation for subsequent predictions of reservoir capacity upgrading. The main steps involved are as follows:
(1) Data collection: Gather data related to natural gas production, such as geological structures, well control degree, 3D seismic data, and other relevant information.
(2) Data preprocessing: Perform data preprocessing techniques including filtering, transformation, and normalization to eliminate noise and unnecessary information in the influencing factor data.
(3) Determine the number of clusters: Select an appropriate number of clusters, usually determined through experimentation.
(4) Choose a clustering algorithm: Select a suitable clustering algorithm. In this study, the clustering algorithm based on Chebyshev distance and K-means is used.
(5) Perform cluster analysis: Utilize the chosen clustering algorithm to divide the data into several clusters, where each cluster represents a group of data points with similar characteristics.
(6) Interpret the clustering results: Analyze and interpret the clustering results, identifying the features and differences among each cluster, and further infer the factors influencing reservoir capacity upgrading.
(7) Validate the clustering results: Compare the clustering results with the actual situation to verify the effectiveness of the cluster analysis.
Among these steps, conducting the cluster analysis in step 5 is crucial for this research. The main workflow of this step is as follows (Figure 2):
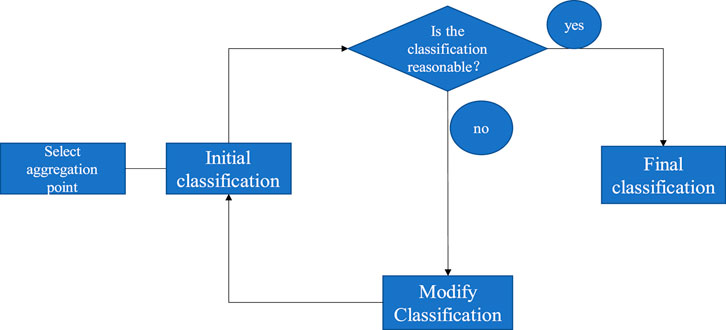
FIGURE 2. Cluster analysis flowchart.
Through cluster analysis, potential patterns and similarities in natural gas production data can be discovered. The selected indicators for this cluster analysis include sedimentary microfacies, porosity, permeability, reservoir type, reservoir thickness, effective reservoir thickness, reservoir continuity, fracture development, gas reservoir type, geological reserves, technically recoverable reserves, geological reserve abundance, recoverable reserve abundance, seismic exploration, well control per km2/well, stable production at kilometer well depth, and well average. By performing cluster analysis on these reservoir indicators, preprocessing of experimental data is achieved. The cluster analysis may reveal significant correlations between reservoir thickness and reserves in certain regions, while other regions may be influenced more by geological structures and wellhead pressure. These results can provide reference for decision-making in natural gas extraction and production. Due to the abundance of production data in gas reservoir areas, only partial cluster results are presented below (Figure 3):
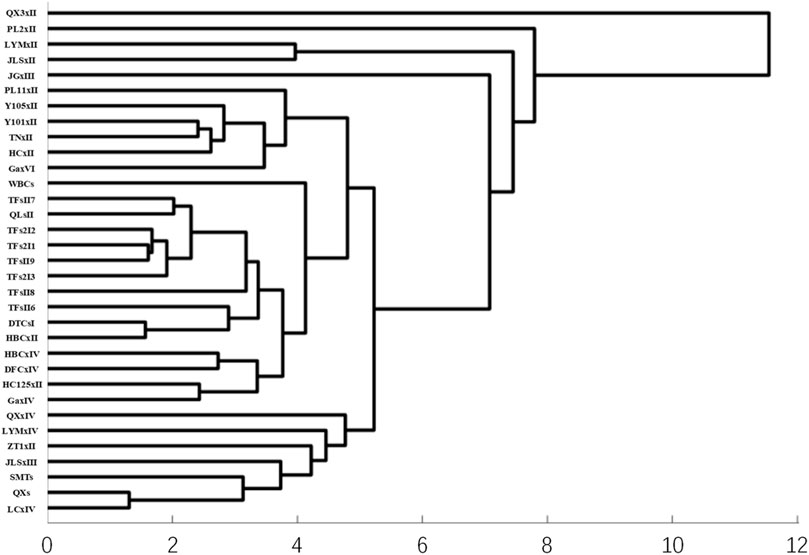
FIGURE 3. Cluster analysis results.
From the graph, it can be visually observed that clustering multiple natural gas reservoirs results in different grouping patterns. Several grouping experiments have been conducted based on actual conditions, and it has been determined that the data preprocessing is more effective when the number of groups is set to four. Next, the research object data will be subjected to cluster analysis in order to reduce the error in predicting the scale of natural gas reserve upgrades caused by significant differences between groups.
2.1.2 The Analytic Hierarchy Process
The Analytic Hierarchy Process (AHP) is a systematic analysis method developed by American mathematician Thomas L. Saaty in the early 1970s. Its core involves decomposing complex problems into hierarchical structures, conducting pairwise comparisons at each level, and ultimately determining the weights or priority ranking of the problem elements. It is a mathematical method used for analyzing complex decision-making problems. In this study, the AHP is utilized to assess the accuracy of the natural gas reserve upgrading prediction model. The principle is to determine the weights of various factors using the AHP, eliminating insignificant factors that have minimal impact on reserve upgrading, and comparing these weights with those derived from the neural network. This comparison helps to determine the accuracy of the neural network predictions. (Shadmaan and Islam, 2021; Redfoot et al., 2022).
First, the hierarchical structure of the influencing factors is determined and decomposed into multiple levels and factors. Then, expert judgments and the Analytic Hierarchy Process (AHP) are used to compare and evaluate the importance of each factor at each level, ultimately determining the contribution of each factor to the objective, i.e., the degree of influence of each factor on the natural gas reserve upgrading.
In the AHP, when assessing the hierarchical structure model based on expert judgments, it is necessary to calculate the consistency ratio to ensure the accuracy and reliability of the judgment experiment results. The formula for calculating the consistency ratio is as follows:
Among them, CI is a consistency indicator and RI is a random consistency indicator. The specific calculation formula is as follows:
Among them,
Among them, A is the judgment matrix, and
For the judgment of consistency ratio, if
Since the impact of influencing factors on natural gas reserve upgrading varies across different blocks, the application of the Analytic Hierarchy Process (AHP) is initiated to determine the impact of factors on the results. The following steps are involved when using the AHP to solve the problem:
(1) Determine the hierarchical structure model of the problem: decompose the factors affecting the scale of natural gas reserves upgrade layer by layer, and build a hierarchical structure model.
(2) Construct a paired comparison matrix: For the influencing factors at each level, compare the influencing factors at the next level in pairs to obtain the relative importance degree between each factor, and construct a paired comparison matrix.
(3) Calculation of eigenvectors: For each pairwise comparison matrix of influencing factors, its eigenvectors are solved and normalized.
(4) Calculate the consistency index: calculate the consistency index of the pair comparison matrix, which is used to judge whether the constructed comparison matrix is reasonable.
(5) Solving the weight vector: the weight value of the influencing factors of natural gas is obtained by weighted average of the eigenvectors of each pair comparison matrix.
(6) Consistency test: test whether the calculated weight value is consistent.
The schematic diagram of the Analytic Hierarchy Process is as follows (Figure 4):
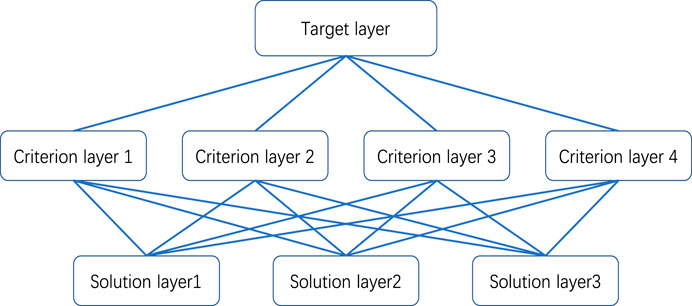
FIGURE 4. Schematic diagram of Analytic Hierarchy Process.
Through the above steps, the weight value of each factor in natural gas production upgrading can be obtained, so as to determine the importance of each factor to natural gas production increase. According to the results of cluster analysis, the cluster groups were divided into group A, Group B, group C and group D, and the weight of influencing factors in each group was calculated respectively to determine the influence degree of each influencing factor on each group. The factors that have the least influence on the increase of natural gas reserves are eliminated, and the remaining factors are processed. Table 1 shows an example of the results for a group of reservoirs:

TABLE 1. Weight table of influencing factors for each group.
Due to the significant differences among the groups of reservoirs and the varying degrees of impact of each influencing factor on reserve upgrading within each group, it is important to have a clear understanding of the proportion of each influencing factor within each group, as shown in Figure 5. This will also aid in further validating the accuracy of the neural network in subsequent analysis.

FIGURE 5. Weight chart of influencing factors. (A) Group A. (B) Group B. (C) Group C. (D) Group D.
From the table, it can be observed that the degree of influence of each group’s influencing factors on the scale of natural gas production upgrading varies, and there are significant differences among the groups. In this research phase, a preliminary screening of the influencing factors in each group has been conducted, removing factors with low correlation to reserve upgrading. This provides indicators for the subsequent establishment of a predictive model for the scale of natural gas production upgrading and also offers quantifiable evaluation metrics for the accuracy of the model. It serves as a reliable basis for formulating scientific strategies for reserve upgrading.
3 Construction of a prediction model for the upgrading scale of natural gas reserves
The main model used is the neural network model, which is an artificial intelligence model that mimics the biological nervous system, and learns the weight and bias of the model through training data, and finally realizes the prediction of unknown data. Subsequently, the multi-layer perceptron model will be used to predict the upgrade of reserves. A multilayer perceptron is a type of feedforward neural network, usually consisting of an input layer, one or more hidden layers, and an output layer. Each neuron is connected to all the neurons in the previous layer, and each connection has a corresponding weight indicating the importance of that connection. (Huang and Geng, 2004; Li et al., 2021b; Sheikhoushaghi et al., 2022).
In a neural network, each neuron transforms its input into an output using an activation function. The activation functions commonly used in the hidden and output layers are the Sigmoid function or the ReLU function. During the training process, we use the backpropagation algorithm to update the weights and biases of the neural network to minimize prediction errors. Neural network models typically consist of multiple layers, with each layer containing multiple nodes. Here are some basic formulas involved in the neural network model:
(1) Input Layer: The raw data is used as input, typically represented as
In the formula,
(2) Hidden layer: The signal of the input layer is non-linear transformed and obtained by linear combination of weight
In the formula,
(3) Output layer: Maps the output of the hidden layer to the final output, which can be represented as:
Among them,
(4) Loss function: used to measure the error between the predicted value and the actual value. Common Loss function include square error, Cross entropy, etc.
Among them,
(5) Backpropagation: by calculating the derivative of the Loss function to each parameter in the network, back propagation error is propagated layer by layer, so as to update the weight and deviation, and gradually improve the prediction ability of the model.
The output error in the Backpropagation is:
Hidden layer error in Backpropagation:
In the formula,
Based on the application of the aforementioned formulas in neural networks, the construction of the multilayer perceptron for reservoir upgrade prediction model is based on the following steps:
(1) Select input variables: Influencing factors related to the upgrading of natural gas reserves need to be selected as input variables. In other words, sedimentary microfacies, porosity, permeability, reservoir type and regional thickness are selected as input variables.
(2) Design the network structure: the structure of the neural network is composed of several layers, including the input layer, the output layer and several hidden layers. The multi-layer perceptron model is mainly used, and the number of hidden layers and the number of neurons in each layer of the multi-layer perceptron model are constantly tested and adjusted to achieve the optimal prediction effect.
(3) Data preprocessing: Data needs to be preprocessed before neural network training. The main methods are data cleaning and data normalization. Data cleaning to remove outliers and noise to make the data more standardized; Data normalization can transform data of different dimensions into the same scale and avoid errors caused by different data dimensions.
(4) Data training: the data set is divided into training sets and test sets. The training set is used to train the neural network model and the back propagation algorithm is used to optimize the model parameters. The basic idea of backpropagation algorithm is to calculate the partial derivative of the loss function to each layer of neurons through the chain rule, and then update the network parameters according to the gradient descent method.
(5) Use the trained model to predict the future upgrade of natural gas reserves, obtain the forecast results and analyze them.
Combining the formula and establishment process, the process of establishing the model is shown in Figure 6:
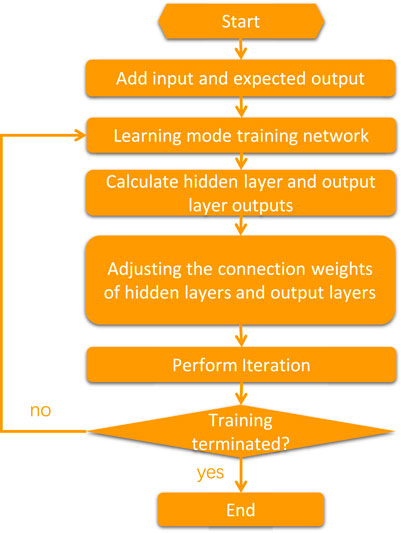
FIGURE 6. Flow chart of neural network model establishment.
The neural network model was established with the following settings: the maximum number of training epochs was set to 1,000, the target error was set to 0.01, and the minimum gradient was set to 1e-6. The hidden layer of the neural network consisted of 10 nodes. The Levenberg-Marquardt algorithm was used for network training. The activation function applied to the hidden layer and output layer was the Sigmoid function.
The multilayer perceptron is a powerful predictive model (Figure 7) that can extract regular patterns from a large amount of historical data through the learning and optimization process of a neural network, enabling future predictions. In this research component, the multilayer perceptron is utilized to train on the combination of multiple factors, allowing for the prediction of the scale of natural gas reserve upgrades. Additionally, it can determine the degree of influence that each factor has on the scale of natural gas reserve upgrades, providing crucial decision-making guidance for natural gas exploration and development.
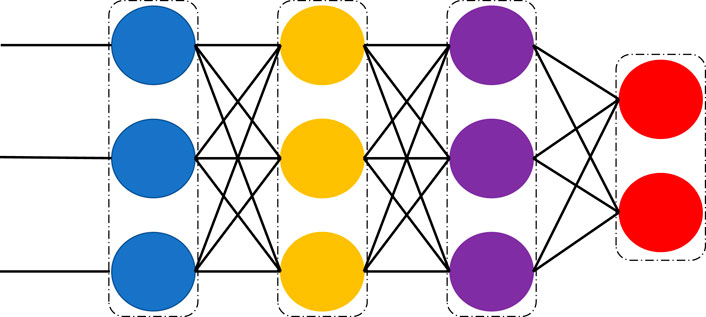
FIGURE 7. Schematic diagram of Multilayer perceptron model.
4 Verification and evaluation of the prediction model for the upgrading scale of natural gas reserves
After training the neural network model, it is necessary to validate and evaluate its performance. This step is crucial for assessing the accuracy, stability, and generalization capability of the model. It involves testing the model’s true capabilities to ensure its reliability and effectiveness in practical applications. Validation allows quantifying the prediction accuracy of the model and comparing it against actual observations to determine if the model meets the expected performance level. The validation process also helps identify and address issues such as overfitting or underfitting, optimizing model parameters and hyperparameters. Additionally, validation provides insights into the model’s generalization ability, i.e., how well it performs on new data. A comprehensive and systematic validation enables a deep understanding of the model’s performance, serving as a reliable basis for its application and further improvements. Therefore, validating the well-established neural network model is crucial to ensure its reliability and credibility.
Based on the previous analysis of influencing factors, the natural gas reservoirs were divided into four groups. In this section, the research focuses on the reserve upgrading prediction for each group, observing the accuracy of the neural network predictions in different groups. The objective is to validate the accuracy of the model. Firstly, a comparison is made between the weight values of the influencing factors predicted by the Analytic Hierarchy Process and the weight values of the influencing factors obtained through back-propagation in the neural network (Table 2). This mutual validation is intended to confirm their consistency. Figure 8 presents the comparison of weights between the two approaches.
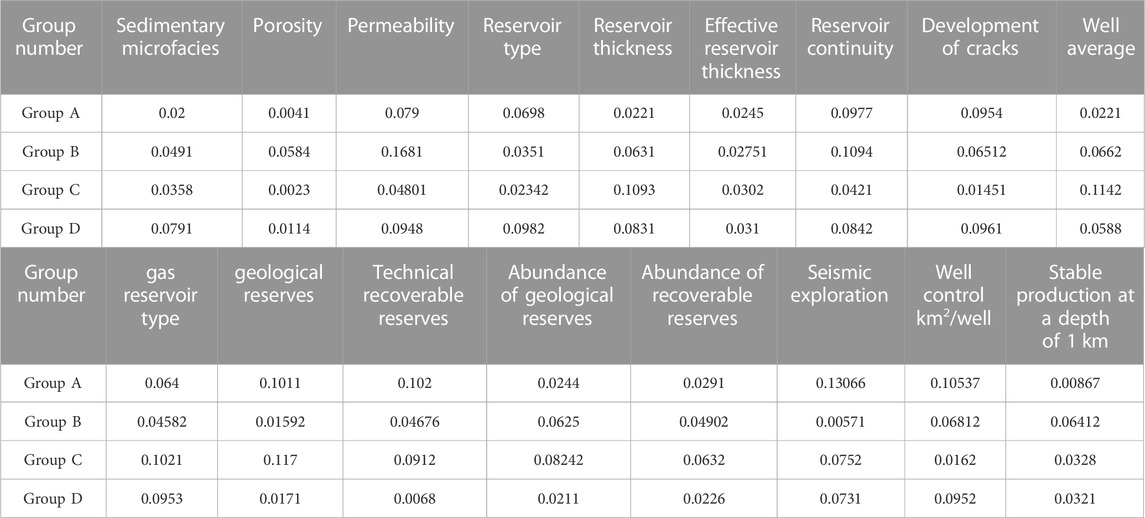
TABLE 2. The weight value of the neural network.
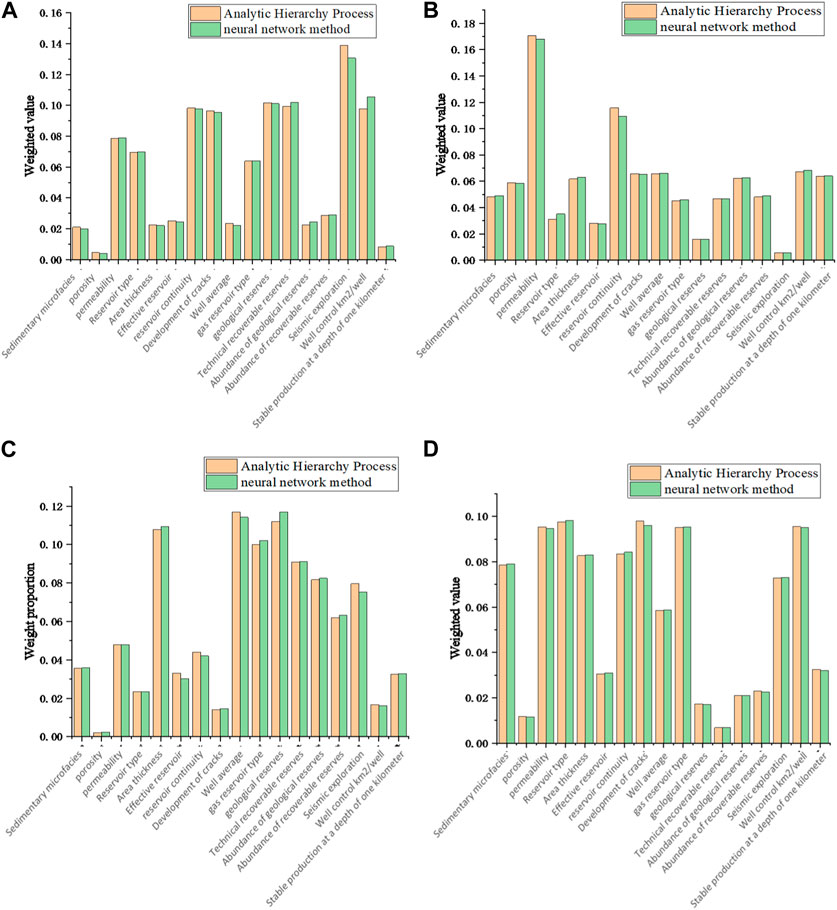
FIGURE 8. Comparison of weight proportion (A) group A. (B) Group B. (C) Group C. (D) Group D.
A comparison was made between the weight proportions of the factors obtained from the Analytic Hierarchy Process and the weight proportions derived through back-propagation in the neural network. The results of the two calculations were found to be consistent, providing mutual validation and confirming the feasibility of establishing a natural gas reserve upgrading prediction model based on the neural network approach. To further confirm the reliability of the results, the standardized residuals of the model predictions in each group are presented below, aiming to provide additional validation of the model’s reliability.
Based on Figure 9, the standardized residuals of the comparison samples were calculated. According to the t-test in the residual analysis, when the standardized residuals fall within the range of [-2, 2], it indicates that the errors are small and there are no outliers. The calculation results show minimal error, indicating a high degree of fit between the neural network predictions and the actual values. The following (Figure 10) presents the comparison between predicted values and actual values in each group. This section showcases 10 data points selected from each group.

FIGURE 9. Standardized residual plot. (A) Group A. (B) Group B. (C) Group C. (D) Group D.
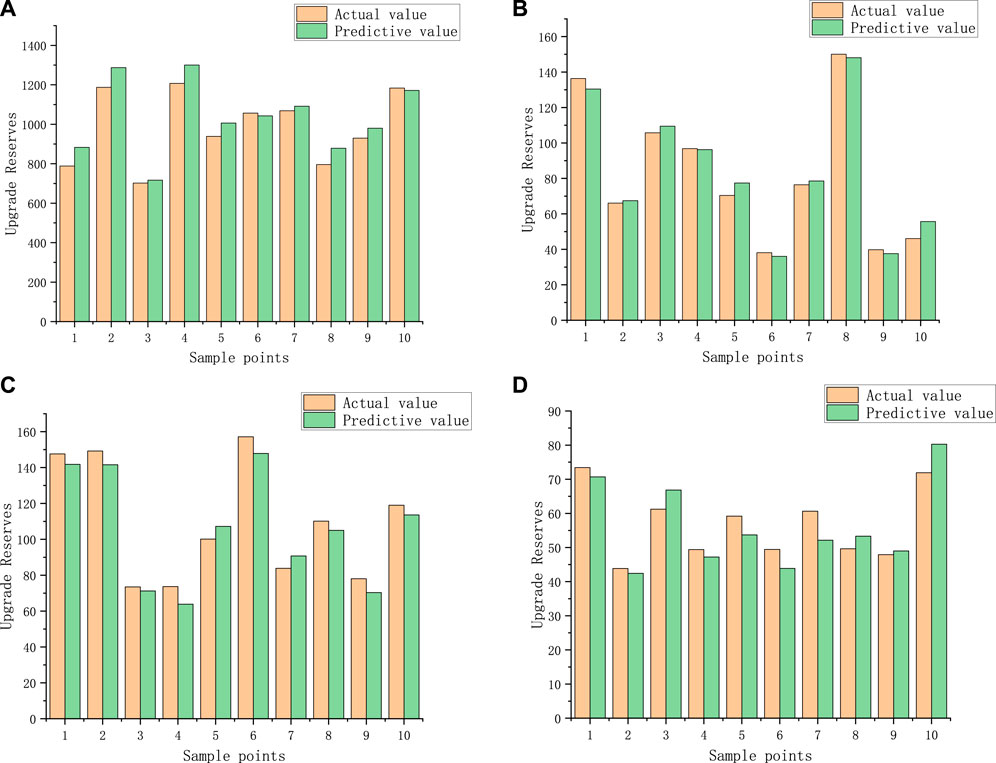
FIGURE 10. Comparison between predicted and actual values. (A) Group A. (B) Group B. (C) Group C. (D) Group D.
In order to verify the accuracy of the prediction results of natural gas reserves upgrading, the error analysis of each group of reserves upgrading scale is carried out based on the neural network. Error analysis can help to determine the accuracy of calculation methods and results. The method chosen for error analysis is relative error method, and the formula used is as follows:
In the formula,

TABLE 3. Relative error table.
From Figure 10, it can be observed that the predicted results of the experimental outcomes are highly consistent with the actual results. This indicates the successful accuracy of the reserve upgrade scale prediction model in accurately forecasting natural gas reserve upgrades. By utilizing the complex pattern recognition and learning capabilities of neural networks, the model captures the key trends and influencing factors of reserve upgrades, thereby providing reliable prediction results. The accuracy and practicality of this prediction model are satisfactory, and further research and application are anticipated to enhance the prediction capabilities of natural gas reserve upgrades.
5 Conclusion
The objective of this study was to explore the neural network prediction method for natural gas reserve upgrade scale and validate the accuracy and reliability of the model by combining it with cluster analysis and analytic hierarchy process (AHP) for analyzing the weights of influencing factors.
Initially, cluster analysis was applied to categorize multiple natural gas reservoirs into different groups. This step aimed to address the issue of inaccurate predictions due to variations among different reservoir types. The impact and significance of influencing factors vary across different types of reservoirs, affecting the reserve upgrade scale differently. Through validation, it was determined that the cluster analysis resulted in four groups, providing a basis for subsequent analysis. Next, AHP was employed to analyze the weights of influencing factors within each group. This analytical method helped identify the most significant factors influencing the reserve upgrade scale while eliminating factors with minimal impact on the prediction results. The accuracy of the model was validated by comparing the weights obtained from AHP with those derived from the neural network.
During the prediction phase, a neural network model was utilized to forecast the reserve upgrade scale. The model was established by configuring appropriate network architecture, defining input and output variables, and conducting training and validation processes. Multiple validation methods were employed to assess the performance of the model, including comparing the weights obtained from AHP, analyzing the standardized residuals of sample points, and directly comparing the actual and predicted values. The comparative validation yielded satisfactory results, with the predicted reserve upgrade scale highly consistent with the actual results, thus confirming the accuracy of the developed neural network model in predicting natural gas reserve upgrades. It further demonstrated the effectiveness of neural networks in pattern recognition and learning capabilities, as well as their potential in forecasting natural gas reserve upgrade scales.
This research outcome provides important information and reference for relevant stakeholders and decision-makers. By analyzing the weights of influencing factors in different groups, the factors with the greatest impact on the natural gas reserve upgrade scale can be identified, providing a basis for optimizing upgrade plans and allocating resources effectively. Additionally, by establishing an accurate prediction model, reliable forecasts of reserve upgrade scale can be provided to decision-makers, helping them make informed decisions and reduce decision risks.
However, our research also has limitations. Firstly, the study is based on a limited dataset, and expanding the size and diversity of the dataset may enhance the model’s generalization ability. Secondly, our model only considers specific influencing factors and does not account for other potential factors that may impact the reserve upgrade scale. Therefore, future research can incorporate more factors into consideration. To further improve the model’s performance, future studies can explore more complex neural network architectures, introduce additional influencing factors, and compare them with other prediction methods. Furthermore, for sample points with significant prediction errors, further analysis of their characteristics and causes can be conducted to identify methods for improving prediction accuracy.
In summary, in this paper, we propose a comprehensive prediction method of natural gas reserves upgrading scale which combines cluster analysis, analytic hierarchy process and neural network. The validity and reliability of this method are verified by verification and analysis. In view of the relative lack of research on the prediction of natural gas reserves upgrading scale, this study aims to fill the gap and provide reference for future research. It is believed that the results provide valuable tools and insights for decision makers and stakeholders in the gas industry and inspire future research.
Data availability statement
The raw data supporting the conclusion of this article will be made available by the authors, without undue reservation.
Author contributions
WZ: Writing–original draft, Writing–review and editing. HL: Writing–original draft, Writing–review and editing. XW: Writing–original draft, Writing–review and editing. JZ: Writing–review and editing, Writing–original draft. CL: Writing–original draft, Writing–review and editing. DZ: Writing–original draft, Writing–review and editing.
Funding
The author declares that the research, creation and/or publication of this paper was supported by Sichuan Science and Technology Program No. 2021JDR0401.
Conflict of interest
WZ, HL, XW, and JZ were employed by the Exploration and Development Research Institute of PetroChina Southwest Oil and Gas Field Company.
The remaining authors declare that the research was conducted in the absence of any commercial or financial relationships that could be construed as a potential conflict of interest.
Publisher’s note
All claims expressed in this article are solely those of the authors and do not necessarily represent those of their affiliated organizations, or those of the publisher, the editors and the reviewers. Any product that may be evaluated in this article, or claim that may be made by its manufacturer, is not guaranteed or endorsed by the publisher.
References
Cui, Y. (2013). Control reserve upgrade characteristics and upgrade potential in Jiyang Depression [J]. Inn. Mong. Petrochem. 39 (5), 44–46. doi:10.3969/j.issn.1006-7981.2013.05.020
Huang, X., and Geng, X. (2004). Application of improved artificial neural network method in natural gas production forecasting [J]. J. Civ. Aviat. Flight Univ. China 15 (1), 12–13. doi:10.3969/j.issn.1009-4288.2004.01.004
Khater, I., and NabiHamarneh, I. G. (2020). A review of super-resolution single-molecule localization microscopy cluster analysis and quantification methods. Patterns 1 (3), 100038. doi:10.1016/j.patter.2020.100038
Li, S., Huang, X., Xiao, Y., Zheng, Z., and Liu, L. (2021a). Standards for controlling reservoir reserve upgrade in deep, low-permeability sand and conglomerate reservoirs in the Jiyang Depression of the Bohai Bay Basin [J]. Exp. Pet. Geol. 43 (1), 184–192. doi:10.11781/sysydz202101184
Li, W., Wang, L., Dong, Z., Wang, R., and Qu, B. (2021b). Reservoir production prediction with optimized artificial neural network and time series approaches. J. Petroleum Sci. Eng. 215PA, 110586. doi:10.1016/j.petrol.2022.110586
Li, J. (2021). Uncertainty evaluation method and application for the potential upgrade of tight oil reservoir reserves [J]. Petroleum Nat. Gas Geol. 42 (3), 755–764. doi:10.11743/ogg20210320
Liu, S., and Li, X. (2022). Experimental study on the effect of cold soaking with liquid nitrogen on the coal chemical and microstructural characteristics. Environ. Sci. Pollut. Res. 30 (13), 36080–36097. doi:10.1007/s11356-022-24821-9
Liu, X., Qing, S., and Luo, Y. (2018). Potential evaluation of remaining undeveloped reserves in M Gas Field [J]. Petrochem. Appl. 37 (9), 24–27. doi:10.3969/j.issn.1673-5285.2018.09.007
Liu, Y., Lebedev, M., Zhang, Y., Wang, E., Li, W., Liang, J., et al. (2022). Micro-cleat and permeability evolution of anisotropic coal during directional CO2 flooding: an in situ micro-CT study. Nat. Resour. Res. 31 (5), 2805–2818. doi:10.1007/s11053-022-10102-2
Liu, S., Sun, H., Zhang, D., Yang, K., Li, X., Wang, D., et al. (2023a). Experimental study of effect of liquid nitrogen cold soaking on coal pore structure and fractal characteristics. Energy 275 (7), 127470. doi:10.1016/j.energy.2023.127470
Liu, Y., Wang, E., Jiang, C., Zhang, D., Li, M., Yu, B., et al. (2023b). True triaxial experimental study of anisotropic mechanical behavior and permeability evolution of initially fractured coal. Nat. Resour. Res. 32 (2), 567–585. doi:10.1007/s11053-022-10150-8
Liu, Y., Wang, E., Li, M., Song, Z., Zhang, L., and Zhao, D. (2023c). Mechanical response and gas flow characteristics of pre-drilled coal subjected to true triaxial stresses. Gas Sci. Eng. 111, 204927. doi:10.1016/j.jgsce.2023.204927
Marietta, S., Kitti, Y., Éva, P., Sándor, K., Karolina, T., Marianna, R., et al. (2023). Variability and cluster analysis of arabinoxylan content and its molecular profile in crossed wheat lines[J]. J. Cereal Sci. 95. doi:10.1016/j.jcs.2020.103074
Redfoot, E., Verner, K., and Borrelli, R. (2022). Applying analytic hierarchy process to industrial process design in a Nuclear Renewable Hybrid Energy System. Prog. Nucl. Energy 145, 104083. doi:10.1016/j.pnucene.2021.104083
Shadmaan, S., and Islam, A. (2021). Estimation of earthquake vulnerability by using analytical hierarchy process. Nat. Hazards Res. 1 (4), 153–160. doi:10.1016/j.nhres.2021.10.005
Sheikhoushaghi, A., Gharaei, N., and Nikoofard, A. (2022). Application of Rough Neural Network to forecast oil production rate of an oil field in a comparative study. J. Petroleum Sci. Eng. 209, 109935. doi:10.1016/j.petrol.2021.109935
Shi, L., Huang, X., Liu, J., Zhang, L., Zhuang, L., and Zhang, F. (2021). Method for evaluating the potential for upgrading remaining oil reserves and upgrading strategies [J]. Exp. Pet. Geol. 43 (1), 176–183. doi:10.11781/sysydz202101176
Sun, P., Deng, C., and Jin, B. (2017). Analysis of characteristics of controlling reserve upgrade in complex fault block reservoirs [J]. Complex Oil Gas Reservoirs 10 (3), 28–33. doi:10.16181/j.cnki.fzyqc.2017.03.006
Xiao, Y., Huang, X., Li, S., Liu, L., and Li, J. (2021). Method for evaluating the potential for upgrading reserve utilization based on quantitative uncertainty [J]. Exp. Pet. Geol. 43 (1), 169–175. doi:10.11781/sysydz202101169
Xue, Y., Cao, J., Wang, X., Du, H., Chen, W., You, J., et al. (2022a). Q-Factor estimation from surface seismic data in the time-frequency domain: a comparative analysis. Geophysics 87 (4), V261–V277. doi:10.1190/GEO2021-0210.1
Xue, Y., Wang, X., Cao, J., Du, H., Xie, J., You, J., et al. (2022b). Estimation of seismic quality factor via quantum mechanics-based signal representation. IEEE Trans. Geoscience Remote Sens. 60, 1–11. doi:10.1109/TGRS.2022.3217274
Xue, Y., Wang, X., Cao, J., Liu, Z., and Yang, J. (2023). Quantum mechanics-based seismic energy absorption analysis for hydrocarbon detection. Geophys. J. Int. 233 (3), 1950–1959. doi:10.1093/gji/ggad042
Zhang, J., Shi, H., Liu, Y., Luo, C., and Zhu, Y. (2018). A new method for evaluating the developed reserves of strongly heterogeneous tight sandstone gas reservoirs [J]. Special Oil Gas Reservoirs 25 (3), 1–5. doi:10.3969/j.issn.1006-6535.2018.03.001
Zhang, J., Li, X., Qin, Q., Wang, Y., and Gao, X. (2023). Study on overlying strata movement patterns and mechanisms in super-large mining height stopes. Bull. Eng. Geol. Environmen 82 (4), 142. doi:10.1007/s10064-023-03185-5
Keywords: natural gas in sichuan basin, reserve upgrade, cluster analysis, analytic hierarchy process, neural network prediction
Citation: Zhan W, Li H, Wu X, Zhang J, Liu C and Zhang D (2023) Research on neural network prediction method for upgrading scale of natural gas reserves. Front. Earth Sci. 11:1253495. doi: 10.3389/feart.2023.1253495
Received: 05 July 2023; Accepted: 04 August 2023;
Published: 14 August 2023.
Edited by:
Yubing Liu, China University of Mining and Technology, ChinaReviewed by:
Ya-Juan Xue, Chengdu University of Information Technology, ChinaXuelong Li, Shandong University of Science and Technology, China
Copyright © 2023 Zhan, Li, Wu, Zhang, Liu and Zhang. This is an open-access article distributed under the terms of the Creative Commons Attribution License (CC BY). The use, distribution or reproduction in other forums is permitted, provided the original author(s) and the copyright owner(s) are credited and that the original publication in this journal is cited, in accordance with accepted academic practice. No use, distribution or reproduction is permitted which does not comply with these terms.
*Correspondence: Chenxi Liu, MjAyMjIwMDIxMDMzQHN0dS5jcXUuZWR1LmNu