 Haijun Wang
 Xiangdong Kong2,3*
 Pengju Li
95% of researchers rate our articles as excellent or good
Learn more about the work of our research integrity team to safeguard the quality of each article we publish.
Find out more
ORIGINAL RESEARCH article
Front. Earth Sci. , 01 November 2023
Sec. Geoscience and Society
Volume 11 - 2023 | https://doi.org/10.3389/feart.2023.1252597
This article is part of the Research Topic Geosciences and the Living Environment in a Changing World View all 4 articles
Evidence suggests city grouping is an important way to implement urbanization in China. However, the Chengdu-Chongqing Economic Circle (CCEC) is a typical dual-core structure, and the development level of each city is different. If we do not focus on the key directions for urban development, it will not be conducive to the new-type urbanization process. Therefore, we use spatial analysis techniques and geographic big data sets to construct an approach for urban system layout optimization from a global perspective. It mainly includes urban extended trend analysis based on night light, multi-modal traffic network analysis, and spatial economic density analysis using Open Street Map (OSM) and Point of Interest (POI) data. The research results show the following interesting findings. Firstly, the historical relationship of cities has a significant impact on city grouping, and efficient transportation connections and prosperous enterprise distribution are key conditions for urban grouping during the acceleration period of urbanization. Secondly, the development of urban grouping should break through administrative restrictions and achieve a moderate separation of administrative divisions and economic divisions. It is beneficial to the rapid growth of the city group and the improvement of the internal structure. Thirdly, the urban group of Southern Sichuan and Western Chongqing (SSWC) is the region with the most potential for growth in CCEC. The urban expansion index (UEI) of the Yibin-Luzhou area is 2.16, and the spatial economic density has increased by 130/km2 in the past decade. Providing flexible development authority and focus on the construction of the Yibin-Luzhou Urban Belt along the Yangtze River is an important way to integrate southern Sichuan. Moreover, we found the UEI has a good universality and it can be used for studying urban expansion trends and city relationships in rapidly developing regions, especially in metropolitan areas or urban agglomeration.
In recent years, many major reforms and innovations have been implemented at the national level to address unbalanced spatial development (Ma et al., 2022) and further promote new-type urbanization in China (Cheng, 2022). The Territorial Space Plan (TSP) implemented in 2020 is a representative project. TSP belongs to the General Plan (Liu and Zhou, 2022), which integrates the original Land Use Plan, Urban-Rural Plan, and Major Function Zone Plan. The function of TSP is similar to the European Territory 2050 (ESPON & MCRIT LTD, 2014) and the America 2050 (Regional Plan Association, 2020). It is a guide for China’s future territorial space development, a blueprint for sustainable development, and the basis for various developments and constructions (Huang et al., 2020). Both Sichuan and Chongqing have completed the preparation of provincial TSPs in 2022 and incorporated various special plans during the 14th Five-Year Plan period into this plan, which has important guiding significance for the development of land and space in the Chengdu-Chongqing area in the next 15 years. CCEC’s urban system and transportation network system have been clearly planned in the TSP of Sichuan and Chongqing in 2021–2035. Scientific urban layout and efficient transportation networks are the basis for implementing a networked urban system (Rodrigue, 2020). The development of urban networks can optimize the spatial layout of land and space, and further promote new-type urbanization and rural revitalization (Huang et al., 2020).
TSPs of Sichuan and Chongqing are the framework plans, that have been comprehensively demonstrated at the provincial level, and their design and plan should be scientific at the macro scale (Wu et al., 2022). However, TSP covers multidisciplinary fields, involving land and resource protection, urban system layout, multi-industry collaboration, infrastructure and public service facilities, and human-land relationship coordination (Brunetta et al., 2018; Orsi et al., 2022). In addition, some concepts are officially proposed for the first time, such as the Fourth Pole (Ibold and Yun, 2021). Therefore, the previous studies are insufficient to provide a scientific-comprehensive reference for TSP compilation, especially planning concepts (Zhang et al., 2022a), and planning methodology (Wang et al., 2019; Song et al., 2020; Liu et al., 2022). Moreover, TSP implementation involves cross-regional multi-sectoral cooperation and multi-industry collaboration, which is a complex system engineering (Wu et al., 2022). Consequently, TSP is accompanied by many challenges and uncertainties from planning to implementation (Li et al., 2022), and it needs to be continuously optimized as the planning progresses. The overall planning of the urban system and traffic layout is designed in TSP (e.g.,: two metros and three CGs, etc.). The economic development in the CCEC is extremely unbalanced and belongs to a typical dual-core structure (Sun et al., 2019). In particular, the economic scale and infrastructure of prefecture-level cities in Sichuan Province differ greatly from the provincial capital. The essence of CG development is to realize spatial integration (Lu and Diab, 2023), and to achieve this target, CG needs to provide effective economic and infrastructure support (He and Nicholas, 2015; Wang et al., 2022a). As the key factors of city grouping, economic conditions, infrastructure connectivity, and urban historical relationships are crucial. However, in-depth scientific evidence on the above aspects is not present in the current version of the provincial TSP.
Previous research on urban system layout (USL) optimization mainly focused on analyzing the population-socio-economic evolution (Lyu and Jiang, 2022), employing population-economy panel data and Growth Pole Theory to identify USL (He et al., 2021a), the impact of urban land collaborative use on the USL (Ma et al., 2022), and proposing a strategy to optimize the USL according to the basic laws of urban agglomeration formation, development, and expansion (Fang, 2019). Additionally, some research extracting urban land social functional units using the OSM layer (Liu, 2021), integrating POI and NTL data to monitor changes in urban areas (Zhang et al., 2022b), and identifying spatial structures of urban agglomerations based on road network data (Xie et al., 2023), etc. Urban sprawl and its reasons have been discussed by many authors (e.g., by Bhatta (2010) who provided a table of 30 reasons), among which continued population growth is an important factor in the expansion of urban agglomerations (Masanobu, 2021). Therefore, human-land coordination and environmental sustainability (HLC&ES) are key research fields on USL optimization (Liu, 2020; Ma et al., 2022). Many researchers have conducted a lot of research in this field, such as Ma et al. (2022) believed that coordinating the land use of urban agglomerations can reduce the pressure on central cities and promote the growth of underdeveloped cities. The research results of Huang and Liao (2022) show that the evolution of USL in China is closely related to the green economy, and the polycentric structure is conducive to the sustainable growth of urban agglomerations (He et al., 2021b). American scholars have reconstructed the urban road network since 1900 and found that the development of urban agglomerations relies on the construction of road networks (Burghardt et al., 2022). Overall, few pieces of literature perform targeted USL research on the Chengdu-Chongqing urban agglomeration. The spatial distribution of cities has obvious geographical and cultural patterns in CCEC, and these characteristics have not been fully considered in previous studies.
On this background, combined with the team’s previous experience and the materials accumulated in the process of TSP planning preparation, we used geographic big data (Tamimminia et al., 2020) and employed the spatial analysis methods (Paramasivam and Venkatramanan, 2019) to perform the research on the optimization of urban system spatial structure in CCEC. We innovatively use the sector analysis method based on a nighttime light raster, which can provide a more explicit historical expansion of the city from a global perspective compared to traditional methods. In addition, the research uses POI data instead of traditional statistical data to analyze spatial economic distribution, making the analysis results more objective and intuitive. Specifically, we focus on analyzing the trend of urban expansion, the characteristics of the multi-model transportation network, and the spatial distribution of population and economy, and demonstrate the lack of conditions for the coordinated development of each CG. Based on Human-land Coordination Theory (Liu, 2020), an optimization scheme for urban system layout is proposed in CCEC.
The Chengdu-Chongqing Economic Circle (CCEC) was first officially proposed in the “Plan Outline for the Construction of the Chengdu-Chongqing Twin City Region” issued by China’s National Development and Reform Commission in 2020. The economic circle belongs to the concept of Economics and the scope of the CCEC (Figure 1) coincides with the Chengdu-Chongqing urban agglomeration (CCUA). CCUA is one of the four major urban agglomerations in China, and it is also the largest urban agglomeration in western China. CCUA takes the Chengdu metropolitan area and the Chongqing metropolitan area as the dual-core, including 15 cities of Sichuan and 27 districts in Chongqing, with a total area of about 185,000 square kilometers, a permanent population of 95 million (2020), and a GDP of 8.58 trillion (2022). It is positioned as a world-class urban agglomeration. CCUA occupies an important position in the development of Chinese cities and transportation systems. It is listed by China as the fourth pole of the national three-dimensional transportation network in 2021. CCAU has an obvious dual-core characteristic, densely covered with multi-node cities, and it is an important representative of China’s large urban agglomerations. In addition, CCUA is a typical basin-type urban agglomeration, with important rivers distributed, and an important part of the Yangtze River Economic Belt, with unique geographical patterns and location conditions.
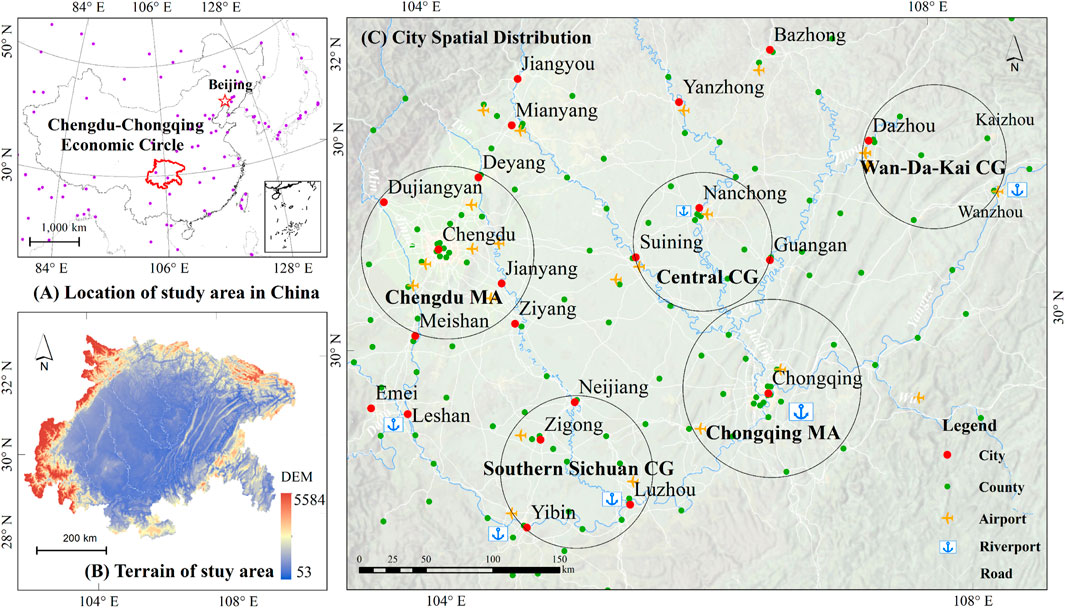
FIGURE 1. Study area. (A) Location in China, (B) Topographic features, (C) City spatial distribution.
We use 5 datasets in this study (Table 1), which are open street map (OSM), point of interest (POI), night light raster (NLR), Sentinel-2 image, and surveys and statistics, respectively. All datasets are available on their official website, except surveys and statistics.

TABLE 1. Data collection used in this study.
1) OSM
OSM is a free and open geographic database updated and maintained by a community of volunteers via open collaboration (Zhao et al., 2019). We downloaded the latest map data of China from the OSM server through Geofabrik, including point, line, and polygon layers. The raw data is in Shapefile format, and geographic information system (GIS) software is used to clip, coordinate transform, and topologically process the data, and finally obtain a standardized road network in the CCTEC.
2) POI
POIs big data is useful to support an understanding of the complex human-land system element of human-economic geography (Xue et al., 2022). POI’s essence is a vector point and it is a record of a place on a map that we find useful or interesting. A POI is typically defined by its geographical coordinates and a few additional attributes like name and category. The POI used is from the Baidu Map server, the data information is more abundant than OSM and Google, especially in China.
3) Nighttime light
The nighttime light remote sensing data used in this paper is a new-type dataset (Wu et al., 2021) optimized based on DMSP-OL (Elvidge et al., 1997) and SNPP-VIIRS (Elvidge et al., 2021). The dataset has a spatial resolution of 1,000 m × 1,000 m and a time series of 1992–2021. In addition, we also used another night light data (130 m × 130 m) of Luojia-1 with higher resolution, which was mainly used for verification. The above two lighting data can be downloaded from Harvard Dataverse and Wuhan University databases respectively.
4) Sentinel-2
The Sentinel-2 images are derived from the Sentinel series satellites launched by the European Space Agency, which contain 13 bands and three types of spatial resolutions: 10, 20, and 60 m. The satellite revisit cycle is 5-day, suitable for monitoring earth surface changes and urban expansion (Wang et al., 2022b; Williams et al., 2022). The study area needs 12 scenes to cover all and the preprocessing (e.g., radiometric calibration, atmospheric correction, and band combination) was performed on the Google Earth Engine platform (Wang et al., 2022c). Finally, we obtain the natural color image with a spatial resolution of 10 m.
5) Surveys and Statistics
Excepting map and image data, we also used the TSP and special plan materials (2022), socio-economic statistics (1990–2021), basic geographic information data (latest version), and previous site survey data (2018–2022).
This research framework (Figure 2) includes three sections. Firstly, we analyze the urban system and traffic layout scheme in the provincial TSP and explain the possible problems. And then the spatial analysis methods are employed to analyze the urban expansion direction, multi-layer transportation network, and population economic spatial distribution. Moreover, we combined high-resolution remote sensing data and field survey data to verify the analysis results. Finally, an optimization and refinement scheme of the urban system layout is proposed. Specifically, the basic method of spatial analysis is as follows.
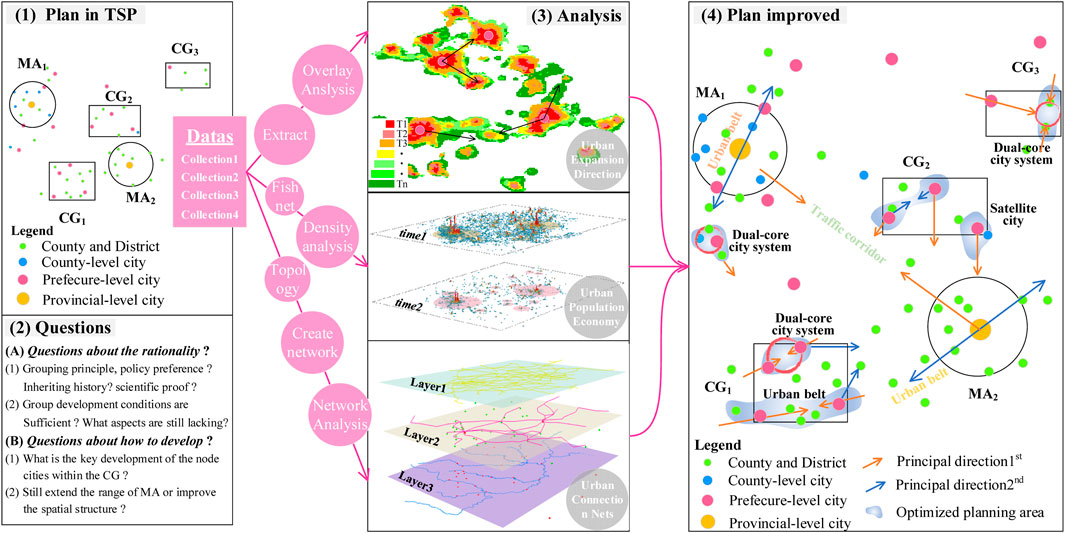
FIGURE 2. Framework of research.
Equality fan analysis was used to reveal the spatiotemporal differences of urban expansion by analyzing a new-type night light remote sensing image. This meant the spatiotemporal differences in urban expansion can be shown by increased areas, expansion speeds, and expansion intensities of construction lands in different orientations (Wang et al., 2013; Dhanaraj and Angadi, 2021). The specific steps were as follows: (1) In ArcGIS Pro software, the urban geographical hub was set as the center and it was chosen as the starting point to draw eight equal fans with proper radius size (100 km); (2) The urban expansion in each sector area were extracted; (3) The urban expansion index (UEI) in each sector area was calculated. The intensities, speeds, and trends of urban expansion in different orientations and different periods could be compared by this index. UEI was expressed in Equation 1
Where
We use the topologically processed OSM network and the traffic planning data of the 14th Five-Year Plan to construct a multi-layered three-dimensional traffic network in the study area, and perform network analysis (Burghardt et al., 2022) to calculate the commuting time (CT) between cities for study urban connectivity. The specific calculation principle is shown in Eqs. 2–4
Where
Fishing net density is a flexible spatial density analysis method that can set different cell sizes based on different research scales (Shi et al., 2020; Horst et al., 2023). This method involves constructing cells of a specific size, calculating the ratio of sample count and cell area in each grid, and assigning values to grid cells. We use the enterprise POI fishing net density weight-based (
Where
The expansion fan map (Figure 3) of the main cities in CCEC was obtained by analyzing the remote sensing data of night light from 1992 to 2021. The fan map can present the characteristics of the urban system and the direction of urban expansion in the past 3 decades. Deyang, Meishan, and Jianyang are included in the development plan of the Chengdu metropolitan area in the provincial TSP plan. It can be seen (Figure 3A) that every 5 years since 1992, the speed of Chengdu’s outward expansion has been relatively high (UEI = 2.89). Especially in the north, south, and southeast, incorporating Deyang, Meishan, and Jianyang into the Chengdu metropolitan area. In the recent 10 years, night light changes show that Chengdu has a significant expansion direction, particularly in the east and south (UEI = 1.98). Leshan and Mianyang are two important cities adjacent to the Chengdu metropolitan area, but they are not included in the metropolitan area due to spatial distance. The fan map shows that the urban expansion of Leshan City is not fast, and the main body of the city extends along major rivers such as the Minjiang River, Qingyi River, and Dadu River. The expansion characteristics of Mianyang City and Leshan City are relatively similar, and the intensity of urban expansion is not high. The main body of the city is basically connected with Deyang City in the south and expands to Santai County along the Fujiang River. Generally, a north-south urban belt has been formed, with the Chengdu metropolitan area as the core, connecting Leshan to the south and Mianyang to the north.
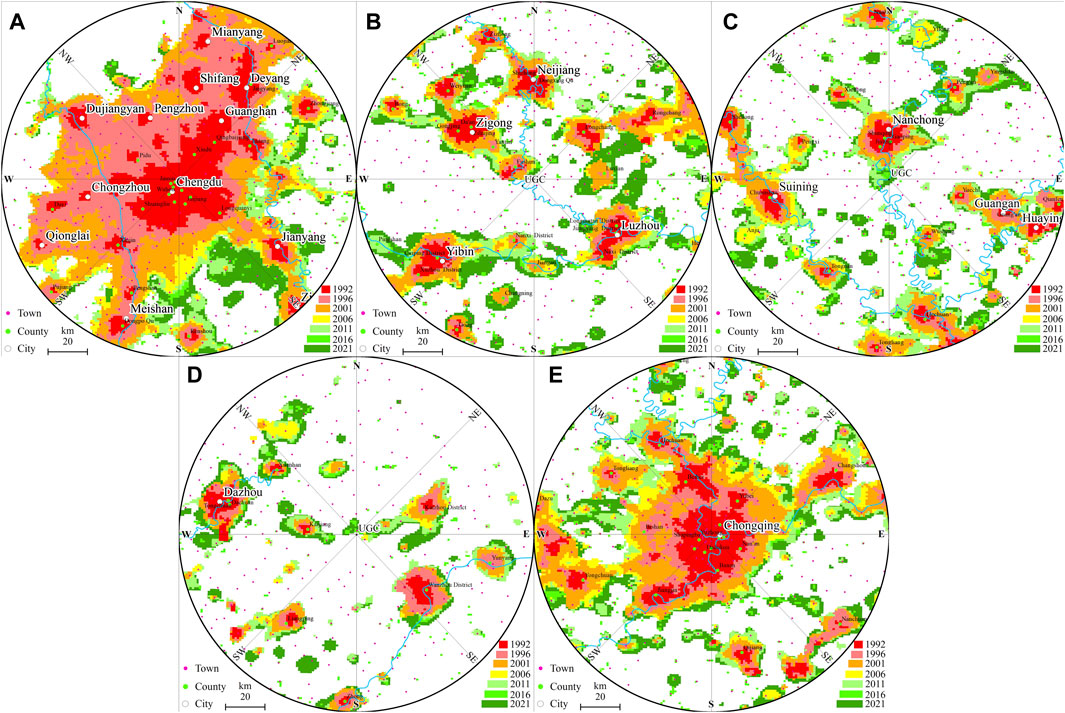
FIGURE 3. Spatio-temporal change of urban night light in CCEC from 1992 to 2022. (A–E) represent the Chengdu MA, SSCW-CG, CCC-CG, WDK-CG, and Chongqing MA respectively.
Yibin City is a key part of the SSCW city group in the TSP plan, it expands eastward and northwestward along the Minjiang-Yangtze River valley (Figure 3B). Especially in recent decades, urban has sprawl rapidly, and the central urban region gradually connected with Nanxi District and expanded to Jiang’an County (UEI = 2.16). Luzhou City, which is also an important city in the SSCW city group, is mainly expanded to the north due to the restrictions of administrative divisions (Figure 3B). It connects with Chongqing City through Lu County. In addition, Zigong City is a node city of SSCW, and its expansion mainly presents the characteristics of northwest and southeast directions (Figure 3B). In recent years, Zigong has gradually integrated with Neijiang in the east. In contrast, it has not achieved coordinated expansion with Yibin and Luzhou in the south. Overall, Yibin and Luzhou basically developed along the Yangtze River, connected the counties and districts along the river, and gradually formed an urban belt along the upper reaches of the Yangtze River.
The CCC city group contains three cities, Nanchong, Suining, and Guang’an. As the core city of the CCC city group in the TSP plan, Nanchong mainly expands southward along the Jialing River and reaches Xichong County in the northwest (Figure 3C). Suining mainly expands along the Fujiang River in the northwest-southeast direction and connects with Tongnan District in the south (Figure 3C). The characteristics of Guang’an’s urban expansion are similar to those of Leshan City, and it mainly develops into a dual-core city with its county-level city (Huaying City) under its jurisdiction. The difference from Leshan’s expansion is that Guang’an has been included in the development plan of the Chongqing metropolitan area. In view of the trend of urban expansion, the connection between the main node cities of the CCC city group is not high, lacking the support of county-level node cities.
As shown in Figure 3D, the WDK city group has a smaller size than the two city groups mentioned above. Dazhou and Wanzhou are the two core cities in the WDK city group. Judging from the trend of urban expansion (Figure 3D), the two cities have not developed in a coordinated way, and the degree of connection is not high. Chongqing Municipality is the core of the Chongqing metropolitan area, located in the southeast of the study area. Since 2006, the main body of Chongqing has expanded to the west, northwest, and northeast (UEI = 1.85), gradually connecting with Dazu, Yongchuan, Changshou, and Fuling. Chongqing City has expanded to Fuling District, Dazu District, Yongchuan District, and Guang’an City in the past 5 years, but there is an interesting phenomenon that the expansion has no focus in terms of space compared with the Chengdu metropolitan area. Moreover, the scale and night light intensity of the Chongqing metropolitan area is lower, especially in the core urban area.
A transportation network system with intermodal transportation and effective connection is an important infrastructure for the spatial integration of urban groups. By analyzing the characteristics of CCEC’s multi-layer traffic network, the commuting mode and commuting time between cities can be accurately obtained, which is the basic index for judging the efficient interconnection between cities in a city group or metropolitan area. The multi-mode transportation system includes highways, high railways, waterways, and aviation in CCEC. We use OSM data and traffic planning data-based spatial analysis to calculate the commute time of the CCEC high railway and a high-speed way to analyze the characteristics of a multi-layer traffic network (Figure 4).
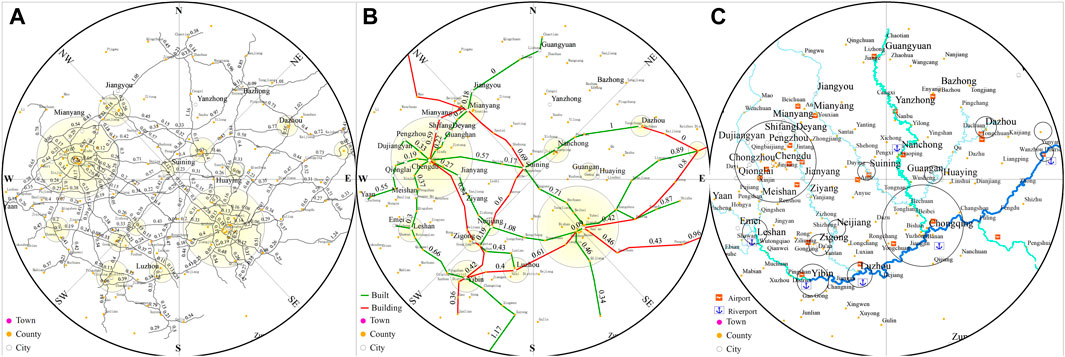
FIGURE 4. Multi-model transportation network in CCEC. (A–C) are high railway, highway, and waterway-aviation network layers respectively.
The Chengdu and Chongqing metropolitan areas have a dense highway network and have formed a unique geometric pattern and spatial structure. Taking Chengdu as the center to Deyang, Jianyang, and Meishan, forming a typical ring-shaped high-way network structure. After calculation, it can be seen that the commuting time to the three cities is 0.44, 0.35, and 0.45 h respectively. The Chengdu metropolitan area realizes the expressway for half an hour to travel, which provides convenient infrastructure support for the effective connection of node cities. Chongqing’s ring-shaped feature is not obvious, but it is connected to important node cities by a highway network, and the expressway transportation is convenient, forming a radial highway transportation system along the terrain with the central region of Chongqing as the core. Starting from the central urban area, it takes 0.74 and 0.64 h to reach Rongchang District and Changshou District respectively. It takes more time (0.91 and 0.85 h) to go to Guang’an City and Qianjiang District. It can be seen that the east-west travel time of the Chongqing metropolitan area is lower than the north-south travel time. Generally, the Chengdu metropolitan area is more convenient than the Chongqing metropolitan area for traveling by highway. The CCC city group and the SSCW city group have a relatively high expressway network density, basically forming an urban expressway with a ring-like structure. However, due to the relatively small scale of the city, it has not developed into a standard ring-shaped urban structure similar to Chengdu. The commuting time from Nanchong, the central city of the CCC city group, to Suining and Guang’an, is about 0.56 h. Similarly, the commuting time from Yibin, which is also a central city, to Zigong and Luzhou expressways is about 0.59 h in the SSCW city group. However, the highway network of the WDK city group is relatively sparse, and the distance between Wanzhou and Dazhou is less than 100km, but the high-speed commuting time between the two cities is 1.2 h (the maximum speed of Chinese expressways is 120 km/h).
Additionally, compared with expressways, high railways have a stronger radiating and driving effect on urban areas along the route in China. The connection of high railways between node cities will further strengthen the interconnection, personnel migration, and spatial integration of cities. There are eight high rail lines (two under construction) radiating from Chengdu and forming a 0.5-h high-speed rail metropolitan area. Seven high-speed rail lines have been extended from Chongqing, three of which are under construction, basically achieving a 0.66-h travel circle for high rail travel. The density of the high railway network in the SSCW city group is second only to the density of the Chengdu and Chongqing megalopolis. As a core city, Yibin is the intersection of the Chengdu-Zigong-Yibin high-speed railway, Chengdu-Guiyang high-speed railway, and Chongqing-Kunming high-speed railway, and it plays an important role as an important hub for the opening up of Chengdu and Chongqing to the south. We can achieve half an hour of high-speed railway commuting and reach the Chengdu and Chongqing metropolitan areas within 1 hour. In the CCC city group, Suining has a higher high-speed rail density, while Nanchong and Guang’an have a lower density. In particular, Guang’an is a blank area of the high-speed rail network, which is not conducive to the interconnection and coordinated development of the city group. In the WDK city group, Wanzhou and Dazhou have already opened high-speed rail to other cities, but the high-speed rail lines connecting them are still under construction. It can be seen from the pattern of the high-speed rail network that the cities in this city group have obvious administrative divisions.
Water transportation and civil aviation in the Chengdu-Chongqing area are important supplements to land transportation, especially the waterway, which covers national skeleton waterways (levels I and II). As a water transportation hub, Chongqing has extremely convenient river transportation, which is incomparable to Chengdu. Through the Yangtze River and its tributaries, the Minjiang River and the Jialing River, Chongqing can connect Leshan, Yibin, Luzhou, and Wanzhou from east to west, and Nanchong and Guangyuan from north to south (Figure 4C). On the urban agglomeration scale, civil aviation is one of the four transportation modes whose role has been weakened, especially in the field of passenger transportation. However, in special scenarios (natural disasters, traffic paralysis, etc.), air transport still plays a key role in passenger and cargo transport. Therefore, the number and level of airports in each city group are also very important for their connectivity. Specifically, Chengdu has five airports, followed by Chongqing with three airports, and each of the other prefecture-level node cities has one airport.
Economic growth and population agglomeration are the driving forces of new-type urbanization (Mahtta et al., 2019). Superior economic-demographic conditions can effectively guarantee the capital and labor needed for urban development. Therefore, by analyzing the spatial economic distribution and population changes of city groups in CCEC, we can effectively judge the feasibility of spatial integration of each city group. However, traditional statistical panel data can only reflect the average level of the regional economy (Zhu et al., 2022), and cannot represent the spatial differences in regional economic distribution. Evidence shows that the number of firms is positively correlated with the size of GDP (Erdin and Ozkaya, 2020; Gherghina et al., 2020). Consequently, we use the POI data of enterprise distribution in 2012 and 2022 to analyze the fishing net density to characterize the spatial distribution and changes in the regional economy. In 2012 (Figure 5), the distribution of CCEC enterprises mainly concentrated in Chengdu (D = 589/km2) and Chongqing (D = 560/km2), with the highest distribution density of 589/km2, while the distribution density of enterprises in node cities was relatively low. Among the prefecture-level cities, Mianyang (D = 190/km2) and Yibin (D = 170/km2) rank high, but there is still a huge gap between Chengdu and Chongqing. The GDP scale (statistical data) of node cities in 2012 has a high consistency with the distribution density of enterprises. View of the POI’s distribution (Figure 5), in the SSCW city group Yibin-Luzhou, Zigong-Neijiang initially formed a network with a simple structure, and the other two city groups did not show this feature obviously. The distribution density of the CCEC’s enterprises has increased significantly in the past decade (Figure 5). The density of enterprises in prefecture-level cities has increased significantly, especially in Yibin (D = 300/km2), Mianyang (D = 330/km2), and Luzhou (D = 285/km2). Except for the two metropolitan areas, the SSCW city group has the largest distribution of enterprises, with a density of 185/km2 and a GDP of 932.2 billion yuan. In the CCC and Wanda WDK city group, the number of enterprises has increased significantly compared with 2012, but it is still lower than that of the SCCW city group. Their GDPs are 566 billion and 423.9 billion respectively (Table 2). Generally, the urban belt from Yibin to Yuxi via Luzhou has a large number of enterprises and superior economic conditions. In contrast, the spatial distribution characteristics of enterprises in the other two urban agglomerations are not obvious.
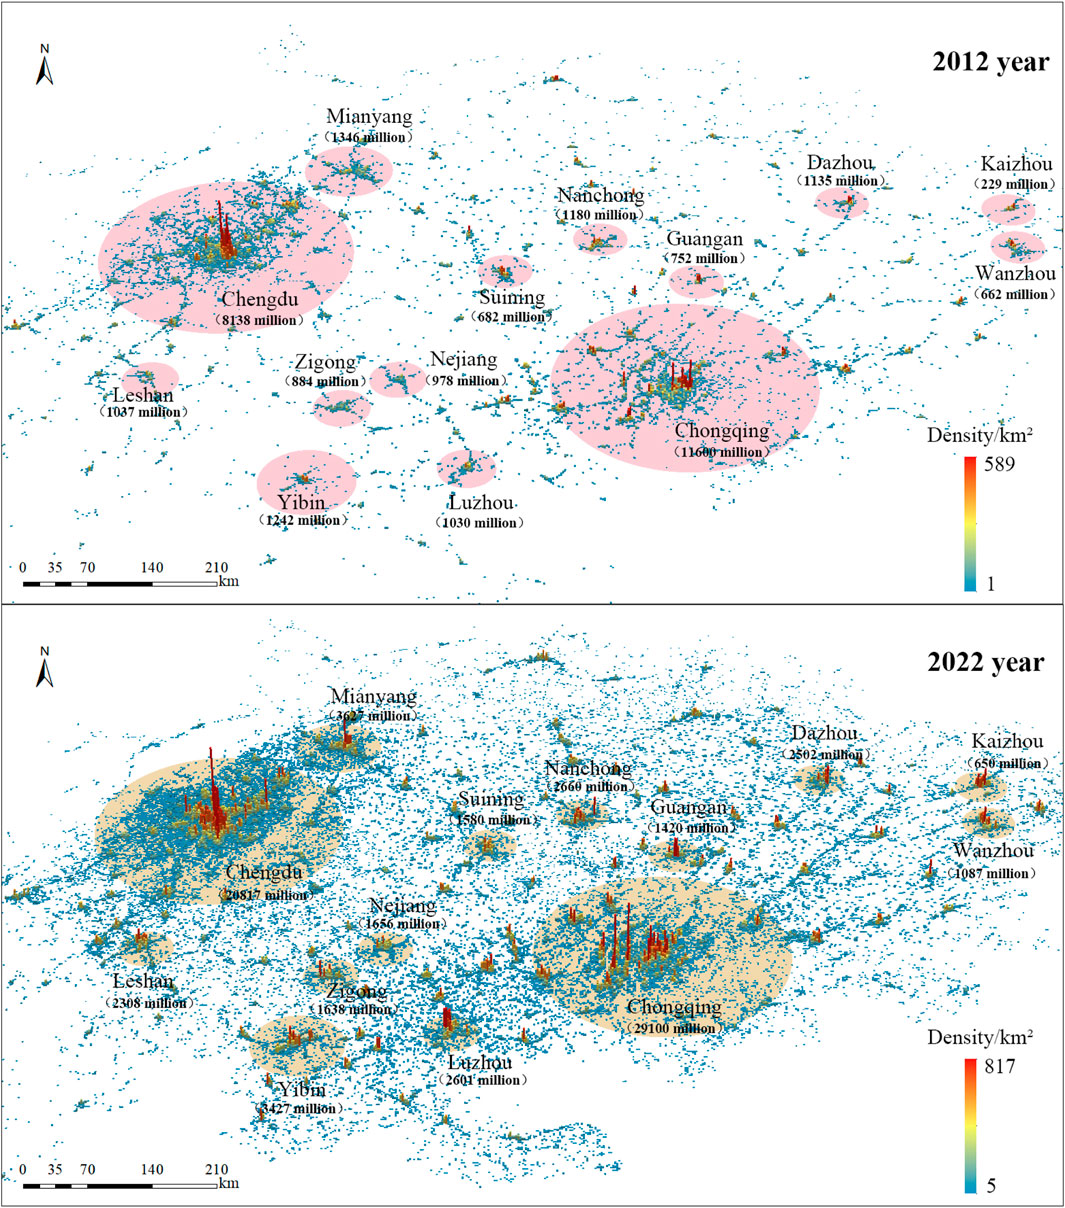
FIGURE 5. Distribution density of enterprises in CCEC, and the grid size is 1 km
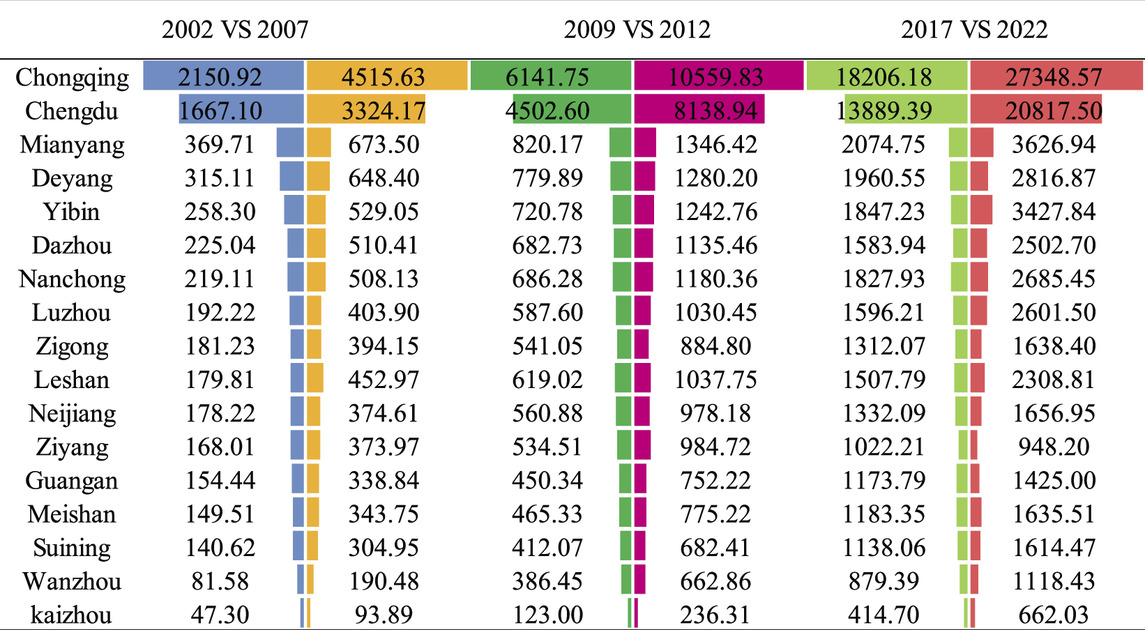
TABLE 2. GDP (billion RMB) trend from 2002 to 2022 years in CCEC.
Additionally, to explore the demographic elements of urbanization, we employed the Kriging interpolation method (Yadav, et al., 2018; Sharma, et al., 2021; Maurya, et al., 2023; Yadav, et al., 2023) to interpolate the population data (town level) based on the seventh census material (2020). Combining the locations of the two metropolitan areas and the three city groups, eight paths were selected (Figure 6A) to analyze the changing trend of the permanent population from Chengdu to Chongqing via different node cities (Figure 6) with a spatial perspective. It can be seen from the above that the 8 paths cover the main node cities of the CCEC. The analysis results show that Chengdu and Chongqing are the most populous regions in CCEC (Figure 6B), and the average population size of Chengdu and Chongqing is about 1.35 million/district and 1.15 million/district. As shown in Figures 5C–J, the average population size of the central district of Suining, Nanchong, and Guang’an in the CCC city group is 0.6 million—0.75 million (Figures 6C, D, E). In the WDK city group (Figure 6F), the population scale gradually increased from Dazhou to Wanzhou. The average population size of Yibin, Zigong, and Neijiang is similar, and the population size of Luzhou and West Chongqing is higher in the SSCW city group. The population changes from Chengdu to Deyang, Ziyang, and Meishan were 1.35 million per district to 0.8 million per district, 0.95 million per district, and 0.5 million per district, respectively. It can be seen that the population density in the north and southeast of the Chengdu metropolitan area is relatively high, while the population density in the south is relatively low.
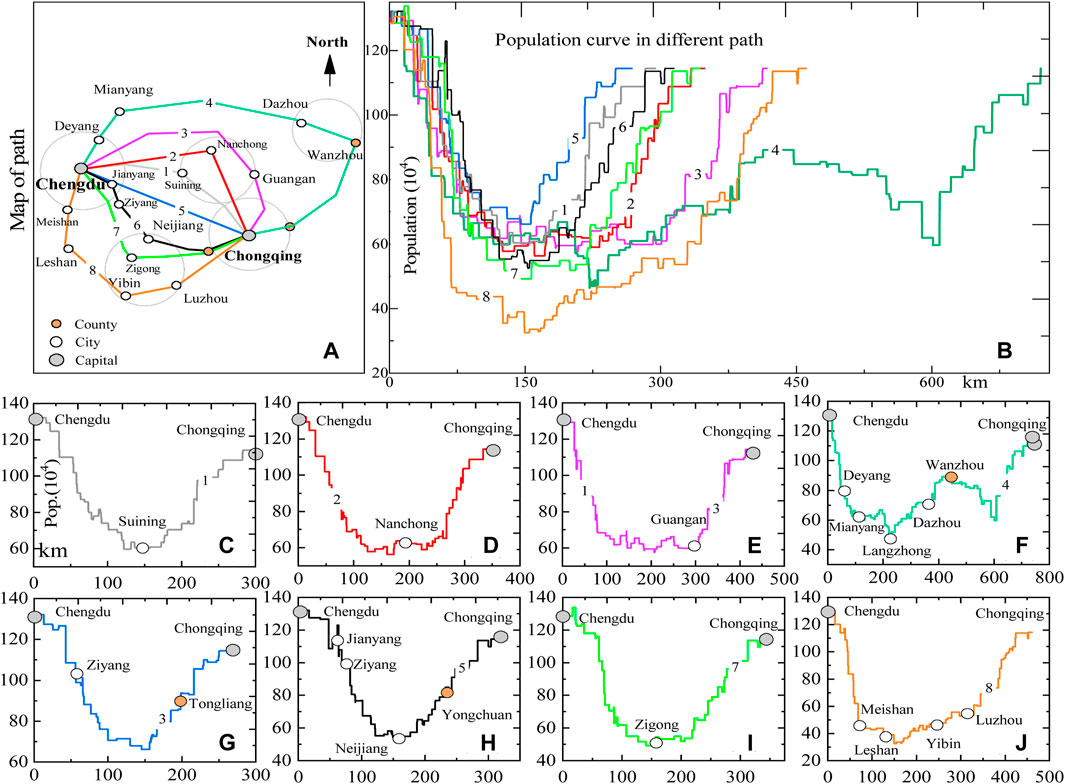
FIGURE 6. Gradient of population change among different cities in CCEC. (A) is the map of the eight paths, and (B) is the population change curve along the eight paths. (C) to (J) are the curve details and marked location of the node city.
We use spatial analysis methods using geographic big data to improve the TSP. To prove the reliability of this result, we compared and verified the results of this study using high-spatial-resolution remote sensing images (Figure 7), previous studies, and government reports. According to the Human-land Coordination Theory, the optimization scheme of CCEC’s urban system layout is discussed.
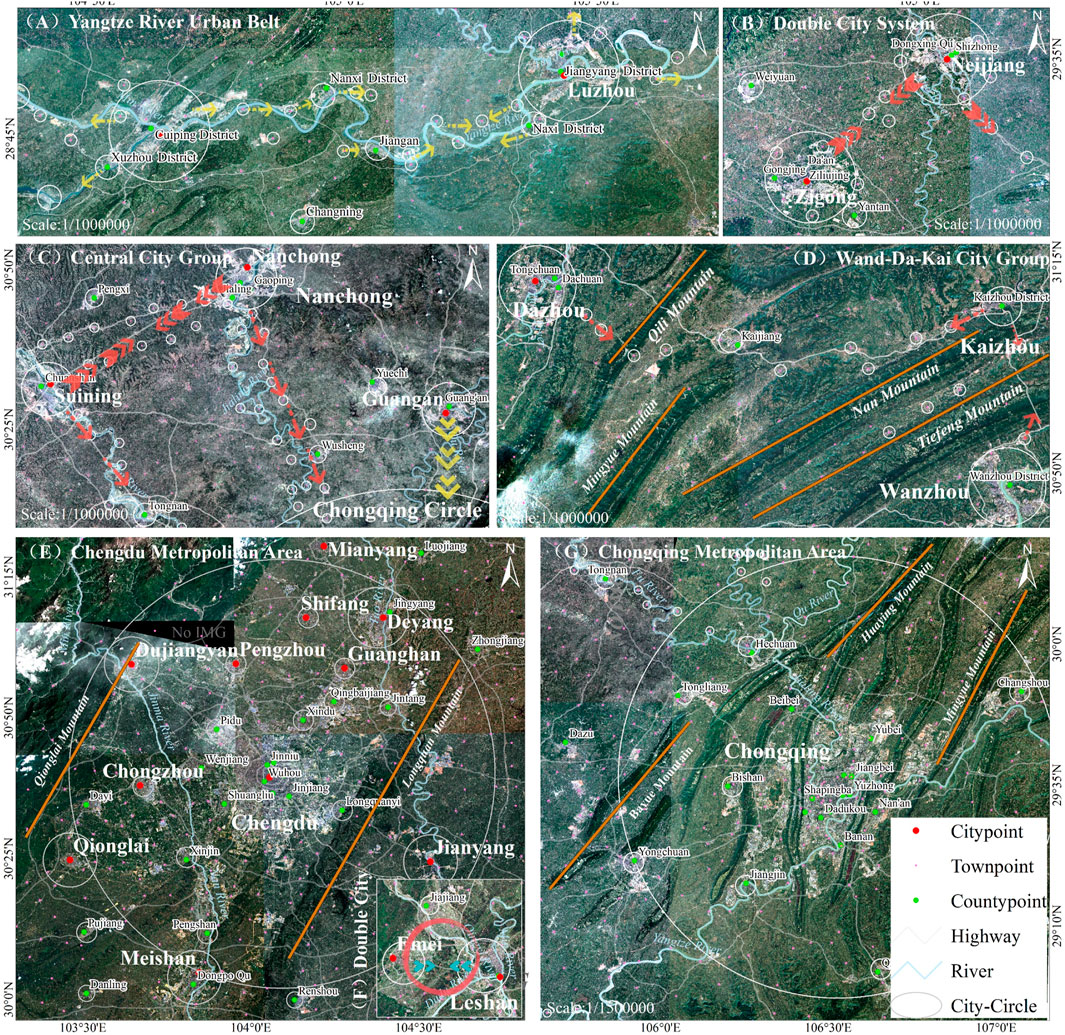
FIGURE 7. Planning map of the urban expansion in different city groups and metropolitan areas.
SSCW city group is an important transportation hub connecting Sichuan Province and Chongqing City with the southern provinces (Chai et al., 2022), and it is also an important section of the New Land-Sea Corridor in Western China (Zhao et al., 2022), with a superior geographical location. Additionally, the area along the Yangtze River from Yibin to Luzhou is an important bamboo landscape belt in China, especially the adjacent areas of Jiang’an and Changning, and it is also a gathering place for bamboo forest tourism (Zhu et al., 2021). Both Yibin Port and Luzhou Port are important inland ports in the upper reaches of the Yangtze River, and they have established a coordinated development relationship (Ding and Ke, 2020). It can be seen that there are many node towns as supports between the two cities from the high-resolution remote sensing image (Figure 7A). More importantly, they all developed along the river and grew rapidly. Therefore, the establishment of the Yibin-Luzhou urban belt along the Yangtze River can better promote high-quality development and industrial coordination, and the region already has the basic conditions for spatial integration. The other two cities in the SSCW city group, Zigong, and Neijiang have a short spatial distance (Figure 7) and a co-directional extension (Figure 3). There is a foundation for integrated development in terms of urban planning style (Mi, 2019), historical and cultural (Hu, 2014), and economic connections (Gao et al., 2020).
The WDK city group is located in the hilly area of eastern Sichuan (Figure 7D). The spatial distance between Wanzhou District and Kaizhou District is relatively close, but the terrain and traffic conditions limit the spatial integration of the two cities. In addition, the economic scale of the city group is relatively small, and it is difficult to realize spatial integration in the short term. Combining regional transportation, economic scale, and geographical environment, breaking administrative barriers, and optimizing the infrastructure is a top priority. In the CCC city group, Nanchong has the largest urban area and economic scale (Figure 5), Suining has the best traffic conditions (Figure 4), and Guang’an is the closest to the Chongqing metropolitan area. However, fewer towns can be connected in series among the three cities. Viewed their expansion direction, the three cities are given priority to expand to the Chongqing metropolitan area. In addition, Nanchong can also expand along the valley of the Jialing River, and along the Chengdu-Chongqing traffic corridor is another expansion direction for Suining City.
Chengdu MA and Chongqing MA have their development advantages in terms of the integration of internal structure and space. The two major metropolitan areas are respectively located in the Chengdu Plain and the hilly area of eastern Sichuan. From a geographical perspective, the plain area is more suitable for spatial integration and coordinated development between cities. On the other hand, Chongqing has a richer river network and convenient waterways, relying on the Yangtze River and Jialing River, which can effectively connect with other cities. The radii of the two metropolitan circles are about 75 km and 85km, respectively. Under China’s current national conditions, the scope of the metropolitan circle should be reasonably controlled (He et al., 2020). The two metropolitan areas are located in the western part of China, which is a typical dual-core structure, and the prefecture-level cities are small in scale. The urban system cannot be compared with the Shanghai metropolitan area, the Great Bay Area metropolitan area, and the Great Lakes metropolitan area in terms of scale or grid level (Regional Plan Association, 2020; Chen et al., 2022). Therefore, rationally controlling the scope of the metropolitan area, and optimizing the internal structure and infrastructure conditions of the metropolitan area is the focus of urban system development in the Chengdu and Chongqing metropolitan areas.
It can be seen that our improvement plan has been proven by relevant research. The optimized spatial layout and expansion direction of the urban system are more suitable for the realistic development of the nod-city in CCEC. The plan we proposed could provide a clearer roadmap for the implementation of TSP, but it also has its shortcomings, such as limited on-site investigation data. We will investigate more nod-city to improve the details of the planning scheme in the future.
The research reveals the historical relationship between cities has a significant impact on city grouping and the transportation network and spatial economic drive urban expansion in the mid-term of urbanization. Moreover, the approach used in this research has a good universality and it can be used for studying urban expansion trends and city relationships in rapidly developing countries or regions.
Additionally, we proposed suggestions for the spatial integration of CCEC. 1). The SSCW city group should be divided into two core parts, the Yibin-Luzhou urban belt along the Yangtze River and the Zigong-Neijiang twin-city system. The implementation process of spatial integration should strengthen Yibin’s status as a sub-central city in Sichuan Province, optimize the infrastructure and industrial layout along the river, and coordinate the expansion direction of Zigong and Neijiang. 2). For the CCC city group, strengthening the node cities’ growth is the key, especially prioritizing Suining’s integration into the Chengdu-Chongqing transportation corridor and Guang’an should be included in the development plan of the Chongqing metropolitan area. 3). We should take advantage of the Yangtze River waterway to build a dual-core urban system of Wanzhou and Kaizhou and optimize the transportation infrastructure of Dazhou and the dual-core urban system. 4). Strictly restrict the expansion of the Chengdu metropolitan area and scientifically improve its internal spatial structure. Continue to optimize the development of the north-south urban belt with the metropolitan area as the core, and conditionally support the construction of the Leshan-Emeishan dual-core city system. 5). Strictly control the expansion of the Chongqing metropolitan area, establish a multi-modal transportation system between the central urban area and Changshou, and Fuling, and coordinate the spatial integration of western Chongqing and southern Sichuan.
The raw data supporting the conclusions of this article will be made available by the authors, without undue reservation.
Methodology, HW; software, XK; validation, JL, XK, and TX; formal analysis, PL; investigation, XC; resources, XK; data curation, XK; writing—original draft preparation, HW and XK; writing—review and editing, XK, HW, JL, JP, XC and TX; visualization, HW; supervision, JL; project administration, HW; funding acquisition, HW. All authors contributed to the article and approved the submitted version.
This research was funded by the Opening Fund of Sichuan Key Provincial Research Base of Intelligent Tourism (grant no. ZHZR23-01), the Sichuan Provincial Key Research Base for Social Sciences: System Science and Enterprise Development Research Center (grant no. Xq23B03), the Sichuan Provincial Key Research Base for Humanities and Social Sciences: Resource Based City Development Research Center (grant no. ZYZX-ZD-2201), the Research Center of Industrial Transformation and Innovation (grant no. CZ22A02), the Southern Sichuan Development Research Institute of Chengdu-Chongqing Economic Circle (grant no. CYQCNY20222) and the Talent Introduction Project of Sichuan University of Science and Engineering (grant no. 22RC09).
The authors declare that the research was conducted in the absence of any commercial or financial relationships that could be construed as a potential conflict of interest.
All claims expressed in this article are solely those of the authors and do not necessarily represent those of their affiliated organizations, or those of the publisher, the editors and the reviewers. Any product that may be evaluated in this article, or claim that may be made by its manufacturer, is not guaranteed or endorsed by the publisher.
Bhatta, B. (2010). Analysis of urban growth and sprawl from remote sensing data. Berlin, Germany: Springer Press. doi:10.1007/978-3-642-05299-6
Brunetta, G., Monaco, R., Salizzoni, E., and Salvarani, F. (2018). Integrating landscape in regional development: a multidisciplinary approach to evaluation in Trentino planning policies, Italy. Land Use Policy 77, 613–626. doi:10.1016/j.landusepol.2018.05.024
BurghardtJohannesKristina LermanaLeyk, K. H. U. S. (2022). Road network evolution in the urban and rural United States since 1900. Comput. Environ. Urban. 95, 1–3. doi:10.1016/j.compenvurbsys.2022.101803
Chai, D., Du, J. Z., Yu, Z. Q., Zhang, D., Jiang, N., et al. (2022). Dual-targeting vaccine of FGL1/CAIX exhibits potent anti-tumor activity by activating DC-mediated multi-functional CD8 T cell immunity. Front. Phys. 10, 1–13. doi:10.1016/j.omto.2021.11.017
Chen, B., Tu, Y., Song, Y. M., David, M., Zhang, T., Ren, Z., et al. (2021). Mapping essential urban land use categories with open big data: results for five metropolitan areas in the United States of America. ISPRS J. Photogramm. 178, 203–218. doi:10.1016/j.isprsjprs.2021.06.010
Cheng, H. R. (2022). Evaluation and analysis of high-quality development of new urbanization based on intelligent computing. Math. Probl. Eng. 11, 1–8. doi:10.1155/2022/6428970
Dhanaraj, K., and Angadi, D. P. (2021). Urban expansion quantification from remote sensing data for sustainable land-use planning in Mangaluru, India. Remote Sens. Appl. 23 (1–18), 100602. doi:10.1016/j.rsase.2021.100602
Ding, P., and Ke, Q. (2020). Analysis on port coordinated development measure and influencing factors in upper Yangtze River. J. Shanghai M. Univ. 42, 68–73. (in Chinese).
Elvidge, C. D., Baugh, K. E., Kihn, E. A., Kroehl, H. W., and Davis, E. R. (1997). Mapping city lights with nighttime data from the DMSP Operational Linescan System. Photogramm. Eng. Rem. S. 63 (6), 727–734.
Elvidge, C. D., Zhizhin, M., Ghosh, T., Hsu, F. C., and Taneja, J. (2021). Annual time series of global VIIRS nighttime lights derived from monthly averages:2012 to 2019. Remote Sens. 13, 922–1014. doi:10.3390/rs13050922
Erdin, C., and Ozkaya, G. (2020). Contribution of small and medium enterprises to economic development and quality of life in Turkey. Heliyon 6 (2), 032155–e3314. doi:10.1016/j.heliyon.2020.e03215
Espon & Mcrit Ltd, (2014). Territorial scenarios and visions for europe. https://www.espon.eu/sites/default/files/attachments/ET2050_FR-02_Main_Report.pdf.
Fang, C. (2019). The basic law of the formation and expansion in urban agglomerations. J. Geo. Sci. 29, 1699–1712. doi:10.1007/s11442-019-1686-y
Gao, Y., Xiao, H. B., Xu, J. P., and Zhou, Q. (2020). Research on the development strategy of Neijiang and Zigong under the framework of coordinated development of five districts and one branch and multiple branches in Sichuan province. Econo. J. 7, 1–5.
Gherghina, S. C., Botezatu, M. A., Hosszu, A., and Simionescu, L. N. (2020). Small and Medium-Sized Enterprises (SMEs): the engine of economic growth through investments and innovation. Sustainability 15 (2), 347–412. doi:10.3390/su12010347
He, L., Tao, J., Meng, P., Chen, D., Yan, M., and Vasa, L. (2021a). Analysis of socio-economic spatial structure of urban agglomeration in China based on spatial gradient and clustering. Oecon. Copernic. 12 (3), 789–819. doi:10.24136/oc.2021.026
He, T. T., Lu, Y. P., Yue, W. Z., Xiao, W., Shen, X., and Shan, Z. (2020). A new approach to peri-urban area land use efficiency identification using multi-source datasets: a case study in 36 Chinese metropolitan areas. Appal. Geogr. 150, 102826–102920. doi:10.1016/j.apgeog.2022.102826
He, X., Cao, Y. W., and Zhou, C. S. (2021b). Evaluation of polycentric spatial structure in the urban agglomeration of the pearl river delta (PRD) based on multi-source big data fusion. Remote Sens. 13 (18), 3639. doi:10.3390/rs13183639
He, X. B., and Nicholas, C. S. (2014). Does economic growth affect urbanization? New evidence from China and the Chinese National Congress. J. Asian Econ. 36, 62–71. doi:10.1016/j.asieco.2014.12.003
Horst, L., Taczanowsk, K., Porst, F., and Arnberger, A. (2023). Evaluation of GNSS-based Volunteered Geographic Information for assessing visitor spatial distribution within protected areas: a case study of the Bavarian Forest National Park, Germany. Appl. Geogr. 150, 1–13. doi:10.1016/j.apgeog.2022.102825
Hu, D. Q. (2014). Integrated development promotes the merger of Zigong and Neijiang to build a central city in southern Sichuan. J. Decis. Consult. 3, 1–7.
Huang, Y., and Liao, R. (2021). Polycentric or monocentric, which kind of spatial structure is better for promoting the green economy? Evidence from Chinese urban agglomerations. Environ. Sci. Poll. Res. Inter. 28 (41), 57706–57722. doi:10.1007/s11356-021-14655-2
Huang, Y. F., Eddie, C. M., Zhou, J. M., Lang, W., Chen, T. T., and Li, X. (2020). Rural Revitalization in China: land-use optimization through the practice of place-making. Land Use Policy 97, 1–11. doi:10.1016/j.landusepol.2020.104788
Ibold, S., and Yun, X. (2021). National comprehensive three-dimensional transportation network planning outline. https://transition-china.org/wp-content/uploads/2021/03/Outline-of-the-National-Comprehensive-TDT-network.pdf.
Li, G., Wang, L. P., Xu, Z. G., Zhuo, Y. F., and Shen, X. Q. (2022). Spatial planning implementation effectiveness: review and research prospects. Land 11, 1–20. doi:10.3390/%20land11081279
Liu, X., Ming, Y. J., Yue, W. Z., and Han, G. F. (2022). Influences of landform and urban form factors on urban heat island: comparative case study between chengdu and chongqing. Sci. Total Enviro. 820, 153395–153399. doi:10.1016/j.scitotenv.2022.153395
Liu, Y. S. (2020). Modern human-earth relationship and human-earth system science. Sci. Geogr. Sin. 40 (8), 1221–1234. doi:10.13249/j.cnki.sgs.2020.08.001
Liu, Y. S., and Zhou, Y. (2022). Territory spatial planning and national governance system in China. Land Use Policy 102, 105288–105289. doi:10.1016/j.landusepol.2021.105288
Liu, Z. (2021). Identifying urban land use social functional units: a case study using OSM data. Int. J. Digit. Earth 14 (12), 1798–1817. doi:10.1080/17538947.2021.1988161
Lu, M., and Diab, E. (2023). Understanding the determinants of x-minute city policies: a review of the North American and Australian cities’ planning documents. J. Urban Mobil. 3, 100040–100113. doi:10.1016/j.urbmob.2022.100040
Lyu, Y., and Jiang, F. (2022). Spatial and temporal distribution of population in urban agglomerations changes in China. Sci. Rep. 12, 8315. doi:10.1038/s41598-022-12274-6
Ma, S. F., Cai, Y. N., Xie, D. X., Zhang, X. W., Zhao, Y. B., and Zhao., Y. (2022). Towards balanced development stage: regulating the spatial pattern of agglomeration with collaborative optimal allocation of urban land. Cities 126, 103645–103712. doi:10.1016/j.cities.2022.103645
Mahtta, R., Fragkias, M., and Güneralp, B. (2019). Urban land expansion: the role of population and economic growth for 300+ cities. npj Urban Sustain 223, 1–9. doi:10.1016/j.atmosenv.2019.117218
Masanobu, K. (2021). Projecting future populations of urban agglomerations around the world and through the 21st century. npj Urban Sustain 1, 10. doi:10.1038/s42949-020-00007-5
Maurya, P. K., Ali, S. A., Zaidi, S. K., Wasi, S., Tabrez, S., Malav, L. C., et al. (2023). Assessment of groundwater geochemistry for drinking and irrigation suitability in Jaunpur district of Uttar Pradesh using GIS-based statistical inference. Environ. Sci. Pollut. Res. Int. 30 (11), 29407–29431. doi:10.1007/s11356-022-23959-w
Mi, X. G. (2019). Neijiang and Zigong enhance integrated development. http://zigong.china.org.cn/2019-11/22/content_41012949.htm.
Orsi, F., Cavaco, C. C., and Gil, J. (2022). From territorial capital to regional design: a multidimensional model for territorial analysis and scenario evaluation. Plan. Pract. Res. 1, 21–20. doi:10.1080/02697459.2022.2120490
Paramasivam, C. R., and Venkatramanan, S. (2019). An introduction to various spatial analysis techniques. GIS Geostatistical Tech. Groundw. Sci., 23–30. doi:10.1016/B978-0-12-815413-7.00003-1
Regional Plan Association, (2020). America 2050 prospectus. https://rpa.org/work/reports/america-2050-prospectus.
Rodrigue, J. P. (2020). The geography of transport system. New York, NY, USA: Routledge. doi:10.4324/9780429346323
Sharma, G. K., Jena, R. K., Ray, P., Yadav, K. K., Moharana, P. C., Cabral-Pinto, M. M., et al. (2021). Evaluating the geochemistry of groundwater contamination with iron and manganese and probabilistic human health risk assessment in endemic areas of the world’s largest River Island, India. Environ. Toxicol. Phar 87, 103690–103713. doi:10.1016/j.etap.2021.103690
Shi, T., Dirienzo, N., Requia, W. J., Hatzopoulou, M., and Adams, M. D. (2019). Neighbourhood scale nitrogen dioxide land use regression modelling with regression kriging in an urban transportation corridor. Atmo. Enviro. 223, 117218–117219. doi:10.1016/j.atmosenv.2019.117218
Song, Y., Yeung, G., Zhu, D. L., Zhang, L. X., Xu, Y., and Zhang, L. Y. (2020). Efficiency of logistics land use: the case of yangtze river economic belt in China, 2000–2017. J. Transp. Geogr. 88, 102851–102912. doi:10.1016/j.jtrangeo.2020.102851
Sun, B. D., Liu, R., and Chen, Y. (2019). Spatial structure and economic performance of Chinese city clusters. City Plan. Rev. 43, 1–5.
Tamiminia, H., Salehi, B., Mahdianpari, M., Quackenbush, L., Adeli, S., and Brisco, B. (2020). Google Earth Engine for geo-big data applications: a meta-analysis and systematic review. ISPRS J. Photogram. 164, 152–170. doi:10.1016/j.isprsjprs.2020.04.001
Wang, H. J., Dai, S. P., and Huang, X. B. (2013). “The remote sensing monitoring analysis based on object-oriented classification method,” in Proceedings of the IGTA2013, Beijing, China, April, 2013, 92–101. doi:10.1007/978-3-642-37149-3_12
Wang, H. J., Kong, X. D., Luo, J., Li, P., Xie, T., Yi, X., et al. (2022c). A novel approach for monitoring the eco-environment of alpine wetlands using big geospatial data and cloud computing. Adv. Meteorol. 2022, 1–20. doi:10.1155/2022/7451173
Wang, H. J., Peng, P. H., Kong, X. D., Zhang, T., and Yi, G. (2019). Evaluating the suitability of urban expansion based on the logic minimum cumulative resistance model: a case study from leshan, China. ISPRS Int. J. Geo-info. 8 (291), 291–310. doi:10.3390/ijgi8070291
Wang, N., Li, W., Tao, R., and Du, Q. (2022b). Graph-based block-level urban change detection using Sentinel-2 time series. Remote Sens. Environ. 274, 112993–113022. doi:10.1016/j.rse.2022.112993
Wang, W. X., Deng, X. Z., Wang, Y. F., Peng, L., and Yu, Z. Y. (2022a). Impacts of infrastructure construction on ecosystem services in new-type urbanization area of North China Plain. Resour. Conserv. Recy. 185, 106376–106411. doi:10.1016/j.resconrec.2022.106376
Williams, B. G., Mackres, E., Angel, S., Blei, A. M., and Hall, P. L. (2022). Intra-urban land use maps for a global sample of cities from Sentinel-2 satellite imagery and computer vision. Compute. Environ. Urban. 100, 1–15. doi:10.1016/j.compenvurbsys.2022.101917
Wu, C., Jiang, A. D., and Zheng, W. L. (2022). Study on the measures for optimizing China’s provincial territorial space based on the perspective of resource and environmental carrying capacity in the new situation. Sustainability 14, 13754–13816. doi:10.3390/su142113754
Wu, Y. Z., Shi, K. F., and Chen, Z. Q. (2021). An improved time-series DMSP-OLS-like data (1992-2021) in China by integrating DMSP-OLS and SNPP-VIIRS. Harv. Dataverse V3. doi:10.7910/DVN/GIYGJU
Xie, Z. W., Yuan, M. L., Zhang, F. Y., Chen, M., Tian, M., Sun, L. S., et al. (2023). A structure identification method for urban agglomeration based on nighttime light data and railway data. Remote Sen. 15 (1), 216. doi:10.3390/rs15010216
Xue, B., Xiao, X., and Li, J. Z. (2022). Identification method and empirical study of urban industrial spatial relationship based on POI big data: a case of Shenyang City, China. Geogr. Sustain 1, 152–162. doi:10.1016/j.geosus.2020.06.003
Yadav, B., Malav, L. C., Jangir, A., Kharia, S. K., Singh, S. V., Yeasin, M., et al. (2023). Application of analytical hierarchical process, multi-influencing factor, and geospatial techniques for groundwater potential zonation in a semi-arid region of western India. J. Contam. Hydrology 253, 104122–104213. doi:10.1016/j.jconhyd.2022.104122
Yadav, K. K., Gupta, N., Kumar, V., Choudhary, P., and Khan, S. A. (2018). GIS-based evaluation of groundwater geochemistry and statistical determination of the fate of contaminants in shallow aquifers from different functional areas of Agra city, India: levels and spatial distributions. RSC Adv. 8, 15876–15889. doi:10.1039/C8RA00577J
Zhang, J., Zhang, X., Tan, X. P., and Yuan, X. D. (2022b). A new approach to monitoring urban built-up areas in kunming and Yuxi from 2012 to 2021: promoting healthy urban development and efficient governance. Int. J. Env. Res. Pub 19 (19), 12198. doi:10.3390/ijerph191912198
Zhang, X., Jie, X. W., Ning, S. G., Wang, K., and Li, X. P. (2022a). Coupling and coordinated development of urban land use economic efficiency and green manufacturing systems in the Chengdu-Chongqing Economic Circle. Sustain. Cities Soc. 85, 104012–104013. doi:10.1016/j.scs.2022.104012
Zhao, H., Yu, N., and Zhu, S. Y. (2022). International land-sea trade corridor for sustainable transportation: a review of recent literature. Clnr. Log. Sup. Ch. 6, 100089–100111. doi:10.1016/j.clscn.2022.100089
Zhao, W. Z., Bo, Y. C., Chen, J. G., Tiede, D., Blaschke, T., and Emerye, W. J. (2019). Exploring semantic elements for urban scene recognition: deep integration of high-resolution imagery and OpenStreetMap (OSM). ISPRS J. Photogramm. 151, 237–250. doi:10.1016/j.isprsjprs.2019.03.019
Zhu, F., Wu, X., and Peng, W. (2021). Road transportation and economic growth in China: granger causality analysis based on provincial panel data. Transp. Lett. 14 (7), 710–720. doi:10.1080/19427867.2021.1930853
Keywords: territorial spatial planning, urban system layout optimization, geospatial big data, Chengdu-Chongqing economic circle, urban expansion and multi-mode traffic
Citation: Wang H, Kong X, Luo J, Li P, Chen X and Xie T (2023) An approach to urban system spatial planning in Chengdu Chongqing economic circle using geospatial big data. Front. Earth Sci. 11:1252597. doi: 10.3389/feart.2023.1252597
Received: 04 July 2023; Accepted: 13 October 2023;
Published: 01 November 2023.
Edited by:
Kiril Bahcevandziev, Instituto Politécnico de Coimbra, PortugalReviewed by:
Krishna Kumar Yadav, Madhyanchal Professional University, IndiaCopyright © 2023 Wang, Kong, Luo, Li, Chen and Xie. This is an open-access article distributed under the terms of the Creative Commons Attribution License (CC BY). The use, distribution or reproduction in other forums is permitted, provided the original author(s) and the copyright owner(s) are credited and that the original publication in this journal is cited, in accordance with accepted academic practice. No use, distribution or reproduction is permitted which does not comply with these terms.
*Correspondence: Haijun Wang, d2FuZ2hhaWp1bkBzdXNlLmVkdS5jbg==; Xiangdong Kong, eGlhbmdkb25nX2tAbWFpbC5ybXV0dC5hYy50aA==
Disclaimer: All claims expressed in this article are solely those of the authors and do not necessarily represent those of their affiliated organizations, or those of the publisher, the editors and the reviewers. Any product that may be evaluated in this article or claim that may be made by its manufacturer is not guaranteed or endorsed by the publisher.
Research integrity at Frontiers
Learn more about the work of our research integrity team to safeguard the quality of each article we publish.