 Zi Zeng
 Jianjun Xu
 Guiling Ye
 Wenqi Shen
- 1College of Ocean and Meteorology, Guangdong Ocean University, Zhanjiang, China
- 2South China Sea Institute of Marine Meteorology, Guangdong Ocean University, Zhanjiang, China
- 3Shenzhen Institute, Guangdong Ocean University, Shenzhen, China
In this paper, multiple sets of reanalysis datasets are used to analyze the intensity of the Asian summer monsoon from 1979 to 2021. Typhoon Soudelor (No. 1513) and Typhoon Maria (No. 1808) were selected from the weak monsoon year 2015 and the strong monsoon year 2018, both of which were generated in the Northwest Pacific in July and made landfall in South China. The Weather Research and Forecasting Model (WRF) was used to simulate the two typhoons, starting 48 h prior to their landfall. The reasons for the differences in precipitation and how the monsoon affects typhoon precipitation in this process are analyzed from the aspects of monsoon background, ambient weather systems, typhoon thermodynamic structure, and water vapor conditions. The analysis shows that the circulation of Soudelor was stable and maintained for a long time. Despite existing in the background of a weak monsoon, the monsoon flow was able to reach the key area affecting typhoons and inject enough warm and moist flow to affect Soudelor. Combined with the analysis of typhoon structure, the strong water vapor transport of Soudelor and increased low-level convergence were conducive to the formation of typhoon-related rainstorms. The monsoon appeared to provide environmental conditions favorable for typhoon precipitation, resulting in a wide range of precipitation and heavy precipitation. Typhoon Maria developed and changed rapidly, moved rapidly, and the precipitation maintained itself for a relatively short time. The monsoon flow was not transported into Maria, resulting in insufficient water vapor inside Maria, which prevented the strengthening of typhoon precipitation. The precipitation of Maria mainly came from the dynamics of the typhoon itself and was not affected by the monsoon. In addition, this study defines an area on the southwest side of the typhoon moving with the center of the typhoon as the key area affecting typhoons. The characteristics of this area can be simply linked to typhoon precipitation, which can be considered an important research area for future analysis and prediction of typhoon precipitation.
1 Introduction
China is the country with the largest number of tropical cyclones (TCs) in the world and is among the countries with the worst typhoon disasters. The main factors that cause typhoon disasters are typhoon gales, heavy precipitation, and storm surge, coupled with secondary disasters such as floods and debris flows. Among these, typhoon rainstorms are one of the most frequent disasters. Many extreme rainfall records are related to tropical cyclone activities, posing great threats to life and property (Tao, 1980; Zhang et al., 2009; Zhang et al., 2011; Emanuel and Centre, 2018). Therefore, it is of great scientific significance to study the characteristics of typhoon precipitation, in addition to addressing the urgent need for national disaster prevention and mitigation.
According to the statistical analysis of the CMA-STI tropical cyclone best track dataset of the China Typhoon Network from 1949 to 2019, the TCs that made landfall in China are concentrated in the Taiwan Strait and along the coastline of the Beibu Gulf to the south, mostly in July-September (Su et al., 2021). The Asian summer monsoon evolves during this time, first initiated in the Bay of Bengal in early May before advancing eastward to the South China Sea and the tropical Northwest Pacific (Wu et al., 2013). The highest frequency of landfalling TCs in China basically coincides with the strongest period of the Asian summer monsoon, and the active areas are also consistent with each other. Therefore, the monsoon flow is likely to interact with typhoons during landfall and affect associated extreme weather activities.
A typhoon is a strong and deep warm cyclone with sufficient water vapor and strong ascending motions. However, the intensity of typhoon precipitation is not completely affected by the internal structure and intensity of the typhoon. Rather, it is often the result of the interaction of different scale systems, and the influence mechanisms are very complex and diverse. The large-scale environmental field also plays an important role in typhoon precipitation, and the role of the East Asian summer monsoon is certainly worthy of attention. The intensity of precipitation during typhoon landfall is largely due to the environmental conditions related to monsoon dynamics, the magnitude of water vapor transport, the low-level transport of moist static energy, and the supplement of vortex energy (Lei and Chen, 2001; Lei and Chen, 2003; Chen et al., 2004; Chen et al., 2010; Chen and Xu, 2017). Tropical Storm Bilis (No. 0604) is a typical example of the interaction between a landfalling typhoon and a monsoon surge. It encountered the monsoon surge as it traveled westward. The water vapor and energy provided by the monsoon surge and the strong low-level convergence under the strong monsoon background allowed the typhoon remnant vortex to recover, Bilis was maintained for an extended time and caused stronger typhoon-related precipitation (Teng et al., 2008; Wang et al., 2010a; Wu et al., 2021). Typhoon Morakot (No. 0908) was similar to Bilis. Its interaction with the prevailing southwest monsoon before and after landfall was the main mechanism of typhoon heavy rainfall, breaking many precipitation records in Taiwan and causing serious flooding, i.e., the “August 8 Flood.” Chang et al. (2017) analyzed the effects of convergence intensity and water vapor content of Morakot-related precipitation with the Weather Research and Forecasting Model (WRF) by changing the intensity of the southwest monsoon (Chang et al., 2017). The results show that they are positively correlated and associated with precipitation enhancement. Additional studies have shown that due to the low-frequency oscillation of the East Asian summer monsoon, the monsoon surge features a northward propagation, which continues to provide water vapor for typhoons, thus affecting the heavy rainfall in typhoons (Liu et al., 2022a). Therefore, how monsoon flow affects typhoon activity, especially regarding its impact on heavy precipitation, needs further study.
Typhoon Soudelor (No. 1513) and Maria (No. 1808) were both generated in the Northwest Pacific in July when the summer monsoon was strong and hit Taiwan, South China, and other regions in China. Their paths were similar, but the intensities of the two monsoons were different. It remains unclear how monsoon flows will affect East Asian typhoons under different summer monsoon backgrounds. In this paper, the WRF mesoscale numerical weather prediction model is used to simulate the 48-h process coincident with the two typhoons making landfall. Combined with the global reanalysis data, the landfall processes, precipitation results, and basic atmospheric elements of the two typhoons under strong and weak monsoon backgrounds are compared and analyzed, and the nature by which the precipitation of each typhoon is affected by the differing monsoon flows is discussed.
2 Data and methods
2.1 Datasets
In this study, the global climate and weather reanalysis data ERA5 from the European Centre for Medium-Range Weather Forecasts (ECMWF) is used as the initial and boundary conditions of the WRF model, it is also used to analyze the typhoon circulation situation and verify the WRF precipitation simulation results, with time resolution is 1 h and the horizontal resolution is 0.25° × 0.25°. The Integrated Multi-satellite Retrievals for GPM (IMERG) from Global Precipitation Measurement (GPM) is used as observation data to verify the WRF precipitation simulation results, with time resolution is 0.5 h and the horizontal resolution is 0.1° × 0.1°. The typhoon observation data are from the IBTrACS (International Best Track Archive for Climate Stewardship) dataset, including the position and pressure of the center and maximum sustained wind speed.
2.2 Model and experimental design
The global reanalysis data ERA5 is used as the background initial field and the WRF V4.2 is used to simulate Soudelor and Maria. All times are given in universal Time Coordinates. The simulation time of Soudelor (2015) is from 1800 6 August to 1800 8 August, and the simulation time of Maria (2018) is from 0600 9 July to 0600 11 July. These 48-h periods coincide with the northwestward typhoon movement process into mainland China after crossing the 48-h warning line for typhoons in China.
The detailed mode configuration scheme is shown in Table 1. The simulation adopts a two-layer nest whose specific areas are shown in Figure 1, both of which have a vertical resolution of 70 layers. The outermost layer—the entire monsoon region—has a horizontal resolution of 18 km; the innermost layer—the typhoon area—has a finer horizontal resolution of 6 km.
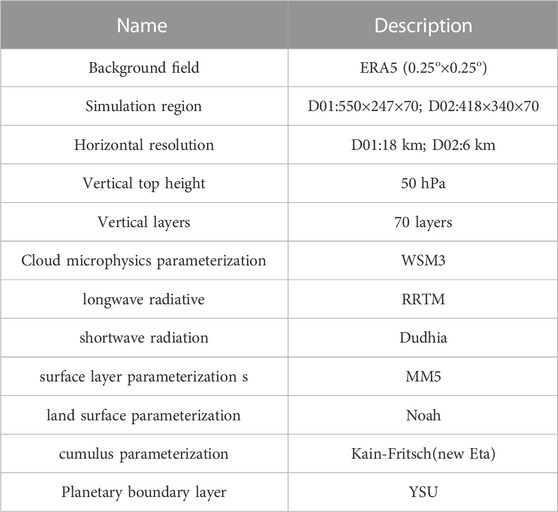
TABLE 1. WRF V4.2 model configuration.
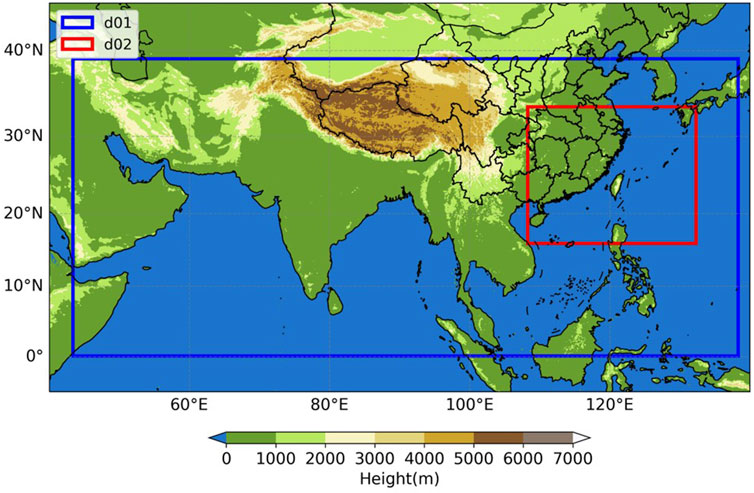
FIGURE 1. Simulation region, the shadow represents terrain height (unit: m).
2.3 South Asia summer monsoon index calculation
The total horizontal wind components (u, v) are divided into two subcomponents, the vertical mean (um, vm) and vertical shear (us, vs) values (deviating from each horizontal vertical mean), as follows:
noting that the mean component is defined as:
where the integration takes place over the approximate depth of the troposphere, from p0 = 1,000 hPa to pt = 100 hPa.
Using the above equation, the kinetic energy and its components can be expressed as:
Here,
2.4 Dynamic monsoon surge index
According to the definition within the “Meteorology Vocabulary” of the American Meteorological Society, a monsoon surge is the temporary extension of monsoon flow to a place that is usually not dominated by continuous monsoon flow. Under the background of the Asian summer monsoon circulation, the monsoon surge is characterized by a significant increase in wind speed and a significant change in weather phenomena and is highly correlated with the low-level jet. Previously, the monsoon surge was often defined as the regional average of the 850-hPa zonal wind over the designated area (Dong et al., 2010). However, considering the east-west movement of typhoons in the Northwest Pacific, the dynamic monsoon surge index (DMSI) (Zhao et al., 2021; Liu et al., 2022b) is used to distinguish between the typhoon circulation and monsoon surge circulation before and after typhoon landfall, which is defined as:
Here,
3 Circulation background and landfall situation
3.1 Circulation background
Typhoons Soudelor and Maria were generated on 30 July 2015 and 4 July 2018, respectively, during the month with the strongest Asian summer monsoon (Supplementary Figure S1). However, the background monsoon intensities associated with the two typhoons were different (Supplementary Figure S2), considering that 2015 was a weak monsoon year and 2018 was a strong monsoon year. The strong and weak years of the East Asian summer monsoon will feature certain differences in water vapor transport conditions and dynamic background circulation conditions. The interaction between the monsoon and the typhoon may also be different under different circulation backgrounds.
The 500-hPa geopotential height and wind field at 1800 6 August 2015 are shown in Figure 2A. At this time, the mid-tropospheric airflow in the middle and high latitudes of Asia has assumed the form of “two troughs and two ridges.” A trough extends from the northeastern part of Mongolia to the northern part of Hubei, which affects the westward extension of the western Pacific subtropical high. The subtropical high is zonally distributed. The ridge line of the subtropical high is located at about 35°N, its main body occupying the western Pacific with the strongest center located over southern Japan, where the intensity reaches 592 dagpm and the westernmost ridge point reaches as far as 120°E. At this time, Typhoon Soudelor moved northwestward along the southern extent of the subtropical high with strong intensity. This “saddle-shaped” circulation situation can slow the translation speed of the typhoon, thus providing favorable conditions for the maintenance of the typhoon and the enhancement of precipitation (Wang et al., 2010b). The 500-hPa geopotential height and wind field at 0600 9 July 2018 are shown in Figure 2B. There is a cyclonic center (vortex) of 560 dagpm over Lake Baikal, and the subtropical high in the western Pacific is strong, showing a zonal distribution. There is an anticyclonic center of 592 dagpm in the southern and eastern seas of Japan. The ridge line of the subtropical high is distributed in an east-west direction and was located near 30°N. The western ridge line of the subtropical high extends to the mainland, and the westernmost ridge point extends to 110°E. The guiding airflow was strong, and Typhoon Maria moved rapidly westward along the subtropical high. From the 850-hPa wind field in Figures 2C, D, it is evident that there is a jet stream to the south of Soudelor, which obviously connects the southwest monsoon flow with the cyclone’s circulation. This jet stream belt can transport water vapor and low-level moist static energy to the typhoon and affect its precipitation intensity. Different from Soudelor, the southwest monsoon flow at 60°-100°E is stronger, but the southwesterly wind speed on the south side of Maria was much smaller.
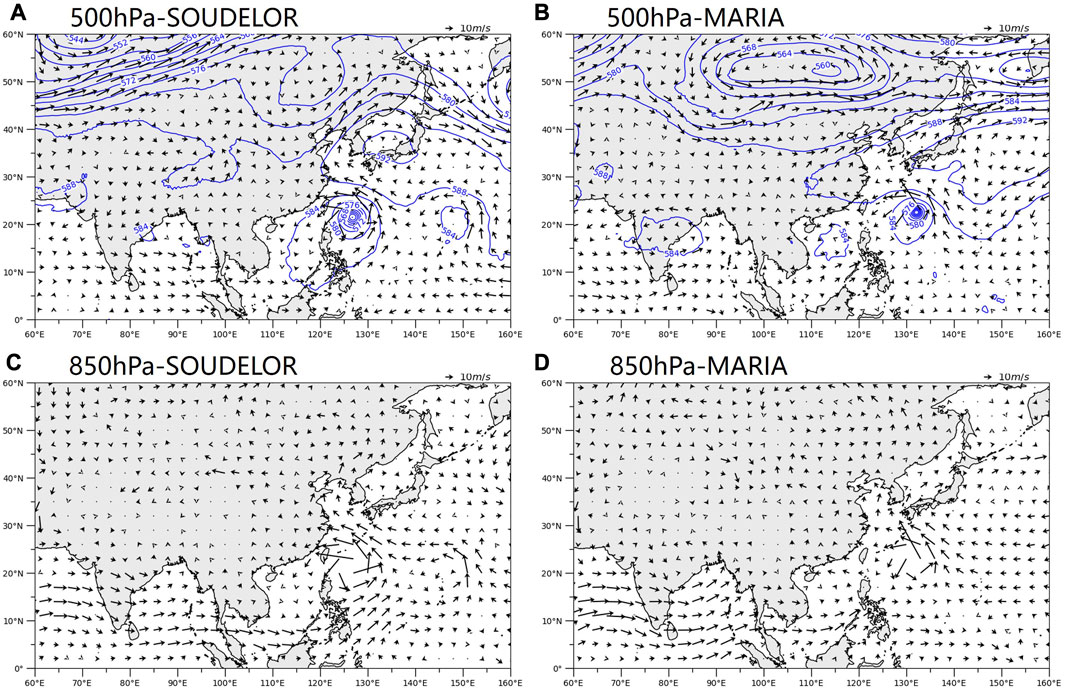
FIGURE 2. The 500-hPa geopotential height field (black solid line, unit: dagpm) and wind field (black arrow, unit: m/s) of (A) Soudelor and (B) Maria. Panels (C, D) are the same as in (A, B), but for the 850-hPa wind field (unit: m/s).
3.2 Typhoon landfall situation
Both Soudelor and Maria were summertime super typhoons generated in the Northwest Pacific. Maria had a strong intensity and maintained itself for a long time (up to 81 h) as a super typhoon. After generation, their movement paths were consistent, to the west-northwest. Their intensity gradually increased to attain super typhoon status, before finally making landfall in Fujian Province, China. Soudelor first made landfall in Taiwan Province, before making a second landfall in Fujian Province after crossing the Taiwan Strait.
Using the historical track data of TCs in the IBTrACS dataset, the accuracy of the track and intensity of the two typhoons in the 48 h of this numerical simulation was tested. Figure 3A shows the comparison of the track results near the time of the typhoon landfalls. It can be seen that the track simulation (red) of Typhoon Soudelor is more accurate before landfall in Taiwan Province, but there is a large deviation after its initial landfall in Taiwan Province, and there are some deviations until the second landfall in Fujian Province. The track simulation result of Typhoon Maria track (blue) is satisfactory, but also demonstrated a northerly bias in the last two moments after landing in Fujian Province; otherwise, the simulation basically coincides with the observation. In general, the process of two typhoons moving northwest is well simulated, which is beneficial to the following research. However, there are different degrees of deviation after landfall, which may be related to the influence of land friction on the typhoon; but as far as the landfall points are concerned, the two typhoons are closer to the actual situation, with almost no time delay. It can also be seen that within 48 h of the same duration, the track of Typhoon Maria is longer than that of Soudelor, indicating that the typhoon moved and developed faster. Figures 3B–E compares the observed and simulated minimum sea level pressure at the typhoon center and the maximum wind speed at the typhoon center to test the simulation effect of typhoon intensity. It can be seen that over the course of 48 h, the numerical testing scheme simulates the process of typhoon intensity maintenance and weakening, and the overall trend is consistent with the actual situation. However, in both observations and simulations, the intensity of Typhoon Maria (blue) changed more than that of Typhoon Soudelor (red), implying that Maria weakened faster; while the pressure of Soudelor in the early and middle stages changed little. Soudelor also experienced a significant decompression process that was accompanied by an increase in wind speed, which was conducive to the maintenance of its intensity.
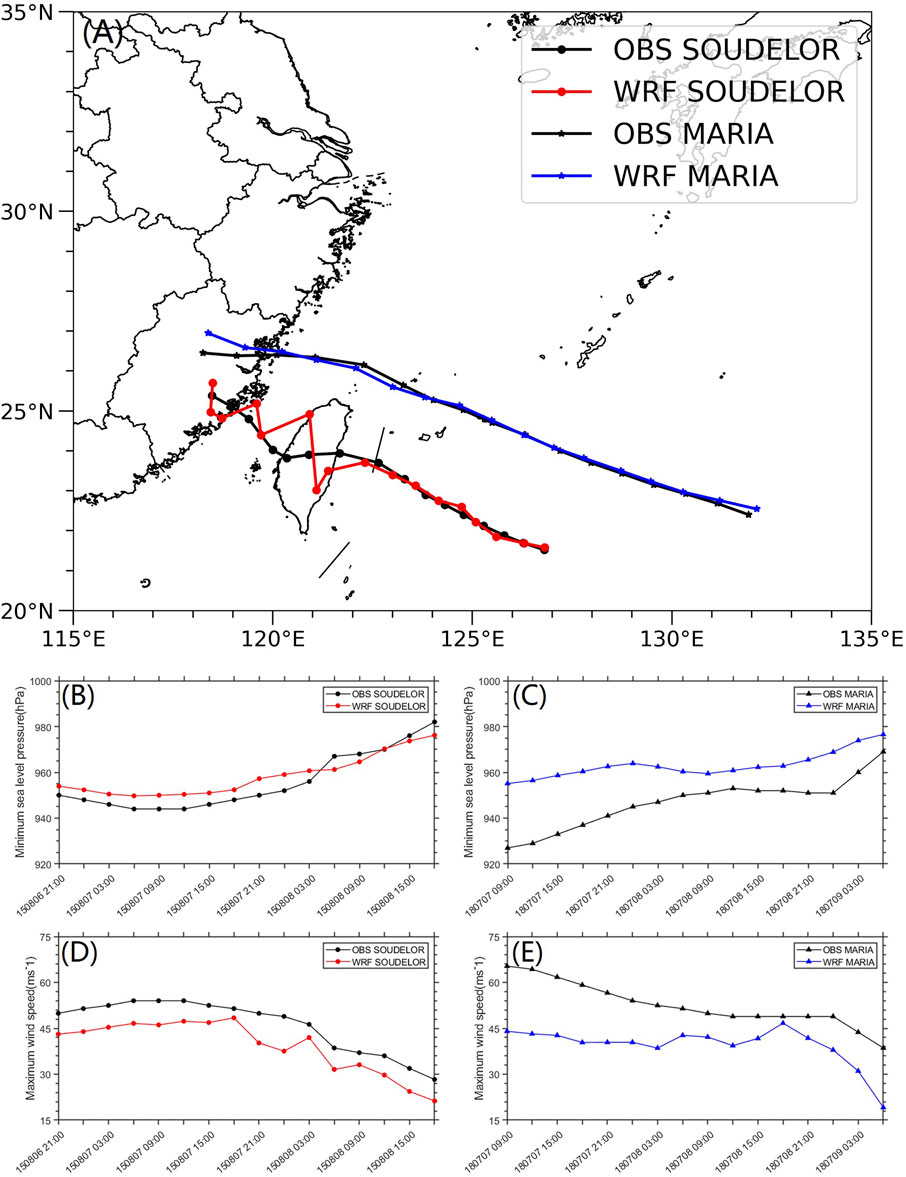
FIGURE 3. The observation and simulation of (A) the path of Soudelor and Maria, and the minimum sea level pressure at the typhoon center (unit: hPa) for (B) Soudelor and (C) Maria. Panels (D, E) are the same as in (B, C), but for the maximum wind speed of the typhoon center (unit: m/s).
4 Typhoon precipitation simulation results
The WRF simulated 12-h cumulative precipitation spatial distribution for typhoons Soudelor and Maria are verified by using ERA5 reanalysis data and GPM precipitation observation data in Figures 4, 5. Upon comparison with the ERA5 reanalysis data, the WRF simulation more closely mirrors the precipitation level and spatial distribution found in the GPM precipitation observation data. Conversely, the ERA5 appears to underestimate the precipitation process. Such findings underscore the WRF model’s superior capability in simulating the precipitation processes of the two typhoons. Furthermore, the resolution of ERA5 is more coarse than that of the WRF, limiting its ability to capture the mesoscale intricacies of typhoon precipitation. Consequently, the WRF model was chosen to simulate the precipitation of the two typhoons for this study. In the 48 h of simulation, Soudelor and Maria moved along a northwest trajectory, bringing strong precipitation to Taiwan, Fujian, and Zhejiang provinces, and affecting Jiangxi, Hunan, Guangdong, and other provinces. It can be seen from Figures 4, 5 that the precipitation distribution characteristics of the two typhoon processes have obvious asymmetry. The 12-h cumulative simulated precipitation exceeds the magnitude of the heavy rainstorm by 140 mm in many places and at many times. In particular, the cumulative precipitation of Soudelor (Figures 4A–D) exceeded 210 mm or even 240 mm in many places, and the precipitation range was also much larger than that of Maria. The precipitation is relatively concentrated, while Maria (Figures 5A–D) moved faster, the position of the precipitation center changed faster, and the intensity and range of precipitation were not as strong as Soudelor. Combined with the 3-h cumulative precipitation map of the two typhoons in Figure 6, it can be seen that the cyclonic characteristics of Soudelor’s precipitation are more obvious, with a widely extended spiral rain belt with large precipitation intensity. Before the first landfall in Taiwan Province, the large-value area of precipitation was mainly on the southeast side of the typhoon. Upon landfall, the large-value area of precipitation gradually moved to the land area. Especially after the second landfall in Fujian Province, the large-value area of precipitation was mainly located in Fujian Province, Zhejiang Province, and western Taiwan, further noting a gradual reduction in Soudelor’s precipitation range. In contrast, Maria’s spiral rainbands were less extensive, and the precipitation was mainly distributed on the southeast side of the typhoon. As the typhoon approached northern Taiwan, the precipitation on the south side of the typhoon gradually increased. After landfall, the precipitation was mainly distributed in Fujian Province and Zhejiang Province.
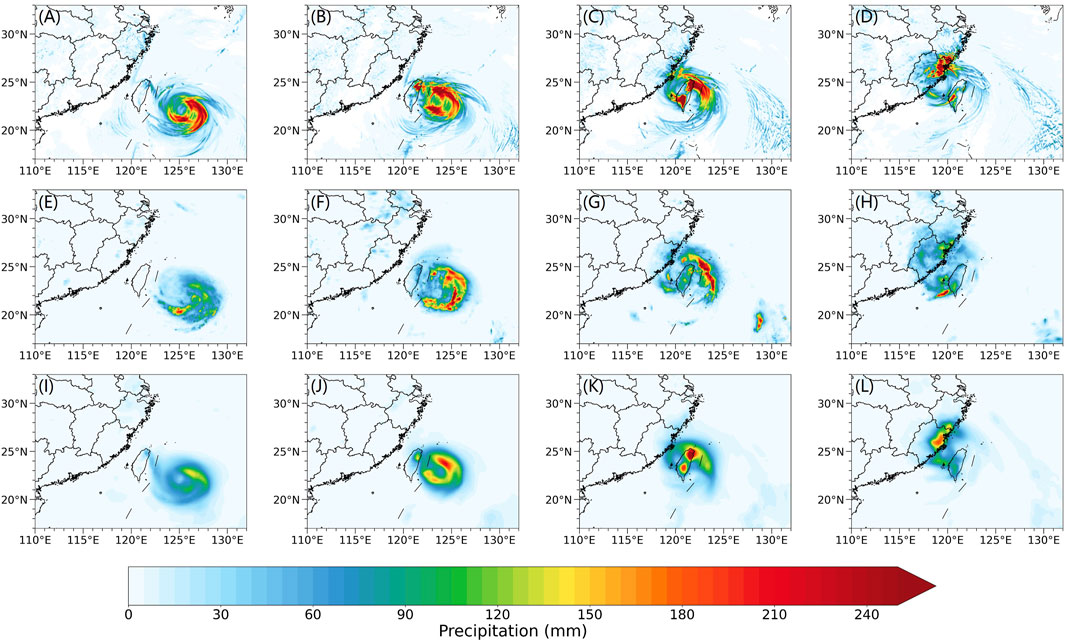
FIGURE 4. The cumulative precipitation per 12 h (unit: mm) for Soudelor (A–D) WRF simulation results, (E–H) GPM precipitation observations and (I–L) ERA5 reanalysis data.
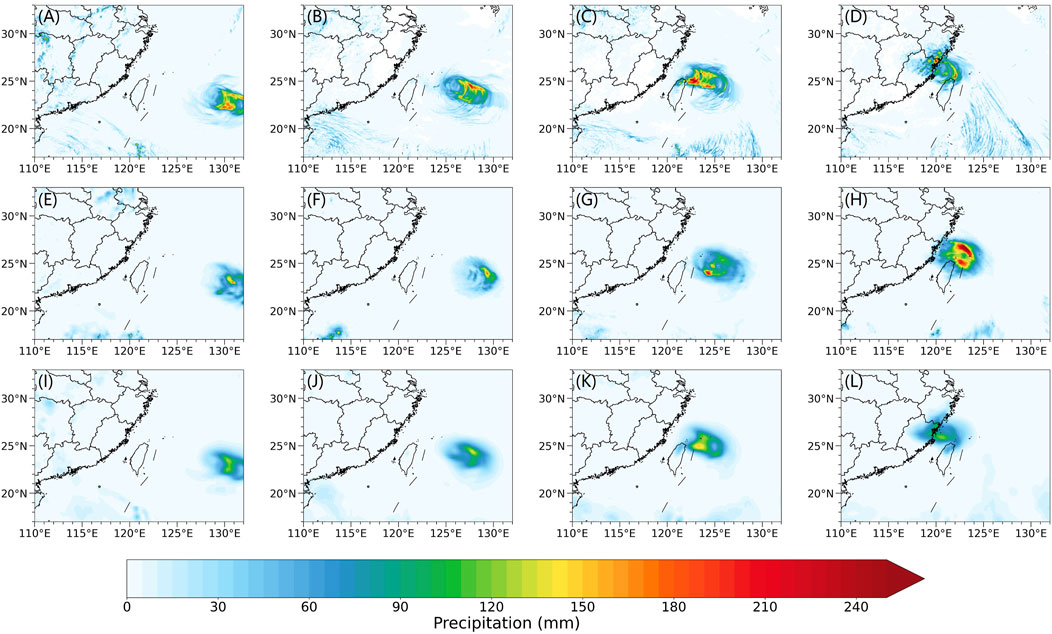
FIGURE 5. Same as in Figure 4, but for Maria.
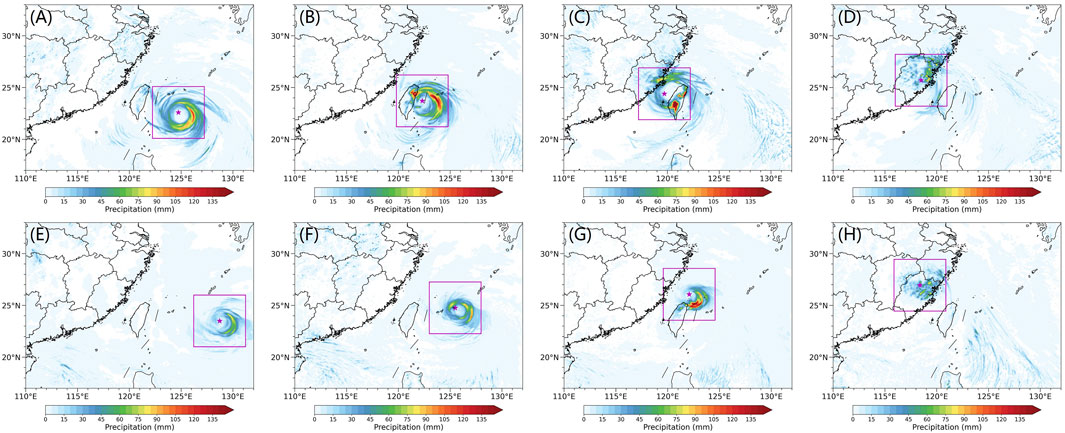
FIGURE 6. The 3-h cumulative precipitation (unit: mm) for Soudelor (2015) (A) 0300 7 August, (B) 1,500 7 August, (C) 0300 8 August, and (D) 1,500 8 August; and for Maria (2018) (E) 1,500 9 July 1,500, (F) 0300 10 July, (G) 1,500 10 July, and (H) 0300 11 July. The purple frame is the typhoon area, ranging from 2.5° west to 2.5° east of the typhoon center.
5 Possible reasons for the rainfall
5.1 Characteristics of the wind field and water vapor flux
From the previous section, we can see that during the two typhoons, the western Pacific subtropical high extended significantly westward, and the formation of Soudelor led to a relatively more stable “saddle-shaped” circulation situation. The westward extension point of Maria’s subtropical high extended inland into China. The circulation background of both typhoons was conducive to the northwest movement, thus affecting the location of precipitation. In addition, water vapor may have played a more important role in their heavy precipitation. To analyze the influence of Asian summer monsoon flow on typhoon precipitation, the 850-hPa wind field and water vapor flux field were compared and analyzed. It can be seen from Figure 7 that both Soudelor and Maria had obvious southwest monsoon flow on the southwest side during their landfall. According to the above analysis, the monsoon background and southwest monsoon flow of Soudelor were weaker, but the monsoon flow can also be transported from the Indian Ocean to the South China Sea, allowing the typhoon to maintain a large intensity. Although the monsoon background of Maria was stronger, the wind speed suddenly weakened after passing through the South China Sea region, and there was a clear fracturing phenomenon evident.
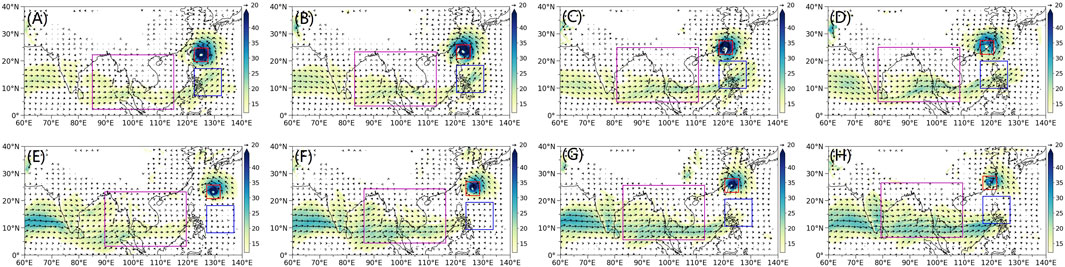
FIGURE 7. Same as in Figure 6, but for the 850-hPa wind field (unit: m/s). The red box is the typhoon area, and the range is the same as the typhoon area in Figure 5. The purple box is the monsoon surge area, which is 40°–10° to the west of the typhoon center and 20°–0° to the south. The blue box is the key area affecting typhoons, ranging from 2.5° west to 7.5° east of the typhoon center and from 15° south to 5° north. The shadow indicates that the wind speed is greater than or equal to 12 m/s.
There is a strong correlation between water vapor transport and wind field. The size of water vapor flux is determined by both the specific humidity and wind speed, which plays an important role in typhoon-related heavy precipitation (Liu et al., 2008; Zhang et al., 2008). Combined with Figure 8, it can be seen that during the Soudelor landfall process (Figures 8A–D), a complete water vapor transport belt was formed from the Arabian Sea, the Bay of Bengal, and the South China Sea to the Typhoon Soudelor area. The southwest monsoon flow transported warm and humid water vapor from the Indian Ocean to the typhoon area, providing abundant water vapor conditions for Soudelor, and part of the water vapor even flowed into the Northwest Pacific. During the landfall of Maria (Figures 8E–H), similar to the 850-hPa wind field, the water vapor flux from the northern Indian Ocean to the South China Sea is strong, but there was an obvious fracture in the Luzon Strait area, which made it impossible to transport water vapor to Maria. More water vapor flowed northward to land when passing through the Bay of Bengal, and continued to flow eastward to the Northwest Pacific Ocean. In summary, during the two typhoon landfalls, Soudelor received large amounts of heat and water vapor transported by the Asian summer monsoon flow; in contrast, Maria’s water vapor transport was, to a large degree, self-generated from the Northwest Pacific Ocean, which was also an important reason for the precipitation differences between Soudelor and Maria.
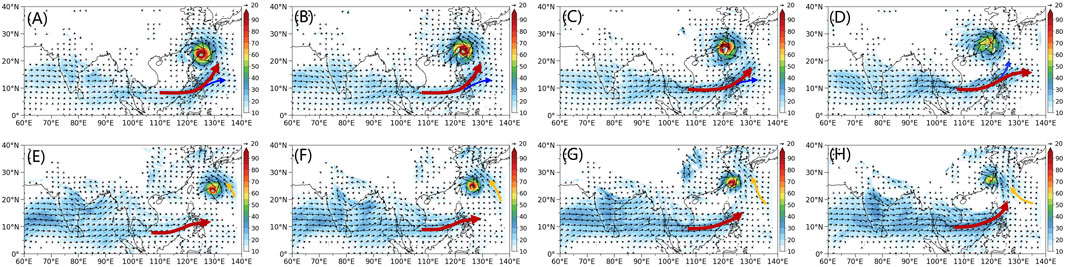
FIGURE 8. Same as in Figure 6, but the water vapor flux field (unit:
5.2 Dynamic monsoon surge index
Many previous studies have shown that monsoon surges significantly impact both extreme precipitation and precipitation enhancement. For example, the 850-hPa cross-equatorial flow and zonal wind are significantly enhanced, allowing for the transport of large amounts of heat and water vapor into the typhoon’s circulation. It may also reduce the zonally averaged geostrophic flow, resulting in a slower typhoon translational speed and enhanced rainfall (Wang et al., 2010a; Lu et al., 2012; Zhao et al., 2021; Liu et al., 2022a), prompting one to consider whether DMSI can be effectively used as a new indicator to predict typhoon precipitation. Figure 9 shows the time series of DMSI (solid line) and typhoon regional precipitation (columnar). The selected area of typhoon precipitation is the same as the purple rectangular box in Figure 6, which mainly extends 2.5° in latitude and longitude from the typhoon center to the north, south, east, and west. It can be found that the DMSI of Soudelor is significantly weaker than that of Maria, but its precipitation was much more than that of Maria. That is to say, for these two typhoon cases, a strong DMSI corresponded to weak precipitation. If the DMSI were to correspond to strong precipitation, there is no obvious consistency between the change trend of DMSI and precipitation. Therefore, in the process of these two typhoons, it is not enough to use DMSI to explain the influence of monsoon flow on typhoon precipitation, so we need to resort to other methods/metrics to study the relationship between typhoon precipitation and strong and weak monsoons.
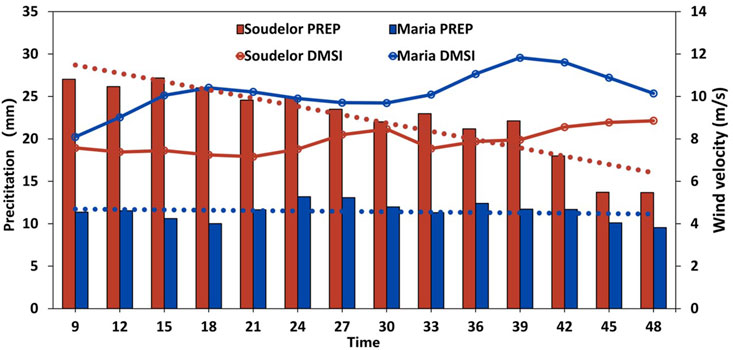
FIGURE 9. Time series of the dynamic monsoon surge index (solid line) and typhoon precipitation (columnar).
5.3 The change of meteorological factors in the key area affecting typhoons
According to the previous comparative analysis, it is found that the southwest monsoon flow transport associated with typhoons Soudelor and Maria is significantly different in their southern region. Through this region, Soudelor is connected to the monsoon flow, while Maria is decoupled from the monsoon flow. Therefore, a key area affecting typhoons is defined by extending the typhoon center from 2.5° to the west and 7.5° to the east and from 15° to the south and 5° to the north, whose position moves with the typhoon center, as shown in the blue rectangular frame in Figure 7, to study the relationship between the changes of meteorological elements in this area and typhoon precipitation. Figure 10 depicts a time series diagram of meteorological factors in the key area affecting typhoons. Table 2 gives the average precipitation in the typhoon area and the portion of the time that meteorological factors changed in the key area affecting typhoons. It can be found that the water vapor flux in this area is consistent with the change of the two wind components, and the size of each element of Soudelor is significantly higher than that of Maria. Combined with typhoon precipitation, it is found that the precipitation of Soudelor is highly consistent with the factors within its key area affecting typhoons, especially the meridional wind. During the landfall process, the water vapor flux and zonal wind maintain high values, while the meridional wind had a obvious downward trend, and the precipitation intensity also decreases with the weakening of the meridional wind. In contrast, the precipitation intensity of Maria does not change much with time. Although the elements in the key area increase to a certain extent in the later period, it may be because the values of the factors are relatively small, and the monsoon flow experienced difficulty in maintaining the transport of water vapor and energy to the typhoon area. By analyzing the changes of the elements in the defined dynamic key area affecting typhoons, it is found that Soudelor occurred under the background of a weak monsoon, noting that if the monsoon flow continued to maintain and transport water vapor and energy to the key area, the zonal wind would further transport water vapor and energy to the typhoon area, resulting in strong typhoon precipitation. In contrast, Maria existed under the background of a strong monsoon, but the monsoon was unable to transmit the warm and humid airflow to the key area, so the typhoon precipitation in Maria was only slightly affected by the monsoon. The characteristics of the key area are related to typhoon precipitation to a certain extent and can respond to typhoon precipitation. As such, this area can be considered to be an important research area for future analysis and prediction of typhoon precipitation.
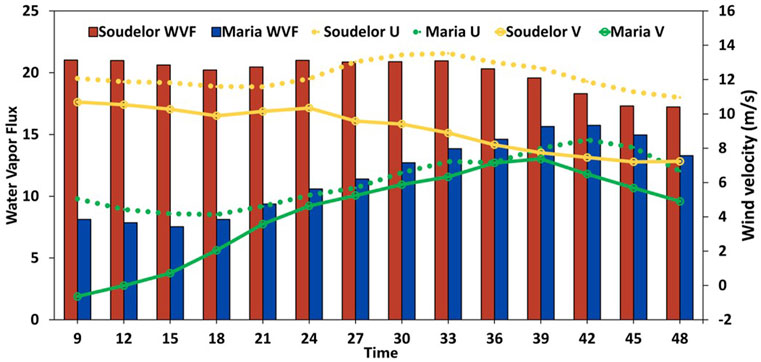
FIGURE 10. Time series of water vapor flux (columnar), zonal wind (dotted line), and meridional wind (solid line) in the key influence area of the typhoon.
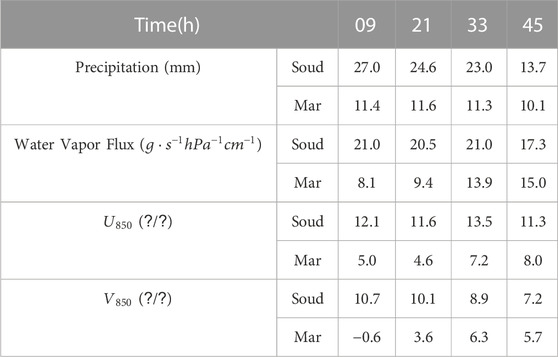
TABLE 2. Typhoon precipitation and changes in meteorological factors within the key area affecting typhoons.
5.4 Typhoon vertical water vapor characteristics and thermodynamic structure
The above analysis shows that there are great differences concerning a monsoon’s influence on typhoon precipitation under different monsoon background intensities. In addition to the favorable large-scale background circulation field and whether the monsoon can transport water vapor to the key area affecting typhoons, the internal water vapor distribution, vertical motion, and thermodynamic structure of the typhoon are also key factors affecting typhoon precipitation.
The basic ingredients for heavy rainfall are the same as the general rainstorm conditions, which require abundant water vapor and strong ascending motion. From the evolution of the water vapor flux divergence field and vertical velocity field of the two typhoons in Figure 11, it can be seen that the low-level water vapor convergence and upper-level divergence of Soudelor are strong (Figure 11A) and accompanied by a strong vertical ascending motion (Figure 11B), which is also due to the southwest monsoon. This setup provides favorable water vapor conditions combined with strong ascending motion and is conducive to the occurrence and development of typhoon-related heavy precipitation, and the water vapor flux divergence and vertical motion fields are consistent with the time variation of Soudelor precipitation. In contrast, the water vapor flux divergence and vertical ascending motion of Maria is weaker (Figures 11C, D), which is related to the previous analysis that the monsoon cannot transport warm and humid water vapor to the typhoon area, resulting in less water vapor and weaker vertical motions within Maria.
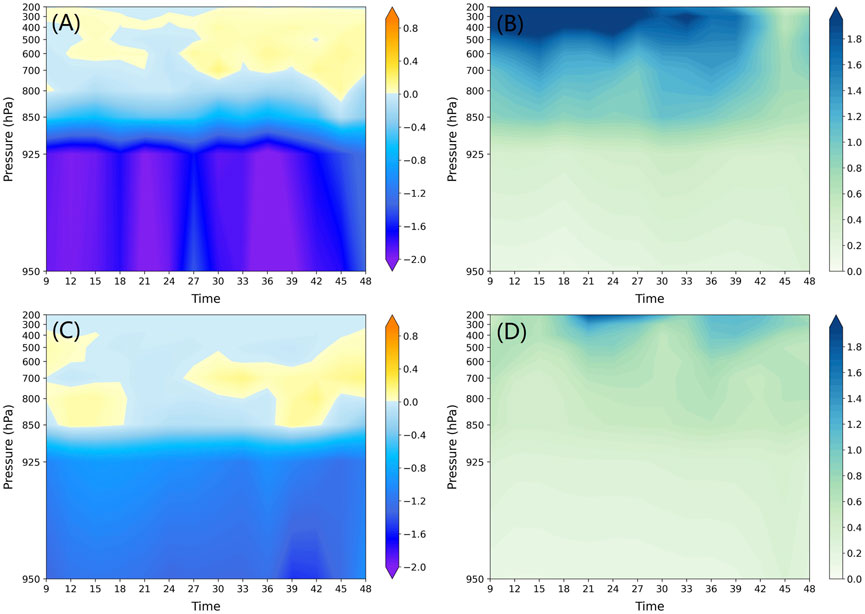
FIGURE 11. Soudelor (A) The time-varying profile of the regional average water vapor flux divergence field (unit:
At the same time, the dynamic conditions and structure of the typhoon itself are important factors affecting the intensity and location distribution of typhoon precipitation (Chen and Win-Nielsen, 1976; Yan et al., 2019; Han et al., 2021). To further analyze the mechanism by which the monsoon affects typhoon precipitation, the thermal dynamic structure of Soudelor and Maria during their development and evolution is analyzed below. Yang Chang et al. (2017) pointed out that both the temperature and vorticity fields are important factors affecting a typhoon (Yan et al., 2019). Horizontal vorticity is an important physical quantity to measure the dynamic conditions of heavy rainfall, and it is also an important factor to trigger heavy rainfall. In particular, it plays an important role in the formation of spiral rainbands (Rasmussen et al., 1994; Xu and Wu, 2003; Min et al., 2010). The vertical distribution of pseudo-equivalent potential temperature is a physical quantity that characterizes the distribution of atmospheric energy and the state of vertical stability; as such, it is a useful diagnostic tool for heavy precipitation. Figure 12 shows the profiles of absolute vorticity and pseudo-equivalent potential temperature at different times for the two typhoons. It can be seen that the vertical positive vorticity column of Soudelor at 0300 7 August 2015 is widely distributed in the meridional direction. There is a large vorticity center between 0.5° and 1° of longitude on both sides of the typhoon center (especially on the east side of the typhoon). The absolute vorticity value decreases with height in the vertical direction, indicating the presence of large divergence at upper levels. There is a dense area of pseudo-equivalent potential temperature lines on the east side of the typhoon at this time, indicating that there is obvious convective instability in this area. Such a thermodynamic structure is conducive to the occurrence of strong vertical motions, which favors precipitation. These characteristics are consistent with the heavy precipitation area in Figure 6A. However, by 1,500 8 August the absolute vorticity value in the meridional and vertical directions is greatly reduced, and the pseudo-equivalent potential temperature lines become sparse. This indicates that the vertical motion of the typhoon is weakened and that the precipitation is reduced (Figure 6D), which may be related to landfall processes. In contrast, Maria’s two-time positive horizontal vorticity distribution is more concentrated in the center of the typhoon and the value is larger; therefore, the positive vorticity changes slowly with height. Similarly, on both sides of the typhoon center, there are dense areas of equivalent potential temperature lines, but less so than in Soudelor. From the above analysis, it can be seen that the internal structure and changing nature of the typhoon are the key factors triggering precipitation. The internal structure of Soudelor is more conducive to the triggering and maintenance of typhoon precipitation, lifting water vapor from the lower to upper levels to form precipitation.
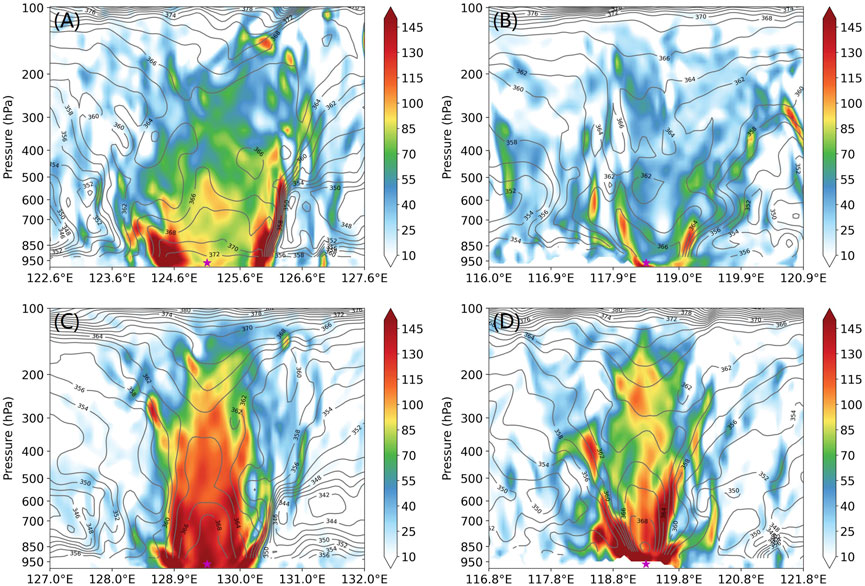
FIGURE 12. The height-longitude profile of the absolute vorticity (fill color, unit:10−5 s-1) and the pseudo-equivalent potential temperature (isoline, unit: (K) along the latitude of the typhoon center Soudelor (2015) (A) 0300 7 August 0300 and (B) 1,500 8 August; and Maria (2018) (C) 1,500 9 July and (D) 0400 11 July. The purple pentagrams indicate the location of the typhoon center.
The vertical wind shear environment is also an important factor affecting the intensity of typhoons. Good vertical wind shear conditions are conducive to the maintenance of typhoons and are also related to the asymmetric distribution of convection and precipitation (Chen et al., 2006; Wingo and Cecil, 2010). Figure 13 shows the evolution of vertical wind shear in two typhoon processes over time. It can be found that the vertical wind shear of Maria is weak, which maintains the warm core structure of the typhoon well, corresponding to its thermal structure. Soudelor existed in a strong vertical wind shear environment. This is because the environmental wind field of Soudelor is basically controlled by the monsoon flow, and the environmental wind field in the lower and upper layers is strong, which makes its warm core structure more dispersed. However, in the middle period, the vertical wind shear increased less and weakened significantly in the later period, which was conducive to the maintenance of typhoon intensity. Strong vertical wind shear is often accompanied by dynamic instability. Although the formation of typhoons requires small vertical wind shear and that strong vertical wind shear is known to inhibit the development of typhoons, vertical wind shear is accompanied by the accumulation and release of unstable energy, resulting in strong horizontal vorticity and secondary circulations, which further strengthens the upward motion in the rainstorm area and provides dynamic conditions conducive for strong rainstorms (Yu et al., 2007; Ding et al., 2018).
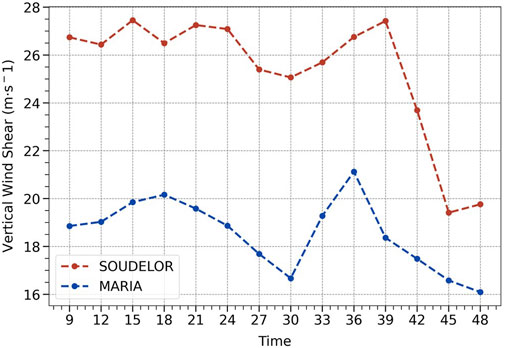
FIGURE 13. Time series of the 200–850-hPa vertical wind shear of Soudelor and Maria.
6 Discussion
The tracks of typhoons Soudelor and Maria are similar. They were first generated in the Northwest Pacific Ocean near the Marshall Islands and developed during the strong summer monsoon period. Their intensities reached super typhoon status and both made landfall in South China, causing heavy precipitation. However, their respective monsoon backgrounds were quite different, and the heavy precipitation from the two typhoons was greatly and differentially affected by the monsoon. In this paper, the WRF is used to simulate their processes 48 h prior to the landfall of the two typhoons, and the precipitation of each typhoon is compared. The reasons for the difference in precipitation and how the monsoon flow affected typhoon precipitation in this process are analyzed from the aspect of monsoon background, ambient atmosphere, typhoon thermodynamic structure, and water vapor conditions. The main conclusions are as follows.
(1) Typhoon Soudelor occurred under the background of a weak monsoon, while Maria existed under the background of a strong monsoon. The environmental conditions for the formation and development of the two typhoons were both good, and the subtropical high was strong. Soudelor formed a more stable pattern of “two troughs and two ridges” and connected with the monsoon flow through a jet stream to its southwest, and its intensity was well maintained. Maria’s westward ridge point was deeper and the typhoon intensity was large, but the movement speed was fast, its development rapid, and there was a clear blocking between the monsoon flow.
(2) The two typhoon precipitation processes demonstrate obvious asymmetries regarding their typhoon-related precipitation. The precipitation was mostly distributed on the southeast side of the typhoons and gradually moved to the land with a large-value area of precipitation upon landfall. Among them, Maria moved fast with quick transit, and the duration of precipitation was short-lived. Soudelor moved relatively slowly, and the range and magnitude of precipitation were much larger than that of Maria.
(3) The characteristics of the 850-hPa wind field and water vapor flux field in the two typhoon processes are different. Although the monsoon background of Soudelor is weak, a complete conveyor belt is formed, directed from the Indian Ocean-South China Sea to the typhoon, which continuously injects a large amount of warm and humid air into the typhoon through the monsoon flow. The monsoon background of Maria is strong, but the monsoon flow suddenly weakens after flowing through the South China Sea, and the water vapor conveyor belt is obviously broken.
(4) Using the monsoon surge to study the influence of monsoon on typhoon precipitation, we find that the DMSI intensity does not correspond to precipitation, and the DMSI of Soudelor that caused heavy precipitation is much weaker than that of Maria. Therefore, this paper defines a key influence area for the typhoon to study its relationship with typhoon precipitation. We find that the values of Soudelor’s meteorological elements in this area are significantly higher than those of Maria, and the precipitation is highly consistent with each element, especially the meridional wind and water vapor flux. Therefore, it appears that under the background of this weak monsoon, the monsoon flow can be further transported to Soudelor specifically into the typhoon’s key influence area, enhancing its ability to bring heavy precipitation. In contrast, under the background of a strong monsoon, the typhoon precipitation of Maria is less affected by the monsoon as the monsoonal warm and humid airflow cannot be transported into the key area.
(5) From the perspective of the internal structure of the typhoon, the southwest monsoon transported a large amount of water vapor to Soudelor. Coincident with the strong upward motion, the absolute vorticity weakened with height, the upper-level divergence was strong, and the strong vertical wind shear led to conditional instability. However, the relative stability in the early and middle periods and the weakening in the later period allowed for Soudelor’s intensity to be maintained, so Soudelor’s precipitation intensity was large, its range was wide, and its duration was long. Maria had a complete and compact typhoon circulation structure and weak vertical wind shear, but its precipitation differs greatly from Soudelor’s. The main reasons were that the southwest monsoon flow was blocked causing deficient water vapor conditions, the vertical ascending motions were weak, the upper-level divergence was weak, and the typhoon moved and developed fast.
In this paper, the influence of Asian summer monsoon flow on typhoon precipitation is preliminarily discussed through the study of two typhoon cases. It is inferred that the strong typhoon precipitation of Soudelor was affected by the monsoon, mainly because of the monsoon-related transport of warm and humid air to the typhoon center, providing energy for typhoon development and providing water vapor conditions for heavy precipitation. Maria was less affected by the monsoon, and the water vapor conditions contributing to precipitation mainly came from the typhoon itself and the underlying ocean surface. This paper proposes the establishment of a key area that is particularly sensitive to modulating typhoon development and morphology, which may be used as an area for detailed analysis to deduce to what degree monsoon flow can affect typhoon precipitation. This key area represents an important research direction for future analysis and prediction of typhoon precipitation. At present, this is only a simple case study, which is not universal. In the future, it will be necessary to further account for whether the precipitation from a large number of typhoons is affected by this region and to assess the change of monsoon flow into the region as well as its change mechanism.
Data availability statement
The original contributions presented in the study are included in the article/Supplementary Material, further inquiries can be directed to the corresponding author.
Author contributions
ZZ was responsible for the study conception, manuscript writing, and figure development. JX provided guidance and funding support. GY were responsible for discussion and manuscript revision. WS were contributed to the conception and design of the work. All authors contributed to the article and approved the submitted version.
Funding
This study was supported by Key Projects of The National Natural Science Foundation of China (Grant 42130605) and Major Projects of National Natural Science Foundation of China (Grant 72293604).
Acknowledgments
The authors would like to thank the funding agencies and the team of ECMWF, NCEP/NCAR and JMA for making this study possible. We would also like to thank the editors and the reviewers for their valuable suggestions.
Conflict of interest
The authors declare that the research was conducted in the absence of any commercial or financial relationships that could be construed as a potential conflict of interest.
Publisher’s note
All claims expressed in this article are solely those of the authors and do not necessarily represent those of their affiliated organizations, or those of the publisher, the editors and the reviewers. Any product that may be evaluated in this article, or claim that may be made by its manufacturer, is not guaranteed or endorsed by the publisher.
Supplementary material
The Supplementary Material for this article can be found online at: https://www.frontiersin.org/articles/10.3389/feart.2023.1251711/full#supplementary-material
References
Chang, Y.-L., Yeh, H. C., Liu, G.-R., Liu, C.-Y., Liu, C.-C., and Lin, T.-H. (2017). Monsoon effect simulation on typhoon rainfall potential-Typhoon Morakot (2009). Terr. Atmos.Ocean. Sci. 28, 11–21. (CCA). doi:10.3319/tao.2016.08.17.01(cca)
Chen, L.-S., Li, Y., and Chen, Z.-Q. (2010). An overview of research and forecasting on rainfall associated with landfalling tropical cyclones. Adv. Atmos. Sci. 27 (5), 967–976. doi:10.1007/s00376-010-8171-y
Chen, L.-S., Luo, H.-B., Duan, Y.-H., and Yu, H. (2004). An overview of tropical cyclone and tropical meteorology research progress. Adv. Atmos. Sci. 21 (3), 505–514. doi:10.1007/BF02915577
Chen, L.-S., and Xu, Y.-L. (2017). Review of typhoon very heavy rainfall in China. Meteorological Environ. Sci. 40 (1), 3—10. (in Chinese). doi:10.16765/j.cnki.1673-7148.2017.01.001
Chen, S., Knaff, J. A., and Marks, F. D. (2006). Effects of vertical wind shear and storm motion on tropical cyclone rainfall asymmetries deduced from TRMM. Mon. Weather Rev. 134 (11), 3190–3208. doi:10.1175/MWR3245.1
Chen, T.-C., and Wiin-Nielsen, A. C. (1976). On the kinetic energy of the divergent and nondivergent flow in the atmosphere. Tellus A Dyn. Meteorology Oceanogr. 28 (6), 486–498. doi:10.3402/tellusa.v28i6.11317
Ding, Z.-Y., Huang, H.-B., Zhao, X.-J., and Liu, R.-X. (2018). Relationship of spiral rain bands and horizontal vorticity in typhoon Morakot. Trans. Atmos. Sci. 41 (04), 454–462. (in Chinese). doi:10.13878/j.cnki.dqkxxb.20150205001
Dong, M., Chen, L., Li, Y., and Lu, C. (2010). Rainfall reinforcement associated with landfalling tropical cyclones. J. Atmos. Sci. 67 (11), 3541–3558. doi:10.1175/2010JAS3268.1
Emanuel, K. A., and Center, L. (2018). 100 years of progress in tropical cyclone research. Meteorol. Monogr. 59, 15.1–15.68. doi:10.1175/AMSMONOGRAPHS-D-18-0016.1
Han, F.-R., Lu, X., Feng, X.-Y., Wu, T.-Y., and Huang, J.-Y. (2021). Analysis of dynamic and thermodynamic Structure of typhoon Lekima(1909) before and after its landfall. J. Trop. Meteorology 37 (1), 15. (in Chinese). doi:10.16032/j.issn.1004-4965.2021.004
Lei, X.-T., and Chen, L.-S. (2001). An overview on the interaction between tropical cyclone and mid-latitude weater systems. J. Trop. Meteorology 017 (004), 452–461. (in Chinese). doi:10.3969/j.issn.1004-4965.2001.04.015
Lei, X.-T., and Chen, L.-S. (2003). Characteristics of tropical cyclones activities varying with environmental fields of mid-and lower-latitudes. J. Trop. Meteorology 9 (1), 19–30. doi:10.3969/j.issn.1006-8775.2003.01.003
Liu, C., Jiang, X., Fei, Z., Zhao, S., Luo, W., and Miao, Q. (2008). The influence of south China sea summer monsoon on the rainstorm associated with the landfalling strong tropical storm bilis (0604). J. Trop. Meteorology 14 (2), 153–157. doi:10.3724/SP.J.1047.2008.00014
Liu, H., Wang, L., Dai, Y., and Chen, H. (2022a). Relationships between the southwest monsoon surge and the heavy rainfall associated with landfalling super typhoon rammasun. Atmosphere 13 (1), 130. doi:10.3390/atmos13010130
Liu, H., Wang, L., Dai, Y., and Chen, H. (2022b). Relationships between the southwest monsoon surge and the heavy rainfall associated with landfalling super typhoon rammasun. Atmosphere 13, 130. doi:10.3390/atmos13010130
Lu, S., Wang, L.-J., Guan, Z.-Y., He, J.-L., and Song, H. (2012). Adaptive PIF control for permanent magnet synchronous motors based on GPC. Trans. Atmos. Sci., 175-185, 35(2):175–192. doi:10.3390/s130100175(in Chinese)
Rasmussen, E. N., Straka, J. M., Davies-Jones, R., Doswell, C. A., Carr, F. H., Eilts, M. D., et al. (1994). Verification of the origins of rotation in tornadoes experiment: vortex. Bull. Am. Meteorological Soc. 75 (6), 995–1006. doi:10.1175/1520-0477(1994)075<0995:votoor>2.0.co;2
Su, H.-L., Yuan, L.-W., Wang, M., Dong, G.-H., and Fei, X.-C. (2021). Characteristics and disaster analysis of tropical cyclones landing in China in 1949-2019. J. Appl. Oceanogr. 40 (3), 382–387. (in Chinese). doi:10.3969/J.ISSN.2095-4972.2021.03.002
Teng, D.-G., Luo, Z.-X., Dai, K., and Huang, X.-Q. (2008). Rainfall characteristics of bilis (2006) and its possible formation mechanism. J. Nanjing Inst. Meteorology 31 (3), 369–380. (in Chinese). doi:10.13878/j.cnki.dqkxxb.2008.03.008
Wang, D.-H., Li, X.-F., and Tao, W.-K. (2010a). Responses of vertical structures in convective and stratiform regions to large-scale forcing during the landfall of severe tropical storm Bilis (2006). Adv. Atmos. Sci. 27 (1), 33–46. doi:10.1007/s00376-009-8139-y
Wang, L.-J., Lu, S., Guan, Z.-Y., and He, J.-L. (2010b). Effects of low-latitude monsoon surge on the increase in downpour from tropical storm bilis. J. Trop. Meteorology 16 (2), 101–108. doi:10.3969/j.issn.1006-8775.2010.02.001
Wingo, M. T., and Cecil, D. J. (2010). Effects of vertical wind shear on tropical cyclone precipitation. Mon. Weather Rev. 138 (3), 645–662. doi:10.1175/2009MWR2921.1
Wu, G.-X., Duan, A.-M., Liu, Y.-M., Yan, J.-H., Liu, B.-Q., and Ren, S.-L. (2013). Recent advances in the study on the dynamics of the Asian summer monsoon onset. Chin. J. Atmos. Sci. 37 (2), 211–228. (in Chinese). doi:10.3878/j.issn.1006-9895.2012.12312
Wu, T.-Y., Zhou, Y.-S., Wang, Y.-Q., Liang, L., Han, F.-R., and Lu, X. (2021). Comparative analysis of precipitation characteristics of the westward typhoon cases “bilis” and “sepat” during landfall under different monsoon intensities. Chin. J. Atmos. Sci. 45 (6), 1173–1186. (in Chinese). doi:10.3878/j.issn.1006-9895.2009.20101
Xu, J., and Chan, J. C. L. (2002). Relationship between the planetary-scale circulation over east asia and the intensity of the south asian summer monsoon. Geophys. Res. Lett. 29 (18), 13-1–13-4. doi:10.1029/2002GL014918
Xu, Y.-M., and Wu, R.-S. (2003). The conservation of helicity in hurricane andrew (1992) and the formation of the spiral rainband. Adv. Atmos. Sci. 20 (6), 940–950. doi:10.1007/BF02915517
Yan, L., Zhou, Y.-S., and Wang, Y.-Q. (2019). Analysis on different characteristics and causes of precipitation distribution during the landing of typhoon "soudelor" (1513) and typhoon "matmo" (1410) with similar tracks. Chin. J. Atmos. Sci. 43 (02), 297–310. doi:10.3878/j.issn.1006-9895.1805.17292
Yu, Z.-S., Gao, S.-T., and Ren, H.-X. (2007). A numerical study of the severe heavy rainfall associated with the typhoon haitang(0505). Acta Meteorol. Sin. 65 (6), 13. (in Chinese). doi:10.3321/j.issn:0577-6619.2007.06.004
Zhang, J.-H., Xue, G.-Y., Chen, H.-M., and Ma, L.-F. (2008). Analysis and numerical experiments of the impact of moisture transportation by southwest monsoon on precipitation of the tropical cyclone bills. Sci. Technol. Rev. 26 (23), 9. (in Chinese). doi:10.3321/j.issn:1000-7857.2008.23.017
Zhang, J.-Y., Wu, L.-G., and Zhang, Q. (2011). Tropical cyc-lone damages in China under the background of global warming. J. Trop. Meteorology 27, 442–454. (in Chinese). doi:10.3969/j.issn.1004-4965.2011.04.002
Zhang, Q., Wu, L.-G., and Liu, Q.-F. (2009). Tropical cyclone damages in China 1983-2006. Bull. Am. Meteorological Soc. 90 (4), 489–496. doi:10.1175/2008BAMS2631.1
Keywords: numerical simulation, Asian summer monsoon, monsoon surge, typhoon precipitation, water vapor transport, typhoon structure
Citation: Zeng Z, Xu J, Ye G and Shen W (2023) The influence of different intensity of monsoon on typhoon precipitation: a comparative study of typhoons Soudelor and Maria. Front. Earth Sci. 11:1251711. doi: 10.3389/feart.2023.1251711
Received: 02 July 2023; Accepted: 23 August 2023;
Published: 04 September 2023.
Edited by:
Shanlei Sun, Nanjing University of Information Science and Technology, ChinaReviewed by:
Na Wei, Chinese Academy of Meteorological Sciences, ChinaChujie Gao, Hohai University, China
Copyright © 2023 Zeng, Xu, Ye and Shen. This is an open-access article distributed under the terms of the Creative Commons Attribution License (CC BY). The use, distribution or reproduction in other forums is permitted, provided the original author(s) and the copyright owner(s) are credited and that the original publication in this journal is cited, in accordance with accepted academic practice. No use, distribution or reproduction is permitted which does not comply with these terms.
*Correspondence: Jianjun Xu, anh1QGdkb3UuZWR1LmNu