 Zhidan Ba
 Huishi Du
 Eerdun Hasi
 Xiaoling Lu2
95% of researchers rate our articles as excellent or good
Learn more about the work of our research integrity team to safeguard the quality of each article we publish.
Find out more
ORIGINAL RESEARCH article
Front. Earth Sci. , 15 September 2023
Sec. Geoinformatics
Volume 11 - 2023 | https://doi.org/10.3389/feart.2023.1251605
This article is part of the Research Topic Advances of Spectroscopy and Artificial Intelligence in Environmental Monitoring and Remote Sensing View all 6 articles
Desert areas of China have important ecological functions, so analyzing changing characteristics of ecosystem service values in this region is important for sustainable development. Using land use change data for desert areas from 1978 to 2022, this paper combined the equivalent factor method and the actual situation of the study area to revise value coefficients of ecosystem services and study characteristics of land use and ecosystem service value changes after reform and opening up. The results showed that after reform and opening up, the area of plow, water, and other lands in the study area decreased, while grassland, forest, construction land, and sandy land increased. The conversion of a land use type mainly occurred as conversion of grassland and other lands to other land use types. The value of ecosystem services increased, increasing by 19.63 × 10⁸ CNY. From the perspective of land use type in 2022, the ecosystem service value of grassland was the highest, reaching 12.19 × 10⁸ CNY, an increase of 11.73 × 10⁸ CNY compared with the early stage of reform and opening up. From the perspective of ecosystem service types in 2022, the value of maintaining soil ecological services was the highest, reaching 3.07 × 10⁸ CNY, an increase of 2.97 × 10⁸ CNY compared with the beginning of reform and opening up. From the perspective of the ecological sensitivity index, the sensitivity index results for the ecosystem service value in the study area were all <1, and the research results were credible. From the perspective of the land ecological coordination degree, the overall land ecological coordination degree in the study area was at a moderate coordination level, indicating that land use change did not lead to environmental deterioration, but there was a crisis. Therefore, increasing and maintaining ecological land is the key to improving ESV in the study area.
Ecosystem services refer to the natural environmental conditions and utility that human beings depend on for survival. They are formed and maintained by ecosystems and ecological processes (Aryal et al., 2022). The main indicators of ecosystem services include supply, adjustment, support, and cultural services. With the in-depth study of global change, people find that land use change is an important reason affecting the global environmental change (Chen et al., 2018). Land use change not only affects the climate change but also further affects the spatial distribution of the ecosystem service value and the ecological process of landscape pattern change (Zheng et al., 2008; Chen et al., 2019; Xie et al., 2020). Land use change plays a decisive role in maintaining the services of an ecosystem (Fang et al., 2022).
With the deepening of social research on the ecosystem service function, “environmental service function” has gradually evolved into the ecological service value (Takacs and O’Brien, 2023). The method of assessing the value of ecological services was systematically elaborated in the 1997 book “The Services of Nature: Society’s Dependence on Natural Ecosystems.” In 1999, Costanza estimated the economic value of 17 types of global ecosystems, which clarified the development of ecological service function value assessments. The principles and methods of this research provided new ideas for many global scholars to carry out further research. Subsequently, Camacho studied the impact of land use in coastal cities on the value of ecological services (Camacho-Valdez et al., 2014). Based on the experimental method, Harpinder calculated the ecological service value of organic cultivated land (Harpinder et al., 2007). Costanza’s research results have played a significant role in promoting the research progress on ecological service value in China. In 2003, Xie Gaodi et al. carried out a study evaluating the ecological service value of various grasslands on the Qinghai–Tibet Plateau (Xie et al., 2017). In 2008, Xie Gaodi et al. constructed an “ecosystem service value (ESV) equivalent factor table” applicable to China’s regional situation (Xie et al., 2017). The ESV equivalent method, which is based on the current scale developed by experts, has some credibility. Based on this method, China has studied ESV from the scale of river basins (Liu et al., 2023), urban agglomerations (Gong et al., 2023), provinces and cities (Normyle et al., 2023), the country (Sharma et al., 2023), etc. At present, the use of an economic value assessment mainly follows the ESV assessment model established by Costanza et al. According to the actual situation in China, Xie Gaodi et al. developed a table of ecological service value per unit area based on this model, which has been widely used (Jia et al., 2019; Yang et al., 2020).
Desert areas are unique natural ecosystems in northern China (Xin et al., 2023) and play an important role in national ecological security. Since the reform and opening up, with the rapid transformation of China’s social economy and rapid urbanization, rapid change in land circulation and land use types has been triggered (Liu et al., 2023). At the same time, ecological and environmental problems such as soil degradation and soil erosion in the area have become increasingly prominent. Land use will not only cause major changes to the earth’s surface structure and reshape landscapes but also affect the supply capacity of regional ecosystem services by changing regional climate, hydrology, soil, etc. (Hu et al., 2023) and driving the value of ecosystem services to respond positively or negatively (Tiandraza et al., 2023). However, since 2012, China has placed the construction of ecological civilization in a prominent position overall, and the environment in the area has significantly improved. Therefore, it was important to carry out a long-term quantitative evaluation and provide a scientific theoretical basis for regional sustainable utilization and improvement of ecosystem services. In summary, this study selected China’s desert region as the study area, based on the land use data on the study area for many years and supported by RS and GIS technologies (Jia et al., 2018), adopted the service value measurement method of China’s terrestrial ecosystem to analyze and process the land use data on the study area, and studied the change characteristics and rules of land use and ecosystem service value in the desert region since the reform and opening up. The results are of great significance for the policy formulation of ecosystem protection and restoration, and the coordination of the relationship between regional economic development and environmental protection.
Desert areas of China (30°–50° N, 75°–130° E) cover an area of 826,072.70 km2 (Dong et al., 2013; Ma et al., 2022), specifically distributed in China’s inland arid and semi-arid climate regions, including Heilongjiang, Jilin, Liaoning, Inner Mongolia, Shanxi, Ningxia, Gansu, Qinghai, and Xinjiang (Wu et al., 2023) (Figure 1). Influenced by the topography, such as the Tibetan Plateau and Mongolian Plateau, climatic conditions, and atmospheric circulation, annual precipitation gradually decreases from southeast to northwest. The average annual precipitation in the northwest arid region was less than 200 mm, and the average annual precipitation in the eastern semi-arid region was less than 500 mm. The wind force in the wind season was greater than level 5, with 20–100 sandstorm days and annual average temperatures of -5–20°C. There were 2,600–3,400 h of sunshine, and the frost-free period is 150–260 days. The underlying strata in the area provide abundant sand sources for the formation of deserts, including river alluvial deposits, alluvial lacustrine deposits, alluvial deposits, and weathered residual deposits of bedrock.
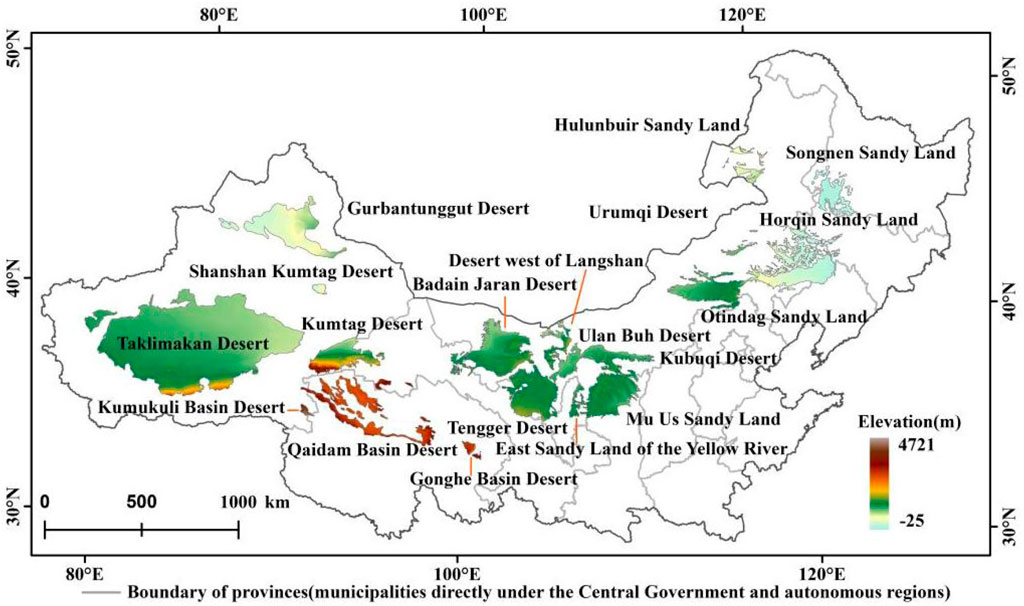
FIGURE 1. Location of the study area. Note: This map is based on a standard map, no. GS (2022)4307, the standard map service website of the National Administration of Surveying, Mapping and Geographic Information.
Using the Google Earth Engine (GEE) platform, Landsat sequence images of the study area were obtained for 1978, 1990, 2000, 2010, and 2022. The spatial reference is the Krasovsky coordinate Albers projection, and the spatial resolution of all the calculated indicators was resampled to 1 km × 1 km raster data obtained from the data source (Jia et al., 2012). According to the conditions of the study area, land use types were divided into eight categories: plow, forest, grassland, water, construction land, sandy land, and other lands. The deep learning method was adopted for interpretation, and the accuracy of the interpretation results was evaluated using existing data products (Yang and Huang, 2021). The random point method was used to evaluate the results, and the precision was 97.23%.
The biomass of each land use type in the study area has the following relationship with the net primary productivity of the ecosystem (Fang et al., 2007; Guo et al., 2021; Wang et al., 2022; Zhou et al., 2023).
where h is the biomass of a given land use type (g·m-2) and NPP is the net primary productivity of the ecosystem (t·km-2). Finally, the biomass of each ecosystem in each year of the study area was obtained (Table 1).
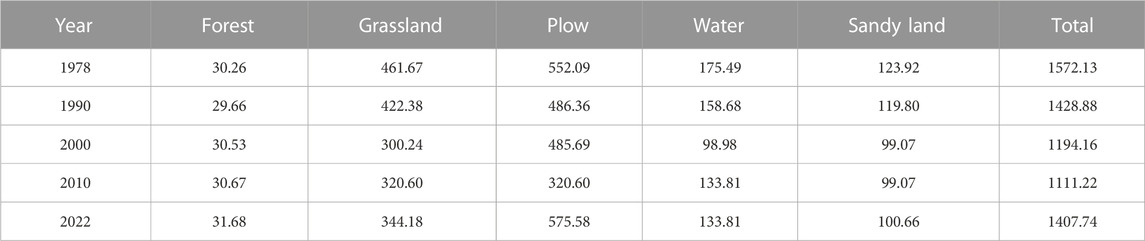
TABLE 1. Study area biomass (g·m-2).
The ESV equivalent factor is defined as the value of the annual natural grain yield of cultivated land with an average yield of 1 hm2. After comparative analysis, the value of an ESV equivalent factor is equal to 1/7 of the market value of grain yield per unit area of the study area in the current year (Xie et al., 2015; Wu et al., 2023), and it is calculated as follows:
where M is the value of an ESV equivalent factor in the study area (CNY·km-2), m is the average unit price of grain in the study area (CNY·kg), and n is the average grain yield of 1 km2 in the study area (kg·km-2). The value of an ESV equivalent factor was 3 512.11 CNY based on the market economic value of the average grain yield per unit area in the study area (CNY).
The benchmark unit price of ecosystem service functions was calculated as follows:
where Ai is the benchmark unit price of ecosystem service functions in the study area (CNY), M is the value of an ecosystem service function equivalent factor in the study area (CNY·km-2), ai is the equivalent factor of the service function value for different ecosystems; i = 1, 2, 3, ... 9, respectively, represent ecosystem service functions, such as food production, raw material production, gas regulation, climate regulation, hydrological regulation, waste disposal, soil conservation, biodiversity maintenance, and esthetic landscape provision.
Based on the revised benchmark unit price of ecosystem service functions, the ESV per unit area of the study area was constructed as follows:
where Aij is the ESV per unit area of the study area (CNY), hj is the biomass of a j-type ecosystem (g·m-2), H is the average biomass per unit area of the study area (g·m-2·km-2), Ai is the benchmark unit price of ecosystem service functions in the study area (CNY); j = 1, 2, 3, ... 6, respectively, represent plow, forest, grassland, water, sandy land, and other ecosystem types. The total value of ecosystem services was calculated as follows:
where Dij is the total service value of different ecosystems in the study area (CNY), Aij is the ESV per unit area of the study area (CNY), and Aj is the area of different ecosystems in the study area (km2).
Sensitivity mainly reflects the degree of dependence of ESV change over time on the change of the ESV coefficient or the ESV change that was caused by the change in the ESV coefficient (Hatamkhani et al., 2023). If the sensitivity index was greater than 1, it indicates that ESV was elastic to the value coefficient. If the sensitivity index was less than 1, it indicates that ESV in the study area was not elastic to the value coefficient (Yang et al., 2022a), and the research results were credible. The sensitivity index was calculated as follows (Millennium, 2005):
where CS represents the ESV sensitivity index of the study area, ESVi represents the total value of the original ecosystem services (CNY), ESVj represents the adjusted ESV (CNY), VCik represents the original value coefficient, VCkj represents the adjusted value coefficient, and k represents the land use type.
The degree of coordination refers to the harmonious balance between systems or system elements in the development process (Hatamkhani et al., 2023). In this paper, the land ecological coordination degree (LEC) was used to represent the coordination between land use change and ESV in the study area (Table 2). The coordination degree was calculated as follows:

TABLE 2. Type division of the land ecological coordination degree.
where Vr is the change rate of ESV during the study period, Lr is the change rate of the land use type area during the study period, Vi and Vj represent ESV at the beginning and end of the study period (CNY), respectively, Lui represents the area of the i land use type at the beginning of the study period (km2), and ΔLui-j represents the total area converted from the i land use type to other land use types during the study period (km2).
In 2022, sandy land and grassland were the main types of land use in the study area, with an area of 552,771.66 km2, accounting for 64.12% of the total study area. The area of grassland was 156,982.86 km2, accounting for 19.00% of the total study area. The sizes of other land use types were as follows: the area of other lands was 41,219.69 km2 (4.99% of the total study area), plow was 40,425.77 km2 (4.89%), forest was 15,017.72 km2 (1.82%), construction land was 4,339.79 km2 (0.52%), and water was 3,568.51 km2 (0.43%). In the past 44 years, the spatial distribution pattern of land use in the study area showed that grassland and sandy land were concentrated in the core area of the study area, forest land and urban and rural construction lands were concentrated in the edge area of the study area, and rivers and wetlands were scattered.
Since the reform and opening up, there has been a clear land use change in this region, with the grassland area changing the most (46,016.33 km2), followed by other lands (30,402.17 km2), water area (826.15 km2), and construction land (1,487.06 km2). The total area of plow, other lands, and water decreased, while the total area of grassland, forest, construction land, and sandy land increased.
From the perspective of land use type transformation, from 1978 to 2000, land use transformations mainly occurred when grassland and sandy land were transformed into plow land (Figure 2). After the implementation of the Western development policy, with accelerated urban agglomeration and the increase in population, the demand for food became more and more urgent, and there were more projects to destroy grass and open fields, leading to the expansion of the plow area. From 2000 to 2022, land use conversions in the study area mainly occurred as the conversion of plow, sandy land, and other lands to grassland and forest. Among them, the transfer of grassland was more significant because the state proposed the construction of ecological civilization. This promoted the “Three-North shelter belt” project in the north and implemented a policy of returning farmland to forest, making the transfer of plow to grassland obvious. In addition, social and economic development is needed to develop other lands and occupy more plow and grassland to meet the needs of construction land, such as the construction of public facility land, industrial and mining land, and urban and rural residential areas. This was another reason for the increase in construction land after reform and opening up.
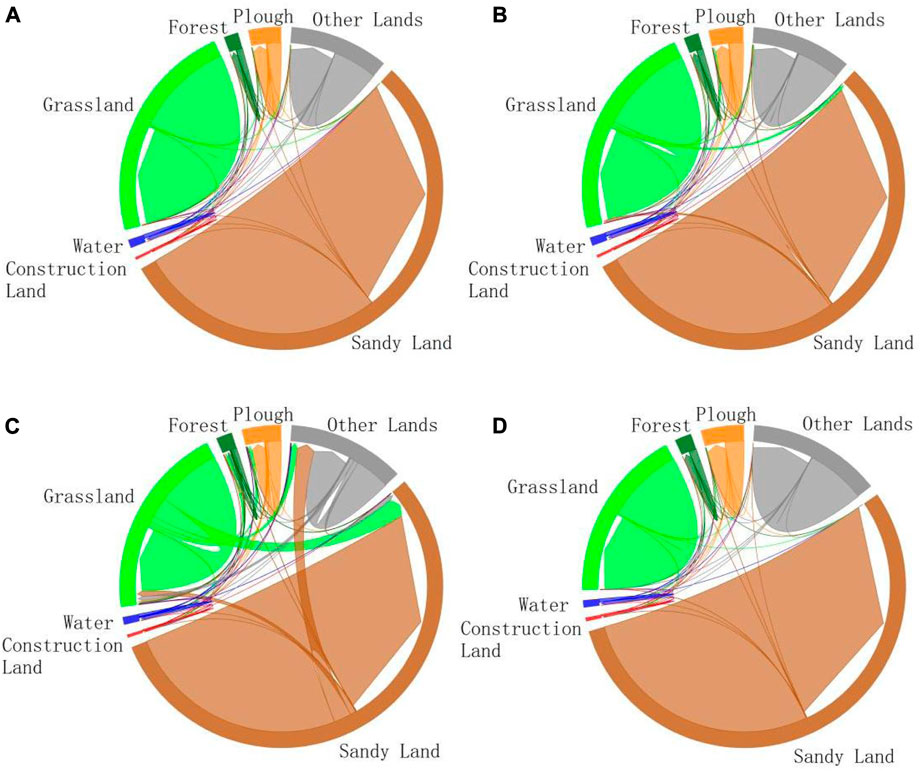
FIGURE 2. Dynamic change of land use in desert areas. (A) 1978–1990; (B) 1990–2000; (C) 2000–2010; and (D) 2010–2022).
Sandy land and other lands were mainly concentrated in the central and western parts of the study area, distributed in the Taklimakan Desert, Gurbantunggut Desert, Badain Jaran Desert, Kumukuri Desert, and Kumtag Desert (Figure 3). Grassland and forest, as the main types of green land cover in the study area, were mainly distributed in the Songnen Sandy Land, Horqin Sandy Land, Hunshandak Sandy Land, and Mu Us Sandy Land in the eastern part of the study area. From the perspective of land use spatial differentiation, grassland changes from 1978 to 2022 were mainly distributed in the Badain Jaran Desert, Gonghe Basin Desert, Hedong Sandy Land, Hulun Buir Sandy Land, Horqin Sandy Land, and Songnen Sandy Land. Changes to plow were mainly distributed in Hunshandake Sandy Land and Songnen Sandy Land in the eastern part of the study area. The variation in the water area was distributed in the Gonghe Basin Desert in the central and southern parts of the study area. Changes to sandy land were mainly distributed in the eastern Badain Jaran Desert, the southern Qaidam Desert, the eastern Gonghe Basin Desert, and the eastern Gurbantunggut Desert. Changes to construction land were mainly distributed in Ulan Buh and the northern part of the desert.
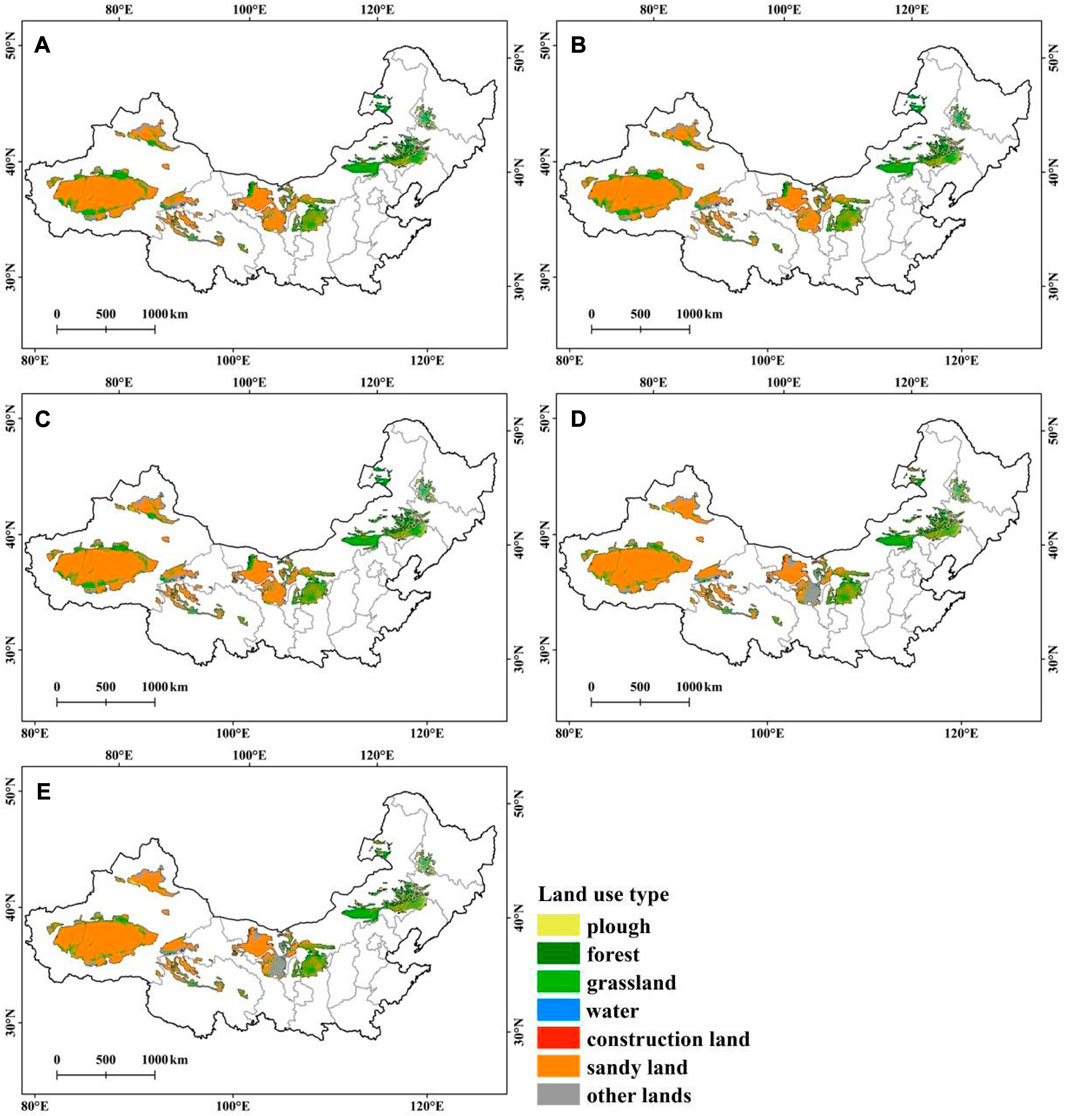
FIGURE 3. Land use types of northern desert areas. (A) 1978; (B) 1990; (C) 2000; (D) 2010; and (E) 2022).
Since the reform and opening up, ESV in desert areas has increased overall (Table 3) by a total of 19.64×10⁸ CNY, specifically due to the large-scale reclamation of plow. In the order of ESV magnitude, the highest was grassland, followed by plow, sandy land, water, and forest. After reform and opening up, grassland ESV was always in the first place, which demonstrated that grassland played a leading role in maintaining ESV in the study area. ESV of all land types increased. Among them, ESV of plow and grassland increased faster, and ESV of grassland increased by 11.73×10⁸ CNY, but ESV of grassland decreased from 72.14% in 1978 to 60.15% in 2022. ESV of plow increased by 3.52×10⁸ CNY, and the percentage of ESV for plow increased from 9.03% in 1978 to 17.65% in 2022. ESV of forest, water, and sandy land increased slowly, and ESV of forest increased by 0.19×10⁸ CNY. The ESV percentage increased from 0.61% in 1978 to 0.97% in 2022. ESV of water increased by 0.46×10⁸ CNY, but the percentage of ESV in water decreased from 3.30% in 1978 to 2.37% in 2022. ESV of sandy land increased by 1.51×10⁸ CNY, and ESV percentage of sandy land increased from 6.11% in 1978 to 7.62% in 2022.
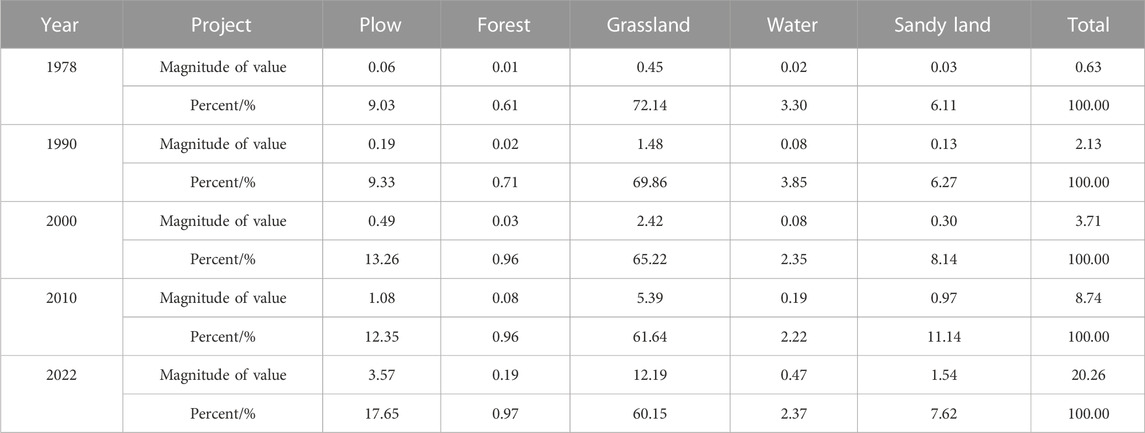
TABLE 3. Total value of ecosystem services in northern China, 1978–2022.
After reform and opening up, ESV in the study area has been mainly focused on soil conservation and biodiversity maintenance (Table 4). Single ESV has increased, among which the fastest increase occurred for soil function, from 0.11×10⁸ CNY in 1978 to 3.07×10⁸ CNY in 2022. The slowest increase was for the production of raw materials, from 0.02×10⁸ CNY in 1978 to 0.85×10⁸ CNY in 2022.
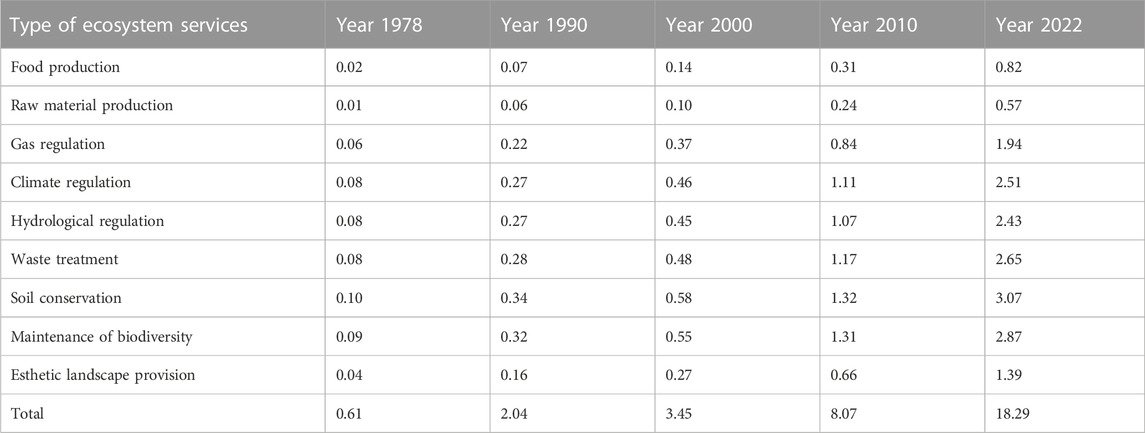
TABLE 4. Single values of ecosystem services in northern China desert areas from 1978 to 2022.
The ESV sensitivity index of different periods ranged from 0 to 1, indicating that the ESV coefficient was inelastic and the research results are credible (Table 5). The sensitivity index values for land use types in descending order were grassland, forest, plow, water, other lands, sandy land, and construction land. During the study period, the sensitivity index of plow, forest, and other lands all increased, while the sensitivity index of other land use types declined.
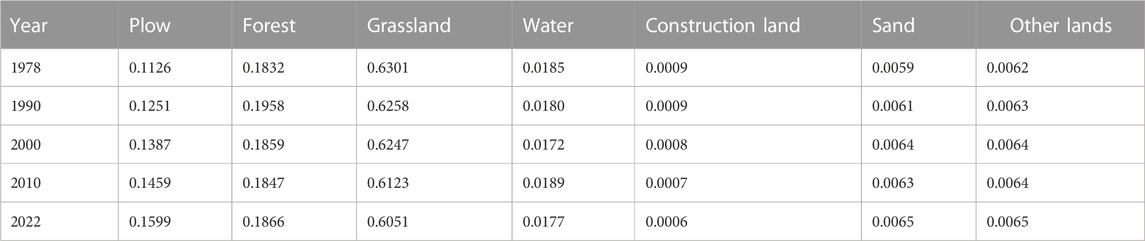
TABLE 5. Sensitivity index of the ESV for each land use type in the study area.
The overall land ecological coordination degree in the study area was at a moderate level (Figure 4), indicating that land use change did not lead to environmental deterioration, but there was a crisis (Table 2). From 1978 to 2000, the land ecological coordination degree was low but increasing, indicating that land use change did not have a negative impact on the environment and was developing in a good direction. From 2000 to 2010, the ecological coordination degree of land use in the study area was at a moderate level, indicating that land use change did not cause deterioration of the environment, but there was a potential crisis. From 2010 to 2022, the land ecological coordination degree was 0.51, which was still at a moderate level, but it was decreasing compared to 2000–2010. This showed that the development of urban agglomerations did not pay enough attention to the irrational use of land, so the level of conflict between the environment and land use was more obvious in the later period of the study.
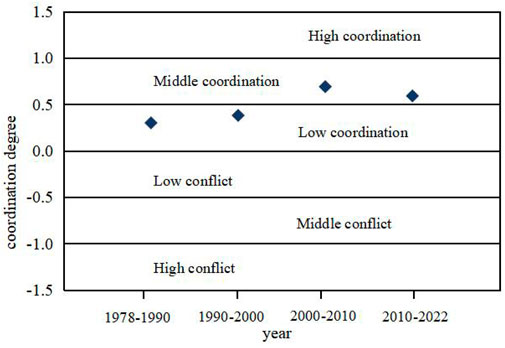
FIGURE 4. Distribution map of the land ecological coordination level in the study area.
Land use change is the main factor influencing ESV change, and land use change can lead to a series of ecological processes, thus affecting the supply of ecosystem services (Millennium, 2005; Hasan et al., 2020). For example, the regulation and support services of forest are high, while the food supply services are relatively low (Lei et al., 2021; Gascoigne et al., 2011; Zhao et al., 2022). Agricultural product supply services of plow are relatively high, while regulation, support, and cultural services are relatively low (Yang et al., 2022b). The land use type in the study area is mainly grassland, and the construction land area is small. During 1978–2022, the forest land, grassland, water area, and construction land in the study area increased, while the unused land area decreased, which is consistent with the research results of Shao et al. (2022). The contribution of the grassland ecosystem service value was the highest, which was consistent with the research results of Zhang et al. (2023). The degree of land use is negatively correlated with ecosystem services. Contrary to the research results of Zhao et al. (2022), the main reason is that the changing trend of the land use degree is different due to the difference in land use change. In China, sandy land and grassland were the main land use types, and the areas of grassland, forest, construction land, and sandy land were all increasing. The areas of plow, water, and other lands decreased. In particular, from 1978 to 2010, the area of construction land increased significantly, especially because economic development and the construction of small towns have led to urban expansion since the reform and opening up (Wang et al., 2020). This also showed that human activities are an important driving force for short-term regional landscape changes (Li et al., 2019). In recent years, with policy support for poverty alleviation and development and rural revitalization, China’s land use in desert areas has shown new characteristics of change (Liu et al., 2014) and has changed from “sand advancing and people retreating” (Moharram and Sundaram, 2023) into a new situation of “harmony between man and sand” (Parker-Shames et al., 2023).
After reform and opening up, there was an overall ESV increase of 19.64×10⁸ CNY, but the increase in raw material production was the slowest. Because the contribution rates of grassland and plow to ESV were as high as 80%, the two had a significant impact on ESV change, which was consistent with the research results of Sun Menghua (Yang et al., 2022a). In terms of ESV, the values of food production and raw material production were relatively low, specifically because the productivity of desertification grassland resources was insufficient and grassland resources were overexploited and utilized (Liu et al., 2017). Therefore, it is necessary to strengthen the protection, restoration, and management of desertification grassland. In the future, consideration should be given not only to land classes with a high ESV but also to land use types that play an important role in raw materials and food production to maintain ecosystem service functions and stability.
ESV of the study area should be scientifically assessed, according to the principles of ecological economics (Shao et al., 2022), and intuitively reflected in monetary form, which is an important basis for formulating regional ecological compensation policies (Yang and Huang, 2021). However, the longitude span of the deserts in China is large, and the geographical location, climatic characteristics, and human environment of the deserts vary greatly. On the whole, the land ecological coordination degree in the study area is at a moderate coordination level, and the ecological environment management has a long way to go. Ecological and environmental management projects should be implemented in the study area to strengthen environmental protection, reduce the damage of human activities to the environment, and prevent further deterioration of the environment. For ecologically fragile areas, the local governance model should be maintained. Therefore, the next step will be to revise the ESV coefficient, according to the characteristics of each desert region to obtain more accurate calculation results.
From the perspective of land use structure, the main land use types in the study area were sandy land and grassland, accounting for more than 80% of the total area. From the perspective of land use change from 1978 to 2020, the areas of plow, water, and other lands all decreased. Meanwhile, grassland, forest, construction land, and sandy land increased, with the fastest change occurring in grassland. Over the whole study period, the period of change rate was the largest from 2000 to 2010 and the smallest from 1978 to 1990. From the perspective of land use transfer, the plow in the study area was mainly converted into grassland, forest, and construction land. Forest was mainly converted into grassland, grassland was mainly converted into sandy land, construction land was mainly converted into plow, and the area of other lands was mainly converted into grassland. Therefore, the main reason behind land use change in the study area was the implementation of returning plow to forest.
From 1978 to 2022, ESV in the study area increased from 0.63×10⁸ CNY to 20.26×10⁸ CNY, an increase of 19.63×10⁸ CNY. In terms of time period, the growth rate was the fastest from 2010 to 2022 and the slowest from 1978 to 1990. From the perspective of land use type in 2022, ESV of grassland was the highest, reaching 12.19×10⁸ CNY, while ESV of water was the lowest, at only 0.47×10⁸ CNY. From the perspective of the ecosystem service type in 2022, soil conservation was the highest, reaching 3.07×10⁸ CNY, and raw material production was the lowest, at only 0.82×10⁸ CNY. From the perspective of the ecological sensitivity index, the ESV sensitivity index results for the study area were all less than 1. Grassland had the highest sensitivity index, while construction land had the lowest. The ESV coefficient was inelastic, so the research results were credible. From the perspective of the land ecological coordination degree, the land ecological coordination degree in the study area was between low and medium coordination degrees. Therefore, land management and planning should be strengthened to promote coordinated development between land use and economic development.
The original contributions presented in the study are included in the article/Supplementary Material; further inquiries can be directed to the corresponding author.
ZB, HD, and EH contributed to the conception and design of the study, and organized the database. XL performed the statistical analysis. All authors contributed to the article and approved the submitted version.
This research was funded by the National Natural Science Foundation of China (No. 42271005).
The authors declare that the research was conducted in the absence of any commercial or financial relationships that could be construed as a potential conflict of interest.
All claims expressed in this article are solely those of the authors and do not necessarily represent those of their affiliated organizations, or those of the publisher, the editors, and the reviewers. Any product that may be evaluated in this article, or claim that may be made by its manufacturer, is not guaranteed or endorsed by the publisher.
Aryal, K., Maraseni, T., and Apan, A. (2022). How much do we know about trade-offs in ecosystem services? A systematic review of empirical research observations. Sci. Total Environ. 806, 151229. doi:10.1016/j.scitotenv.2021.151229
Camacho-Valdez, V., Ruiz-Luna, A., Ghermandi, A., Berlanga-Robles, C., and Nunes, P. (2014). Effects of land use changes on the ecosystem service values of coastal wetlands. Environ. Manag. 54, 852–864. doi:10.1007/s00267-014-0332-9
Chen, C. D., Wang, Y. C., Jia, J. S., Mao, L. F., and Meurk, C. D. (2019). Ecosystem services mapping in practice: A pasteur's quadrant perspective. Ecosyst. Serv. 40, 101042. doi:10.1016/j.ecoser.2019.101042
Chen, C. D., Wang, Y. C., and Jia, J. S. (2018). Public perceptions of ecosystem services and preferences for design scenarios of the flooded bank along the three gorges reservoir: implications for sustainable management of novel ecosystems. Urban For. Urban Green. 34, 196–204. doi:10.1016/j.ufug.2018.06.009
Dong, Z., Qian, G., Lv, P., and Hu, G. (2013). Investigation of the sand sea with the tallest dunes on earth: china's Badain jaran sand sea. Earth-Science Rev. 120, 20–39. doi:10.1016/j.earscirev.2013.02.003
Fang, J., Guo, Z., Piao, S., and Chen, A. (2007). The estimation of terrestrial vegetation carbon sink in China: 1981–2000. Sci. China (Series D) 37, 1341–1350. doi:10.1007/s11430-007-0049-1
Fang, Z., Ding, T., Chen, J., Xue, S., Zhou, Q., Wang, Y., et al. (2022). Impacts of land use/land cover changes on ecosystem services in ecologically fragile regions. Sci. Total Environ. 83, 154967. doi:10.1016/j.scitotenv.2022.154967
Gascoigne, W., Hoag, D., Koontz, L., Tangen, B., Shaffer, L., and Gleason, R. A. (2011). Valuing ecosystem and economic services across land-use scenarios in the Prairie Pothole Region of the Dakotas, USA. Ecol. Econ. 70, 1715–1725. doi:10.1016/j.ecolecon.2011.04.010
Gong, W., Duan, X., Sun, Y., Zhang, Y., Ji, P., Tong, C., et al. (2023). Multi-scenario simulation of land use/cover change and carbon storage assessment in Hainan coastal zone from perspective of free trade port construction. J. Clean. Prod. 385, 135630. doi:10.1016/j.jclepro.2022.135630
Guo, Z., Fang, J., Pan, Y., and Birdsey, R. (2021). Inventory-based estimates of forest biomass carbon stocks in China: A comparison of three methods. For. Ecol. Manag. 259, 1225–1231. doi:10.1016/j.foreco.2009.09.047
Harpinder, S., Wratten, S., Ross, C., and Brad, C. (2007). The future of farming: the value of ecosystem services in conventional and organic arable land. An experimental approach. Ecol. Econ. 64, 64–69. doi:10.1016/j.ecolecon.2007.05.007
Hasan, S., Zhen, L., Miah, M., Ahamed, T., and Samie, A. (2020). Impact of land use change on ecosystem services: A review. Environ. Dev. 34, 100527. doi:10.1016/j.envdev.2020.100527
Hatamkhani, A., Moridi, A., and ang Haghighi, A. (2023). Incorporating ecosystem services value into the optimal development of hydropower projects. Renew. Energy 203, 495–505. doi:10.1016/j.renene.2022.12.078
Hu, Y., Raza, A., Syed, N., Acharki, S., Ray, R., Hussain, S., et al. (2023). Land use/land cover change detection and NDVI estimation in Pakistan’s southern Punjab province. Sustainability 15, 3572. doi:10.3390/su15043572
Jia, J. S., Fan, Y., and Guo, X. D. (2012). The low carbon development (LCD) levels' evaluation of the world's 47 countries (areas) by combining the FAHP with the TOPSIS method. Expert Syst. Appl. 39, 6628–6640. doi:10.1016/j.eswa.2011.12.039
Jia, J. S., Gong, Z. H., Chen, C. D., Jian, H. Y., and Xie, D. M. (2018). Urban carbon dioxide equivalent (CO(2)e) accounting based on the gpc framework: A case of the underdeveloped city of nanchang, China. Int. J. Clim. Change Strategies Manag. 10, 812–832. doi:10.1108/ijccsm-03-2017-0074
Jia, J. S., Jian, H. Y., Xie, D. M., Gu, Z. Y., and Chen, C. D. (2019). Multi-scale decomposition of energy-related industrial carbon emission by an extended logarithmic mean divisia index: A case study of Jiangxi, China. Energy Effic. 12, 2161–2186. doi:10.1007/s12053-019-09814-x
Lei, Y., Ding, G., Li, Z., Chi, W., Gao, G., and Zhao, Y. (2021). Land use/cover change and its ecosystem service value response in the Beijing-Tianjin sandstorm source control project area. J. Desert Res. 41, 29. doi:10.1016/j.scitotenv.2016.07.078
Li, Y., Li, Y., Fan, P., Sun, J., and Liu, Y. (2019). Land use and landscape change driven by gully land consolidation project: A case study of a typical watershed in the loess plateau. J. Geogr. Sci. 29, 719–729. doi:10.1007/s11442-019-1623-0
Liu, D., Semenchuk, P., Essl, F., Lenzner, B., Moser, D., Blackburn, T., et al. (2023a). The impact of land use on non-native species incidence and number in local assemblages worldwide. Nat. Commun. 14, 2090. doi:10.1038/s41467-023-37571-0
Liu, J., Kuang, W., Zhang, Z., Xu, X., Qin, Y., Ning, J., et al. (2014). Basic characteristics and spatial pattern of land use change in China since the late 1980s. Acta Geogr. Sin. 69, 3–14. doi:10.1007/s11442-017-1405-5
Liu, L., Shen, R., and Xu, M. (2017). Evaluation of grassland ecosystem service function value in Qinghai Province from 1998 to 2012. J. Nat. Resour. 32, 418–433. doi:10.1108/IJCCSM-06-2020-0073
Liu, Y., Li, J., Sun, C., Wang, X., Tian, P., Chen, L., et al. (2023b). Thirty-ye ar changes of the coastlines, wetlands, and ecosystem services in the Asia major deltas. J. Environ. Manag. 326, 116675. doi:10.1016/j.jenvman.2022.116675
Ma, B., Gao, L., Cheng, J., Ding, B., Ding, L., Qu, L., et al. (2022). Characteristics and hazards of an aeolian sand environment along railways in the southeastern fringe of the Taklimakan Desert and sand control measures. Appl. Sci. 12, 9186. doi:10.3390/app12189186
Millennium, E. (2005). Ecosystems and human well-being: Synthesis [M]. Washington D C, USA: Island Press, 5–10.
Moharram, M., and Sundaram, D. (2023). Land use and land cover classification with hyperspectral data: A comprehensive review of methods, challenges and future directions. Neurocomputing 536, 90–113. doi:10.1016/j.neucom.2023.03.025
Normyle, A., Vardon, M., and Doran, B. (2023). Aligning indigenous values and cultural ecosystem services for ecosystem accounting: A review. Ecosyst. Serv. 59, 101502. doi:10.1016/j.ecoser.2022.101502
Parker-Shames, P., Bodwitch, H., Brashares, J., and Van, B. (2023). Where money grows on trees: A socio-ecological assessment of land use change in an agricultural frontier. Landsc. Urban Plan. 237, 104783. doi:10.1016/j.landurbplan.2023.104783
Shao, M., Ma, L., Wang, X., Che, X., Wang, F., Lu, J., et al. (2022a). The valuation of ecosystem service value of desertification grassland from 2004 to 2014 in Hexi Corridor, China. J. Desert Res. 42, 63. doi:10.1016/j.ecolmodel.2011.11.017
Shao, Y. T., Xiao, Y., and Sang, W. G. (2022b). Land use trade-offs and synergies based on temporal and spatial patterns of ecosystem services in South China. Ecol. Indic. 143, 109335. doi:10.1016/j.ecolind.2022.109335
Sharma, S., Hussain, S., and Singh, A. (2023). Impact of land use and land cover on urban ecosystem service value in chandigarh, India: A GIS-based analysis. J. Urban Ecol. 9, juac030. doi:10.1093/jue/juac030
Takacs, V., and O’Brien, C. (2023). Trends and gaps in biodiversity and ecosystem services research: A text mining approach. Ambio 52 (1), 81–94. doi:10.1007/s13280-022-01776-2
Tiandraza, F., Qu, S., Hu, S., Mkono, C., Tikhomirova, A., and Randrialahamady, S. (2023). Response of ecosystem services to land use change in Madagascar island, africa: A multi-scale perspective. Int. J. Environ. Res. Public Health 20, 3060. doi:10.3390/ijerph20043060
Wang, J., Liang, S., and Shi, P. (2022). “The geography of contemporary China,” in Land degradation and ecological restoration (Cham: Springer International Publishing), 183–213. doi:10.1007/978-3-031-04158-7_8
Wang, S., Zhang, B., Zhai, X., and Sun, H. (2020). Vegetation cover changes and sand-fixing service responses in the Beijing-Tianjin sandstorm source control project area. Environ. Dev. 34, 100455. doi:10.1016/j.envdev.2019.08.002
Wu, Q., Xiong, K., Li, R., and Xiao, J. (2023). Farmland hydrology cycle and agronomic measures in agroforestry for the efficient utilization of water resources under karst desertification environments. Forests 14, 453. doi:10.3390/f14030453
Xie, D. M., Huang, Q. H., Xu, S. Z., Yang, M., Zhou, G. H., Jia, J. S., et al. (2020). Assessment of surface water quality in lushan: A world heritage sites in China. Environ. Sci. Pollut. Res. 27, 18934–18948. doi:10.1007/s11356-020-08304-3
Xie, G., Cao, S., Lu, C., Zhang, C., and Xiao, Y. (2015). Current status and future trends for eco-compensation in China. J. Resour. Ecol. 6, 355–362. doi:10.5814/j.issn.1674-764x.2015.06.002
Xie, G., Zhang, C., Zhen, L., and Zhang, L. (2017). Dynamic changes in the value of China’s ecosystem services. Ecosyst. Serv. 26, 146–154. doi:10.1016/j.ecoser.2017.06.010
Xin, Z., Feng, W., Zhan, H., Bai, X., Yang, W., Cheng, Y., et al. (2023). Atmospheric vapor impact on desert vegetation and desert ecohydrological system. Plants 12, 223. doi:10.3390/plants12020223
Yang, J., and Huang, X. (2021). The 30 m annual land cover dataset and its dynamics in China from 1990 to 2019. Earth Syst. Sci. Data 13, 3907–3925. doi:10.5194/essd-13-3907-2021
Yang, J., Xie, B., and Zhang, D. (2022a). Spatial-temporal evolution of ESV and its response to land use change in the Yellow River Basin, China. Sci. Rep. 12, 13103. doi:10.1038/s41598-022-17464-w
Yang, J., Xie, B., and Zhang, D. (2022b). Spatial-Temporal responses of ecosystem services to land use transformation driven by rapid urbanization: A case study of hubei province, China. Sci. Rep. 12, 13103. doi:10.1038/s41598-022-17464-w
Yang, Y. J., Jun, S., and Chen, C. D. (2020). Residential energy-related CO2 emissions in China's less developed regions: A case study of Jiangxi. Sustainability 12, 2000. doi:10.3390/su12052000
Zhang, Y., Wang, F. Y., Du, Z. J., Dou, M., Ling, Z. J., Gao, Y., et al. (2023). Spatio-Temporal distribution characteristics and driving factors of main grain crop water productivity in the yellow river basin. plant 12, 580. doi:10.3390/plants12030580
Zhao, X., Yi, P., Xia, J., He, G., and Gao, X. (2022). Temporal and spatial analysis of the ecosystem service values in the Three Gorges Reservoir area of China based on land use change. Environ. Sci. Pollut. Res. 29, 26549–26563. doi:10.1007/s11356-021-17827-2
Zheng, B. F., Duan, J. J., Jun, S., Liu, F., and Yan, Y. (2008). Assessment of ecosystem services of Lugu Lake watershed. Int. J. Sustain. Dev. World Ecol. 15, 62–70. doi:10.1080/13504500809469770
Keywords: land use, land cover change, ecosystem service value, value equivalent factor method, desert areas of China, reform and opening up
Citation: Ba Z, Du H, Hasi E and Lu X (2023) Changes in land use and ecosystem service value in desert areas of China after reform and opening up. Front. Earth Sci. 11:1251605. doi: 10.3389/feart.2023.1251605
Received: 02 July 2023; Accepted: 29 August 2023;
Published: 15 September 2023.
Edited by:
Qianqian Wang, Beijing Institute of Technology, ChinaCopyright © 2023 Ba, Du, Hasi and Lu. This is an open-access article distributed under the terms of the Creative Commons Attribution License (CC BY). The use, distribution or reproduction in other forums is permitted, provided the original author(s) and the copyright owner(s) are credited and that the original publication in this journal is cited, in accordance with accepted academic practice. No use, distribution or reproduction is permitted which does not comply with these terms.
*Correspondence: Huishi Du, ZHVoc0BqbG51LmVkdS5jbg==
Disclaimer: All claims expressed in this article are solely those of the authors and do not necessarily represent those of their affiliated organizations, or those of the publisher, the editors and the reviewers. Any product that may be evaluated in this article or claim that may be made by its manufacturer is not guaranteed or endorsed by the publisher.
Research integrity at Frontiers
Learn more about the work of our research integrity team to safeguard the quality of each article we publish.