 Yanqi Wang
 Lining Wang*
 Yuqing Zhang
94% of researchers rate our articles as excellent or good
Learn more about the work of our research integrity team to safeguard the quality of each article we publish.
Find out more
ORIGINAL RESEARCH article
Front. Earth Sci., 01 September 2023
Sec. Structural Geology and Tectonics
Volume 11 - 2023 | https://doi.org/10.3389/feart.2023.1251417
This article is part of the Research TopicLithosphere and Surface Processes of the Sichuan Basin and Surrounding Areas: Resources and Environmental EffectsView all 6 articles
Introduction: The southwestern Sichuan fold-thrust belt (SWSB) is a duplex detachment system and features the basal Precambrian detachment at a depth of approximately 15–17 km and the upper Mid-Triassic detachment. Moreover, the SWSB undergoes forward-breaking propagation during the Cenozoic. To date, the mechanism and kinematic evolution governing the SWSB in this thrusting deformation as well as the way the two detachments control the structural deformation pattern of the SWSB remains unknown.
Methods: In this work, three discrete-element numerical models with the same strong upper detachment but basal detachments with different mechanical strengths and thicknesses were designed to study the deformation of the SWSB.
Results: The results indicate that for the Model I with a strong frictional basal detachment with thickness of 500 m, most deformation and thrust faults concentrate near the mobile backwall. Model I exhibits characteristics such as linearly increasing wedge height and stepwise increasing wedge width and slope angle. For the Model II with a modest frictional basal detachment with thickness of 500 m, the strain and deformation propagate into the foreland quickly and multiple back-thrust and thrust faults form on the upper detachment in the second thrusting period. The first thrusting period in Model II, exhibits similarities with Model I. However, in the second period, the wedge reaches a stable state, and its geometry remains constant. In this stage, the deformation propagates along the shallow detachment into the right side of the model. The geometry and activity of thrust faults in the foreland differ significantly in the model III with a modest frictional basal detachment but a greater thickness. Two additional pop-up structures are generated in the second period in this model. The first half of the first thrusting period is similar to the first two models. In the second half of the first period and the second period, the wedge is in a stable state. In the first stage of the shortening, all models undergo a transition from a subcritical state to entering a supercritical state, which indicates that the deformation is progressing rapidly along the basal detachment towards the right side of the model.
Discussion: The results of Model III are consistent with the deformation pattern of the SWSB. The study of the kinematics and interaction between two detachments could help hydrocarbon exploration beneath the upper detachment.
The Longmen Shan, the western region of the southwestern Sichuan fold-thrust belt (SWSB), is positioned between the significantly elevated eastern Tibetan Plateau and the low-relief Sichuan Basin, thereby defining the most pronounced tectonic boundary adjacent to the Tibetan Plateau (Burchfiel et al., 1995; Clark and Royden, 2000; Kirby et al., 2008). However, unlike the northwestern margin of the Tibetan Plateau, whose the present convergence rates range from 15 to 10 mm/yr (Wang et al., 2020), the Longmen Shan fold-thrust belt reveals a relatively low crustal shortening rate of <3 mm/yr (Chen et al., 2000; Zhang et al., 2004; Densmore et al., 2007; Gan et al., 2007; Burchfiel et al., 2008; Loveless and Meade, 2011; Thompson et al., 2015). The rapid and sustained development of such a magnificent intra-continental collision zone, amidst such a complex tectonic paradox, remains a subject of intense debate and scrutiny, but remains elusive to date. To address this problem, a series of main models have been proposed, including ductile lower crustal flow model (Burchfiel, 2004; Clark et al., 2005) and brittle upper crustal thrusting (Royden et al., 1997; Tapponnier et al., 2001; Royden et al., 2008; Hubbard and Shaw, 2009; Hubbard et al., 2010; Li et al., 2010; Wang et al., 2011; Wang et al., 2014).
The first theory, ductile lower crustal flow, emphasizes a vertical inflation process facilitated by the gravity-driven middle-lower ductile crustal flow beneath the eastern plateau margin when meeting with the rigid cratonic Sichuan Basin (Royden et al., 1997; Clark et al., 2005; Burchfiel et al., 2008), and could well explain the steep topography under the relatively low convergence of the Longmen Shan. However, the 2008 Mw 7.9 Wenchuan and the 2013 Mw 6.6 Lushan earthquake demonstrate the second theory, brittle upper crustal thrusting. Other evidence, like the balanced cross-section analysis, thermochronological dating and deep seismic refection, confirms the validity of this theory (Jia et al., 2006; Hubbard and Shaw, 2009; Jia et al., 2010; Guo et al., 2013; Tan et al., 2017).
The Sichuan Basin experienced two periods of foreland thrusting during the Cenozoic, resulting in the development of multiple rows of anticlines on the surface (Wang et al., 2012; Cook et al., 2013; Wang and Lin, 2017; Shen et al., 2019; Jia et al., 2020). This area has always been the focus of oil and gas exploration in the Sichuan Basin, and a few gas fields, such as Pingluoba and Daxingxi, were discovered. Therefore, analysis of the geological structure and tectonic processes in the SWSB are of great importance to the hydrocarbon exploration.
Numerous researchers have discussed the geological model of the SWSB as the brittle upper crustal thrusting style utilizing a diverse range of methodologies including seismic interpretation, field investigation, balanced cross-section analysis, analog modeling, limit analysis, and thermochronological data (Hubbard and Shaw, 2009; Hubbard et al., 2010; Jia et al., 2010; Li et al., 2010; Cook et al., 2013; Wang et al., 2013; Li et al., 2014; Sun et al., 2016; Wang and Lin, 2017; Zhang et al., 2018; Zhang et al., 2019; Cui et al., 2020; Wang et al., 2022). Most of the research findings have indicated that the SWSB is a duplex detachment system and features two main detachments. The lower detachment is a lower Precambrian detachment located at a depth of approximately 15–17 km below the surface. The upper detachment is at a depth of approximately 7 km and is localized in a Triassic gypsum salt layer. The Range Front Blind Fault (RFBF) links the two detachments, forming a flat-ramp-flat structure and making hanging wall a fault blend fold (Jia et al., 2010; Wang et al., 2022). Meanwhile, the SWSB experienced two periods of foreland thrusting during the Cenozoic (Cook et al., 2013; Wang and Lin, 2017; Jia et al., 2020). The first period involved forward-breaking development from Longmen Shan (∼70–40 Ma) to Xiongpo and the Longquan anticline (∼40 Ma to the present). The second period started with the reactivation of Longmen Shan (∼15 Ma to the present). However, the kinematics and the mechanism governing the SWSB in the thrusting deformation as well as the way the two detachments control the structural deformation pattern of the SWSB warrants still worth further exploration and discussion.
This paper establishes a tectonic model of the SWSB through analyzing regional tectonic profiles and utilizing the discrete-element modeling (DEM) (Cundall and Strack, 1979; Morgan, 2015; Li et al., 2018; Li et al., 2021a). Such modeling can quantitatively analyze the structural deformation process and evaluate the strain and stress distribution within deformed structures. It is a powerful method for fault-related structural and mechanical modeling that overcomes the limitations of classical kinematic theory represented by fault-related fold theory, which can be challenging to apply to complex tectonic areas. DEM has been employed in two main approaches to study the tectonic activities of the Sichuan Basin. Firstly, Wu et al. (2021), Xu et al. (2021) and Wu et al. (2021) utilized DEM to investigate the controlling factors of structural deformation in the basin. Their studies provided valuable insights into the regional erosion, sedimentary loading, detachments and surface processes which play crucial roles in the tectonic evolution. Secondly, Wu et al. (2020) and Feng et al. (2022) combined DEM with thermochronological analysis to reconstruct the tectonic uplift process, providing significant understanding of the basin’s geological history and tectonic movements. Thus, DEM is useful for the tectonic evolution and structural deformation within the Sichuan Basin. Using comparative DEM experiments designed based on the structural and mechanical properties of the detachments, we investigated the structural deformation and process of the southwest fold-thrust belt in the Cenozoic. We hope that the paper results provide some help for investigating the interaction between the upper and basal detachments and explaining the deformation pattern of the SWSB during the Cenozoic.
The Sichuan Basin, situated along the eastern margin of the Tibetan Plateau (Figure 1A), is a multicycle composite basin featuring both marine and terrestrial strata atop pre-Sinian crystalline basement (He et al., 2011). The SWSB is in the southwestern region of the Sichuan basin, with the southern segment of the Longmen Shan fold-thrust belt on the northwest (Figure 1B). To the southwest of the SWSB is the Kangdian paleohigh, while the northern region is characterized by Quaternary deposits within the Chengdu Basin. To the east of the region lies the central Sichuan uplift, which primarily exposes Jurassic sediment on the surface (Chen et al., 2020b).
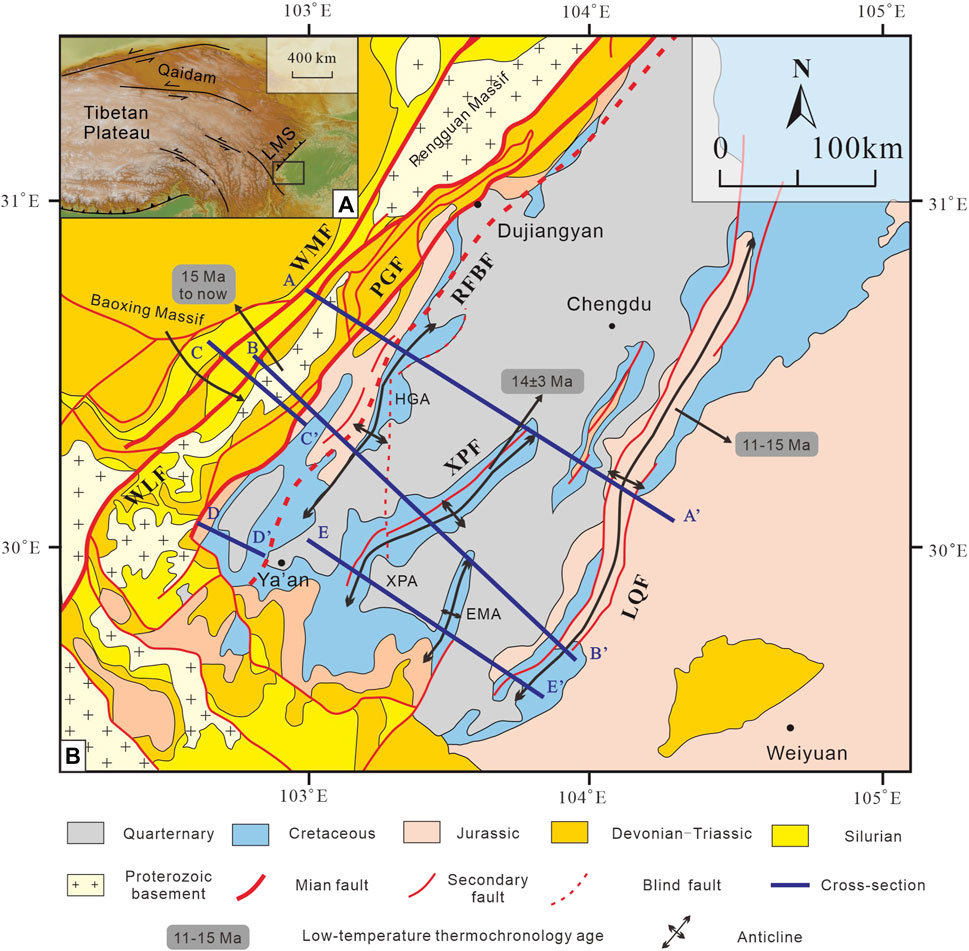
FIGURE 1. (A) Topographic map of the Tibetan Plateau, the Longmen Shan fold-thrust belt (LMS), and Sichuan basin, and the area in the black box is shown in (B). (B) Geological map of the SWSB showing the locations of Longmen Shan fold-thrust belt (western of SWSB), the Kangdian paleohigh (south), the Chengdu basin (center) and the central Sichuan uplift (east). The four anticlines marked from west to east are Huangnigang-Gaojiachang Anticline (HGA), Xiongpo Anticline (XPA), Emei Anticline (EMA) and Longquan Anticline. The gray rectangles represent the age of previous published low-temperature thermochronology data, from Baoxing Massif (Cook et al., 2013; Tian et al., 2013), Xiongpo Anticline (Burchfiel et al., 1995; Arne et al., 1997; Li et al., 2019) and Longquan Anticline (Richardson et al., 2008; Wang and Lin, 2017; Lu et al., 2018). The deep blue lines represent the previous published seismic reflection profiles in the study area, from A-A′, B-B’ (Wei et al., 2019), C-C′, D-D′, and E-E’ (Hubbard and Shaw, 2009; Hubbard et al., 2010). WMF: Wenchuan-Maowen Fault; WLF: Wulong Fault; PGF: Pengguan Fault; RFBF: Range Front Blind Fault; XPF: Xiongpo Fault; LQF: Longquan Fault.
The SWSB has undergone approximately three phases of tectonic deformation since the Late Triassic (Yan et al., 2011; Xue et al., 2017; Yan et al., 2018a; Yan et al., 2018b; Wang et al., 2022). During Late Triassic to Early Jurassic, a thrust movement occurred in southwest Sichuan due to the collision of the South China Plate and the North China Plate. In this stage, the SWSB did not experience thrust folding, but rather developed a wedge-shaped sedimentary structure underlain by Middle Triassic evaporite rocks, with forebulge located between the Longquan mountains and Weiyuan anticline (Guo et al., 1996; Jia et al., 2006; Hubbard et al., 2010; Wei et al., 2019; Chen et al., 2020a; Wang et al., 2020; Wang et al., 2022). From the Mid-Jurassic to the Cretaceous, the southwestern Sichuan basin entered a phase of intracontinental subsidence, during which the wedge-shaped structure here was strengthened, while the forebulge migrated further to the east. Since the Late Cretaceous, the southwest Sichuan basin has been rejuvenated by the long-distance effect of the Indo-Tibetan continental collision, leading to slow, steady exhumation, followed by two periods of rapid uplift, which will be discussed in detail in the “3.2.2 Timing of Events” section. (Cook et al., 2013; Tian et al., 2013; Jia et al., 2020).
The NE hinterland of the SWSB consists of four NW-dipping imbricate thrust faults, from west to east, the Wenchuan-Maowen Fault (WMF), the Wulong Fault (WLF), the Pengguan Fault (PGT), and the RFBF (Deng et al., 1994; Kirby et al., 2003; Jia et al., 2006; Burchfiel et al., 2008; Li et al., 2013a). The Cenozoic thrusting formed three anticline belts, namely Huangnigang-Gaojiachang anticline (HGA), Xiongpo anticline and Longquan anticline, and two gentle synclines in foreland of the SWSB (Figure 1). The SWSB consists of a two-level detachment system: a gently dipping Pre-Sinian basal detachment at a depth of 15–18 km and a upper hinterland-dipping Mid-Triassic detachment located in the basin interior at a depth of 5–7 km (Figure 2) (Hubbard and Shaw, 2009; Hubbard et al., 2010; Jia et al., 2010; Wang et al., 2014). The RFBF links these detachments, forming a flat-ramp-flat structure and making hanging wall a fault blend fold (Jia et al., 2010; Wang et al., 2022). Basement-involved thrust-related structures have developed in the hinterland region of the SWSB. An array of NE-NNE-trending thrust-related folds are formed above the Triassic evaporitic detachment in the foreland of the SWSB, which is consistent with the thin-skinned tectonic model.
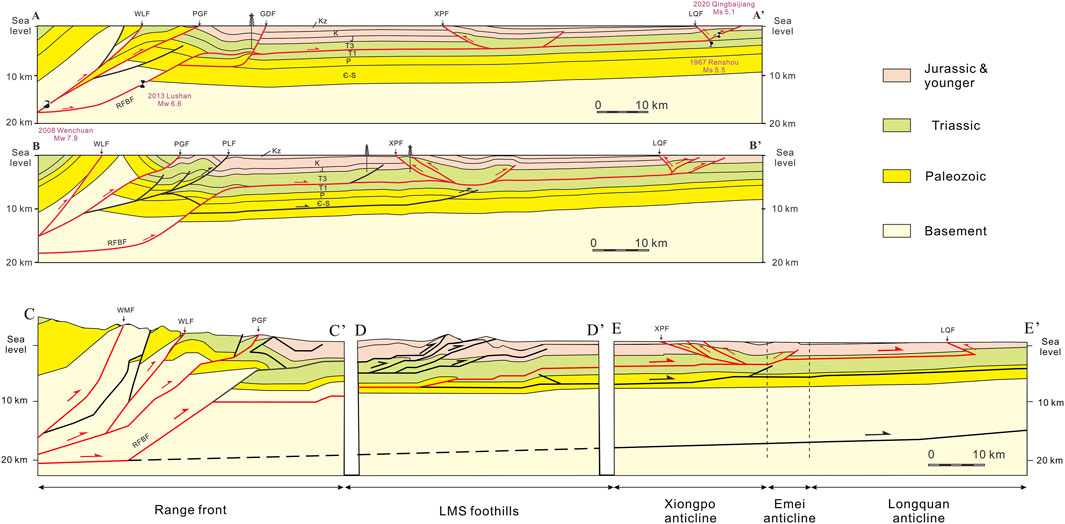
FIGURE 2. Typical structural profiles (AA’–EE’) across the SWSB, and the seismoteconic model of four representative earthquakes. Profiles (AA′, BB′) are adapted from Wei et al. (2019). Focal mechanisms of these earthquake are from Zhang et al. (1990) and Wang et al. (2022). Profiles (CC′–EE′) are modified from Hubbard and Shaw (2009) and Hubbard et al. (2010). See locations of lines (AA’–EE’) in Figure 1. Basement-involved imbricate thrust faults developed above the basal pre-Sinian detachment in the hinterland, and thin-skinned thrust-related folds are formed above the upper Triassic Mid- Triassic evaporitic detachment these detachments, forming a flat-ramp-flat structure.
The Xiongpo, Emei, and the Longquan anticline are the key structures of interest for comparison in this study. Therefore, it is essential to provide a focused introduction to their geometric features. The Xiongpo anticline is a NE-trending fault-related fold, approximately 90 km long and 10–15 km wide, primarily controlled by a west-verging NE-striking thrust fault (XPF in Figure 2) (Li et al., 2019). The Longquan anticline, the most prominent ramp anticline, trends north-northeastward and spans approximately 200 km in length and 15–20 km in width (Li et al., 2008; Li et al., 2013b). Geological profiles indicate that the surrounding area of both the Longquan anticline and the Xiongpo anticline consist of various pop-up structures formed by different numbers of thrust faults, all rooted in the Lower Triassic decollement layer. In profile A-A′, the north Longquan anticline is primarily bounded by an east-verging thrust fault at the eastern foothill and a west-verging wedge thrust at the western foothill with relatively small shortening (LQF in Figure 2). Similarly, the Xiongpo and Emei anticlines in this profile resembles the Longquan anticline, with the exception that the west-verging wedge thrust exhibits greater shortening. In profile B-B′, the south Longquan anticline is mainly bounded by two east-verging thrust faults at the eastern foothill and a west-verging wedge thrust at the western foothill with minor shortening. On the other hand, the Xiongpo and Emei anticlines in this profile exhibits the opposite configuration. In profile C-C′, D-D’ and E-E′, the southern end of the Longquan anticline is formed by a SE-dipping thrust fault, while the Xiongpo and Emei anticline is primarily bounded by three west-verging splay thrust faults and a minor thrust fault.
An accurate comprehension of the timing of thrust structures is crucial for understanding fault-related hydrocarbon migration, as it is believed to occur contemporaneously with deformation (Jia et al., 2006). Prior to 2010, hydrocarbon exploration in the SWSB was primarily focused on the shallow tectonic layer above the Mid-Triassic detachment. A few gas fields, such as Pingluoba, Daxingxi, and Qiongxi, as well as several gas-bearing structures like Zhangjiaping and Baimamiao (Yang et al., 2009; Pei et al., 2012), were then discovered, but their reserves and production were limited (Chen et al., 2020b). This indicates that the tectonic analysis of this complex tectonic zone restricted hydrocarbon exploration. Since 2010, attention has shifted to the deep tectonic layer below the Mid-Triassic detachment. Therefore, it has become particularly important to recognize the deformation timing of certain thrust structures and the interaction mechanism between the shallow and basal detachments. This not only greatly improves exploration efficiency in the shallow tectonic layer, but also gives new and promising opportunities for exploration beneath the upper detachment.
The DEM is a numerical method proposed by Cundall and Strack (1979) for studying the deformation of rock-soil mass. The main feature is to treat a single particle within a granular assembly as a discrete unit, and to simulate the mechanical behavior of the granular material through a series of discrete units, like two-dimensional discs and spheres. At present, this method has been widely used by domestic and foreign scholars in the study of tectonic deformation processes and mechanisms in fold-thrust belts (Hardy and Finch, 2005; Morgan, 2015; Xin et al., 2020; Li et al., 2021b; Li et al., 2022; Qu et al., 2022).
Distinct particles within the DEM displace independently from one another and interact only at contact points. The solution process of the DEM is actually an iterative calculation of the particle displacements and forces, which can be summarized in two parts: in the first step, the net force and moment on the known particles are updated by Newton’s second law; in the second step, the particles in contact with each other are found and the forces on these particles at that moment are calculated by applying a contact theory (i.e., the stress-displacement law) (Li et al., 2018; Li, 2019; Li et al., 2022). The main contact theories that are currently used contain the Lattice Solid model (Place et al., 2002), the Linear-Elastic mode (Cundall and Strack, 1979), the Bond model and the Hertz-Mindlin model (Morgan, 2015).
In this paper, the Bond and the Hertz-Mindlin contact mechanics models are used, utilizing the two-dimensional DEM numerical simulation software ZDEM (searched using https://geovbox.com/en/). The numerical code utilized for ZDEM software was written in C language and was modified from RICEBAL software developed by Morgan using Hertz-Mindlin model (Morgan, 2015). And RICEBAL was developed from TRUBAL which was invented by Cundall using the Linear-Elastic model at 1979 (Cundall and Strack, 1979).
In ZDEM software, the contact force between the particles that bonded to each other can be decomposed into normal force Fn and shear force Fs (Figure 3). When the normal stress between two particles is the pressure, Fn is positive, and vice versa is negative. Its calculation formula is:
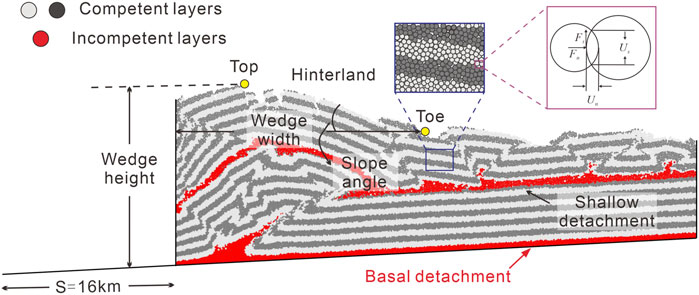
FIGURE 3. Illustration of the DEM method and sign convention for Fn, Fs, Un, and Us. This schematic figure also demonstrates how the wedge height, wedge width, and slope angle have been determined. The shortening amount in this research (S) is 16 km. The two colorful competent layers are rheologically the same. Fn; normal force; Fs: shear force; Un: normal overlap value; Us: shear overlap value.
Where kn and ks represent the normal and tangential interparticle stiffness respectively, which could be calculated by the Hertz-Mindlin model when compressed and the Bond model when in extension. Un and Us denotes the normal and shear amount of overlap between particles respectively.
When particles are in bond, their maximum normal force is:
Their maximum shear force is:
Where Tb is the tensile strength, and Cb is the unconfined shear strength of the interparticle bonds at Fn=0. S’ is the cross-sectional area of the elastic bond, assumed to be a circle with a radius equal to that of the smallest particle in contact. μ is the friction coefficient. If the distance between the centers of two particles is less than or equal to the sum of their radii after the initial model is generated, they are in contact with each other thus generating a bond. When the normal force
After the simulation is completed, the geometric characteristics of the contractional wedge during the compression process can be accurately measured using the method described by Li et al. (2022). The contractional wedge comprises the top, toe, height, width, and slope angle, as illustrated in Figure 3. To identify the top point, the coordinates of the point on the surface should be determined, which can be extracted from the ". dat” files generated during the simulation using MATLAB software. In this process, the points of the surface are located based on the mesh, and the toe of the slope is determined using the farthest distance method. Subsequently, the wedge height, wedge width, and slope angle can be easily calculated using the top and toe of the wedge. This method provides a precise definition of the slope toe and enables automatic measurement through programming, thereby eliminating the measurement errors caused by human factors. For a detailed description, refer to Li (2019) and Li et al. (2021a).
In order to ascertain the state of the wedge during the thrusting process, we refer to the critical tapered wedge theory (Davis et al., 1983). According to this theory, for subaerial wedges with lower water saturation, pore pressure can be neglected in the calculation process. Therefore, the theoretical critical taper angle is as follows:
Where
The models are set up based on the interpretation and the balanced restoration of the seismic reflection profile A-A’ (Figures 2, 4) (Wei et al., 2019). Meanwhile, because of the uncertainty of structural recovery in the hinterland of the SWSB caused by the absent strata in this region, we also refer to the structural restoration data published by other researchers (See line locations B-B’ ∼E-E’ in Figure 1) (Hubbard and Shaw, 2009; Hubbard et al., 2010).
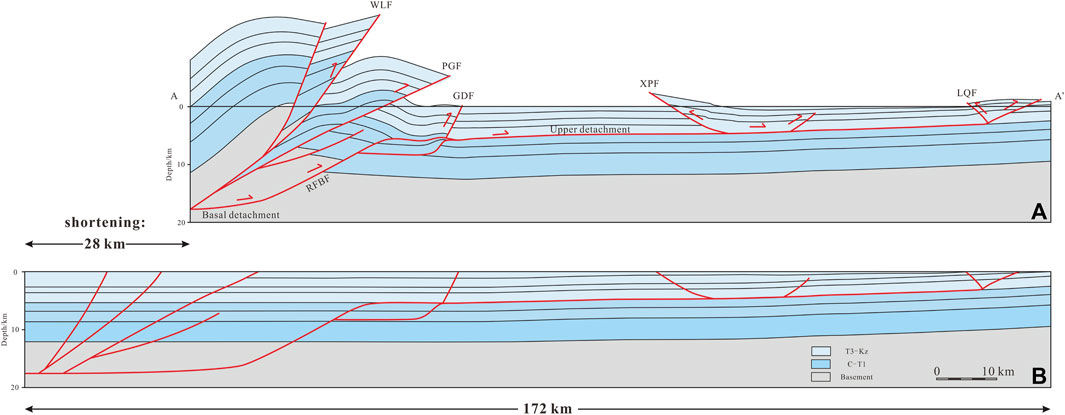
FIGURE 4. (A) Representative structural profile A-A’ (see location in Figure 1) in the SWSB (Wei et al., 2019). (B) Balanced restoration results of deformed horizons in profile A-A’. The shortening of this profile is 28 km. The Cenozoic sedimentary strata within hinterland of the SWSB in this profile are absent.
The line A-A’ is located at the central SWSB, and underlines, from west to east, the range front, Huangnigang-Gaojiachang anticline (HGA), Xiongpo anticline and Longquan anticline. In this profile, a duplex detachment system comprises the basal detachment at a depth of 17 km, the upper Mid-Triassic detachment at a depth of approximately 7 km, and the RFBF which connects these detachments (Figure 4). Due to the intense erosion in the Late Cenozoic, the sedimentary strata above the Triassic within the hinterland are absent. Several faults in the hinterland, like WLF and PGF, are imbricate-shaped. Two pop-up structures, namely XPF and LQF, form in the central and right of the profile. After the balanced restoration, we can see the original length is 172 km and shortening amount is 28 km.
Researchers separated deformation in the SWSB into five NE-trending domains, that is, from west to east, 1) Range front, 2) Longmen Shan (LMS) foothills, 3) Xiongpo anticline, 4) Emei anticline, 5) Longquan anticline (Figure 2) (Hubbard and Shaw, 2009; Hubbard et al., 2010). Then they measured the shortening of each structure, and found the total shortening is 68.1 km (29.2%) from Range front to Longquan anticline (Table 1). The shortening measurement of the Rang front is from the section C-C’ (Hubbard et al., 2010). Measurements from the foothills through the Longquan anticline are made across cross-sections D-D′ and E-E’ (Hubbard and Shaw, 2009). Shortening is estimated in each area of the section by restoring fault cutoffs and dividing shortening by the horizontal width of each structural belt (Dahlstrom, 1969). Increasing shortening values from 2.6% in Longquan anticline to a maximum of 48.8% in Range front are noted, which correlates with the increase in topography. In the southern Longmen Shan region (including Range front and Foothills), the total shortening is 58.6 km, accounting for approximately 87% of the total shortening. In addition, the strata exhibit a regional west dip of two to three degrees towards the hinterland.
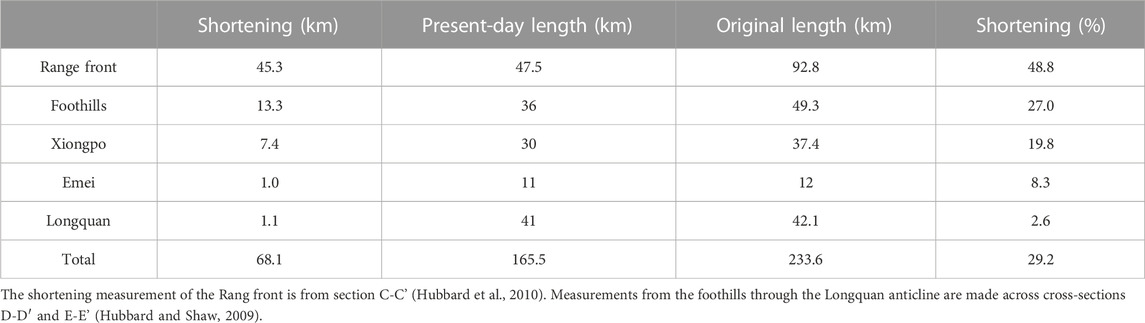
TABLE 1. Shortening measurements for each structure of the SWSB along C-C′, D-D′, and E-E’ (Hubbard and Shaw, 2009; Hubbard et al., 2010).
In the previous investigations, the shortening amount from the Range front to the Longquan anticline was calculated (Table 2) (Hubbard and Shaw, 2009; Hubbard et al., 2010; Wei et al., 2019). As both profiles A-A′ and B-B′ are derived from complete seismic profiles and their positions are perpendicular to the main structural trend of the study area, they serve as the primary references for the shape of the models. The total shortening measured by profile A-A′ is 28 km, which takes up 19.2% of the original length. The shortening of the profile B-B’ is 34 km, which accounts for 25.8% of the original length. Therefore, the initial models for the DEM simulations are set up by comprising the shortening data above, and the original length of these models is 170 km with the hinterland taking 60 km up, and the estimated shortening is 35 km which accounts for 20.0% of the original length. Moreover, we divided the entire progressive deformation process into two stages, one in the southern Longmen Shan and the other in the southwestern Sichuan Basin. Based on the previous research (Table 1), the shortening rate in the southern Longmen Shan region is estimated to be 87%, which corresponds to 31 km in this model. Previous numerical and analogue models (Massoli et al., 2006; Zhang et al., 2019) also validated the RFBF that connects the basal and upper detachments can form when the length of upper detachment reaches 75–125 km. Because of the simplification of the models, we set the length of upper detachment as 110 km, which is consistent with the length of the frontland.
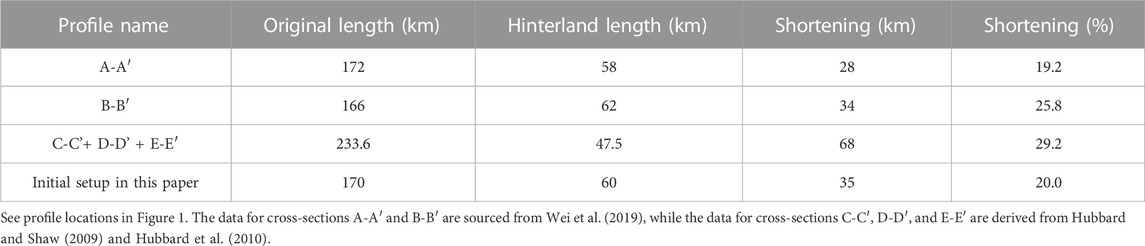
TABLE 2. Summary of the shortening from the Range front through the Longquan anticline and the initial setup for the DEM simulations in the Paper.
The material properties (include the friction coefficient) used in the models were based on previous DEM simulation (Morgan, 2015; Li et al., 2018; Li et al., 2021a). The model was filled with particles that had grain sizes at 60 or 80 m, a density of 2,500 kg/m3, a friction coefficient of 0.3, a shear modulus of 2.9 GPa, and a Poisson ratio of 0.2 (Table 3). We used the nonlinear Hertz–Mindlin contact theory (Johnson, 2012) to calculate the interparticle contact forces. Gravity caused the particles to settle freely, and once they stabilized; they became bonded to one another. Young’s modulus and the shear modulus for particle bonding were both set to 2.0 × 10⁸ Pa. The tensile and shear strengths were set to 2.0 × 10⁷ and 4.0 × 10⁷ Pa, respectively (Table 3). Lastly, the upper detachment is set as a non-frictional detachment that had particle at a friction coefficient of 0, and a density of 2,500 kg/m3. For the basal detachment, it is more complex. Thus, in this study, we designed three models with the same weak upper detachment and different strong and thick basal detachments to simulate the effects of different strengths and thicknesses of the basal detachment on the deformation pattern of the models. In the first model, the basal detachment was characterized by a strong frictional interaction with a coefficient of 0.3 and a thickness of 500 m. In the second and third models, the basal detachment exhibited a modest frictional interaction with a coefficient of 0.2. The thickness of the basal detachment in the second model was the same as in the first model, while in the third model, it was increased to 1,000 m.
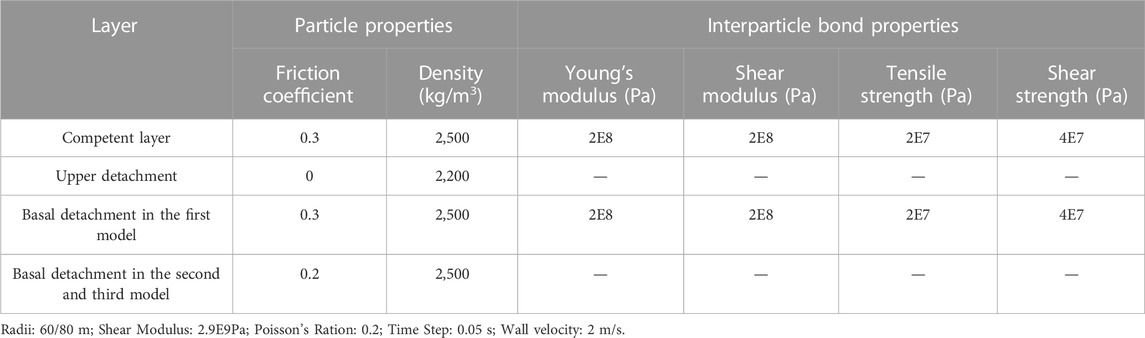
TABLE 3. Particle properties and interparticle bond properties for DEM simulations.
Overall, we set up a two-level detachment system with different mechanical strengths in the DEM simulations. The initial length is 170 km with the hinterland taking 60 km up, and the estimated shortening is 35 km which accounts for 20.0% of the original length (Figure 5; Table 2). The upper detachment was set to a thickness of 500 m, which dips toward the hinterland at an angle of 3°. The basal detachment, set at the bottom of the model and a thickness of 1,000 m, was horizontal in the hinterland, and parallel to the upper detachment in the foreland. Finally, by comparing the models with different thicknesses and friction coefficients of the basal detachment, we investigated the influence of the basal detachment strength on the foreland thrusting in the SWSB.
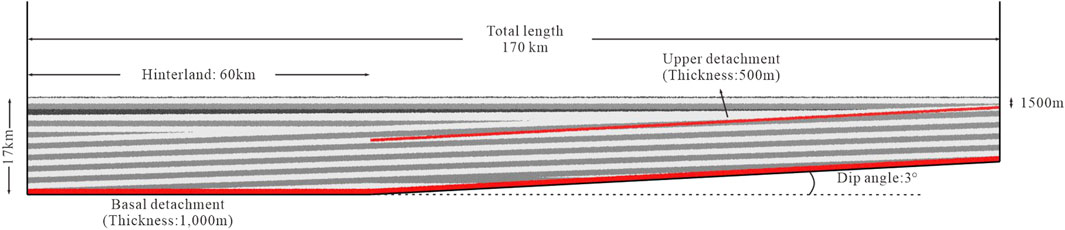
FIGURE 5. Schematic representation of the initial model setup containing two detachments with differential thicknesses and mechanical strengths. The upper Mid-Triassic evaporitic detachment ends at which the salt lake boundary is. The basal detachment develops throughout the whole SWSB, and is parallel to the upper detachment in its foreland.
The SWSB in the Cenozoic underwent two stages of thrusting tectonics, with the first phase starting around 70 Ma and the second phase commencing around 15 Ma and persisting to the present. Initially, the southern Longmen Shan experienced rapid uplift during the Late Cretaceous to the Paleogene (approximately 70–40 Ma), as evidenced by growth strata and a shift in the foredeep towards the southwestern Sichuan Basin (Jia et al., 2020). Subsequently, the fold-thrust belt propagated in a forward-breaking manner from the Longmen Shan towards the southwestern Sichuan Basin. Low-temperature thermochronology data from the Xiongpo anticline and Longquan anticline indicate their formation at approximately ∼40 and 11/15 Ma to the present, respectively (Figure 1) (Burchfiel et al., 1995; Arne et al., 1997; Richardson et al., 2008; Wang and Lin, 2017; Lu et al., 2018; Li et al., 2019). The second phase of thrusting involved the reactivation of the Longmen Shan around 15 Ma, resulting in another round of accretion in the range front. Cook et al. (2013) and Tian et al. (2013) presented fission-track and (U-Th)/He data from the Baoxing Massif in the southern Longmen Shan, suggesting ongoing exhumation by approximately 15 Ma (Figure 1). The catastrophic 2008 Mw 7.9 Wenchuan earthquake and the subsequent 2013 Mw 6.6 Lushan earthquake (Figure 2), located within the Longmen Shan fold-thrust belt, epitomized the tectonic activity in the range front, roughly 150 km distant from the deformation front. The present study centers on the mechanical strengths of the basal detachment within the SWSB and its role in the tectonic process. Consequently, the deformation period covered by our models should correspond to the first stage of thrusting tectonics.
We offer in this section three comparative DEM models. The model I contains a basal detachment at a thickness of 500 m and a friction coefficient of 0.3 in the thrusting process of 35 km. The thickness of the basal detachment in the model II remains constant, and friction coefficient changes from 0.3 to 0.2. In the model III, the basal detachment is at a thickness of 1,000 m and a friction coefficient of 0.2.
Model I (performed with the strong frictional basal detachment at a thickness of 500 m) was characterized by the forward-breaking thrusting towards the foreland in the two thrusting periods (Figure 6). Most of the deformation and thrust faults are formed in the first thrusting period, and concentrate near the mobile backwall. In the first period, T1, T2, T3, and T4 generate gradually, forming imbricate structures in the hinterland, and T5 forms as a pop-up structure in the end. The second thrusting produced T6 as a pop-up structure. Continued shortening produced two pop-up structures above the upper detachment. It is noteworthy that T5 and T6 share similar displacement, geometry and topography, even though they were developed in the different periods.
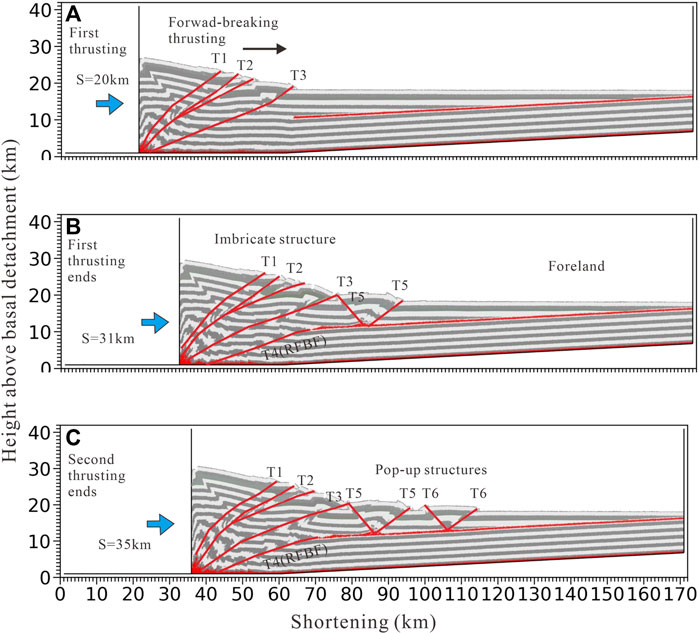
FIGURE 6. The progressive evolution observed in Model I (conducted with the basal detachment at the thickness of 500 m and a friction coefficient of 0.3). (A–C) The results of Model I at total shortenings of 20 km (A), 31 km (B), and 35 km (C). T1–T6 denote thrust faults in the order of their formation. RFBF, Range Front blind fault.
Once the simulation is finished, it becomes possible to precisely measure the geometric properties of the contractional wedge during the thrusting process. The deformation process of Model I (Figures 7A–C) exhibits the following characteristics: 1) The wedge height increases linearly throughout the process; 2) The wedge width shows a stepwise increase, with the formation of T1, T2, T3, and T5 faults at S=6, 8, 18, and 32 km, respectively, leading to a rapid increase in wedge width, and after shortening by 31 km, the wedge width remains relatively constant; 3) The overall wedge slope angle also exhibits a stepwise increase. 4) By Eq. 4, the critical taper angle for Model I is determined to be 8.7°. Therefore, in this model, when the amount of shortening is between 0 and 15 km, the wedge is in a subcritical state, and beyond this range, it remains in a supercritical state. The fact that the hinterland-tapered Coulomb wedge is in a supercritical state indicates that the deformation is advancing along the detachment into the right side of the model. Research from previous studies has demonstrated that further shortening of the supercritical wedge can lead to either the rapid advancement of the deformation front or extensional collapse in the hinterland (Davis et al., 1983; Platt, 1986). In general, the structural deformation of Model I is mainly concentrated near the wedge. With increasing shortening, the wedge height increases linearly, while the width and slope angle show stepwise increases. In the first stage of Model I, when the shortening is 0–15 km, the wedge is in a subcritical state, transitioning to a supercritical state afterward.
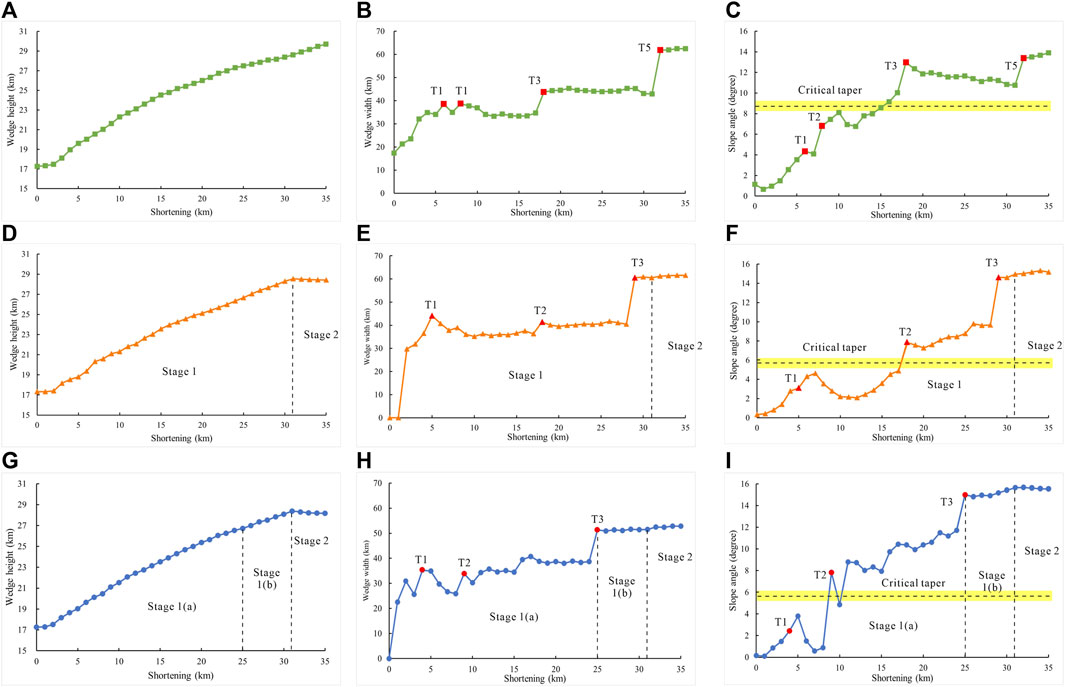
FIGURE 7. Comparative analysis of (A, D, G) wedge height variations with shortening for Model I, II, and III, respectively; (B, E, H) wedge width variations with shortening for Model I, II, and III, respectively; and (C, F, I) slope angle variations with shortening for Model I, II, and III, respectively.
Model II (performed with modest frictional basal detachment with thickness of 500 m) exhibited a two-stage evolutionary process. The geometry in the hinterland is similar with the Model I. However, the geometry and activity of the thrust faults in the foreland differed significantly from those of Model I. In the first period, three imbricate thrust faults, namely T1-T3 and a pop-up structure generate (T3-T4) gradually near the mobile backwall (Figure 8). However, several back-thrust and thrust faults (T5-T6) formed quickly in the whole foreland in the second thrusting because the deformation propagates fast along the non-frictional detachments during this term.
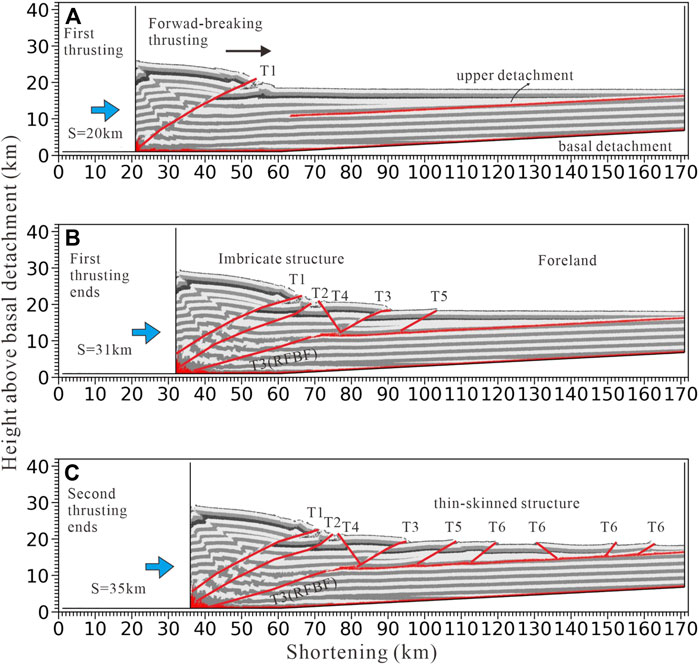
FIGURE 8. The progressive evolution observed in Model II (conducted with the basal detachment at the thickness of 500 m and a friction coefficient of 0.2). (A–C) The results of Model II at total shortenings of 20 km (A), 31 km (B), and 35 km (C). T1–T6 denote thrust faults in the order of their formation. RFBF, Range Front blind fault.
The Model II (Figures 7D–F) displays the following features: 1) The height of the wedge initially increases linearly, and after a shortening of 31 km, the wedge height stabilizes. 2) The wedge width rapidly increases in the shortening range of 0–5 km. Then, in the shortening range of 5–28 km, the wedge width stabilizes between 35 and 40 km, with a slight increase at a shortening of 18 km, representing the formation of the T2 fault. Subsequently, at a shortening of 29 km, the formation of the T3 causes a rapid increase in wedge width, followed by stabilization near 60 km. 3) The slope angle initially shows a stepwise increase in the shortening range of 0–29 km. The formation of faults (corresponding to shortening of 7, 18, and 29 km) corresponds to maximum values of the slope angle, indicating that the formation of new faults leads to the rapid migration of the toe position and a decrease in the overall slope angle. In the shortening range of 29–35 km, the slope angle stabilizes around 15°, indicating that thrusting propagates forward into the basin, and the orogenic belt enters a stable stage. 4) Using Eq, 4, the critical taper angle for Model II is calculated to be 5.8°. Consequently, in this model, the wedge remains in a subcritical state during the initial shortening of 0–17 km and transitions to a supercritical state thereafter, which signifies that the deformation is moving forward along the basal detachment, extending towards the model’s right side. Overall, the deformation in Model II can be divided into two stages. The first stage involves a shortening range of 0–31 km, during which the structural deformation concentrates on one side of the left wedge. In this phase, the wedge height rapidly increases, while the width experiences a rapid increase followed by gradual stabilization. Additionally, the slope angle exhibits a stepwise increase during this stage. The second stage (shortening range of 31–35 km) involves deformation propagating along the upper detachment into the right area of the model, causing the rapid formation of multiple thrust faults and backthrust faults in the right area. Meanwhile, the wedge maintains stability during this time, with its height, width, and slope angle remaining relatively constant.
We found that Model III (performed with modest frictional basal detachment with thickness of 1,000 m) also exhibited a two-stage evolutionary process, similar to that of Model II. The geometry in the hinterland is similar with two models above (Figure 9). However, the geometry and activity of the thrust faults in the foreland differed significantly from those of Model II. In the first period, three imbricate thrust faults, namely T1-T3 and a pop-up structure generate (T3-T4) gradually near the mobile backwall. The second thrusting enables the foreland to generate two pop-up structures. All faults and deformations deform in in-sequence style in the two thrusting periods. Even through the structures above the upper detachment share similar geometry as pop-up structures, they are developed in different time.
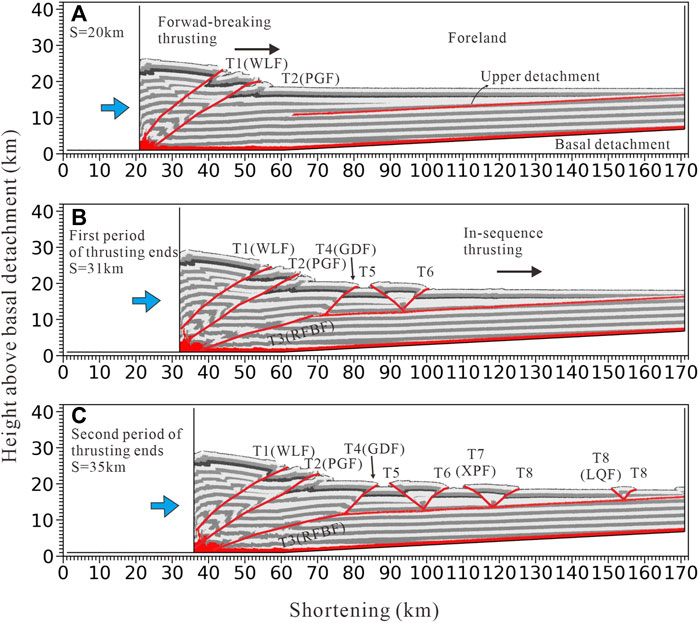
FIGURE 9. The progressive evolution observed in Model III (conducted with the basal detachment at the thickness of 1,000 m and a friction coefficient of 0.2). (A–C) The results of Model II at total shortenings of 20 km (A), 31 km (B), and 35 km (C). T1–T8 denote thrust faults in the order of their formation. WLF, Wulong fault. PGF, Pengguan fault. RFBF, Range Front blind fault. XPF, Xiongpo Fault. LQF, Longquan Fault.
In Model III, the deformation process is characterized by the following aspects: 1) The wedge height initially shows a linear increase for shortening distances of 0–31 km and then stabilizes. 2) The wedge width displays a step-like increase. The forming of the thrust faults T1, T2, and T3 at shortening of 4, 9, and 25 km, respectively, causes the position of the wedge toe to rapidly move forward and the wedge width to increase sharply. After reaching a shortening of 25 km, the wedge width remains relatively constant. 3) The wedge slope angle also exhibits a step-like increase in the early stages of deformation, forming thrust faults T1 and T2 at shortening of 5 and 9 km, respectively, where the slope angle reaches its maximum value. Subsequently, at a shortening distance of 25 km, the T3 forms, and the deformation is transmitted along the shallow detachment to the right-hand side of the model, stabilizing the slope angle at around 15°. 4) By applying Eq. 4, the critical taper angle for Model III is determined to be 5.8°. As a result, in this model, the wedge remains in a subcritical state during the initial shortening phase of 0–8 km, and subsequently transitions to a supercritical state, which indicates that the deformation is progressing along the basal detachment towards the right side of the model. In summary, the deformation of Model III can be divided into two stages: In the first stage, for shortening distances of 0–25 km, the wedge height rapidly increases, and the wedge width and slope angle exhibit step-like increases, corresponding to Stage 1(a) in Figures 7G–I. Subsequently, at a shortening distance of 25–31 km, the wedge height continues to increase rapidly, while the wedge width and slope angle remain relatively constant, corresponding to Stage 1(b) in Figures 7G–I. In the second stage (Stage 2 in Figures 7G–I), at shortening distances of 31–35 km, the wedge height, wedge width and slope angle remain relatively constant.
The article presents three comparative DEM models to investigate the deformation patterns in the SWSB. Model I, characterized by a strong frictional basal detachment, exhibits forward-breaking thrusting towards the foreland in two thrusting periods. Most deformation and thrust faults concentrate near the mobile backwall, with the development of imbricate structures and two pop-up structures. Model II, with a modest frictional basal detachment, shows a two-stage evolutionary process similar to Model I in the hinterland, but significant differences in the geometry and activity of thrust faults in the foreland. Multiple back-thrust and thrust faults form quickly in the second thrusting period. Model III, also with a modest frictional basal detachment but a greater thickness, displays a similar two-stage process to Model II in the hinterland. However, the geometry and activity of thrust faults in the foreland differ significantly. Two additional pop-up structures, named the Xiongpo and Longquan anticline, are generated in the second thrusting period. The results of Model III align well with the observed low-temperature thermochronology data.
Overall, Model III, where captures the deformation characteristics of the SWSB more accurately, indicating its relevance to the evolution of the region. The models provide insights into the deformation processes and mechanisms in the SWSB, emphasizing the importance of considering variations in detachment properties and thicknesses in understanding the tectonic evolution of the area. Since our results meet very well with the features of structural profiles and the available geological constraints, it is reasonable to adopt the upper crustal shortening as a major mountain building mechanism of the SWSB. Therefore, we can compare the deformation of the SWSB with Model III. In the Stage 1(a), the thrusting deformation occurs in the southern Longmen Shan (Range front) with a shortening range of 0–25 km. At this stage, the wedge undergoes the transition from a subcritical to a supercritical state, and the thrusting deformation mainly occurs on the orogenic belt side, leading to the development of imbricate structures. The Stage 1(b) occurs in the Longmen Shan (LMS) foothills, specifically the Huangnigang-Gaojiachang anticline, with a shortening range of 25–31 km. At this stage, the orogenic belt is in a critical state. In the Stage 2, the deformation occurs in the southwestern Sichuan Basin, specifically the Xiongpo and Longquan anticlines, with a shortening range of 31–35 km. At this stage, the wedge is in a critical state, and its geometry remains stable.
First, the two-dimensional simulations employed in this study did not account for variations along the strike of the décollement zone. Second, the experimental design simplified the lithology and structural characteristics of the strata, and did not consider the influence of syn-tectonic sedimentation and erosion. Additionally, duplexes or wedges, such as the Guankou duplex, are developed between the basement detachments (Lu et al., 2012; Liu et al., 2020). However, these structures were not founded in the three existing models, possibly due to neglecting the contrasting rock strengths between the basement and cover. For improved accuracy in future research, it is recommended to incorporate a high/low contrast in rock strength between the basement and sedimentary cover to simulate its impact on the SWSB. Furthermore, the modeling results were not influenced by variations in shortening relative to the geological timescale. This limitation arises from the lack of well-preserved Cenozoic syntectonic sedimentation records in the range front of the Longmen Shan (Burchfiel et al., 1995).
In this paper, three discrete-element numerical models with the same strong upper detachment but basal detachments with different strengths and thicknesses were designed to study the deformation of the SWSB. We analyzed the experimental results and compared the model results with the SWSB, obtaining the following conclusions:
1) In duplex detachment layer models, the strength and thickness of the basal detachment layer are important factors that affected the overall deformation of the models. In the Model I, most deformation and thrust faults concentrate near the mobile backwall. Model II shows a two-stage evolutionary process, but multiple back-thrust and thrust faults form quickly in the second thrusting period. The geometry and activity of thrust faults in the foreland differ significantly in the model III with a modest frictional basal detachment but a greater thickness. Two additional pop-up structures are generated in the second thrusting period in this model. The results of Model III are consistent with the deformation pattern of the SWSB. Additionally, from the results, we can infer that the current structure pattern of the SWSB can be produced by upper crustal thrusting.
2) Model I exhibits characteristics such as linearly increasing wedge height and stepwise increasing wedge width and slope angle. The deformation is concentrated near the wedge. In Model II, the first stage of deformation exhibits similarities with Model I. However, in the second stage, the wedge of Model II reaches a stable state, and its geometric properties remain constant. In this stage, the deformation propagates along the shallow detachment towards the right side of the model. As for Model III, Stage 1(a) is similar to the first two models. In Stage 1(b) and Stage 2, the wedge is in a stable state for the same reason with Model II. In the first stage of the shortening, all models undergo a transition from a subcritical state to entering a supercritical state.
3) The SWSB experienced forward-breaking development during the Cenozoic, extending from the southern Longmen Shan to the Longquan anticline. The results of our numerical models exhibit a remarkable consistency with the observed deformation patterns in the SWSB. This suggests that a thicker and modest basal detachment is a key factor driving the mountain building process in the SWSB. The high degree of agreement between the models and observations strengthens our understanding of the tectonic evolution of the region.
The original contributions presented in the study are included in the article/Supplementary material, further inquiries can be directed to the corresponding author.
YW conceived the idea; YZ conducted the analyses; RR and NS provided the data; LW analysed the data; ZC, GW, and YW interpreted the results. All authors contributed to the article and approved the submitted version.
The project is supported by China National Petroleum Corporation Limited (CNPC) Science and Technology Project (2021DJ0301).
We acknowledge the reviewers and editors for their useful comments and corrections and their invaluable help.
The authors declare that the research was conducted in the absence of any commercial or financial relationships that could be construed as a potential conflict of interest.
All claims expressed in this article are solely those of the authors and do not necessarily represent those of their affiliated organizations, or those of the publisher, the editors and the reviewers. Any product that may be evaluated in this article, or claim that may be made by its manufacturer, is not guaranteed or endorsed by the publisher.
Arne, D., Worley, B., Wilson, C., Chen, S. F., Foster, D., Luo, Z. L., et al. (1997). Differential exhumation in response to episodic thrusting along the eastern margin of the Tibetan Plateau. Tectonophysics 280 (3-4), 239–256. doi:10.1016/s0040-1951(97)00040-1
Burchfiel, B. C. (2004). 2003 presidential address: new technology; new geological challenges. Geol. Soc. Am. Today 14 (2), 4. doi:10.1130/1052-5173(2004)014<4:panngc>2.0.co;2
Burchfiel, B. C., Chen, Z., Liu, Y., and Royden, L. H. (1995). Tectonics of the Longmen Shan and adjacent regions, central China. Int. Geol. Rev. 37 (8), 661–735. doi:10.1080/00206819509465424
Burchfiel, B. C., Royden, L. H., van der Hilst, R. D., Hager, B. H., Chen, Z., King, R. W., et al. (2008). A geological and geophysical context for the Wenchuan earthquake of 12 May 2008, Sichuan, People's Republic of China. Geol. Soc. Am. Today 18 (7), 4–11. doi:10.1130/gsatg18a.1
Chen, Z., Burchfiel, B. C., Liu, Y., King, R. W., Royden, L. H., Tang, W., et al. (2000). Global Positioning System measurements from eastern Tibet and their implications for India/Eurasia intercontinental deformation. J. Geophys. Res. 105 (7), 16215–16227. doi:10.1029/2000jb900092
Chen, Z., Wang, L., Yang, G., Zhang, B., Ying, D., Yuan, B., et al. (2020a). Geological structures and potential petroleum exploration areas in the southwestern Sichuan fold-thrust belt, SW China. Pet. Explor. Dev. 47 (4), 699–713. doi:10.1016/S1876-3804(20)60086-6
Chen, Z., Wang, L., Yang, G., Zhang, B., Ying, D., Yuan, B., et al. (2020b). Geological structures and potential petroleum exploration areas in the southwestern Sichuan fold-thrust belt, SW China. Pet. Explor. Dev. 47 (04), 699–713. doi:10.1016/s1876-3804(20)60086-6
Clark, M. K., Bush, J. W. M., and Royden, L. H. (2005). Dynamic topography produced by lower crustal flow against rheological strength heterogeneities bordering the Tibetan Plateau. Geophys. J. Int. 162 (2), 575–590. doi:10.1111/j.1365-246X.2005.02580.x
Clark, M. K., and Royden, L. H. (2000). Topographic ooze: building the eastern margin of tibet by lower crustal flow. Geology 28 (8), 703–706. doi:10.1130/0091-7613(2000)028<0703:tobtem>2.3.co;2
Cook, K. L., Royden, L. H., Burchfiel, B. C., Lee, Y. H., and Tan, X. (2013). Constraints on Cenozoic tectonics in the southwestern Longmen Shan from low-temperature thermochronology. Lithosphere 5 (4), 393–406. doi:10.1130/l263.1
Cui, J., Jia, D., Yin, H., Chen, Z., Li, Y., Wang, M., et al. (2020). The influence of a weak upper ductile detachment on the longmen Shan fold-and-thrust belt (eastern margin of the Tibetan plateau): insights from sandbox experiments. J. Asian Earth Sci. 198, 104220. doi:10.1016/j.jseaes.2019.104220
Cundall, P. A., and Strack, O. D. L. (1979). A discrete numerical model for granular assemblies. Géotechnique 29 (1), 47–65. doi:10.1680/geot.1979.29.1.47
Dahlstrom, C. D. A. (1969). Balanced cross sections. Can. J. Earth Sci. 6 (4), 743–757. doi:10.1139/e69-069
Davis, D., Suppe, J., and Dahlen, F. A. (1983). Mechanics of fold-and-thrust belts and accretionary wedges. J. Geophys. Res. 88 (2), 1153–1172. doi:10.1029/JB088iB02p01153
Deng, Q., Chen, S., and Zhao, X. (1994). Tectonics, scismisity and dynamics of Longmenshan Mountains and its adjacent regions. Seismol. Geol. 16 (4), 389–403.
Densmore, A. L., Ellis, M. A., Li, Y., Zhou, R., Hancock, G. S., and Richardson, N. (2007). Active tectonics of the Beichuan and Pengguan faults at the eastern margin of the Tibetan Plateau. Tectonics 26 (4), 1–17. doi:10.1029/2006tc001987
Feng, Q. Q., Qiu, N. S., Borjigin, T., Wu, H., Zhang, J. T., Shen, B. J., et al. (2022). Tectonic evolution revealed by thermo-kinematic and its effect on shale gas preservation. Energy 240, 122781. doi:10.1016/j.energy.2021.122781
Gan, W., Zhang, P., Shen, Z.-K., Niu, Z., Wang, M., Wan, Y., et al. (2007). Present-day crustal motion within the Tibetan Plateau inferred from GPS measurements. J. Geophys. Res. 112 (8), B08416. doi:10.1029/2005jb004120
Guo, X., Gao, R., Randy Keller, G., Xu, X., Wang, H., and Li, W. (2013). Imaging the crustal structure beneath the eastern Tibetan Plateau and implications for the uplift of the Longmen Shan range. Earth Planet. Sci. Lett. 379, 72–80. doi:10.1016/j.epsl.2013.08.005
Guo, Z., Deng, K., and Han, Y. (1996). Formation and evolution of the Sichuan Basin. Beijing: Beijng Geological Publishing House.
Hardy, S., and Finch, E. (2005). Discrete-element modelling of detachment folding. Basin Res. 17 (4), 507–520. doi:10.1111/j.1365-2117.2005.00280.x
He, D., Li, D., Zhang, G., Zhao, L., Fan, C., Lu, R., et al. (2011). Formation and evolution of multi-cycle superposed Sichuan Basin, China. Chin. J. Geol. 46 (3), 589–606. doi:10.3969/j.issn.0563-5020.2011.03.001
Hubbard, J., Shaw, J. H., and Klinger, Y. (2010). Structural setting of the 2008 Mw 7.9 Wenchuan, China, earthquake. Bull. Seismol. Soc. Am. 100 (5), 2713–2735. doi:10.1785/0120090341
Hubbard, J., and Shaw, J. H. (2009). Uplift of the longmen Shan and Tibetan plateau, and the 2008 wenchuan (M = 7.9) earthquake. Nature 458 (7235), 194–197. doi:10.1038/nature07837
Jia, D., Li, Y., Lin, A., Wang, M., Chen, W., Wu, X., et al. (2010). Structural model of 2008 Mw 7.9 Wenchuan earthquake in the rejuvenated Longmen Shan thrust belt, China. Tectonophysics 491 (1-4), 174–184. doi:10.1016/j.tecto.2009.08.040
Jia, D., Li, Y., Yan, B., Li, Z., Wang, M., Chen, Z., et al. (2020). The cenozoic thrusting sequence of the longmen Shan fold-and-thrust belt, eastern margin of the Tibetan plateau: insights from low-temperature thermochronology. J. Asian Earth Sci. 198, 104381. doi:10.1016/j.jseaes.2020.104381
Jia, D., Wei, G., Chen, Z., Li, B., Zeng, Q., and Yang, G. (2006). Longmen Shan fold-thrust belt and its relation to the western Sichuan Basin in central China: new insights from hydrocarbon exploration. AAPG Bull. 90 (9), 1425–1447. doi:10.1306/03230605076
Kirby, E., Whipple, K., and Harkins, N. (2008). Topography reveals seismic hazard. Nat. Geosci. 1 (8), 485–487. doi:10.1038/ngeo265
Kirby, E., Whipple, K. X., Tang, W., and Chen, Z. (2003). Distribution of active rock uplift along the eastern margin of the Tibetan plateau: inferences from bedrock channel longitudinal profiles. J. Geophys. Res. 108 (4), 2217. doi:10.1029/2001jb000861
Li, C. (2019). Quantitative analysis and simulation of structural deformation in the fold and thrust belt based on Discrete Element Method. Phd (China: Nanjing University).
Li, C., Yin, H., Jia, D., Zhang, J., Wang, W., and Xu, S. (2018). Validation tests for discrete element codes using single-contact systems. Int. J. Geomech. 18 (6), 06018011. doi:10.1061/(ASCE)GM.1943-5622.0001133
Li, C., Yin, H., Wu, C., Zhang, Y., Zhang, J., Wu, Z., et al. (2021a). Calibration of the discrete element method and modeling of shortening experiments. Front. Earth Sci. 9, 636512. doi:10.3389/feart.2021.636512
Li, C., Yin, H., Wu, Z., Zhou, P., Wang, W., Ren, R., et al. (2021b). Effects of salt thickness on the structural deformation of foreland fold-and-thrust belt in the kuqa depression, tarim basin: insights from discrete element models. Front. Earth Sci. 9, 655173. doi:10.3389/feart.2021.655173
Li, C., Yin, H., Xu, W., Wu, Z., Guan, S., Jia, D., et al. (2022). Quantitative analysis and simulation of compressive tectonics based on discrete element method. Geotecton. Metallog. 46 (04), 645–661. doi:10.16539/j.ddgzyckx.2022.04.001
Li, H., Jia, D., and Chen, W. (2013b). Structural geometry and deformation mechanism of the Longquan anticline in the Longmen Shan fold-and-thrust belt, eastern Tibet. J. Asian Earth Sci. 64, 223–234. doi:10.1016/j.jseaes.2012.12.022
Li, H., Wang, H., Xu, Z., Si, J., Pei, J., Li, T., et al. (2013a). Characteristics of the fault-related rocks, fault zones and the principal slip zone in the wenchuan earthquake fault scientific drilling project hole-1 (WFSD-1). Tectonophysics 584, 23–42. doi:10.1016/j.tecto.2012.08.021
Li, Y., Jia, D., Shaw, J. H., Hubbard, J., Lin, A., Wang, M., et al. (2010). Structural interpretation of the coseismic faults of the wenchuan earthquake: three-dimensional modeling of the longmen Shan fold-and-thrust belt. J. Geophys. Res. 115 (4), B04317. doi:10.1029/2009jb006824
Li, Z., Jia, D., Chen, W., Yin, H., Shen, L., Sun, C., et al. (2014). Late cenozoic east–west crustal shortening in southern longmen Shan, eastern tibet: implications for regional stress field changes. Tectonophysics 623, 169–186. doi:10.1016/j.tecto.2014.03.033
Li, Z. W., Liu, S. G., Chen, H. D., Liu, S., Guo, B., and Tian, X. B. (2008). Structural segmentation and zonation and differential deformation across and along the Lomgmen thrust belt, West Sichuan, China. J. Chengdu Univ. Technol. 35, 440–454. doi:10.3969/j.issn.1671-9727.2008.04.014
Li, Z., Zheng, W., Zhang, P., Almeida, R., Jia, D., Sun, C., et al. (2019). Evidence for three cenozoic phases of upper crustal shortening of the Xiongpo structure in the longmen Shan fold-and-thrust belt, China: implications for the eastward growth of the eastern Tibetan plateau. J. Asian Earth Sci. 179, 138–148. doi:10.1016/j.jseaes.2019.04.017
Liu, Y. D., Tan, X. B., Ye, Y. J., Zhou, C., Lu, R. Q., Murphy, M. A., et al. (2020). Role of erosion in creating thrust recesses in a critical-taper wedge: an example from eastern tibet. Earth Planet. Sci. Lett. 540, 116270. doi:10.1016/j.epsl.2020.116270
Loveless, J. P., and Meade, B. J. (2011). Partitioning of localized and diffuse deformation in the Tibetan Plateau from joint inversions of geologic and geodetic observations. Earth Planet. Sci. Lett. 303 (1-2), 11–24. doi:10.1016/j.epsl.2010.12.014
Lu, R., He, D., Suppe, J., Ma, Y., Liu, B., and Chen, Y. (2012). Along-strike variation of the frontal zone structural geometry of the Central Longmen Shan thrust belt revealed by seismic reflection profiles. Tectonophysics 580, 178–191. doi:10.1016/j.tecto.2012.09.018
Lu, R., He, D., Xu, X., Tan, X., Li, Y., Cai, M., et al. (2018). Geometry and kinematics of buried structures in the piedmont of the central longmen Shan: implication for the growth of the eastern Tibetan plateau. J. Geol. Soc. 176 (2), 323–333. doi:10.1144/jgs2018-015
Massoli, D., Koyi, H. A., and Barchi, M. R. (2006). Structural evolution of a fold and thrust belt generated by multiple decollements: analogue models and natural examples from the Northern apennines (Italy). J. Struct. Geol. 28 (2), 185–199. doi:10.1016/j.jsg.2005.11.002
Morgan, J. K. (2015). Effects of cohesion on the structural and mechanical evolution of fold and thrust belts and contractional wedges: discrete element simulations. J. Geophys. Res. 120 (5), 3870–3896. doi:10.1002/2014jb011455
Pei, S., Li, Y., Zhang, B., Wang, W., and Yang, Y. (2012). Major controlling factors of gas pooling and exploration directions in the Upper Triassic in the western Sichuan Basin. Nat. Gas. Ind. 32 (10), 6–108. doi:10.3787/j.issn.1000-0976.2012.10.002
Place, D., Lombard, F., Mora, P., and Abe, S. (2002). Simulation of the micro-physics of rocks using LSMearth. Pure Appl. Geophys. 159 (9), 1911–1932. doi:10.1007/s00024-002-8715-x
Platt, J. P. (1986). Dynamics of orogenic wedges and the uplift of high-pressure metamorphic rocks. GSA Bull. 97 (9), 1037–1053. doi:10.1130/0016-7606(1986)97<1037:doowat>2.0.co;2
Qu, M., Cheng, X., Tian, H., Chen, H., Yu, H., Chen, C., et al. (2022). Effect of double-detachments strength on structure deformation in the northern Bogda Mountain using discrete element numerical simulation. Earth Sci. 48 (4), 1366–1414. doi:10.3799/dqkx.2022.228
Richardson, N. J., Densmore, A. L., Seward, D., Fowler, A., Wipf, M., Ellis, M. A., et al. (2008). Extraordinary denudation in the Sichuan Basin: insights from low-temperature thermochronology adjacent to the eastern margin of the Tibetan plateau. J. Geophys. Res. 113 (4), B04409. doi:10.1029/2006jb004739
Royden, L. H., Burchfiel, B. C., King, R. W., Wang, E., Chen, Z., Shen, F., et al. (1997). Surface deformation and lower crustal flow in Eastern Tibet. Science 276 (5313), 788–790. doi:10.1126/science.276.5313.788
Royden, L. H., Burchfiel, B. C., and van der Hilst, R. D. (2008). The geological evolution of the Tibetan Plateau. Science 321 (5892), 1054–1058. doi:10.1126/science.1155371
Shen, X., Tian, Y., Zhang, G., Zhang, S., Carter, A., Kohn, B., et al. (2019). Late Miocene hinterland crustal shortening in the Longmen Shan thrust belt, the eastern margin of the Tibetan Plateau. J. Geophys. Res. 124 (11), 11972–11991. doi:10.1029/2019jb018358
Sun, C., Jia, D., Yin, H., Chen, Z., Li, Z., Shen, L., et al. (2016). Sandbox modeling of evolving thrust wedges with different preexisting topographic relief: implications for the longmen Shan thrust belt, eastern tibet. J. Geophys. Res. 121 (6), 4591–4614. doi:10.1002/2016jb013013
Tan, X., Xu, X., Lee, Y., Lu, R., Liu, Y., Xu, C., et al. (2017). Late cenozoic thrusting of major faults along the central segment of longmen Shan, eastern tibet: evidence from low-temperature thermochronology. Tectonophysics 712-713, 145–155. doi:10.1016/j.tecto.2017.05.016
Tapponnier, P., Xu, Z., Roger, F., Meyer, B., Arnaud, N., Wittlinger, G., et al. (2001). Oblique stepwise rise and growth of the Tibet plateau. Science 294, 1671–1677. doi:10.1126/science.105978
Thompson, T. B., Plesch, A., Shaw, J. H., and Meade, B. J. (2015). Rapid slip-deficit rates at the eastern margin of the Tibetan Plateau prior to the 2008<i>M</i><sub><i>w</i></sub>7.9 Wenchuan earthquake. Geophys. Res. Lett. 42 (6), 1677–1684. doi:10.1002/2014gl062833
Tian, Y., Kohn, B. P., Gleadow, A. J. W., and Hu, S. (2013). Constructing the longmen Shan eastern Tibetan plateau margin: insights from low-temperature thermochronology. Tectonics 32 (3), 576–592. doi:10.1002/tect.20043
Wang, E., Kirby, E., Furlong, K. P., van Soest, M., Xu, G., Shi, X., et al. (2012). Two-phase growth of high topography in eastern Tibet during the Cenozoic. Nat. Geosci. 5 (9), 640–645. doi:10.1038/ngeo1538
Wang, M., Feng, W., Jiang, D., Yan, B., Chen, Z., and Song, G. (2020)., 796. China. Interactions between thin- and thick-skinned tectonics at the western Sichuan Basin, China Tectonophysics228628. doi:10.1016/j.tecto.2020.228628
Wang, M., Jia, D., Shaw, J. H., Hubbard, J., Lin, A., Li, Y., et al. (2013). Active fault-related folding beneath an alluvial terrace in the southern longmen Shan range front, Sichuan Basin, China: implications for seismic hazard. Bull. Seismol. Soc. Am. 103 (4), 2369–2385. doi:10.1785/0120120188
Wang, M., Jia, D., Shaw, J. H., Hubbard, J., Plesch, A., Li, Y., et al. (2014). The 2013 lushan earthquake: implications for seismic hazards posed by the Range front blind thrust in the Sichuan Basin, China. Geology 42 (10), 915–918. doi:10.1130/g35809.1
Wang, M., and Lin, A. (2017). Active thrusting of the Longquan Fault in the central Sichuan basin, China, and the seismotectonic behavior in the Longmen Shan fold-and-thrust belt. J. Geophys. Res. 122 (7), 5639–5662. doi:10.1002/2016jb013391
Wang, M., Wang, M., Feng, W., Yan, B., and Jia, D. (2022). Influence of surface processes on strain localization and seismic activity in the longmen Shan fold and thrust belt: insights from discrete-element modeling. Tectonics 41 (11), 7515. doi:10.1029/2022tc007515
Wang, Q., Qiao, X., Lan, Q., Jeffrey, F., Yang, S., Xu, C., et al. (2011). Rupture of deep faults in the 2008 Wenchuan earthquake and uplift of the Longmen Shan. Nat. Geosci. 4 (9), 634–640. doi:10.1038/ngeo1210
Wei, G., Jia, D., Yang, W., Xiao, A., Wang, L., and Wu, L. (2019). Structural characteristics and oil and gas in the Sichuan Basin. Beijing: Science Publishing House.
Wu, H., Qiu, N. S., Feng, Q. Q., Chang, J., Jiang, K., Zhang, Y. L., et al. (2020). Reconstruction of tectonic uplift process with thermo-kinematic method. Chin. J. Geophys. 63 (6), 2329–2344. doi:10.6038/cjg2020N0438
Wu, Z. Y., Yin, H. W., Li, C. S., Yang, X. L., Wang, L., Wang, F. Y., et al. (2021). Influence of regional erosion and sedimentary loading on fault activities in active fold-thrust belts: insights from discrete element simulation and the southern and central longmen Shan fold-thrust belt. Front. Earth Sci. 9, 659682. doi:10.3389/feart.2021.659682
Xin, W., Chen, H., An, K., Zhang, Y., Yang, S., Xiaogan, C., et al. (2020). Analyzing the influence of factors that control the structural deformation of fold-thrust belts in the southwestern Tianshan using discrete element simulations. Acta Geol. Sin. 94 (6), 1704–1715. doi:10.19762/j.cnki.dizhixuebao.2020078
Xu, W. Q., Yin, H. W., Jia, D., Li, C. S., Wang, W., Yang, G. X., et al. (2021). Structural features and evolution of the Northwestern Sichuan Basin: insights from discrete Numerical simulations. Front. Earth Sci. 9, 13. doi:10.3389/feart.2021.653395
Xue, Z., Martelet, G., Lin, W., Faure, M., Chen, Y., Wei, W., et al. (2017). Mesozoic crustal thickening of the longmenshan belt (NE tibet, China) by imbrication of basement slices: insights from structural analysis, petrofabric and magnetic fabric studies, and gravity modeling. Tectonics 36 (12), 3110–3134. doi:10.1002/2017tc004754
Yan, D., Qiu, L., Wells, M. L., Zhou, M., Meng, X., Lu, S., et al. (2018a). Structural and geochronological constraints on the early mesozoic North longmen Shan thrust belt: foreland fold-thrust propagation of the SW qinling orogenic belt, northeastern Tibetan plateau. Tectonics 37 (12), 4595–4624. doi:10.1029/2018tc004986
Yan, D., Zhou, M., Li, S., and Wei, G. (2011). Structural and geochronological constraints on the Mesozoic-Cenozoic tectonic evolution of the Longmen Shan thrust belt, eastern Tibetan Plateau. Tectonics 30 (6), 1–24. doi:10.1029/2011tc002867
Yan, D., Zhou, Y., Qiu, L., Wells, M. L., Mu, H., and Xu, C. (2018b). The longmenshan tectonic complex and adjacent tectonic units in the eastern margin of the Tibetan plateau: a review. J. Asian Earth Sci. 164, 33–57. doi:10.1016/j.jseaes.2018.06.017
Yang, Y., Duan, Y., He, L., Li, Y., and Li, X. (2009). New ideas of gas exploration in western Sichuan basin. Nat. Gas. Ind. 29 (06), 4–134. doi:10.3787/j.issn.1000-0976.2009.06.002
Zhang, C., Cao, X. N., Qu, K. X., Xiu, J. G., and Yao, Z. X. (1990). Earthquake focal mechanism of China. Beijing, China: Academic Books Press.
Zhang, P., Shen, Z., Wang, M., Gan, W., Bürgmann, R., Molnar, P., et al. (2004). Continuous deformation of the Tibetan Plateau from global positioning system data. Geology 32 (9), 809–812. doi:10.1130/g20554.1
Zhang, Z., Zhang, H., Wang, L., Cheng, H., and Shi, Y. (2019). Late cenozoic structural deformation and evolution of the central-southern longmen Shan fold-and-thrust belt, China: insights from numerical simulations. J. Asian Earth Sci. 176, 88–104. doi:10.1016/j.jseaes.2019.01.026
Keywords: the southwestern Sichuan fold-thrust belt, discrete-element numerical modeling, duplex detachments, mechanical strengths of detachment, kinematic evolution
Citation: Wang Y, Wang L, Ren R, Wei G, Chen Z, Su N and Zhang Y (2023) The influence of basal detachment strength on formation of the southwestern Sichuan fold-thrust belt: insights from discrete-element numerical simulations. Front. Earth Sci. 11:1251417. doi: 10.3389/feart.2023.1251417
Received: 01 July 2023; Accepted: 21 August 2023;
Published: 01 September 2023.
Edited by:
Yuntao Tian, Sun Yat-sen University, ChinaReviewed by:
Chuang Sun, Sun Yat-sen University Zhuhai Campus, ChinaCopyright © 2023 Wang, Wang, Ren, Wei, Chen, Su and Zhang. This is an open-access article distributed under the terms of the Creative Commons Attribution License (CC BY). The use, distribution or reproduction in other forums is permitted, provided the original author(s) and the copyright owner(s) are credited and that the original publication in this journal is cited, in accordance with accepted academic practice. No use, distribution or reproduction is permitted which does not comply with these terms.
*Correspondence: Lining Wang, d2FuZ2xpbmluZ0BwZXRyb2NoaW5hLmNvbS5jbg==
Disclaimer: All claims expressed in this article are solely those of the authors and do not necessarily represent those of their affiliated organizations, or those of the publisher, the editors and the reviewers. Any product that may be evaluated in this article or claim that may be made by its manufacturer is not guaranteed or endorsed by the publisher.
Research integrity at Frontiers
Learn more about the work of our research integrity team to safeguard the quality of each article we publish.