
95% of researchers rate our articles as excellent or good
Learn more about the work of our research integrity team to safeguard the quality of each article we publish.
Find out more
ORIGINAL RESEARCH article
Front. Earth Sci. , 08 January 2024
Sec. Biogeoscience
Volume 11 - 2023 | https://doi.org/10.3389/feart.2023.1250889
 Ryan Pereira1*†
 Virginia N. Panizzo2*†
 Juliane Bischoff1
 Suzanne McGowan3
 Jack Lacey4Heather Moorhouse5
 Noor Suhailis Zelani6,7Muhammad Shafiq Ruslan7,8Shazrul Fazry7,8
Inland waters are highways of carbon and nutrient flows between the land and ocean. Aquatic environments integrate multiple sources and processes over space and time that influence ecosystem functionality. The complexity of these systems and their multiple interactions with the surrounding environment are conceptualised, but often lack empirical scrutiny that allows further understanding of how inland waters mobilise, transport, and utilise carbon and nutrients. This is particularly evident in tropical waters. Here, we apply advanced geochemical analyses of dissolved organic matter (DOM) composition in conjunction with algal pigment biomarkers, to determine the seasonal variability of organic matter production, processing and export for a tropical, floodpulse wetland, Tasik Chini (Malaysia). We identify two phases in the hydrological cycle: Phase 1 signifying a transition from the wet season with high suspended sediment and dissolved organic carbon concentrations. DOM is composed of humic substances, building blocks and lower molecular weight compounds. Towards the end this phase then are periods of increased water clarity and algal productivity. This is followed by Phase 2, which has a greater contribution of autochthonous DOM, composed of proteinaceous material, concomitant with lower dissolved nutrient concentrations, increased mixotrophic algae and emergent vegetation. Based on this framework, we highlight the role of such tropical wetland lakes as hydrological “bottlenecks,” through a lentic/lotic switch that shifts aquatic transport of carbon and nutrients from lateral river continuum supply to flood pulses. We highlight the need to consider inherent biases of spatial and temporal scaling when examining freshwater ecosystems along the land-ocean aquatic continuum.
The flux of carbon (C) along the land ocean continuum is estimated to range from 1.9 to 5.1 Pg C year−1 (Cole et al., 2007; Drake et al., 2018). However, incorporating inland waters in global carbon budgets is a major challenge due to the diversity of hydrological, biological, and chemical processes that govern the supply and fate of organic matter (OM) along the land-ocean aquatic continuum (Battin et al., 2009; Solomon et al., 2015). Dissolved organic matter (DOM) is an important but poorly constrained component of the carbon cycle (Drake et al., 2018) with lowland tropical rivers systems considered globally significant sources to the ocean (Huang et al., 2012). To better constrain and predict carbon fluxes of inland waters it is necessary to identify the connections between OM sources, their subsequent ecological transformations and how these cascade downstream (McClain et al., 2003; Cole et al., 2007). Once these pathways are identified, as either representing a period of active transformation of DOM or a passive transport of it, the role of seasonality on catchment hydrological connectivity can be explored. This is particularly important in tropical wetland lakes which seasonally transition between lentic (lacustrine) and more lotic (riverine) environments during dry and wet seasons, respectively.
Existing conceptual models encapsulate the role of hydrological (dis)connectivity (see Bracken et al., 2013 for a review and references therein) and how the constant interchange of OM and nutrient sources driven by hydrology, at either seasonal or event timescales, impacts the productivity within inland waters (Vannote et al., 1980a; Junk et al., 1989; Thorp et al., 2006; Raymond et al., 2016). The Riverine Productivity Model (RPM) holistically captures autochthonous production and direct organic inputs from the riparian zone (which could also describe other areas of the river network such as lakes, and wetlands), representing the “principal” source of carbon driving food webs of large river systems (Thorp and Delong, 1994; 2002; Thorp et al., 2006). In contrast, the River Continuum Concept (RCC) emphasizes the role of longitudinal transport of water, carbon, and nutrients in altering physical and biological conditions downstream, along river channels and their floodplains (Vannote et al., 1980a). Emphasis is given to the transformation of relative proportions of autochthonous and allochthonous inputs, which also reduces the diversity of carbon compounds downstream with increasing river size (Vannote et al., 1980a). The RCC assumes that downstream communities are dependent on OM and residual nutrient concentrations, derived from that produced, or not utilised, by upstream abiotic and biotic processes (Vannote et al., 1980a). While the RCC acknowledges lateral inputs it argues that these inputs decrease as the watershed area increases. This neglects the more complex interactions of the surrounding landscape and that of hydrological features such as lakes and wetlands which can act as hydrological “bottlenecks” restricting flow, increasing hydraulic residence times, evaporation, and favours lentic processing of OM and perturb changes in OM source (Peter, et al., 2020). This distinction was later explored by Ward and Stanford (1995), Stanford and Ward, (2001) when considering the lateral (river and its floodplain) connectivity of a river’s catchment via the Serial Discontinuity Concept (SDC). Here the authors explore the role of “ecological connectivity” with flooding activities delivering OM to the floodplain regions, within this lateral dimension, thereby building on the work of the RCC (e.g., longitudinal OM transport).
The role these interactions play across landscapes is pertinent in tropical inland waters as they feature an abundance of flowing headwater rivers, wetlands, and lakes. The Flood Pulse Concept (FPC) emphasizes the importance of tropical river-floodplain connections in systems influenced by regular rainfall such as tropical monsoons (Junk et al., 1989). The flood pulses directly connect inland waters to their local surrounding landscape, delivering fresher OM and nutrients and sustaining seasonal ecological cycles (Junk and Piedade, 1997; Junk and Wantzen, 2004; Suhaimi-Othman et al., 2007; Hernes et al., 2008; Barzani Gasim et al., 2009; Bonnet et al., 2017). Superimposed on this cycle of long-term hydrological periods, the Pulse Shunt Concept (PSC; Raymond et al., 2016) highlights the role of short bursts of hydrological activity, such as rain events, that mobilise terrestrially derived OM and nutrients in a pulse to the river network, with increased hydrological velocities that impede abiotic and biotic process, thereby leading to a greater export of OM and nutrients that is biochemically labile (Raymond et al., 2016).
DOM, operationally defined as OM that passes a filter (typically 0.2, 0.45 or 0.7 μM), is comprised of numerous freshly produced compounds and degradation by-products with its individual molecular properties (Kellerman et al., 2014; Kellerman et al., 2015) influencing aquatic ecosystem function (Solomon et al., 2015). Studies on aquatic biomass and communities in tropical, seasonal flood pulse wetlands, provide a valuable tool to explore changes in DOM transport, its processing, and burial as a function of ecosystem productivity (linked to the large transformations in limnological characteristics). However, these key components and their interactions have, to date, been undervalued in the conceptual models of basin-scale connectivity with the relative importance of these building blocks of aquatic food web structure and the interchange between lentic and lotic environments in tropical environments which is often extreme and dynamic, poorly constrained with only limited data available (Bracken et al., 2013; Lambert et al., 2016). We aim to address this knowledge gap with a detailed seasonal investigation of aquatic DOM composition and primary productivity from a tropical, seasonally flooded wetland environment. We combine advanced geochemical analyses of DOM composition with algal pigment biomarkers, used in tandem for the first time, to resolve diagnostic DOM changes and determine seasonal and monsoonal related in-lake processes. This allows the assessment of the changes in seasonal hydrology in the provision of allochthonous (pedogenic) versus autochthonous (aquagenic) derived DOM, as well as the autochthonous processing of allochthonous sources of DOM, in response to phytoplankton and macrophyte vegetation succession.
Tasik (lake) Chini is the second largest freshwater lake system in Peninsula Malaysia formed of 12 interconnected basins (Figure 1). An inland, shallow, wetland lake (c. 50 km2) it acts a culturally and environmentally important ecosystem for local Orang Asli populations (Suhaimi-Othman et al., 2007). The lake area varies from 150 to 350 ha, depending on seasonal variability (Chong, 2001) and the volume is estimated between 4 × 10⁶ and 7 × 10⁶ m3 (Tan and Barzani Gasim, 2005) with other authors modelling dry season volumes to decrease by 606,000 m3 (Barzani Gasim et al., 2009). Average lake depth is 1.5 m, ranging seasonally between 0.5 and 2.2 m (Barzani Gasim et al., 2008). Due to the lake’s location, it has a tropical humid climate with annual temperature ranges between 21°C and 32°C and total annual rainfall averaging 2,700 mm (Harris et al., 2014; Figure 2A), with the north-western (NW) monsoon season taking place annually between October/November to February (Figure 2A; Supplementary Figure S1).
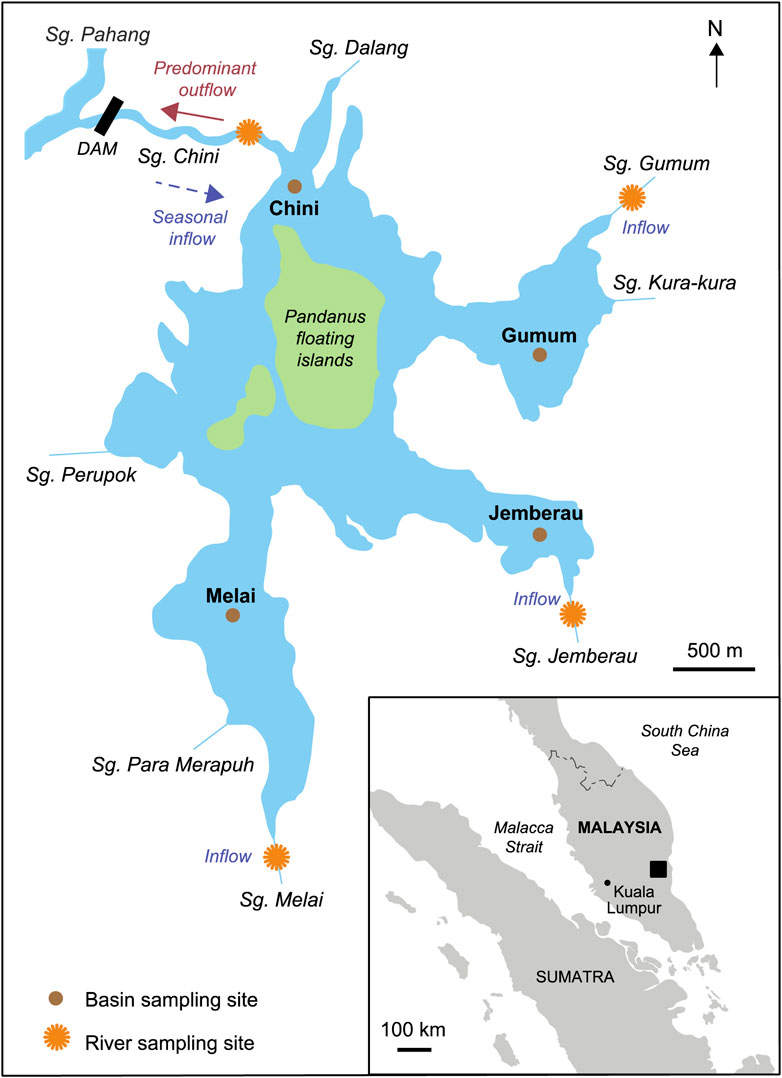
FIGURE 1. Map of the Tasik Chini catchment and interconnected lake basins, Peninsular Malaysia showing sampling locations of basin (brown circles) and rivers (orange circles). Insert image displays the site’s location in Peninsular Malaysia. GPS co-ordinates for the sites are provided in Supplementary Tables S1, S3.
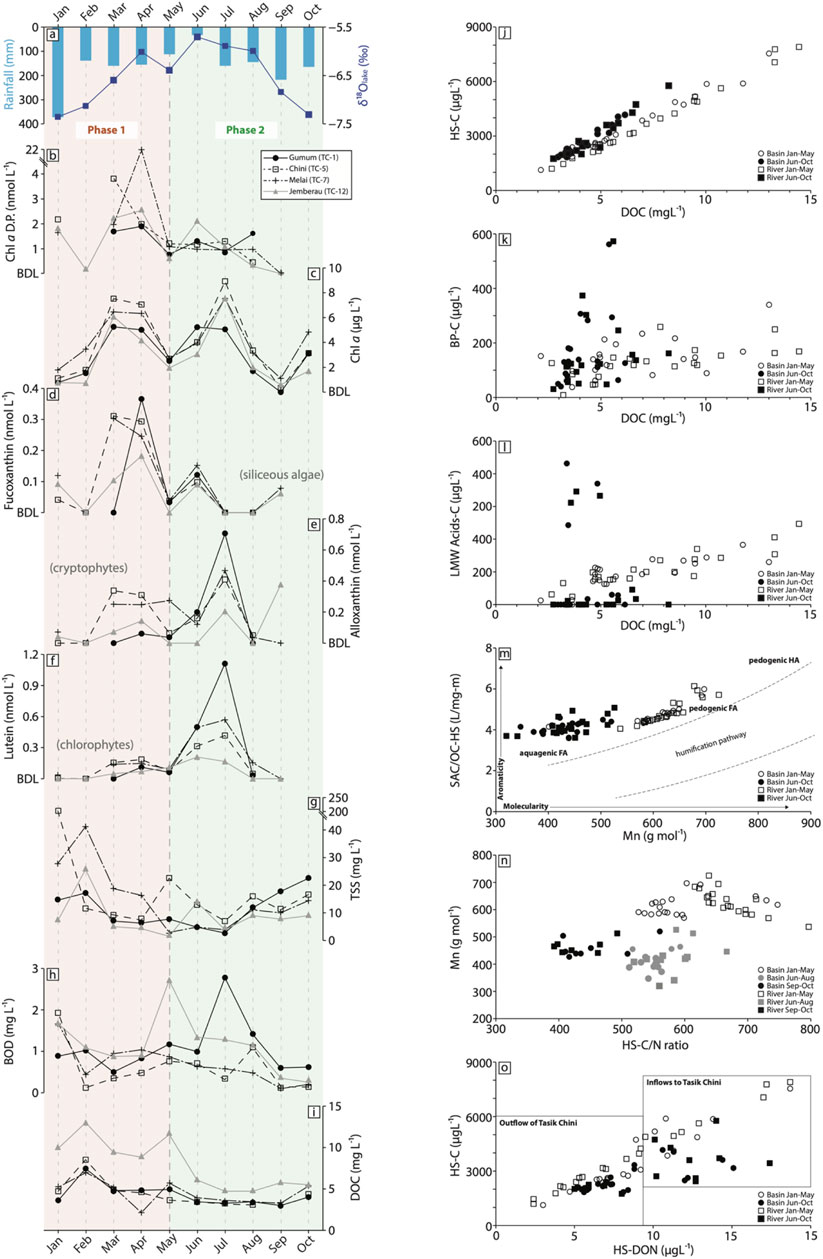
FIGURE 2. (A). Total monthly precipitation (bar; CRU timeseries) and the mean monthly δ18O of lake waters (line and squares); (B) Chl a D.P., acting as the ratio of lake water Chl a to its degradation products including the allomer and epimer, chlorophyllide a, pheophytin a and pheophorbide a (D.P); (C) lake water Chl a concentrations; (D–F) dominant algal carotenoids in lake waters; (G–I) lake water TSS, BOD and DOC; (J–L) river and lake water concentrations of humic substances (HS), biopolymers (BP), and LMW acids vs. total DOC; (M) humification pathway scatter plot of molecularity (Mn) vs HS UV254 (SUVA-HS); (N) HS carbon to nitrogen ratio (C/N) vs Mn HS; (O) HS dissolved organic nitrogen (DON) vs HS carbon. DOM data bi-plots are categorised by the two dominant phases in our conceptual model (January to May: Phase 1 and June to October: Phase 2).
Field measurements of lake and river hydrology and local climatology are not available. Estimations of the flow of dominant rivers to the lake have been modelled by Barzani Gasim et al. (2009); Barzani Gasim et al. (2008) who identify that feeder stream flow to the lake is low, at an average of 0.1674 m3/s, with the Melai river having one of the lowest flow rates to the lake (<0.0042 m3/s on average) (Barzani Gasim et al., 2009). Highest flows take place during the monsoon season with earlier measurements (2004–2005) showing discharges of 0.22 m3/s and 0.53 m3/s in October and December respectively, while values decrease to 0.07 m3/s and 0.02 m3/s in March and April respectively (Barzani Gasim et al., 2008). The wetland is therefore reliant on rainfall events to feed the lake both via direct means (stream inflows and reverse flow of the Pahang) or indirect as run-off.
The monsoon period drives the delivery of OM and nutrients to Tasik Chini, fuelling annual cycles of phytoplankton and macrophyte development, as seen in other tropical wetland systems (Loverde-Oliveira and Huszar, 2007). Rasau swamps (Pandanus helicopus) create floating islands across Tasik Chini (Figure 1) and Lepironia articulata reed beds are present at the water margin (Rafidah et al., 2010), both of which are iconic, year round, features supporting its designation as a UNESCO Biosphere reserve in 2009 (Furtado and Mori, 1982; Ikusima and Furtado, 1982). These environments also act as a natural water retention system (Sharip and Jusoh, 2010). Open water vegetation includes the native water lotus (Nelumbo nucifera) and the non-native macrophyte Cabomba furcata (Chew and Siti-Munirah, 2009; Sharip et al., 2012). Notably, the flowering period for N. nucifera begins during the dry season (May to September) and plant die back takes place at the start of the next monsoon period (October to January; Rafidah, et al., 2010).
All fieldwork was conducted in collaboration with the Tasik Chini Research Centre (TCRC), Universiti Kebangsaan Malaysia (UKM). In 2017 lake water was monitored and samples collected monthly between January to November 2017 from four basins in Tasik Chini (C1-basin Gumum, C5-basin Chini, C7-basin Melai, and C12-basin Jemberau), from three surrounding rivers that discharge directly to the lake (Sg. Gumum, Melai, and Jemberau) and Sg. Chini, the main outflow of Tasik Chini (Figure 1). GPS co-ordinates for the sites are provided in Supplementary Tables S1, S3.
Lake samples were obtained from surface waters using a Van Dorn water sampler. River samples (reported for carbon data only) were collected from the surface only (0.1–0.3 m). From January to May, samples were collected far enough down or upstream to ensure adequate mixing and discretisation from apparent lake waters. However, during the dry season of June to October the Gumum, and Jemberau rivers entering Tasik Chini became lentic and appeared more stagnant at the surface, also becoming very low in their water level. Waters were collected in acid-washed HDPE bottles, pre-rinsed with sample water and stored cool (4°C) and in the dark until processing at the Tasik Chini Research Centre (TCRC).
Biological oxygen demand (BOD) was analysed in the TCRC laboratory using a YSI 5000 and Total Suspended Sediment (TSS) concentrations were derived by re-weighing the dried (at 105°C) pre-weighed GF/F filter papers after sample collection. All data are presented in Supplementary Table S1. Based on the monitoring routine of the TCRC, discharge data for the respective inflows and outflows is not collected.
The lake basin, river inflow, and outflow water samples were analysed for their oxygen (δ18O) and hydrogen (δ2H) isotope composition at the British Geological Survey, UK. δ18O was measured using the CO2 equilibration method with an Isoprime 100 mass spectrometer coupled to an Aquaprep device. Two laboratory standards (CA-HI and CA-LO) were analysed in each run, verified against the international calibration and reference materials (VSMOW2, SLAP2 and GISP). Errors for the within-run standards are typically ±0.05‰. δ2H was measured using a continuous flow EA-IRMS (EuropyrOH-Isoprime) with liquid autosampler. In each run, two laboratory standards (CA-HI and CA-LO) were analysed several times and compared with the international calibration and reference materials (VSMOW2, SLAP2 and GISP). D/H ratios were calculated to the VSMOW2 scale and errors for the within-run standards are typically ±1.0‰. Although water isotopes in local precipitation were not measured in this study, interpolated regional data were utilised from the Online Isotopes in Precipitation Calculator (OIPC; Bowen et al., 2005) for comparison with surface waters.
In the absence of climatic field measurements, total monthly rainfall and mean monthly temperatures were extracted from the Climatic Research Unit gridded Time Series (v 4.02; Harris et al., 2020). The dataset is derived by the interpolation of monthly climate anomalies from extensive networks of weather station observations. Grid Cell 3.25 N, 102.75 E was selected as the most geographically representative location with only minor differences in rainfall and temperature observed in surrounding grid cells.
Total phosphorus (TP) analyses were performed on unfiltered lake water samples following persulphate digestion and the molybdate blue method was then used to quantify TP and soluble reactive phosphorus (SRP) concentrations (Mackereth et al., 1978). Dissolved inorganic nitrogen (DIN[nitrate]) concentrations were determined from GF/F filtered water samples, using a Metrohm Basic 792 ion chromatography system (Metrosep A Supp 4-250 column, with 1 mmol sodium bicarbonate and 3.2 mmol of sodium carbonate eluent at 1.0 mL min−1). These analyses were measured at the University of Nottingham, United Kingdom.
Chlorophyll a (Chl a) and algal pigment samples were filtered through pre-combusted (450°C overnight) Whatman GF/F filter papers. Between 200–450 mL of lake and river waters were sampled, until a strong pigment colour was seen on filter papers. Samples were stored in the dark at −20°C at the TCRC, until sent to the United Kingdom (University of Nottingham) for analysis.
Chl a was measured spectrophotometrically against an extraction solvent blank, after extracting Whatman GF/F filters in acetone overnight (Jeffrey and Humphrey, 1975). Algal pigments were extracted in an acetone, methanol, and water mixture overnight before syringe filtering via a 0.22 μm PTFE. Samples were then dried under nitrogen gas before re-dissolving for injection into the high-performance liquid chromatography (HPLC) unit (Agilent 1200 series). The modified method of Chen et al. (2001) was used to separate carotenoid, chlorophylls and other derivatives, with separation methods adopted by McGowan et al. (2012). Pigments were identified and quantified from the chromatograms by comparing retention times and spectral characteristics with calibration standards (DHI Denmark). For river samples, concentrations were typically below detection limit (BDL).
Water samples for DOM analysis were filtered through 0.45 µm Polyethersulfone (PES) syringe filters at the TCRC and stored frozen at (−20°C) in acid washed HDPE bottles until analysis following recommended procedures (Heinz and Zak, 2018). Dissolved Organic Carbon (DOC) concentration and DOM composition was measured using LC-OCD-OND-UVD (Liquid chromatography with organic carbon detection, organic nitrogen detection, and UV absorbance detection), (Huber et al., 2011). LC-OCD-OND-UVD allows ∼1 mL of whole water to be injected onto a size exclusion column (SEC; 2 mL min−1; HW50S, Tosoh, Japan) with a phosphate buffer (potassium dihydrogen phosphate 1.2 g L−1 plus 2 g L−1 di-sodium hydrogen phosphate ×2 H2O, pH 6.58) and separated into five “compound-group specific” DOM fractions. The resulting fractions are identified using online detectors for organic carbon (DOC), UV-amenable carbon at 254 nm (UV254) and dissolved organic nitrogen (DON). These compound classes include i) biopolymers (likely hydrophobic, high molecular weight >> 20.000 g mol−1, largely non-UV absorbing extracellular polymers, that may include polysaccharides and proteins); ii) “humic substances” (higher molecular weight ∼1,000 g mol−1, UV absorbing; usually relating to aromatic structures); iii) “building blocks” (lower molecular weight 300–500 g mol−1, UV absorbing intermediate of humic substances or diprotic acids); iv) low molecular weight (LMW) “neutrals” (350 g mol−1, hydro- or amphi-philic, non-UV absorbing, and largely non-ionic compounds that may include alcohols, aldehydes, ketones and amino acids); and v) LMW acids (350 g mol−1) that are likely monoprotic acids due to interaction with the mobile phase (Huber et al., 2011). Aromaticity of humic substances (HS-SUVA) is calculated as the UV254 normalised to the carbon concentration of the humic substances compound group (Huber et al., 2011). All samples were analysed using the Model 9 of the LC-OCD-OND-UVD at the Lyell Centre, Heriot-Watt University. All peaks were identified and quantified with bespoke software (Labview, 2013) normalized to International Humic Substances Society humic and fulvic acid standards, potassium hydrogenphthalate and potassium nitrate. Routine analysis of carbon-free 18.2 Ω Ohm deionised water was utilised as an analytical blank.
To estimate the effect of evaporation on our parameter concentrations over time, a linear regression model was applied to the monthly mean oxygen isotope data using the minimum and maximum values observed from all lake waters during our sampling period (Figure 2A). This model was utilised due to the absence of monthly river and lake discharge data. The model assumes that the oxygen isotopes are representative of their surrounding waters and that evaporation is the primary factor to derive a Basin Evaporation factor (BEF), where the BEF = (−0.6048 × δ18O)−3.4493 (Supplementary Figure S1). While this approach is limited and conservative, it permits an assessment of whether concentrations of key diagnostic markers are increasing due to lake evaporation or as a result of productivity and/or riverine supply alterations. In general, this approach suggests that while concentration-based parameters increase due to the evaporation of lake waters, the signal continues to be elevated against a seasonal baseline (when normalised using our BEF). This allows the temporal trends of riverine supply and biological activity be interpreted as real changes rather than an artefact of concentration. Consequently, herein we report actual concentrations measured.
The total monthly rainfall in 2017 CRU records show the primary wet season occurred from November to January, during the NW monsoon with peak rainfall >200 mm per month (Figure 2A). This is consistent with the longer-term CRU rainfall record from 2000 to 2017. OIPC δ18Oprecip signatures ranged between −7.16‰ and −7.36‰. From February to September the climate is generally drier (<200 mm per month) and δ18Oprecip signatures increase from −7.13‰ in February with highest concentrations observed in June 2017 (−5.70‰) (Figure 2A). Measured lake water δ18Olake signatures similarly reflect this move to a period of evaporative enrichment between March and August, with lake waters falling along the Local Evaporation Line (Supplementary Figure S1). While between September and February, lake signatures plot along the Global Meteoric Water Line (GMWL) (Dansgaard, 1964), indicative of the monsoonal period.
Lake concentrations of inorganic nutrients (DIN, SRP, TP) were greatest during the monsoon period (January) reaching values as high as c. 2670, 7.50 and 158 μg L−1 respectively, after which values declined to below c. 600, 5.90 and 30.90 μg L−1 (Supplementary Table S1). In general, lake concentrations of TSS and DOC were high during the monsoon period (from January 2017). For basins Chini and Melai, TSS values were the greatest during this monsoonal period of January to February, with values ranging between 11.60 and 204.60 mg L−1 (Figure 2G). TSS and DOC concentrations declined from February 2017 to values below c. 9.5 mg L−1 and c. 5.2 mg L−1 respectively across all four basins (Figure 2I) coincident with the initiation of the dry season at Tasik Chini. A short period of increased DOC concentrations was observed in May for basins Melai (to 5.71 mg L−1) and Jemberau (to 11.77 mg L−1) and a gradual increase in both TSS (to values above 9.20 mg L−1 for all basins: Supplementary Table S1) and DOC (>4 mg L−1 for all sites: Supplementary Table S2) observed from October. A small, secondary peak is evident in BOD between the months May and June, before values show a general decreasing trend (Supplementary Table S1).
The DOC of feeder streams discharging into Lake Chini ranged from 3.2 to 14.4 mg L−1 (Figure 2I) in 2017 with the River Jemberau consistently supplying the highest DOC concentration waters. The River Chini, the main outflow of Lake Chini, had DOC values ranging from 2.6 to 10.7 mg L−1 with peak concentrations in February. The temporal pattern of DOC concentrations discharged into Tasik Chini by the Jemberau, Gumum and Melai rivers varied. The DOC concentrations of Jemberau and Gumum rivers were highest in February and generally declined throughout 2017, whereas the Melai River had peak DOC concentrations in April to May 2017. With the exception of February 2017, riverine DOC concentrations entering the lake were greater than the outflow from the River Chini (Supplementary Tables S2, S3; Figure 4).
Chl a concentrations show a clear double peak over the sampling period, with initial increases indicative of the start of the dry season in Tasik Chini after February (Figure 2C). Concentrations at all lake sites increase from March (5.3–7.5 μg L−1) to May, in June to July (5.1 and 8.9 μg L−1), and in October (1.7–4.8 μg L−1) (Supplementary Table S1). Concentrations are the lowest in September (0–1.1 μg L−1). Algal carotenoids showed a similar bimodal peak in concentrations coincident with the end of the NW monsoon (wet) season (Figures 2D–F). General trends demonstrate an increase in concentrations from February, representing the first bloom period (February/March to May), with siliceous algae dominating (Figure 3), ranging from below detection to 0.34 nmol L−1 for all basins. The secondary algal peak is dominated by a composition of potentially mixotrophic taxa such as cryptophytes (alloxanthin), chlorophytes (lutein) and some siliceous algae (fucoxanthin).
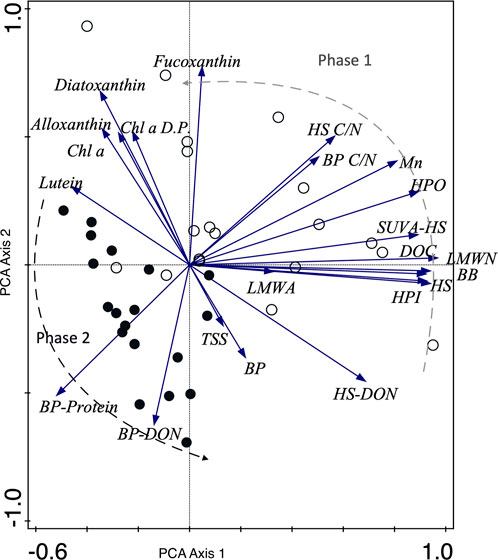
FIGURE 3. PCA of lake basin carbon and pigment analysis data, including TSS. The samples are characterized by the phase of representation as per the conceptual model, with empty circles signifying Phase 1 and filled circles Phase 2. The temporal variation captured by the sample and vector distribution, is highlighted by the dashed lines as a transition between these two phases. Axis 1 and 2 account for 36.51% and 20.37% of the variability in the dataset, respectively. Note that abbreviations not already introduced include Chl a D.P. as Chl a degradation products, HPO as Hydrophobic and HPI as Hydrophilic.
The DOM compound groups display significant relationships with DOC concentration (R2 0.5 to 0.9, p > 0.001, n = 39; Figures 2J–L). Humic substances, building blocks and LMW neutral compound groups follow a similar temporal trend to the overall DOC concentration in lake and river waters, accounting for 45%–71%, 12%–24% and 9%–17% of the total DOM pool, respectively (Supplementary Tables S2, S3). Humic substances, biopolymers, and LMW acids display similar temporal trends as the total DOM pool from January to May. However, there was a distinctive compositional change in the relationship with total DOC in lake and river waters from June to October 2017 as compared to waters in January to May (Figures 2J, K; Figures 3, 4). The biopolymers group contained a greater proportion of DON and proteinaceous material (Supplementary Tables S2, S3; 4–494 ug L−1 and 37%–100%, respectively) from June to November relative to January to May 2017 (0–75 ug L−1 and 14%–66%, respectively). The DON content of humic substances was generally low throughout the year (ranging from 24 to 187 ug L−1). However, the aromaticity (inferred from HS-SUVA) and apparent molecular weight of humic substances display two populations in the Humification Pathway, which attributes the source of humic substances to either aquagenic (autochthonous) or pedogenic (allochthonous) origin (Huber et al., 2011). We observe generally higher molecularity and aromaticity from January to May 2017 indicating allochthonous derived humic substances as compared to autochthonous sources in all waters from June to November 2017 (Figures 2M, N; Figures 3, 4).
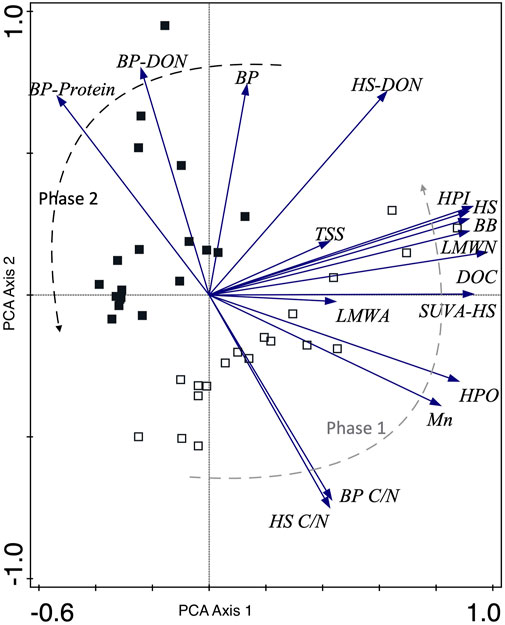
FIGURE 4. PCA of river carbon data. The samples are characterized by the phase of representation, as per the conceptual model, with empty squares signifying Phase 1 and filled squares Phase 2. Axis 1 and 2 account for 46.42% and 31.78% of the variability in the dataset, respectively. Note that abbreviations include HPO as Hydrophobic and HPI as Hydrophilic.
Based on the strong seasonal cycle in monsoonal rain and OM delivery to Tasik Chini (Figures 2, 3), we identify two distinct hydrological phases which we will use to categorise the main drivers of change in our data. These are Phase 1, transitioning from the wet to the dry season (January to May) and Phase 2, the dry season transitioning to the next wet season [June to November (January)]. Seasonality has the largest impact on DOM composition and likely its fate, through the evolution of wet and dry season dynamics, that is associated with two distinctive key phases of ecological functioning at Tasik Chini. However, we also anticipate that there are likely to be low frequency, high intensity rain events (hours to days) that are not captured in our results due to the monthly sampling regime. During these events there may be new flow paths that shunt OM further and faster downstream reducing the residence time for transformation (e.g., Thorp et al., 2006; Raymond et al., 2016).
The monsoonal period plays a crucial role for delivering OM and nutrients to Tasik Chini, that support subsequent autochthonous primary production. Macrophyte and emergent vegetation growth increases following the peak wet season (November to February) with the main vegetation growing season (notably Lepironia and N. nucifera) occurring over the dry season (May to September) until plant die back at the start of the next monsoon period, i.e., Phase 2 (Rafidah et al., 2010).
Phase 1 therefore marks the response of the aquatic ecosystem to the preceding rainy season (November to January). At this time, we see the delivery of predominantly pedogenic and terrestrially derived OM and nutrients, which is indicative of flood pulses (consistent with the SDC and FPC; Figure 5). In the lake we observed higher suspended solids (TSS), carbon (DOC), and nutrients in bioavailable (SRP, DIN) and particulate (TP) forms (Supplementary Table S1). The significant relationships between the DOM compound groups and DOC concentrations suggest that DOM is transported collectively without biotic and/or abiotic processes preferentially transforming one compound group over another, based on potential reactivities of their respective composition. It is also likely that shorter hydraulic residence times of the catchment, associated with the monsoon during the start of this phase, reduces the time available for DOM transformation or utilisation: indicative of the allochthonous supply of “fresh” OM to the aquatic zone during the FPC (Vannote et al., 1980b; Junk and Piedade, 1997; Junk and Wantzen, 2004) (Figure 2). Phase 1 can be characterised via PCA bi-plots (Figures 3, 4) where lake and river samples are distinctly grouped with the highest concentrations of DOC, humic substances, and more complex structured DOM (molecularity).
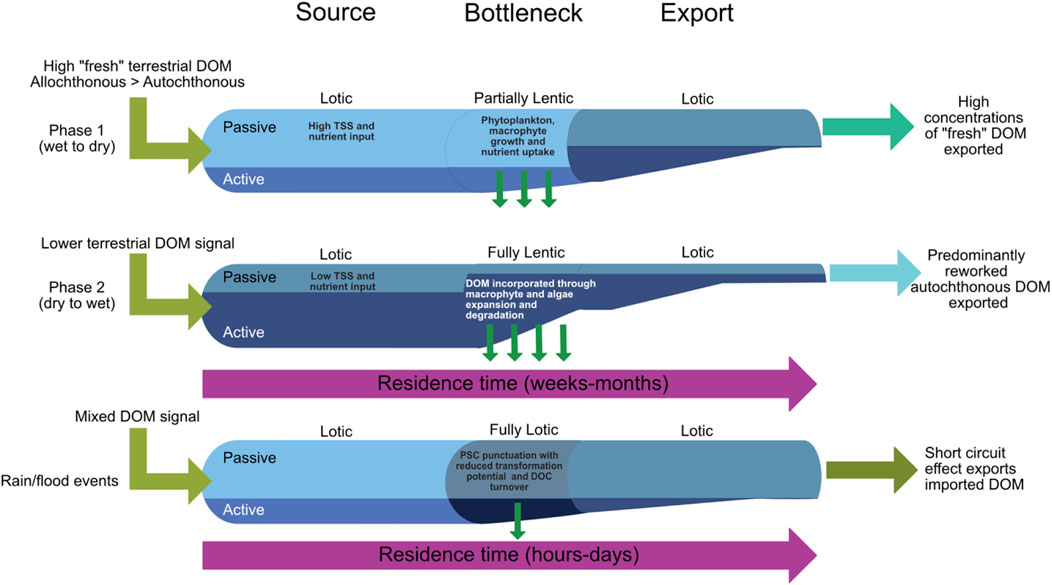
FIGURE 5. A schematic diagram displaying the seasonal hydrological (upstream and downstream) and ecological connectivity of Tasik Chini and its catchment. This schematic draws on existing DOM functioning models (FPC, RCC and PSC) to demonstrate their respective contributions to ecosystem functioning over time and provides a combined conceptual model for tropical, flood pulse wetlands. Green arrows signify the nature of the DOM (autochthonous versus allochthonous) source to the lake system in response to the key hydrological phase (e.g. Phase 1 or 2). The degree of DOM transformation (e.g. passive versus active) is also highlighted which will vary depending on lake residence time and hydrological connectivity within the catchment (e.g. dry season versus rain events). Based on these factors, the schematic highlights the degree of DOM export (size of passive pathway) to downstream reaches, as well as its dominant characteristics (e.g. allochthonous versus autochthonous).
The ecological implications of this wet to dry season transition phase, following the cessation of the monsoon period after February, are evidenced by high allochthonous DOM supply followed by increased lake water clarity (reduced TSS; Figure 2G), a reduction in inorganic nutrient concentrations (Supplementary Table S1), and the increase in algal biomass. This highlights the subsequent (delayed) response of algal communities during this transition phase, with populations of siliceous algae (fucoxanthin) and some cryptophytes (alloxanthin) blooming after March (Figures 2D, E). The overall increase in phytoplankton biomass (March and April) is a response to higher resource availability (likely fueled by flood pulses) and increased water clarity, as well as the increasing prominence of submerged and emergent macrophyte habitats for epiphytic algal communities (Rafidah et al., 2010). Increased habitat availability, the rapid growth rates of diatoms and their enhanced N storage capacity all place this algal group at a competitive advantage in this phase, favouring their high abundances (Cordero and Balida, 2015; Berg et al., 2017). The increase in Chl a: degradation product ratios after March also reflects the higher productivity in the water column (Figure 2B). This closing of Phase 1 concomitant with the first peak in algal biomass, is reflected in the ordination space of Figure 3.
When looking at the DOM composition of lake and river waters for this phase, all the compound groups we identify show strong relationships with DOC (Supplementary Tables S2, S3) which are displayed in PCA plots (Figures 3, 4). As we also see a similar distribution of concentrations, independent of location, this implies that the system is hydraulically connected and well mixed. The signals we detect are in response to collective OM transport rather than additional sources or aquatic processing of the DOM pool (a passive state). However, there is an absence of a significant relationship between the compound groups of biopolymers and LMW acids (r2 0.3, p 0.055, n = 39) suggesting that they are either transported into the aquatic environment from different sources or that one compound group is more readily transformed through microbial or photochemical processes (Jones et al., 2016; Cory and Kling, 2018). The relatively low percentage contribution of proteins to the biopolymers group (Supplementary Tables S2, S3; 14%–66%) implies a predominantly vegetation-based source, and while the source of LMW acids is unknown, our ability to measure this group suggests that either there is i) a surplus of relatively microbially labile LMW acids transported in this system; or ii) short hydraulic residence times that impact that ability of aquatic biotic and abiotic transformations. Interestingly, although humic substances appear allochthonous in origin in both lake and river waters (Figure 2M; Huber et al., 2011), which is consistent with other studies in boreal and temperate lakes (Griffin et al., 2018; Peacock et al., 2018), the reduction in C/N ratios of humic substances, concomitant with a decline in DOC concentration from rivers into the lake basin likely suggests a degree of instream mineralisation of humic substances where carbon is preferentially liberated over nitrogen (Kellerman et al., 2015). While we cannot rule out photochemical oxidation of humic substances (Lou and Xie, 2006; Remington et al., 2011), increased vegetation cover of the lake and the higher suspended solids (TSS) (particularly at the start of the phase) reduce the penetrable depth of light (Briddon et al., 2020) and likely limit this process. Furthermore, lake contributions of humic substances from macrophytes at this time are likely minimal as Tasik Chini exports waters less concentrated in humic substances than those that enter the upper basin (Figure 2O; Supplementary Figure S2). These observations suggest that flood pulses are the more dominant process for OM and nutrient supply during this phase in Tasik Chini or that upstream communities are not as efficient at utilising OM as the RCC anticipates. However, the lake itself is likely acting as a source of OM and nutrients for downstream ecosystems, in line with the RCC, as it forces the inland water network into a lentic dominated system (Figure 5).
The transition towards higher δ18O values marks a change to drier conditions across the region (Figure 2A), less water inflow and evaporative conditions in the lake basin (Supplementary Figure S1). During this second phase, we argue that the RCC is most appropriate descriptor of DOM and nutrient processing at Tasik Chini. This marks a time of higher lake productivity but with a low influx of allochthonous material (OM and nutrients) leading to reworked autochthonous material exported downstream (Figures 3–5). This second, algal bloom dry period (Chl a: Figure 2C) was dominated by cryptophytes (alloxanthin) and chlorophytes (lutein, violaxanthin), in contrast to the Phase 1 phytoplankton (siliceous algae; fucoxanthin) (Figures 2D–F; Figure 4). At the same time, algal degradation products (pheophorbide a, chlorophyllide a and pheophytin a) increased, indicating greater senescence of and/or increased grazing pressures of algae (<Chl a: degradation products; Figure 2B). Indeed, the Chl a degradation product pheophorbide a (often a by-product of herbivory, although not exclusively) suggests an increase in zooplankton grazing, to which cryptophytes (alloxanthin) are particularly susceptible (Leavitt and Findlay, 1994).
Lake environments such as Tasik Chini have a high predominance of lipid rich algae, as well as easily degradable aquatic macrophytes (Phillips and Bustin, 1998). Due to the increase in algal biomass and the increased contribution of biopolymers (Figure 3) and humic substances to the overall DOM pool, compared to the earlier allochthonous phase (Figure 5), we attribute this composition to autochthonous supply at Tasik Chini (Villacorte et al., 2015). This is further reinforced by the unique signature of the compound groups of biopolymers and humic substances (Figures 2J, K). The shift of humic substances C/N ratios from June to August (31–47) compared to September to November (19–31), which are the lowest observed, strongly suggest a change in the supply of humics to the lake waters and likely reflects the successional growth and dieback of aquatic macrophytes (Figure 2N). Biopolymers predominantly consist of proteinaceous material (37%–100%, mean 93%, n = 39) with lower C/N ratios (1–8), likely reflecting a microbial (algal) source and the lower molecularity of humic substances also highlights this (compared to the allochthonous phase; Figure 2M; Figure 3).
The dry period at Tasik Chini, when water levels are evaporatively enriched (Supplementary Figure S1) and lower, is when the greatest expansion of macrophyte coverage occurs. Other such wetland lakes (e.g., Coqueiro Lake in the Pantanal) have documented submerged macrophyte expansion taking place when lake levels are at their greatest, coincident with lower TSS and greater light transparency (Loverde-Oliveira et al., 2009). The installation of the weir at Tasik Chini however, has reduced the level of seasonal reverse flooding from the Pahang river, creating a more lentic environment which provides the particular ecological niche for the invasive Cabomba furcata (Suhaimi-Othman et al., 2007; Sharip and Jusoh, 2010). Aquatic macrophytes have high demands for biogenic silica (Schoelynck et al., 2010), and so compete with diatoms for this silica, leading to a period of resource limitation in this autochthonous phase. The seasonal increase in macrophyte coverage (e.g., Cabomba and N. nucifera) at Tasik Chini is also decreasing light availability, leading to a decline in (benthic) diatom populations (Sharip et al., 2014). The high abundance of cryptophytes (alloxanthin) coincident with highest aquatic plant development, accounts for the switch from mostly autotrophic (fucoxanthin, lutein) to heterotrophic production during the second bloom period (Figure 2) impacting on the availability of carbon and nutrients downstream under the RCC, most clearly evidenced with increased changes in the C/N ratio and lower apparent molecular weight of humic substances (Figure 2N). The co-dominance of alloxanthin (cryptophytes) and lutein (chlorophytes), particularly after May, together with the altered compositions of the DOM pool (higher contribution of biopolymers; Figure 2K) would suggest that primary producers become active in producing biopolymeric substances that likely contain a higher amino acid content (e.g., Brett et al., 2017). Earlier work (1999) at Tasik Chini has indeed documented the dominance of chlorophytes in terms of their density (>80%) and diversity at the site, compared to other groups (Kutty et al., 2001). Similar flagellated phytoplankton groups have also been documented in other tropical shallow lakes during periods of increased aquatic vegetation (Loverde-Oliveira et al., 2009). Flagellated cryptophytes and chlorophytes are at a competitive advantage due to their ability to use flagella or aerotopes to position themselves in the water column (McGregor et al., 2006) and dominance of heterotrophic and mixotrophic protists over autotrophic algae alone can occur when macrophyte coverage in lake waters is profuse as they can tolerate low light conditions (Sinistro et al., 2006). Cryptophytes can adopt mixotrophy as a nutritional strategy when free dissolved inorganic nutrients are low and/or when high concentrations of DOM promote a high bacterial density (Jones, 2000). Mixotrophy generates an additional nutrient pool for phytoplankton from microbial biomass providing a means to acquire energy heterotrophically in turbid environments (Cloern and Dufford, 2005). This increased bacterial activity is also reflected in the apparent absence in LMW acids in Tasik Chini waters during the autochthonous phase (Figure 2L) as the high demand for this relatively labile material is utilised before it can be sampled (Judd et al., 2006). The greater variability in BOD (particularly basins Gumum and Jemberau; Figure 2H) in July also points to a period of increased respiration.
During this phase the RCC-like mechanism observed is the main input and export pathway from the lake. However, the “active pipe” is at its peak in the lentic “bottleneck” of the lake system itself (Figure 5). Heterotrophic and mixotrophic organisms are most prolific and while we do not observe direct relationships between increased abundances of DOM compound groups with biomarkers indicative of these biotic processes, we expect that there are either: 1) lead-lag relationships between the delivery of nutrients and the biotic response that produces the biomarkers we are able to measure (i.e., at seasonal timescales), and/or 2) our seasonal signal is punctuated by individual events at a fine temporal scale (e.g., rain events that mobilise a readily available OM source including aquatic and terrestrial detritus) as suggested in the PSC (Figure 5) (Raymond et al., 2016).
Following the termination of Phase 2, we would see a reset in the seasonal cycle via increasing rainfall rewetting and a transition back to Phase 1. δ18O signatures (Supplementary Figure S1) from all our lake sites display a similar profile to meteoric waters throughout our study period demonstrating a connected catchment with relatively short hydraulic residence times, concomitant with an increase in lake wide TSS and DOC (Figures 2G, I) concentrations which signifies the initiation of the NW monsoon period and an allochthonous supply of carbon and nutrients to the aquatic zone. Algal pigment concentrations all decline, and primary producers were undetectable in some areas of the lake. Where present, pigments are indicative of chlorophytes and may indicate a flushing of the system with decomposing remains of emergent vegetation and macrophytes. FPC processes become dominant again and are likely punctuated by individual flood-pulses (Figure 5) that are integral to the PSC and have been previously observed in other headwater tropical river systems (Johnson et al., 2006; Waterloo et al., 2006; Johnson et al., 2008; Pereira et al., 2014). However, high intensity rain events outside of the cyclical monsoon period, temporarily deliver flood pulses (FPC) of allochthonous, terrestrial DOM (Figure 5). These “short circuits” in the RCC style delivery of carbon and nutrients occur between November and January. During these short-circuits, rapid flushing of the wetland system, low frequency but high intensity rainfall events would likely trigger a near complete passive transfer of DOM and nutrients through the system, to downstream reaches. In this instance, the residence time of the lake would be greatly reduced (hours to days) and there would be a re-setting of the system (Figure 5). While the temporal resolution of our data are unable to capture this mechanism superimposed at the seasonal scale, we argue that this would be comparable with other such studies in tropical regions. The switching between event and seasonal OM and nutrient transport highlights the importance of high-resolution, long-term monitoring of tropical wetland systems to better distinguish DOM flux and downstream export during extreme events and well as during the natural, annual variability. This would specifically include river discharge data, water level measurements for each basin and the constraining of catchment end member source carbon in soils. Conducting this at a high resolution for the year (e.g., fortnightly to monthly) and via hourly logging in rapid rain scale events, would better constrain the flux of direct and indirect inputs to the lake over an annual (and event) cycle.
For the first time, we couple geochemical and isotopic proxies with compound-group specific DOM analysis to resolve the seasonal transformation of carbon and nutrients of a tropical, inland, wetland, lake ecosystem. By combining this approach, we demonstrate a viable framework to investigate aquatic ecosystem responses to climate and land-use change at a seasonal timescale where we observe the interplay between allochthonous and autochthonous derived DOM. This approach identified clear changes in the supply, uptake, and processing of DOM within the wetland throughout the season cycle. Our analysis further emphasises the need to focus on the transitions from dry to wet and wet to dry conditions when ascertaining the function and productivity of aquatic environments, which could be applied to a wide variety of environments and spatial scales (e.g., Thorp et al. (2006); Bracken et al. (2013). However, challenges remain in resolving fluxes, turnover rates, and potential ecological and climatic feedbacks, which reinforces the importance for further high temporal research of this kind for such complex environments.
Our work demonstrates that seasonal changes in lake catchment hydrology likely dictate the transport and composition of OM and nutrients to Tasik Chini wetland. We argue that further utilizing DOM and biomarker tracers within conceptual frameworks emphasizes the need to better incorporate complex tropical wetland systems where seasonal shifts between lentic and lotic systems exist in the same catchment. These observations of OM and nutrient supply to this lake, as well as their internal turnover, and its impact on aquatic ecosystem function, are attributed to a predominately FPC-like supply. Superimposed on this supply is the potential for delivery of OM from a Pulse-Shunt mechanism, although at present we are limited in our ability to resolve rain event scale mechanisms. Fundamentally, we observe that the lake acts as a hydrological buffer: increasing hydrological residence times and thereby increasing the time for abiotic and biotic OM mineralization to occur. This process in turn acting as the supplier for downstream ecosystems to receive OM and nutrients in an RCC-like manner. Intriguingly, it may be that the interplay between the RCC, FPC, and PSC are dependent on the spatial and temporal scale of the process examined and investigated and therefore an inherent bias exists to disentangle individual processes. Further work must look to incorporate adaptive methodologies and approaches that can account for scale to disentangle ecosystem functions that deliver and process OM of inland waters. This is a necessary step in all lake systems but particularly in tropical regions where there is a paucity of spatial and temporal data to examine the potential impacts of nutrient supply on downstream ecosystems.
The original contributions presented in the study are included in the article/Supplementary Material, further inquiries can be directed to the corresponding authors.
RP and VP designed and led the project and authorship. JB, JL, HM, NZ, MR, and SF were responsible for data generation/co-interpretation and authorship, SM contributed to concept and authorship. All authors contributed to the article and approved the submitted version.
The authors would like to acknowledge the collaboration with the TCRC, without which monthly sampling at, and field visits to, Tasik Chini would not have been possible. The contribution by NZ was carried out while based at TCRC and UKM. RP would like to thank the late Walter Hill for his enthusiasm and laboratory support, and Prof. Thomas Wagner for numerous DOM discussions. RP acknowledges support from the European Research Council (ERC) under the European Union’s Horizon 2020 research and innovation programme (Grant Agreement No. 949495). VP acknowledges funding support from the Anne McLaren Fellowship Scheme (University of Nottingham) and thanks Prof. Melanie Leng (British Geological Survey, Centre for Environmental Geochemistry) for her collaboration and analytical support. We thank Elaine Watts for graphical support.
The authors declare that the research was conducted in the absence of any commercial or financial relationships that could be construed as a potential conflict of interest.
All claims expressed in this article are solely those of the authors and do not necessarily represent those of their affiliated organizations, or those of the publisher, the editors and the reviewers. Any product that may be evaluated in this article, or claim that may be made by its manufacturer, is not guaranteed or endorsed by the publisher.
The Supplementary Material for this article can be found online at: https://www.frontiersin.org/articles/10.3389/feart.2023.1250889/full#supplementary-material
Barzani Gasim, M., Toriman, M. E. H., Abas, A., Islam, M. S., and Chek, T. C. (2008). Water quality of several feeder rivers between two seasoanl in Tasik Chini. Sains Malays. 37 (4), 313–321.
Barzani Gasim, M., Toriman, M. E. H., Rahman, Z. A., Islam, M. S., and Chek, T. C. (2009). Flow characteristics of the Tasik Chini’s feeder rivers, Pahang, Malaysia. Bull. Geol. Soc. Malays. 55, 7–13. doi:10.7186/bgsm55200902
Battin, T. J., Luyssaert, S., Kaplan, L. A., Aufdenkampe, A. K., Richter, A., and Tranvik, L. J. (2009). The boundless carbon cycle. Nat. Geosci. 2, 598–600. doi:10.1038/ngeo618
Berg, G. M., Driscoll, S., Hayashi, K., Ross, M., and Kudela, R. (2017). Variation in growth rate, carbon assimilation, and photosynthetic efficiency in response to nitrogen source and concentration in phytoplankton isolated from upper San Francisco Bay. J. Phycol. 53, 664–679. doi:10.1111/jpy.12535
Bonnet, M.-P., Pinel, S., Garnier, J., Bois, J., Boaventura, G. R., Patrick, S., and Marques, D. M. (2017). Amazonian floodplain water balance based on modelling and analyses of hydrologic and electrical conductivity data. Hydrol. Process. 31, 1702–1718.
Bowen, G. J., Wassenaar, L. I., and Hobson, K. A. (2005). Global application of stable hydrogen and oxygen isotopes to wildlife forensics. Oecologia 143, 337–348. doi:10.1007/s00442-004-1813-y
Bracken, L. J., Wainwright, J., Ali, G. A., Tetzlaff, D., Smith, M. W., Reaney, S. M., et al. (2013). Concepts of hydrological connectivity: research approaches, pathways and future agendas. Earth-Science Rev. 119, 17–34. doi:10.1016/j.earscirev.2013.02.001
Brett, M. T., Bunn, S. E., Chandra, S., Galloway, A. W. E., Guo, F., Kainz, M. J., et al. (2017). How important are terrestrial organic carbon inputs for secondary production in freshwater ecosystems? Freshw. Biol. 62, 833–853.
Briddon, C. L., McGowan, S., Metcalfe, S. E., Panizzo, V., Lacey, J., et al. (2020). Diatoms in a sediment core from a flood pulse wetland in Malaysia record strong responses to human impacts and hydro-climate over the past 150 years. Geo Geogr. Environ. 7, e00090.
Chen, N., Bianchi, T. S., McKee, B. A., and Bland, J. M. (2001). Historical trends of hypoxia on the Louisiana shelf: application of pigments as biomarkers. Org. Geochem. 32, 543–561. doi:10.1016/s0146-6380(00)00194-7
Chew, M. Y., and Siti-Munirah, M. Y. (2009). Ecological implications from the naturalisation of noxious Cabomba waterweeds in Malaysia. Malays. Nat. 63, 19–21.
Chong, I. K. (2001). Annual conference of senior manager of department of irrigation and drainage Malaysia 2001. Pahang: Malayisa.
Cloern, J. E., and Dufford, R. (2005). Phytoplankton community ecology: principles applied in San Francisco Bay. Mar. Ecol. Prog. Ser. 285, 11–28. doi:10.3354/meps285011
Cole, J. J., Prairie, Y. T., Caraco, N. F., McDowell, W. H., Tranvik, L. J., Striegl, R. G., et al. (2007). Plumbing the global carbon cycle: integrating inland waters into the terrestrial carbon budget. Ecosystems 10, 172–185. doi:10.1007/s10021-006-9013-8
Cordero, C. S., and Balida, S. F. (2015). Temporal variation of phytoplankton community structure in Lake Mohicap, San Pablo City, Laguna. Int. J. Pure Appl. Biosci. 3, 377–385. ISSN: 2320–7051.
Cory, R. M., and Kling, G. W. (2018). Interactions between sunlight and microorganisms influence dissolved organic matter degradation along the aquatic continuum. Limnol. Oceanogr. Lett. 3, 102–116. doi:10.1002/lol2.10060
Dansgaard, W. (1964). Stable isotopes in precipitation. Tellus 16, 436–468. doi:10.3402/tellusa.v16i4.8993
Drake, T. W., Raymond, P. A., and Spencer, R. G. M. (2018). Terrestrial carbon inputs to inland waters: a current synthesis of estimates and uncertainty. Limnol. Oceanogr. Lett. 3, 132–142. doi:10.1002/lol2.10055
Furtado, J. I., and Mori, S. (1982). “Intoduction,” in Tasik Bera: the ecology of a freshwater swamp. Editors J. I. Furtado, and S. Mori (Monographiae Biologicae: Springer: Netherlands). doi:10.1007/978-94-009-7980-2
Griffin, C. G., Finlay, J. C., Brezonik, P. L., Olmanson, L., and Hozaiski, R. M. (2018). Limitations on using CDOM as a proxy for DOC in temperate lakes. Water Res. 144, 719–727. doi:10.1016/j.watres.2018.08.007
Harris, I., Jones, P. D., Osborn, T. J., and Lister, D. H. (2014). Updated high-resolution grids of monthly climatic observations – the CRU TS3.10 Dataset. Int. J. Climatol. 34, 623–642. doi:10.1002/joc.3711
Harris, I., Osborn, T. J., Jones, P., and Lister, D. (2020). Version 4 of the CRU TS monthly high-resolution gridded multivariate climate dataset. Sci. Data 7, 109. doi:10.1038/s41597-020-0453-3
Heinz, M., and Zak, D. (2018). Storage effects on quantity and composition of dissolved organic carbon and nitrogen of lake water, leaf leachate and peat soil water. Water Res. 130, 98–104. doi:10.1016/j.watres.2017.11.053
Hernes, P. J., Spencer, R. G. M., Dyda, R. Y., Pellerin, B. A., Bachand, P. A. M., and Bergamaschi, B. A. (2008). The role of hydrologic regimes on dissolved organic carbon composition in an agricultural watershed. Geochimica Cosmochimica Acta 72, 5266–5277. doi:10.1016/j.gca.2008.07.031
Huang, T.-H., Fu, Y.-H., Pan, P.-Y., and Chen, C.-T. A. (2012). Fluvial carbon fluxes in tropical rivers. Curr. Opin. Environ. Sustain. 4, 162–169. doi:10.1016/j.cosust.2012.02.004
Huber, S. A., Balz, A., Abert, M., and Pronk, W. (2011). Characterisation of aquatic humic and non-humic matter with size-exclusion chromatography – organic carbon detection – organic nitrogen detection (LC-OCD-OND). Water Res. 45, 879–885. doi:10.1016/j.watres.2010.09.023
Ikusima, I., and Furtado, J. I. (1982). “Primary production,” in Tasik Bera: the ecology of a freshwater swamp. Editors J. I. Furtado, and S. Mori (Monographiae Biologicae: Springer: Netherlands), 191–278. doi:10.1007/978-94-009-7980-2
Jeffrey, S. W., and Humphrey, G. F. (1975). New spectrophotometric equations for determining chlorophylls a, b, c1 and c2 in higher plants, algae and natural phytoplankton. Biochem. Physiol. Pflanz. 167, 191–194. doi:10.1016/s0015-3796(17)30778-3
Johnson, M. S., Lehmann, J., Couto, E. G., Novaes Filho, J. P., and Riha, S. J. (2006). DOC and DIC in flowpaths of Amazonian headwater catchments with hydrologically contrasting soils. Biogeochemistry 81, 45–57.
Johnson, M. S., Lehmann, J., Riha, S. J., Krusche, A. V., Richey, J. E., et al. (2008). CO2 efflux from Amazonian headwater streams represents a significant fate for deep soil respiration. Geophys. Res. Lett. 35.
Jones, R. I. (2000). Mixotrophy in planktonic protists: an overview. Freshw. Biol. 45, 219–226. doi:10.1046/j.1365-2427.2000.00672.x
Jones, T. G., Evans, C. D., Jones, D. L., Hill, P. W., and Freeman, C. (2016). Transformations in DOC along a source to sea continuum; impacts of photo-degradation, biological processes and mixing. Aquat. Sci. 78, 433–446. doi:10.1007/s00027-015-0461-0
Judd, K. E., Crump, B. C., and Kling, G. W. (2006). Variation in dissolved organic matter controls bacterial production and community composition. Ecology 87, 2068–2079. doi:10.1890/0012-9658(2006)87[2068:vidomc]2.0.co;2
Junk, W. J., Bayley, P. B., and Sparks, R. E. (1989). The flood pulse concept in river-floodplain systems. Canadian Special Publication of Fisheries and Aquatic Sciences, 106: 110–127.
Junk, W. J., and Piedade, M. T. F. (1997). “Plant life in the floodplain with special reference to herbaceous plants,” in The Central Amazon floodplain: ecology of a pulsing system. Editor W. J. Junk (Springer Verlag), 147–186.
Junk, W. J., and Wantzen, K. M. (2004). “The flood pulse concept: new aspects, approaches and applications – an update,” in Proceedings of the second international symposium on the management of large rivers for fisheries, food and agriculture organization of the united nations (FAO) and the mekong river commission (MRC). Editors R. L. Welcomme, and a. T. Petr, 117–140.
Kellerman, A. M., Dittmar, T., Kothawala, D. N., and Tranvik, L. J. (2014). Chemodiversity of dissolved organic matter in lakes driven by climate and hydrology. Nat. Commun. 5, 3804. doi:10.1038/ncomms4804
Kellerman, A. M., Kothawala, D. N., Dittmar, T., and Tranvik, L. J. (2015). Persistence of dissolved organic matter in lakes related to its molecular characteristics. Nat. Geosci. 8, 454–457. doi:10.1038/ngeo2440
Kutty, A. A., Ismail, A., and Fong, C. S. (2001). A preliminary study of phytoplankton at Lake Chini, Pahang. Pak. J. Biol. Sci. 4 (3), 309–313. doi:10.3923/pjbs.2001.309.313
Lambert, T., Bouillon, S., Darchambeau, F., Massicotte, P., and Borges, A. V. (2016). Shift in the chemical composition of dissolved organic matter in the Congo River network. Biogeosciences 13, 5405–5420. doi:10.5194/bg-13-5405-2016
Leavitt, P. R., and Findlay, D. L. (1994). Comparison of fossil pigments with 20 Years of phytoplankton data from eutrophic lake 227, experimental lakes area, ontario. Can. J. Fish. Aquat. Sci. 51, 2286–2299. doi:10.1139/f94-232
Lou, T., and Xie, H. X. (2006). Photochemical alteration of the molecular weight of dissolved organic matter. Chemosphere 65, 2333–2342. doi:10.1016/j.chemosphere.2006.05.001
Loverde-Oliveira, S. M., and Huszar, V. L. M. (2007). Phytoplankton ecological responses to the flood pulse in a Pantanal lake, Central Brazil. Acta Limnol. Bras. 19, 117–130. doi:10.4257/oeco.2019.2304.16
Loverde-Oliveira, S. M., Huszar, V. L. M., Mazzeo, N., and Scheffer, M. (2009). Hydrology-driven regime shifts in a shallow tropical lake. Ecosystems 12, 807–819. doi:10.1007/s10021-009-9258-0
Mackereth, F., Heron, J., and Talling, J. F. (1978). Water analysis: some revised mehods for limnologists. Scientific Publications of the Freshwater Biological Association: London, 121.
McClain, M. E., Boyer, E. W., Dent, C. L., Gergel, S. E., Grimm, N. B., Groffman, P. M., et al. (2003). Biogeochemical hot spots and hot moments at the interface of terrestrial and aquatic ecosystems. Ecosystems 6, 301–312.
McGowan, S., Barker, P., Haworth, E. Y., Leavitt, P. R., Maberly, S. C., and Pates, J. (2012). Humans and climate as drivers of algal community change in Windermere since 1850. Freshwat. Biol. 57, 260–277. doi:10.1111/j.1365-2427.2011.02689.x
McGregor, G. B., Marshall, J. C., and Thoms, M. C. (2006). Spatial and temporal variation in algal-assemblage structure in isolated dryland river waterholes, Cooper Creek and Warrego River, Australia. Mar. Freshw. Res. 57, 453–466. doi:10.1071/mf05128
Peacock, M., Jones, T. G., Futter, M. N., Freeman, C., Gough, R., Baird, A. J., et al. (2018). Peatland ditch blocking has no effect on dissolved organic matter (DOM) quality. Hydrol. Process. 32, 3891–3906.
Pereira, R., Bovolo, C. I., Spencer, R. G. M., Hernes, P. J., Tipping, E., Vieth-Hillebrand, A., et al. (2014). Mobilization of optically invisible dissolved organic matter in response to rainstorm events in a tropical forest headwater river. Geophys. Res. Lett. 41, 1202–1208.
Peter, H., Singer, G., Ulseth, A. J., Dittmar, T., Prairie, Y. T., and Battin, T. J. (2020). Travel time and source variation explain the molecular transformation of dissolved organic matter in an alpine stream network. Biogeosciences 125, e2019JG005616. doi:10.1029/2019jg005616
Phillips, S., and Bustin, R. M. (1998). Accumulation of organic rich sediments in a dendritic fluvial/lacustrine mire system at Tasik Bera, Malaysia: implications for coal formation. Int. J. Coal Geol. 36, 31–61. doi:10.1016/s0166-5162(97)00031-1
Rafidah, A. R., Chew, M. Y., Ummul-Nazrah, A. R., and Kamarudin, S. (2010). The flora of Tasik bera, Pahang, Malaysia. Malay. Nat. J. 62, 249–306.
Raymond, P. A., Saiers, J. E., and Sobczak, W. V. (2016). Hydrological and biogeochemical controls on watershed dissolved organic matter transport: pulse-shunt concept. Ecology 97, 5–16. doi:10.1890/14-1684.1
Remington, S., Krusche, A., and Richey, J. (2011). Effects of DOM photochemistry on bacterial metabolism and CO2 evasion during falling water in a humic and a whitewater river in the Brazilian Amazon. Biogeochemistry 105, 185–200. doi:10.1007/s10533-010-9565-8
Schoelynck, J., Bal, K., Backx, H., Okruszko, T., Meire, P., and Struyf, E. (2010). Silica uptake in aquatic and wetland macrophytes: a strategic choice between silica, lignin and cellulose? New Phytol. 186, 385–391. doi:10.1111/j.1469-8137.2009.03176.x
Sharip, Z., and Jusoh, J. (2010). Integrated lake basin management and its importance for Lake Chini and other lakes in Malaysia. Lakes Reservoirs Res. Manag. 15, 41–51. doi:10.1111/j.1440-1770.2010.00421.x
Sharip, Z., Schooler, S. S., Hipsey, M. R., and Hobbs, R. J. (2012). Eutrophication, agriculture and water level control shift aquatic plant communities from floating-leaved to submerged macrophytes in Lake Chini, Malaysia. Biol. Invasions 14, 1029–1044. doi:10.1007/s10530-011-0137-1
Sharip, Z., Taqiyuddin, A., Zaki, A., and Zakaria, S. (2014). Flooding effects on the population dynamics of Cabomba furcata and Nelumbo nucifera in a shallow floodplain wetland. Wetlands 34, 713–723. doi:10.1007/s13157-014-0536-z
Sinistro, R., Izaguirre, I., and Asikian, V. (2006). Experimental study on the microbial plankton community in a South Ameri-can wetland (Lower Paraná River Basin) and the effect of the light deficiency due to the floating macrophytes. J. Plankton Res. 28, 753–768. doi:10.1093/plankt/fbl008
Solomon, C. T., Jones, S. E., Weidel, B. C., Buffam, I., Fork, M. L., Karlsson, J., et al. (2015). Ecosystem consequences of changing inputs of terrestrial dissolved organic matter to lakes: current knowledge and future challenges. Ecosystems 18, 376–389.
Stanford, J. A., and Ward, J. V. (2001). Revisiting the serial discontinuity concept. Regul. Rivers Res. Mgmt. 17, 303–310. doi:10.1002/rrr.659
Suhaimi-Othman, M., Lim, E. C., and Mushrifah, I. (2007). Water quality changes in Chini lake, Pahang, west Malaysia. Environ. Monit. Assess. 131, 279–292. doi:10.1007/s10661-006-9475-3
Tan, C. C., and Barzani Gasim, M. (2005). Assessment of hydrology and water quality in river basin between two seasons in Chini Lake, Pahang. Fifth Graduate Colloquium, Faculty of Science and Technology: Selangor.
Thorp, J. H., and Delong, M. D. (1994). The riverine productivity model: an heuristic view of carbon sources and organic processing in large river ecosystems. Oikos 70, 305–308. doi:10.2307/3545642
Thorp, J. H., and Delong, M. D. (2002). Dominance of autochthonous autotrophic carbon in food webs of heterotrophic rivers? Oikos 96, 543–550. doi:10.1034/j.1600-0706.2002.960315.x
Thorp, J. H., Thoms, M. C., and Delong, M. D. (2006). The riverine ecosystem synthesis: biocomplexity in river networks across space and time. River Res. Appl. 22, 123–147. doi:10.1002/rra.901
Vannote, R. L., Minshall, G. W., Cummins, K. W., Sedell, J. R., and Cushing, C. E. (1980a). The River continuum concept. Can. J. Fish. Aquatic Sci. 37, 130–137. doi:10.1139/f80-017
Vannote, R. L., Minshall, G. W., Cummins, K. W., Sedell, K. W., and Cushing, C. E. (1980b). The river continuum concept. Can. J. Aquatic Sci. 37, 130–137. doi:10.1139/f80-017
Villacorte, L. O., Ekowati, Y., Neu, T., Kleijn, J., Winters, H., Amy, G., et al. (2015). Characterisation of algal organic matter produced by bloom-forming marine and freshwater algae. Water Res. 73, 216–230.
Ward, J. V., and Stanford, J. A. (1995). The serial discontinuity concept: extending the model to floodplain rivers. Regul. Rivers Res. Mgmt. 10, 159–168. doi:10.1002/rrr.3450100211
Keywords: dissolved organic matter, transport, algal biomarkers, tropical wetland, ecosystem function
Citation: Pereira R, Panizzo VN, Bischoff J, McGowan S, Lacey J, Moorhouse H, Zelani NS, Ruslan MS and Fazry S (2024) Investigating the role of hydrological connectivity on the processing of organic carbon in tropical aquatic ecosystems. Front. Earth Sci. 11:1250889. doi: 10.3389/feart.2023.1250889
Received: 30 June 2023; Accepted: 11 December 2023;
Published: 08 January 2024.
Edited by:
Timothy Ian Eglinton, ETH Zürich, SwitzerlandReviewed by:
Nikita Tananaev, Siberian Branch of the Russian Academy of Sciences (RAS), RussiaCopyright © 2024 Pereira, Panizzo, Bischoff, McGowan, Lacey, Moorhouse, Zelani, Ruslan and Fazry. This is an open-access article distributed under the terms of the Creative Commons Attribution License (CC BY). The use, distribution or reproduction in other forums is permitted, provided the original author(s) and the copyright owner(s) are credited and that the original publication in this journal is cited, in accordance with accepted academic practice. No use, distribution or reproduction is permitted which does not comply with these terms.
*Correspondence: Ryan Pereira, ci5wZXJlaXJhQGh3LmFjLnVr; Virginia N. Panizzo, dmlyZ2luaWEucGFuaXp6b0Bub3R0aW5naGFtLmFjLnVr
†These authors share first authorship
Disclaimer: All claims expressed in this article are solely those of the authors and do not necessarily represent those of their affiliated organizations, or those of the publisher, the editors and the reviewers. Any product that may be evaluated in this article or claim that may be made by its manufacturer is not guaranteed or endorsed by the publisher.
Research integrity at Frontiers
Learn more about the work of our research integrity team to safeguard the quality of each article we publish.