 Lina Zheng1
 Tian Li
- 1Ji’nan Meteorological Bureau, Ji’nan, China
- 2Kenli Meteorological Bureau, Kenli, China
A severe torrential rain attacked Henan province from July 19 to 21, 2021, resulting in extensive social and economic damages. The models’ sub-seasonal prediction skill for this extreme event remains to be evaluated. Based on the real-time data of 5 models (CMA, ECMWF, NCEP, KMA, and UKMO) from the sub-seasonal to seasonal (S2S) prediction project, our study compared the models’ predictability and explored the possible reasons. Results indicate that most models can predict the spatial distribution of accumulated precipitation for this event 1 week in advance. Two models (NCEP and CMA) still have specific reference values in predicting precipitation intensity 2–3 weeks ahead. However, the predicted maximum rainfall is only about 20% of the observation, and all models cannot catch the extremes of this event. While large-scale atmospheric circulation can be predicted with some accuracy, there are still significant deviations in predicting the location and intensity of the western North Pacific subtropical high (WNPSH) and Typhoon In-Fa. The models predict weaker intensity of the southeast airflow transporting water vapor into the rainstorm area, resulting in significantly weaker precipitation. This is mainly attributed to unsatisfactory predicted typhoon circulation in most models. The model ECMWF and KMA predict a better moisture flux at 925hPa, about 60% of the observations. The characteristics of local high SST centers in the Sea of Japan cannot be caught, resulting in the position of the predicted WNPSH eastward and weak. Therefore, to improve the prediction skill for extreme precipitation events, it is imperative to enhance the interaction mechanisms among atmospheric circulation systems within the model.
1 Introduction
An extreme precipitation event occurred on 19–21 July 2021 in Henan province, China, with the maximum accumulated rainfall reaching 820.9 mm. Severe precipitation was mainly concentrated in western, northern, and central Henan (Figure 1). Extremely severe torrential rain affected ten cities such as Zhengzhou, Jiaozuo, Xinxiang, etc., and five national meteorological stations, including Songshan, Yanshi, Xinmi, Yichuan, and Dengfeng, all broke daily precipitation records since their establishment. From 08:00 July 19 to 16:00 July 20, the accumulated rainfall in Songshan station totaled 508.3 mm, and that in Xinmi station reached 476.2 mm, both exceeding 60% of their total annual rainfall. The precipitation of Zhengzhou station from 16:00 to 17:00 on July 20 was 201.9 mm, almost equivalent to one-third of its last year’s total, breaking the record of single-hour precipitation of 2418 national meteorological stations on the Chinese mainland. The extreme precipitation event resulted in severe urban waterlogging, with waist-deep flooding occurring in slightly low-lying areas and causing significant traffic disruptions. This was a record-breaking disaster for Zhengzhou, a metropolis with over 10 million inhabitants.
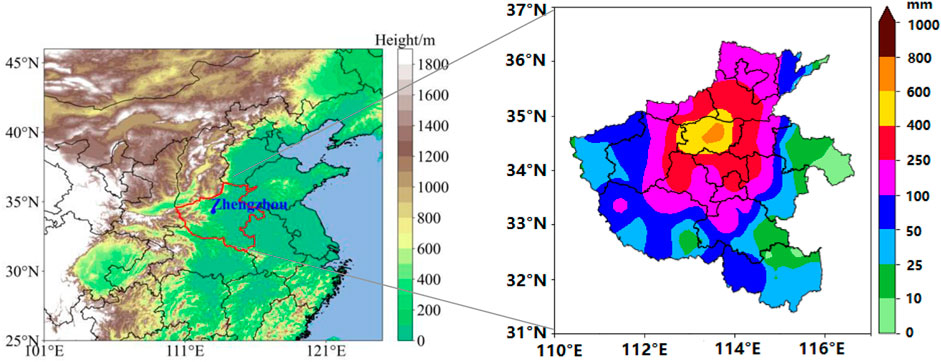
FIGURE 1. Location of Henan province (left panel) and the spatial distribution of accumulated precipitation (unit: mm) from July 19 to 21, 2021 (right panel).
Extreme precipitation events often cause landslides, mountain floods, waterlogging, and mud-rock flow, seriously impacting people’s lives and property. Studies have consistently demonstrated a year-on-year increase in global extreme precipitation events, which is projected to continue rising alongside ground temperature (Blanchet et al., 2021; Yu and Zhong, 2021; Zou et al., 2021). Extreme precipitation events occur under the background of favorable large-scale circulation. They are usually caused by long-term atmospheric circulation anomalies (the abnormally northerly and strengthening of the western Pacific subtropical high, the establishment and maintenance of blocking situation, etc.), resulting in the continuous interaction of cold and warm air in a specific region (Lei et al., 2020). When the rainstorm is accompanied by short-term heavy precipitation, it is primarily attributed to the meso-micro scale convective systems, which are induced by synoptic-scale vortex, shear line, or cyclone. These systems continuously intensify and impact a specific location (Zhang et al., 2013; Zhao et al., 2018). A significant rainstorm event is usually produced by the interaction of multi-scale systems (Luo et al., 2014; Luo and Chen, 2015). During the formation of extreme precipitation, the warm and moist air over the ocean is continuously transported from low latitudes to rainstorm areas under the action of low-altitude southerly winds, providing continuous water vapor, which is essential to the generation of a rainstorm (Niu et al., 2021). This water vapor transport flow is called the “atmospheric river” (Gimeno et al., 2014; Dacre et al., 2015). The atmospheric river is used to explain the mechanism of extreme precipitation events.
Extreme precipitation events caused by typhoons moving northward or typhoons interacting with mid-latitude systems have been identified as highly destructive phenomena (Sun et al., 2013; Zhu et al., 2017). In recent years, landfall typhoons such as “Yagi”, “Rumbia”, and “Lekima” have brought downpours and strong winds to most areas of eastern China, causing a series of secondary disasters. A notable example occurred on August 4-8, 1975 when the residual vortex of typhoon (No.197503) triggered an extraordinary torrential rain event in Henan, with Lin Zhuang station documenting a record-breaking rainfall of 1062 mm within a day. The flood affected 12 million people, killed more than 26000 people, and caused economic losses of 1.5 billion dollars in Henan (Liu et al., 2009; Ying et al., 2014; Ding, 2015). Furthermore, Typhoon IN-FA (No.202106) transported warm and moist air from the western North Pacific over a distance of up to 2000 km into the central plains, providing abundant water vapor for the extreme precipitation event that occurred in Henan in July 2021—an event that will be thoroughly analyzed in our paper.
Based on the above investigation, it can be inferred that extensive research has been conducted on the formation mechanism of extreme precipitation events. However, there is a lack of studies to evaluate the sub-seasonal predictive capability of such events. Generally, short-term (less than 3 days) and medium-range (3–10 days) numerical weather prediction models can predict these extreme events. Nevertheless, their predictability rapidly declines beyond a 10-day forecasting period (Simmons and Hollingsworth, 2002). Given the urgency to provide timely predictions and early warnings for rare disasters like this, meteorological departments must focus on conducting research in sub-seasonal to seasonal (S2S) time scale prediction. Sub-seasonal prediction serves as an intermediary between medium-term weather prediction and long-term climate prediction (Robertson et al., 2014; MacLeod et al., 2015). At least eleven National Meteorological centers worldwide, including China, have undertaken S2S projects. These studies offer an ‘opportunity window’ for sub-seasonal timescale predictions, while aiding researchers in enhancing prediction methods and summarizing experiences to serve local governments and societies effectively. In this paper, we use five models (CMA, ECMWF, NCEP, KMA, and UKMO) of the S2S project to evaluate the sub-seasonal predictive ability of this extreme precipitation event in Henan province while analyzing the possible reasons. The analysis of prediction results for the five models will be beneficial in guiding parameterization scheme adjustment and algorithm improvement for extreme precipitation.
The remaining sections of this paper are organized as follows: Section 2 introduces the data and methods. Section 3 presents an assessment of the sub-seasonal forecasting accuracy of the models for extreme events. Section 4 analyzes possible reasons for differences in forecasting skills among the five models. Finally, Section 5 provides conclusions and discussions.
2 Data and methods
2.1 Data
The 6-hourly interval reanalysis data (Kalnay et al., 1996) from 2000 to 2021 were obtained from the National Centers for Environmental Prediction/National Center for Atmospheric Research (NCEP/NCAR), including wind components, specific humidity, and geopotential heights. The sea surface temperature (SST) data gridded at 2°×2° resolution were obtained from the National Oceanic and Atmospheric Administration (NOAA) Extended Reconstructed SST, version 5 (ERSSTv5) (Huang et al., 2017). The observed daily precipitation data in July 2021 from 268 meteorological stations in Henan province are provided by the China Meteorological Administration. The real-time data of 5 models of the S2S project from June to July 2021 are downloaded from the ECMWF website (https://confluence.ecmwf.int/display/S2S/Models). The S2S project provides real-time data of the 11 dynamic models from operational centers worldwide (Vitart et al., 2017). Considering that six models have different real-time frequencies compared to other models, this study focuses on evaluating the remaining five models. These five centers include the China Meteorological Administration (CMA), the European Centre for Medium-Range Weather Forecasts (ECMWF), the US National Centers for Environmental Prediction (NCEP), the Korea Meteorological Administration (KMA), and the UK Met Office (UKMO). Table 1 presents the main characteristics of real-time data provided by these five models. Forecasting time ranges from 44 to 60 days, ensemble sizes are from 4 to 51, and real-time frequencies are from twice a week to once a day.
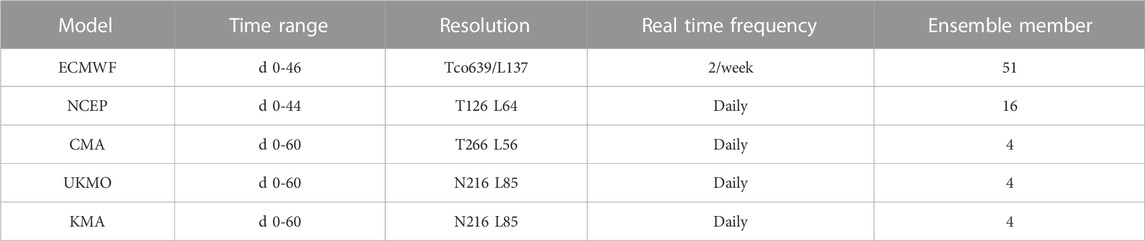
TABLE 1. Main characteristics of real-time data of the five models participating in the S2S project.
2.2 Methods
The assessment for the extreme precipitation event primarily occurred in Henan province (110°-117°E, 31°-37°N) from July 19 to 21, 2021. The ensemble mean of real-time data at 1–4 weeks lead time is calculated respectively for the five models. Moreover, spatial correlation coefficient (SCC), root-mean-squared error (RMSE), and equitable threat score (ETS) are employed as evaluation metrics for prediction skills.
When SCC meets the threshold, the predicted precipitation area and its center value are similar to the actual situation, indicating that the predictions can partially reflect reality. A skillful prediction is defined as having a correlation coefficient greater than 0.5 (Zhou et al., 2019), while a correlation coefficient between 0.3 and 0.5 implies reference significance in model predictions (p-value is smaller than 0.05).
ETS score serves as an extensively used index by Chinese meteorological departments to assess rainstorm prediction effectiveness, typically ranging from 0 to 0.4. The larger the ETS value, the closer the prediction is to the observation. The detailed description of the ETS is given as follows:
Where Ch is expressed as:
Nf is the number of stations predicting rainstorms, while N denotes the total number of stations. No signifies the number of stations with actual rainstorms, and Nfc denotes the number of stations correctly predicting rainstorms. All stations above are within the Henan province. The ETS value remains unaffected by the number of participating stations during evaluation, thus making it a fair measure for prediction accuracy (Wu et al., 2009).
3 Evaluations of sub-seasonal prediction for the extreme precipitation event
3.1 Accumulated precipitation
The extreme precipitation occurred in the western mountainous area of Henan province, where the mountains reach heights of up to 700 m. Under the favorable circulation background and particular topography, the easterly airflow from the western North Pacific continuously transported water vapor to the rainstorm area. The flow was blocked by mountains, then converged and moved upward in front of mountains, resulting in intensified precipitation. Figure 1 shows the location of Henan province and its spatial distribution of observed precipitation during this precipitation event. Observed rainfall covered the entire region with over 100 mm primarily concentrated in central and northern areas. Notably, the maximum center of precipitation appeared in Zhengzhou with a total accumulation reaching 820.9 mm, surpassing its annual average rainfall of 641 mm. Statistical analysis reveals that approximately 69% of stations across Henan province recorded precipitation exceeding 50 mm. Percentages for values above 100mm, above 250 mm, and above 500 mm were approximately at levels of around 44%, 20%, and 2% respectively. Considering the devastating consequences the extreme rainfall bring to the province, can numerical models accurately predict this extreme event on a sub-seasonal time scale?
The spatial distributions of predicted precipitation at the lead time of 1–4 weeks for this extreme event are displayed in Figure 2. All five models demonstrate the ability to forecast precipitation in Henan province up to 4 weeks in advance, albeit with weaker intensity compared to observations. The predicted maximum rainfall at the lead time of 1 week is more than 100 mm. It is 500 mm less than the maximum observed value, indicating the models’ inability to accurately predict the extremes of this precipitation event. Specifically, the CMA model exhibits the weakest prediction (10–100 mm) 1 week ahead, and the predicted location for the center of precipitation is further south than observed (Figure 2A1). The predicted maximum precipitation by other models is more than 100mm, and the precipitation center is also located north of Henan (Figures 2B1–E1). However, these areas with rainfall above 100 mm are smaller than what was observed. Most models can predict precipitation below 25 mm at lead times of 2–4 weeks, with only the NCEP model capable of predicting rainfall between 50 mm and 100 mm in northern Henan province 2–3 weeks ahead–making it superior among all five models.
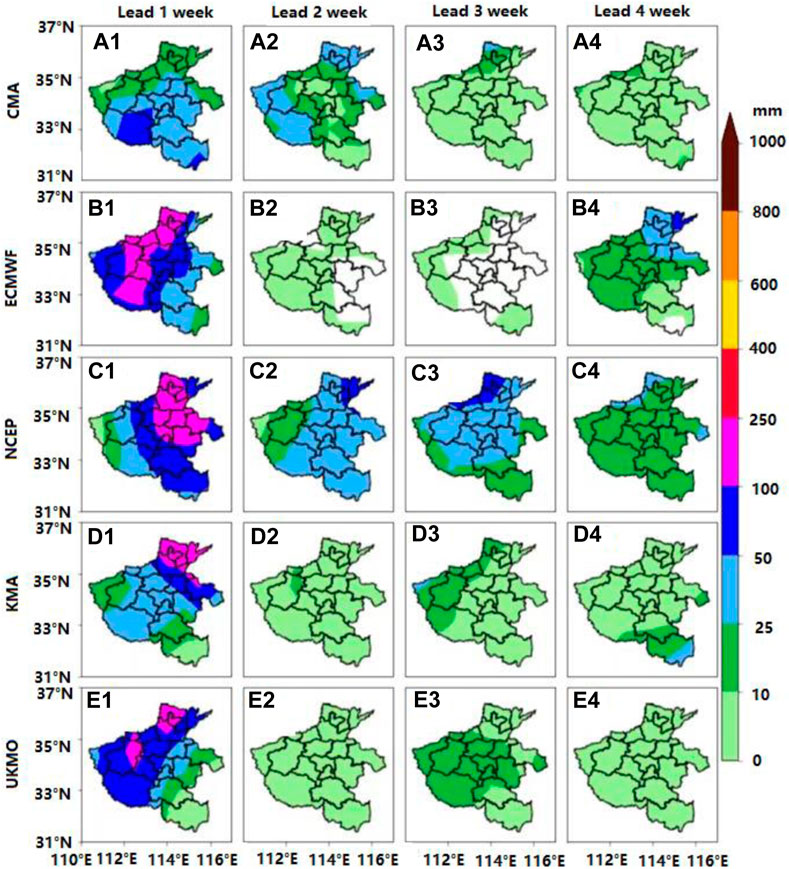
FIGURE 2. Spatial distributions of predicted accumulated precipitation of the extreme rainfall (from July 19 to 21, 2021) with 1–4 weeks lead times by the model CMA (A1-A4), ECMWF (B1-B4), NCEP (C1-C4), KMA (D1-D4) and UKMO (E1-E4) in Henan province (unit: mm).
3.2 Regionally averaged precipitation
In this event, precipitation covered the entire Henan province, and the average rainfall in the whole province reached 93.9 mm. The average precipitation predicted by the five models is generally negligible. At a 1-week lead time, ECMWF demonstrates superior prediction skills with a forecasted value of 62.1 mm, while CMA performs worst with a value of 26.1 mm. The other three models predict values ranging between 40 and 50 mm. Most models exhibit a rapid decline in their ability to predict regional mean precipitation at lead times of 2–4 weeks compared to that of the first week. Among them, the NCEP model outperforms other models. Although the predicted regional precipitation by the NCEP model decreases over time, it experiences less reduction in rainfall than other models (Figure 3).
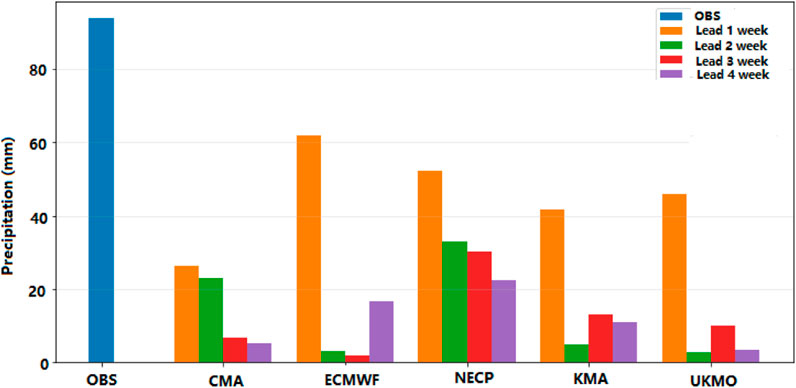
FIGURE 3. Regionally averaged observations (OBS) and predictions of the extreme rainfall (from July 19 to 21, 2021) with lead times of 1–4 weeks by five models in Henan province (unit: mm).
3.3 Forecasting skills
Figure 4 shows SCC and RMSE between the prediction and the observation of the accumulated precipitation from 5 models. Four models (except for CMA with a correlation coefficient of 0.32) exhibit correlation values above 0.5, indicating their skillful prediction ability for cumulative precipitation up to 1 week in advance. However, at the 2-week lead time, the predictability decreases rapidly, with only the CMA and NCEP models maintaining correlation values above 0.3. At 3 weeks lead time, only the NCEP model achieves a correlation value of 0.3 while others fall below this threshold. None of the five models reach an SCC value above 0.3 at 4 weeks lead time. Thus, most models can only provide forecasting skills up to 1 week before extreme precipitation events occur. Nevertheless, NCEP and CMA offer valuable references for precipitation prediction two to 3 weeks in advance. The RMSE values for all five models range from approximately 142–165 mm at a 1-week lead time, which is significantly smaller compared to those calculated at 2–4 weeks lead times. The NCEP model exhibits the smallest RMSE value (142 mm) among the five models, indicating that the prediction of this model is the closest to the observation at the lead time of 1–4 weeks. Furthermore, the RMSE values of all models increase with lead time.
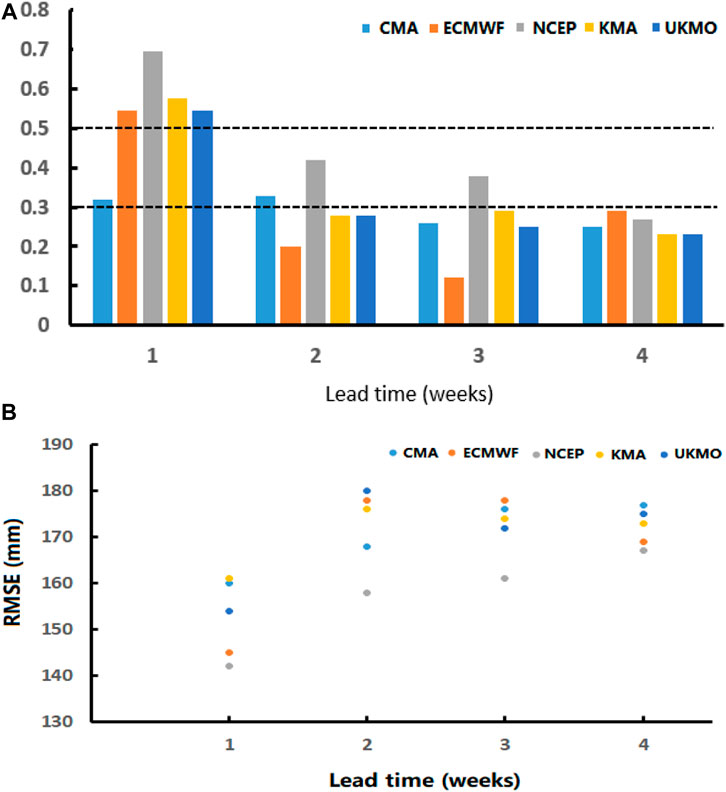
FIGURE 4. Spatial correlation coefficient (A) and RMSE (b, unit: mm) at 1–4 weeks lead times by the five models for the extreme event (from July 19 to 21, 2021) in Henan.
The ETS scores at 1–4 weeks lead time for the extreme event are presented in Table 2. For precipitation exceeding 100 mm, the CMA model exhibits no predictive skill, while the remaining four models demonstrate ETS values ranging from 0.123 to 0.245, with ECMWF achieving the highest value of 0.245. When considering precipitation above 50 mm, all five models exhibit ETS values surpassing 0.2 at a 1-week lead time. Notably, only the CMA and NCEP maintain positive ETS values (above 0.2) 2 weeks in advance. However, other models yield an ETS value of zero during this period. Although some models display positive ETS values at a lead time of three to 4 weeks, these values remain minimal and indicate limited forecasting skills within the models’ capabilities. The results of ETS are consistent with those of SCC, highlighting that most models possess predictability solely up to 1 week in advance for extreme events. Only NCEP and CMA can generate valuable predictions two to 3 weeks ahead. The NCEP model has the best forecasting skill among the five models at the lead time of 1–4 weeks when the precipitation is greater than 50 mm.
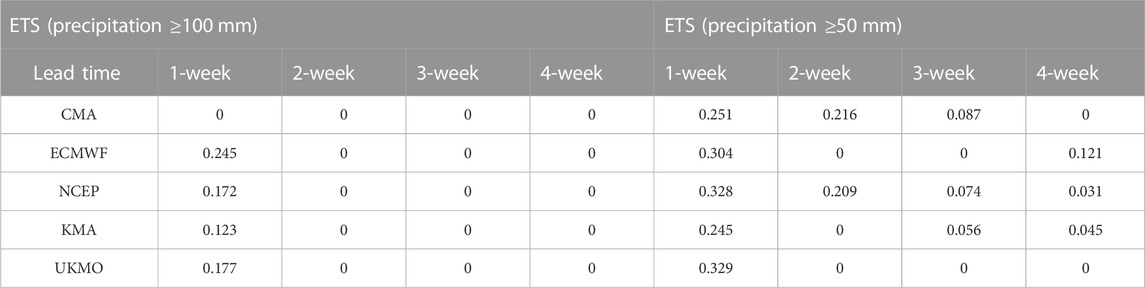
TABLE 2. The ETS values at 1–4 weeks lead times of the five models for the extreme event.
4 Analyses of the differences in precipitation predictions by five models
4.1 Large-scale circulation background
Extreme precipitation events occur within a favorable and stable large-scale circulation background. The averaged large-scale circulation fields (Figure 5A) reveal the presence of a trough in the middle and high latitudes (60°-90°E) at 200 hPa. At the bottom of the trough, a strong westerly jet extends northeastward. Meanwhile, the South Asian high ridge is at 30°N, with its eastern ridge extending to 107°E. The northerly wind on the eastern side of the high-pressure system and the southwesterly wind ahead of the northern trough form a distinct airflow dispersion region over Henan Province. The calculated divergence value amounts to 4×10⁻⁵ s-1. This upper-level divergence pattern favors the development of convective systems in the middle and lower troposphere. At 500 hPa (Figure 5B), Henan province encounters weak synoptic forcing. The western North Pacific subtropical high (WNPSH) is positioned near the Korean Peninsula, exhibiting an apparent positive anomaly while its ridge line currently locates approximately 10 latitudes northward from its perennial location around 28°N, specifically around 38°N. Additionally, Typhoon In-Fa (No. 202106) intensifies over Taiwan’s eastern sea while Typhoon Cempaka (No.202107) lingers along South China’s coast. However, In-Fa exhibits significantly greater strength compared to Cempaka. This configuration involving an upper trough, typhoons, and WNPSH constitutes a stable and persistent large-scale circulation pattern. At 850 hPa (Figure 5C), a pronounced convergence of wind fields is observed within 5 latitudes north of typhoon In-Fa, with wind speeds surpassing the annual average by approximately 1.5 m·s-1. Furthermore, a robust westerly jet emanates from around 15°N, veers northwards near 130°E, and merges into the circulation of In-Fa. A southeasterly wind channel forms between the maximum wind speed region on the northern flank of the typhoon and the southern side of WNPSH extending towards Henan province. Notably, this channel exhibits significantly higher wind speeds compared to other areas, exhibiting positive anomalies of 0.6 m·s-1.
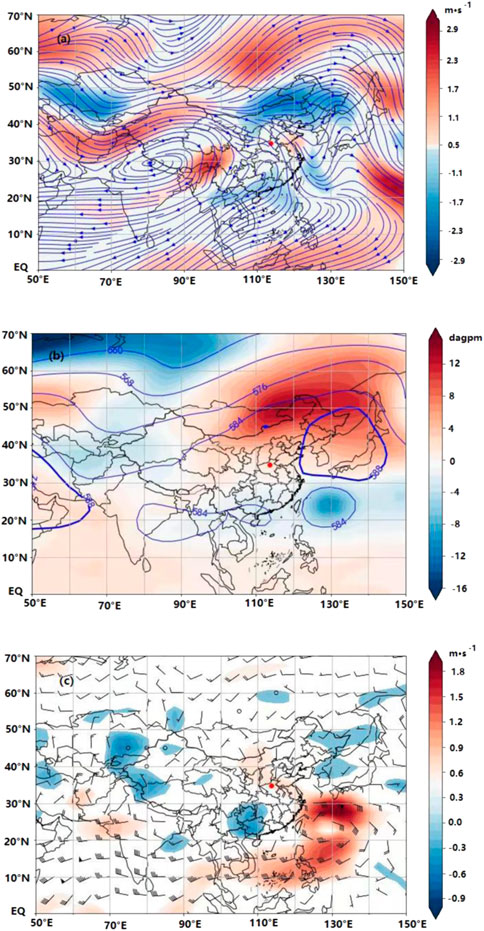
FIGURE 5. 200 hPa wind fields (a, unit: m s-1), 500 hPa height fields (b, unit: dagpm), and 850 hPa wind fields (c, unit: m s-1) during July 19–21, 2021. Shaded areas represent anomalies relative to the monthly mean in July of 2000–2021 based on the NCEP data. Zhengzhou City is indicated by the red dot.
Considering that the forecasting skills in precipitation are closely associated with the atmospheric circulation systems, we will analyze the predicted atmospheric circulation at 200hPa, 500hPa, and 850 hPa. Based on the analysis conducted in Section 3, although there are significant differences in the distribution and intensity of predicted rainfall among the five models, they all can predict precipitation 1–2 weeks ahead. Therefore, we will focus on the predicted atmospheric circulation within a lead time of 1–2 weeks.
Figure 6 illustrates the predicted streamlines at 200 hPa and their deviation from the observed conditions. In most models, the positioning of the high latitude trough and the South Asian High closely aligns with actual conditions at a 1-week lead time, resulting in diverging air flow over Henan. The predicted values of streamlines over Henan, however, are generally lower than the actual values by about 1–4 m·s-1 (Figures 6a1–e1). At the 2-week lead time, except for the UKMO model showing the westward deviation of 200 hPa high latitude trough, all other models correctly predict the trough. However, there was significant variation among models in predicting the location of the South Asian high, which directly impacted divergence over Henan. The forecasting ability of each model was evaluated using the eastern ridge point of the South Asian high as an indicator (Table 3). The eastern ridge point of the South Asian high is 107°E, and the model predictions at the 1-week lead time exhibit remarkable similarity to the observed conditions. At the 2-week lead time, the KMA model predicts a position 1 longitude westward, while the other models predict a position 2-4 longitudes eastward, resulting in changes to the airflow divergence pattern over Henan. As can be seen from Figures 6a2–e2, the ECMWF, KMA, and UKMO models can indicate minimal divergence situations over Zhengzhou. However, the CMA and NCEP models predict that Zhengzhou is below the southwest airflow in front of the upper trough. Additionally, the deviation of the predicted D-values of streamlines over Zhengzhou has increased to about 2–6 m·s-1.
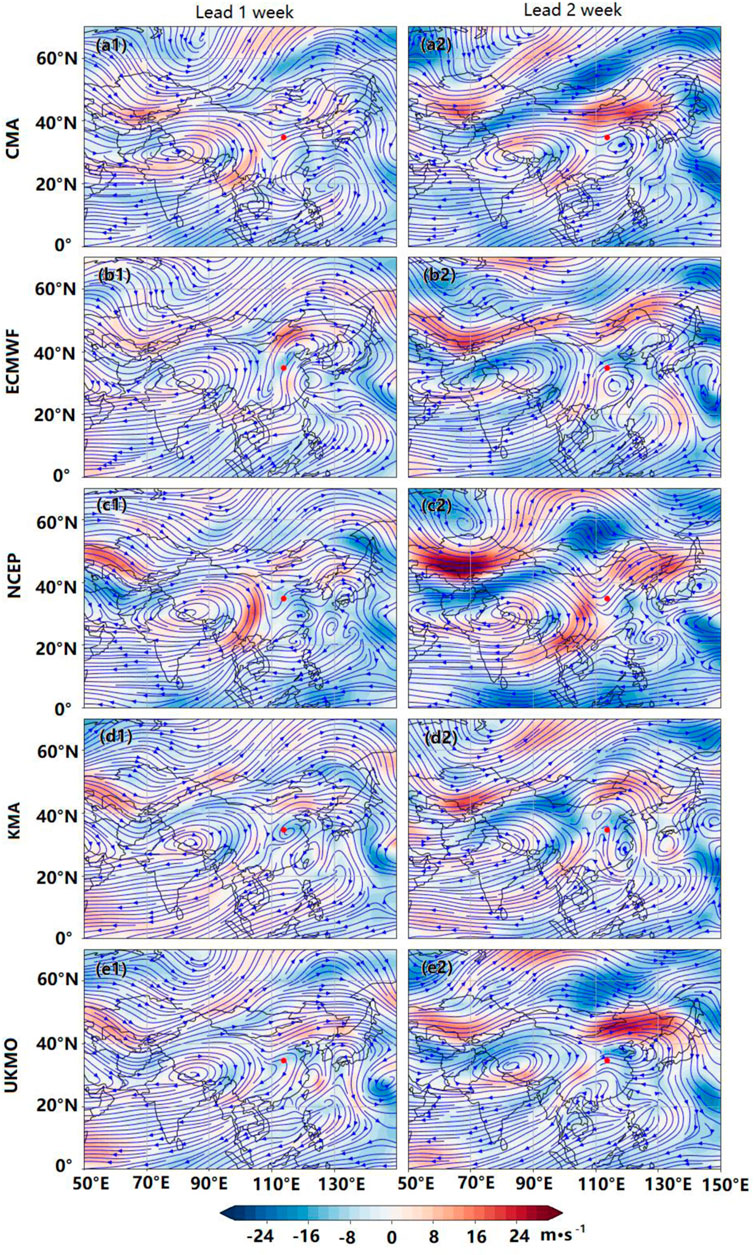
FIGURE 6. Predicted 200 hPa wind streamlines (unit: m s-1) at the lead times of 1 and 2-week during July 19-21, 2021, from the model CMA (a1, a2), ECMWF (b1, b2), NCEP (c1, c2), KMA (d1, d2) and UKMO (e1, e2). Shaded areas represent the difference between the forecasts and the actual conditions. Zhengzhou is symbolized by the red dot.
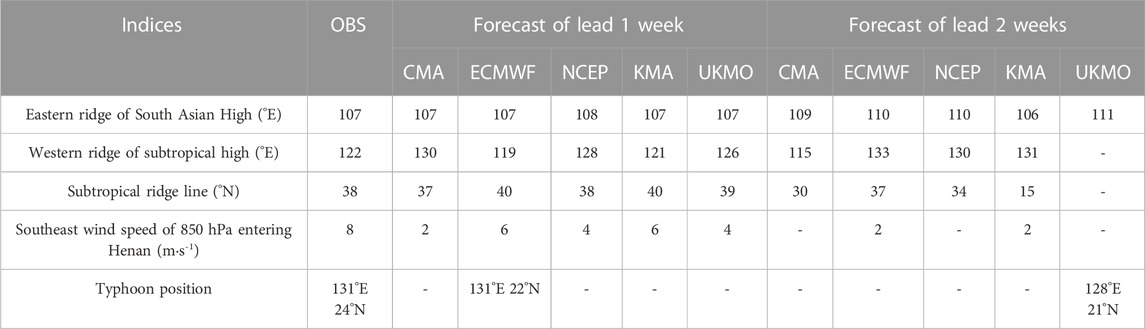
TABLE 3. Five indices of observations and predictions with lead times of 1–2 weeks by 5 models (- indicates a prediction failure).
The predicted height fields and their difference from the actual situation at 500 hPa of 5 models are presented in Figure 7. With a lead time of 1–2 weeks, all models predict a weakly forcing environment in Henan Province, which is consistent with the observations. However, there are differences in the predicted positions of the WNPSH. At a lead time of 1 week, ECMWF (Figure 7b1) and KMA (Figure 7d1) predictions align with observations (Figure 5B), while other models slightly shift eastward, particularly the CMA model (Figure 7a1). At a lead time of 2 weeks, the CMA model predicts that the position of the WNPSH extends westward into the inland (ridge line 30°N), whereas other models indicate an eastward extension. Furthermore, most models cannot predict the closed circulation of Typhoon In-Fa in the western North Pacific. The predicted geopotential height at the typhoon position is about 6–10 dagpm higher than the observation. This indicates that the five models have poor abilities to predict typhoons at both one and 2-week lead times.
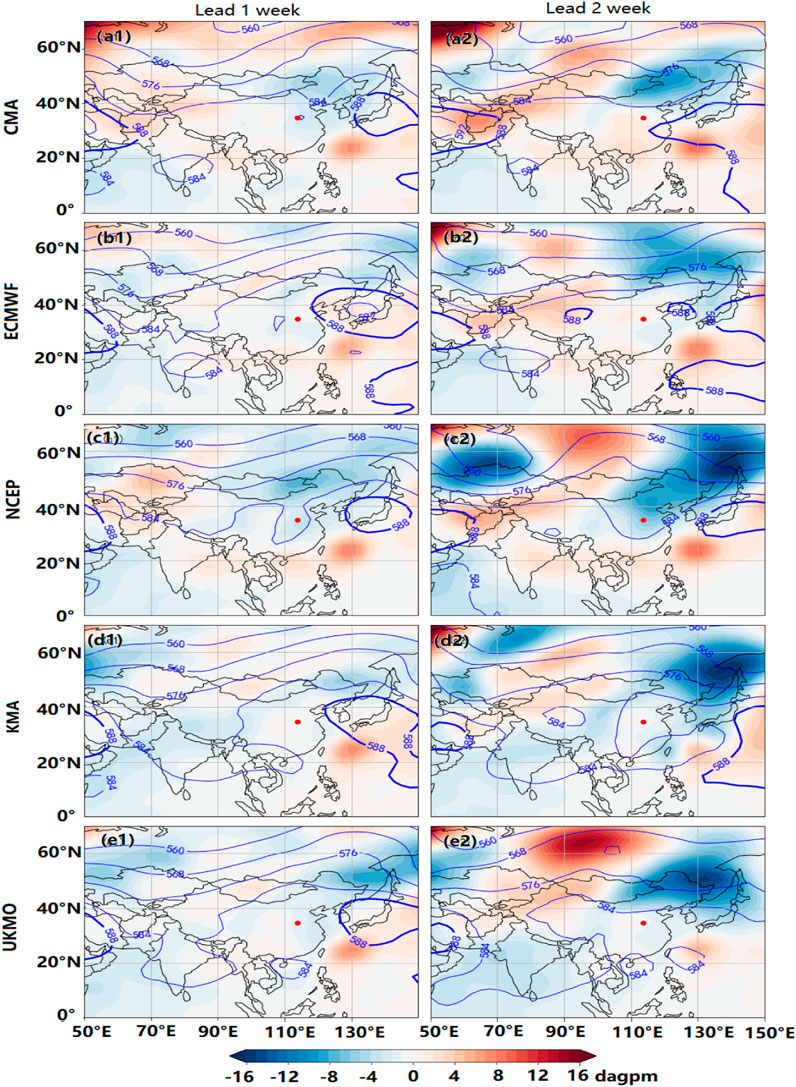
FIGURE 7. Predicted 500 hPa height fields (unit: dagpm) at the lead times of 1-and 2-week during July 19-21, 2021, from the model CMA (a1, a2), ECMWF (b1, b2), NCEP (c1, c2), KMA (d1, d2) and UKMO (e1, e2). Shaded areas represent the difference between the forecasts and the actual conditions. Zhengzhou is symbolized by the red dot.
To quantitatively characterize the forecasting ability of the model for the WNPSH and Typhoon IN-FA at 500hPa, the westward extension ridge point and the ridge line of the WNPSH are taken as the indexes describing the subtropical high. The forecast position of the typhoon is taken as the index of the ability to predict the typhoon. These three indices are listed in Table 3. The western extension of the subtropical high is located at 122°E. At a lead time of 1 week, the deviation in forecasts from ECMWF, and KMA is within 3 longitudinal degrees, while CMA and NCEP forecasts show deviations within 6–8 longitudinal degrees. The ridge line of the subtropical high is approximately at 38°N with all models exhibiting prediction deviations within 2 latitudinal degrees. This indicates that forecasts for the ridge line of the subtropical high are more accurate compared to those for its western extension. One week in advance, only the ECMWF model predicts the typhoon’s circulation, and other models fail to predict it. Additionally, all models demonstrate limited predictive ability at a lead time of 2 weeks.
The predicted wind fields at 850 hPa are presented in Figure 8, along with their deviation from the observed conditions. One week ahead, all models successfully capture the presence of a westerly jet near 15°N and a southeasterly airflow between the subtropical high and the typhoon extending inland from the western North Pacific. However, both features are underestimated compared to observations, particularly on the northern side of the typhoon where predicted wind speeds are 5–15 m·s-1 lower than actual values (Figures 8a1–e1). Two weeks ahead, ECMWF, KMA, and UKMO models continue to predict the westerly flow near 15°N and southeast flow originating from the western North Pacific. However, CMA and NCEP models exhibit weaker performance in capturing these flows (Figures 8a2–e2). The southeast wind speed of 850 hPa entering Henan province is utilized as an indicator to assess the predictive ability of the models for this airflow (Table 3). The observed southeast wind speed entering Henan is 8 m·s-1, which exceeds the forecasts provided by all models. Among them, ECMWF and KMA exhibit relatively better performance in forecasting this airstream, with a deviation of only 2 m·s-1 at a lead time of 1 week. Conversely, the forecast accuracy of other models is comparatively weak. Two weeks ahead, the southeast wind flow entering Henan can be highly unpredictable by five models, with the ECMWF and KMA indicating wind speed of only 2 m·s-1.
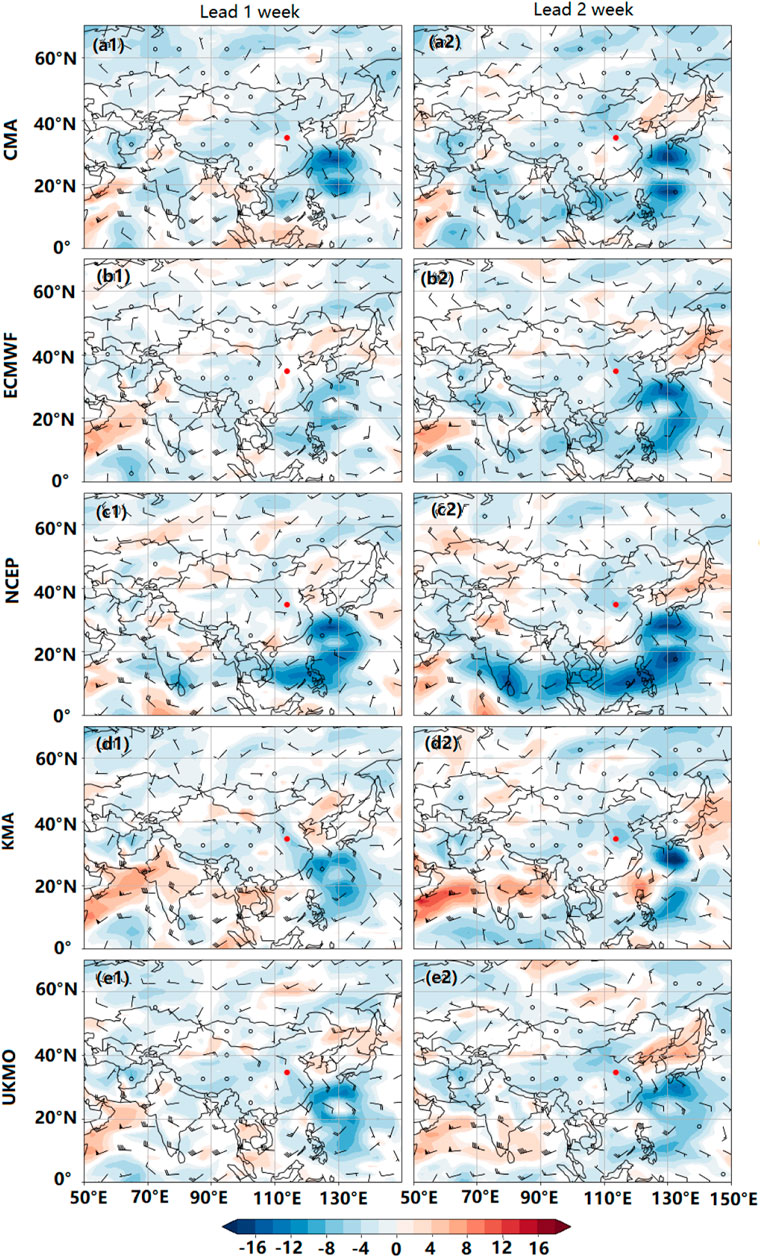
FIGURE 8. Predicted 850 hPa wind fields (unit: m s-1) at the lead times of 1- and 2-week during July 19-21, 2021, from the model CMA (a1, a2), ECMWF (b1, b2), NCEP (c1, c2), KMA (d1, d2) and UKMO (e1, e2). Shaded areas represent the difference between the forecasts and the actual conditions. Zhengzhou is symbolized by the red dot.
Based on the above analysis, discrepancies are examined in the prediction of large-scale circulation patterns associated with the rainstorm area, including the divergence field at 200hPa, the location of the WNPSH, typhoon intensity at 500hPa, and the southeast jet stream at 850 hPa. The configuration and interaction of these systems contribute to this extreme precipitation event. However, the five models fail to accurately predict these systems, indicating their limited understanding of the underlying mechanisms within atmospheric circulation and subsequently impacting precipitation forecasts.
4.2 Water vapor transport
A continuous water vapor supply is essential for prolonged precipitation events lasting several days. In this extreme event, the water vapor in Henan is mainly derived from southeast airflows originating between the WNPSH and Typhoon In-Fa over the western North Pacific. To illustrate the transportation of water vapor, we consider 925 hPa as an example. Figure 9 clearly shows a significant area of moisture flux surrounding the typhoon. The largest moisture flux value exceeding 3.4 kg·m-2·s-1 is observed to the north of the storm, accompanied by easterly wind speed reaching a maximum of 20 m·s-1. Southeasterly winds from the north area of the typhoon transporting water vapor toward the rainstorm region in the northwest direction, play a crucial role in this extreme event. After traversing a considerable distance, when these southeast airflows reach Henan province, their associated moisture flux value decreases to approximately 1.4 kg·m-2·s-1. Due to the presence of mountainous terrain on the western side of Henan province, this airflow encounters obstruction and converges in front of them (Wang et al., 2023). Furthermore, this stable atmospheric condition persisted for a week, leading to exceptional precipitation events within the province.
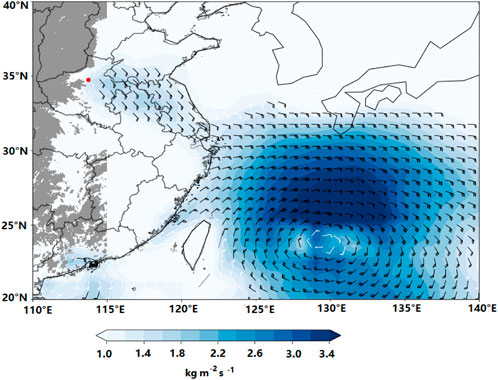
FIGURE 9. Averaged wind fields (unit: m s–1) and moisture fluxes (shaded, unit: kg·m-2 s-1) at 925 hPa from July 19 to 21, 2021. White wind bars represent wind speeds below 8 m s–1 while black bars represent wind speeds above 8 m s–1. The grey area denotes a mountainous region with an altitude exceeding 300 m. Zhengzhou is symbolized by the red dot.
Figure 10 illustrates the predicted wind fields and moisture flux at 925 hPa of the five models. It is evident from the figure that all models generally underestimate the observed moisture flux at 1–2 weeks lead time. The observational large moisture flux on the northern side of the typhoon poses challenges to model prediction accuracy. At 1 week in advance, except for the CMA model, other models can predict southeast airflow originating from the western North Pacific towards inland regions (Figures 10A1–E1). However, their predicted intensity of moisture flux remains weaker than actual conditions. Comparatively, ECMWF and KMA demonstrate better predictions with only 2.0 kg·m-2·s-1, which was 1.4 kg·m-2·s-1 lower than the observed value. Consequently, less water vapor is transported to rainstorm areas in Henan province. None of the models can predict this southeast airflow 2 weeks in advance, which could potentially account for the weaker precipitation intensity. This can be attributed to their inability to forecast typhoon circulation, thus impeding the aggregation of water vapor around the typhoon. The five models exhibit limitations in accurately predicting easterly wind speeds, despite ECMWF and KMA indicating the largest significant wind speed of only 12 m·s-1.
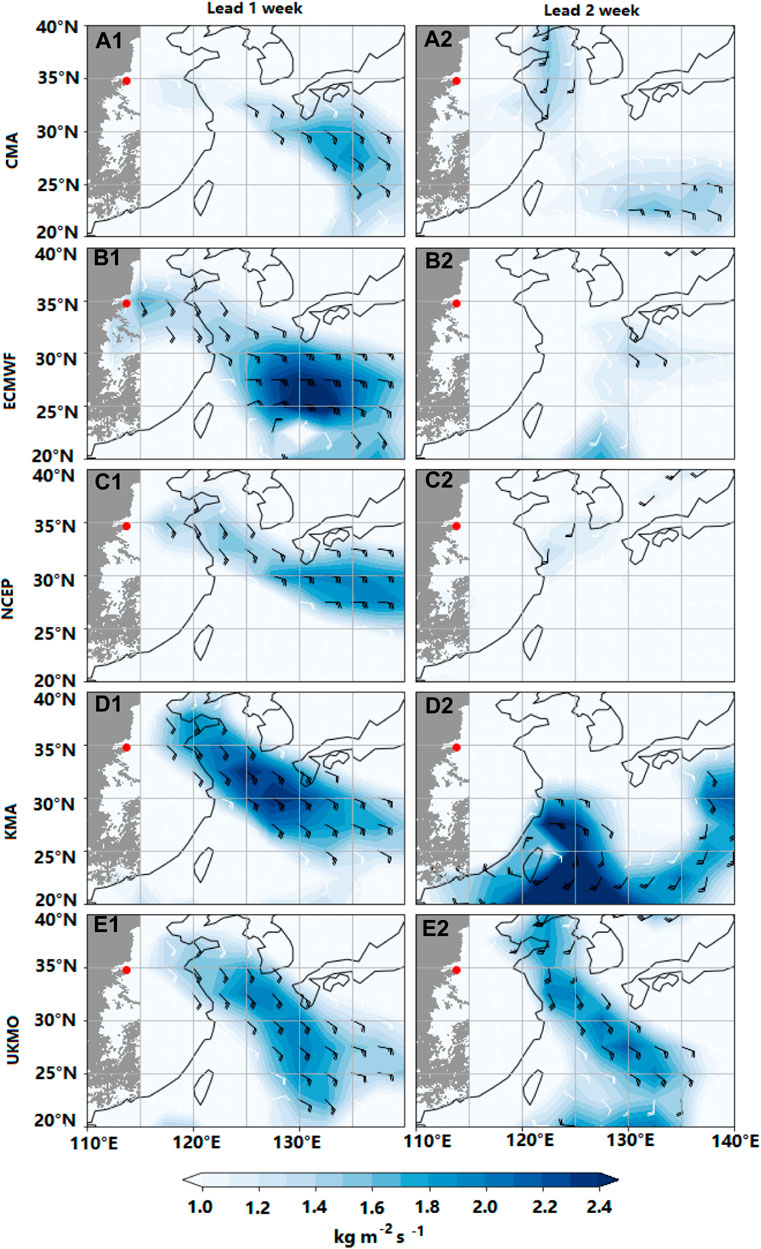
FIGURE 10. Predicted 925 hPa wind fields (unit: m s–1) and moisture fluxes (shaded, unit: kg·m-2 s-1) at 1- and 2-week lead times during July 19-21, 2021, by the model CMA (A1,A2), ECMWF (B1,B2), NCEP (C1,C2), KMA (D1,D2) and UKMO (E1,E2). The grey area denotes a mountainous region with an altitude exceeding 300 m. Zhengzhou is symbolized by the red dot.
4.3 Sea surface temperature
The latest studies have revealed that precipitation in Central China is positively correlated with sea surface temperature (SST) in the western North Pacific and equatorial western Pacific. Conversely, a negative correlation has been observed between precipitation and SST in most sea areas east of Japan (Zhang et al., 2019). This highlights the close relationship between Central China’s precipitation and SST. Huang et al. (2013) suggested that the Beijing Climate Center Atmospheric General Circulation Model (BCC_CSM) could successfully predict extreme precipitation events. However, when the SST increases by 0.5°C, there is a notable deviation between simulated atmospheric circulation and observations, leading to discrepancies in both precipitation area and intensity. Li et al. (2020) have emphasized that local sea surface temperature in the western North Pacific positively influences the WNPSH, which intensifies and extends westward with increasing SST values.
Figure 11 shows the averaged SST distribution of this event. SST exceeds 28°C in the western North Pacific, surpassing 30°C on Taiwan’s eastern side. Typhoon In-Fa is located near the continental border of the western North Pacific Ocean with a sea temperature of 26°C. The maximum SST recorded for the Sea of Japan reaches approximately 24°C, corresponding to the position of the WNPSH. SST exceeds 28°C in the continental border of the Bay of Bengal, where the SST in this region is associated with moisture transport. Therefore, we pick these three rectangles (the Sea of Japan, the western North Pacific and the Bay of Bengal) to analyze model prediction discrepancies. The ECMWF, NCEP, and UKMO can successfully forecast SST centers above 30°C over the western North Pacific, while only the CMA model exhibits weaker performance in this regard (Supplementary Figure S1). The observed SST of 26°C is close to the Chinese mainland boundary. However, there is a certain distance between the predicted SST of 26°C and the coastline. This deviation resulted in underestimated SST values near the coast and lead to an unsatisfactory in typhoon prediction. As shown in Table 4, all models predict lower SST values of the western North Pacific compared to observations at both 1- and 2-week lead times. The models also significantly underestimate the Sea of Japan’s SST values. The CMA predicts the largest deviation of −3.2°C 1 week ahead, while the NCEP shows a deviation of −3.3°C 2 weeks ahead. Consequently, these discrepancies result in the prediction of a more easterly and weaker WNPSH. The models’ prediction ability for the SST in the western North Pacific and the Sea of Japan is not as good as that in the Bay of Bengal. Among them, UKMO demonstrates superior performance in predicting SST while the CMA model exhibited poorer predictive ability. The failure to accurately forecast SST by these models consequently hinders their capability to capture large-scale atmospheric circulation and ultimately leads to discrepancies in precipitation prediction.
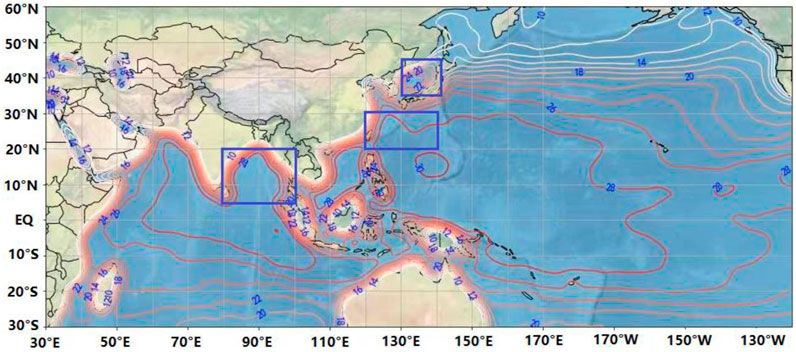
FIGURE 11. Averaged SST (unit: °C) distribution of the extreme rainfall from July 19 to 21, 2021. The rectangular regions represent the Sea of Japan (130–140°E, 35–45°N), the western North Pacific (120–140°E, 20–30°N), and the Bay of Bengal (80–100°E, 5–20°N).
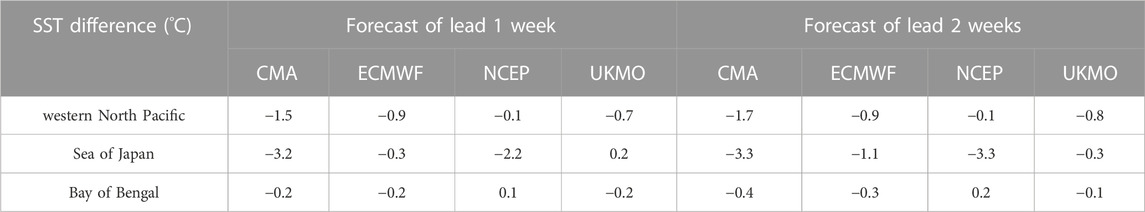
TABLE 4. SST difference between the forecasts and the observations in 3 areas by 4 models. The KMA model has no SST data.
5 Conclusion and discussion
Based on the real-time data of 5 models from the S2S prediction project, this study evaluated the sub-seasonal forecasting skills for an extreme precipitation event in Henan province. First, we find that all models are unable to accurately predict the extreme value of precipitation associated with this event. However, four models (ECMWF, NCEP, UKMO, and KMA) can predict the spatial distribution of accumulated precipitation 1 week in advance. The NCEP and CMA demonstrate valuable predictions up to 2–3 weeks in advance. The NCEP model exhibits superior forecasting skill, as evidenced by the comprehensive analysis of the five models.
Then, we explored potential factors contributing to variations in prediction skills among these models by examining atmospheric circulation, water vapor transport, and SST conditions. All models tend to predict the positions of the WNPSH and Typhoon In-Fa further eastwards. Both ECMWF and KMA exhibit better forecasting skills in predicting the WNPSH, while only the ECMWF demonstrates the ability to predict the typhoon’s circulation. The models fail to accurately predict the circulation of In-Fa, thereby impeding the ability to forecast the aggregation of water vapor surrounding it. This directly impacts the prediction of water vapor intensity transported by the southeast airflow. Except for CMA, other models can predict the weaker southeast airflow towards Henan 1 week ahead. It can be clearly seen that the remote impacts of Typhoon In-Fa and moisture fluxes on this extreme event have been demonstrated to be underestimated. Yan et al. (2023) suggested that the prediction bias of the typhoon’s moving speed distorted the typhoon’s location, leading to an inaccurate prediction of the moisture convergence center. We believe that this is one reason for the weak precipitation forecast of the models, and more importantly, the specific discrepancies between 5 S2S models in predicting the configuration and interaction of the influencing systems. The UKMO demonstrates superior performance in predicting SST. The deviations in predicting SST by models may result in discrepancies in predicting the precipitation.
The critical point for this kind of regional extreme precipitation is whether its probability will increase as global warming increases. Our analysis suggests that the sub-seasonal prediction capability of the 5 S2S models for this extreme precipitation event extends up to 1–2 weeks ahead, consistent with Wang et al. (2022). They introduced the Tanimoto Coefficient (TC) to evaluate the prediction performance of 5 S2S models, finding that models could capture this event signal 6 days in advance. Meanwhile, Wu et al. (2023) also evaluated this event, indicating that the July 2021 event was predictable and well predicted in a 5-day deterministic operational forecast by the Met Office global model. However, there are notable discrepancies in the falling area of the heavy precipitation and its extreme value. These studies collectively indicate that current sub-seasonal numerical models can roughly identify regions prone to intense precipitation about 1 week beforehand but are unable to accurately predict extreme rainfall values. The results may have broader implications. To enhance the prediction ability of the model, it is imperative to accurately forecast its large-scale circulations, water vapor, and the dynamic conditions that may influence precipitation to the greatest extent possible. Additionally, numerical model prediction depends on initial and boundary conditions, and proper sub-seasonal predictions also require realistic air-sea coupling interactions.
The prediction skills among the five models for this extreme event are different, and all models indicate a decline in prediction skills with increasing lead time. Other affecting reasons, internal causes such as dynamic and thermal conditions, and external forcing such as the South Asian monsoon and MJO propagating eastwards along the equator, are not considered. At the same time, models’ forecasting skills may differ from their initial fields, analysis, or diagnosis modules and schemes. It is important to note that our conclusions are specific to this case and should not be generalized. Therefore, further investigations should be carried out to evaluate more extreme events at a sub-seasonal scale, which can contribute to enhancing and optimizing prediction skills within the S2S prediction project.
Data availability statement
The original contributions presented in the study are included in the article/Supplementary Material, further inquiries can be directed to the corresponding author.
Author contributions
LZ: conceptualization, methodology, investigation, writing original draft, funding acquisition, writing-review and editing. TL: conceptualization, investigation, funding acquisition, writing original draft, visualization, writing-review and editing. DL: conceptualization, methodology, visualization, data curation, resources, editing. All authors contributed to the article and approved the submitted version.
Funding
Supported by the Natural Science Foundation of Shandong Province (ZR2021MD012), the projects of Shandong Meteorological Bureau (2020SDQN12 and 2021SDYD23).
Conflict of interest
The authors declare that the research was conducted in the absence of any commercial or financial relationships that could be construed as a potential conflict of interest.
Publisher’s note
All claims expressed in this article are solely those of the authors and do not necessarily represent those of their affiliated organizations, or those of the publisher, the editors and the reviewers. Any product that may be evaluated in this article, or claim that may be made by its manufacturer, is not guaranteed or endorsed by the publisher.
Supplementary material
The Supplementary Material for this article can be found online at: https://www.frontiersin.org/articles/10.3389/feart.2023.1241202/full#supplementary-material
References
Blanchet, J., Blanc, A., and Creutin, J. D. (2021). Explaining recent trends in extreme precipitation in the Southwestern Alps by changes in atmospheric influences. Weather Clim. Extrem. 33, 100356. doi:10.1016/j.wace.2021.100356
Dacre, H. F., Clark, P. A., Martinez-Alvarado, O., Stringer, M. A., and Lavers, D. A. (2015). How do atmospheric rivers form? Bull. Am. Meteorol. Soc. 96, 1243–1255. doi:10.1175/BAMS-D-14-00031.1
Ding, Y. H. (2015). On the study of the unprecedented heavy rainfall in Henan Province during 4-8 August 1975: Review and assessment. Acta. Meteor. Sin. 73 (3), 411–424 [in Chinese]. doi:10.11676/qxxb2015.067
Gimeno, L., Nieto, R., Vázquez, M., and Lavers, D. (2014). Atmospheric rivers: a mini-review. Front. Earth Sci. 2. doi:10.3389/feart.2014.00002
Huang, A., Zhang, Y., Wang, Z., Wu, T., Huang, D., Zhou, Y., et al. (2013). Extended range simulations of the extreme snow storms over southern China in early 2008 with the BCC_AGCM2.1 model. J. Geophys. Res. Atmos. 118, 8253–8273. doi:10.1002/jgrd.50638
Huang, B., Thorne, P. W., Banzon, V. F., Boyer, T., Chepurin, G., Lawrimore, J. H., et al. (2017). Extended reconstructed Sea surface temperature, Version 5 (ERSSTv5): upgrades, validations, and intercomparisons. J. Clim. 30, 8179–8205. doi:10.1175/JCLI-D-16-0836.1
Kalnay, E., Kanamitsu, M., Kistler, R., Collins, W., Deaven, D., Gandin, L., et al. (1996). The NCEP/NCAR 40-year reanalysis project. Bull. Am. Meteorol. Soc. 77, 437–471. doi:10.1175/1520-0477(1996)077<0437:TNYRP>2.0.CO;2
Lei, L., Nan, X., Xuan, Z., Ji-song, S., Liang, D., Hao, J., et al. (2020). A study on the warm-sector torrential rainfall during 15-16 July 2018 in Beijing area. Acta Meteoro. Sin. 78 (1), 1–17. doi:10.11676/qxxb2020.001
Li, H., Xu, F., and Lin, Y. (2020). The impact of SST on the zonal variability of the western pacific subtropical high in boreal summer. J. Geophys. Res. Atmos. 125. doi:10.1029/2019JD031720
Liu, D., Pang, L., and Xie, B. (2009). Typhoon disaster in China: prediction, prevention, and mitigation. Nat. Hazards 49, 421–436. doi:10.1007/s11069-008-9262-2
Luo, Y., and Chen, Y. (2015). Investigation of the predictability and physical mechanisms of an extreme-rainfall-producing mesoscale convective system along the Meiyu front in East China: an ensemble approach. J. Geophys. Res. 120, 10,593–10,618. doi:10.1002/2015JD023584
Luo, Y., Gong, Y., and Zhang, D. L. (2014). Initiation and organizational modes of an extreme-rain-producing mesoscale convective system along a mei-yu front in East China. Mon. Weather Rev. 142, 203–221. doi:10.1175/MWR-D-13-00111.1
MacLeod, D. A., Jones, A., Di Giuseppe, F., Caminade, C., and Morse, A. P. (2015). Demonstration of successful malaria forecasts for Botswana using an operational seasonal climate model. Environ. Res. Lett. 10, 044005. doi:10.1088/1748-9326/10/4/044005
Niu, R., Zhai, P., and Tan, G. (2021). Anomalous features of extreme meiyu in 2020 over the yangtze-huai river basin and attribution to large-scale circulations. J. Meteorol. Res. 35, 799–814. doi:10.1007/s13351-021-1018-x
Robertson, A. W., Kumar, A., Peña, M., and Vitart, F. (2014). Improving and promoting sub-seasonal to seasonal prediction. Bull. Am. Meteorol. Soc. 96, ES49–ES53. doi:10.1175/bams-d-14-00139.1
Simmons, A. J., and Hollingsworth, A. (2002). Some aspects of the improvement in skill of numerical weather prediction. Q. J. R. Meteorol. Soc. 128, 647–677. doi:10.1256/003590002321042135
Sun, J. H., Zhao, S. X., Fu, S. M., Wang, H. J., and Zheng, L. L. (2013). Multi-scale characteristics of record heavy rainfall over Beijing area on July 21, 2012. Chin. J. Atmos. Sci. 37 (3), 705–718 [in Chinese]. doi:10.3878/j.issn.1006-9895.2013.12202
Vitart, F. (2017). Madden—julian Oscillation prediction and teleconnections in the S2S database. Q. J. R. Meteorol. Soc. 143, 2210–2220. doi:10.1002/qj.3079
Wang, X., Li, S., Liu, L., Bai, H., and Feng, G. (2022). The performance of S2S models on predicting the 21.7 extreme rainfall event in henan China. Atmos. (Basel) 13, 1516. doi:10.3390/atmos13091516
Wang, X., Zheng, Y., Fan, L., Zhu, H., Yu, X., Su, A., et al. (2023). The key mesoscale systems and mesoscale vortices of the henan extreme precipitation in 2021. Sustainability 15, 4875. doi:10.3390/su15064875
Wu, H. P., Shu, J., Gu, Y., and Hu, S. L. (2009). The effects of different cumulus parameterization schemes in WRF on heavy rainfall in Hunan Province. J. Trop. Meteor 25 (2), 175–180. doi:10.1016/S1003-6326(09)60084-4
Wu, P., Clark, R., Furtado, K., Xiao, C., Wang, Q., and Sun, R. (2023). A case study of the July 2021 Henan extreme rainfall event: from weather forecast to climate risks. Weather Clim. Extrem. 40, 100571. doi:10.1016/j.wace.2023.100571
Yan, Y., Zhu, C., and Liu, B. (2023). Subseasonal predictability of the July 2021 extreme rainfall event over Henan China in S2S operational models. J. Geophys. Res. Atmos. 128. doi:10.1029/2022JD037879
Ying, M., Zhang, W., Yu, H., Lu, X., Feng, J., Fan, Y. X., et al. (2014). An overview of the China meteorological administration tropical cyclone database. J. Atmos. Ocean. Technol. 31, 287–301. doi:10.1175/JTECH-D-12-00119.1
Yu, L., and Zhong, S. (2021). Trends in Arctic seasonal and extreme precipitation in recent decades. Theor. Appl. Climatol. 145, 1541–1559. doi:10.1007/s00704-021-03717-7
Zhang, D. L., Lin, Y., Zhao, P., Yu, X., Wang, S., Kang, H., et al. (2013). The Beijing extreme rainfall of 21 July 2012: right results but for wrong reasons. Geophys. Res. Lett. 40, 1426–1431. doi:10.1002/grl.50304
Zhang, D. Q., Sun, F. H., and Zhang, Y. C. (2019). Evaluation of seasonal prediction for summer rainfall in China based on BCC second–generation short–range climate forecast system. Plateau Meteorol. 38 (6), 1229–1240 [in Chinese]. doi:10.7522/j.issn.1000-0534.2018.00149
Zhao, S. X., Sun, J. H., Lu, R., and Fu, S. M. (2018). Analysis of the 20 July 2016 unusual heavy rainfall in North China and Beijing. Meteor. Mon. 44 (3), 351–360 [in Chinese]. doi:10.7519/j.issn.1000-0526.2018.03.002
Zhou, Y., Yang, B., Chen, H., Zhang, Y., Huang, A., and La, M. (2019). Effects of the Madden–Julian Oscillation on 2-m air temperature prediction over China during boreal winter in the S2S database. Clim. Dyn. 52, 6671–6689. doi:10.1007/s00382-018-4538-z
Zhu, Z., Zhong, Z., and Ha, Y. (2017). Relationship between typhoon cyclone during Meiyu period over the Northwest Pacific and Jianghuai Meiyu. J. Meteor. Sci. 37, 522–528 [in Chinese]. doi:10.3969/2016jms.0060
Keywords: sub-seasonal prediction, extreme precipitation event, forecasting skill, large-scale atmospheric circulation, water vapor transport, SST
Citation: Zheng L, Li T and Liu D (2023) Evaluation of sub-seasonal prediction skill for an extreme precipitation event in Henan province, China. Front. Earth Sci. 11:1241202. doi: 10.3389/feart.2023.1241202
Received: 16 June 2023; Accepted: 03 November 2023;
Published: 27 December 2023.
Edited by:
Wei Zhang, Utah State University, United StatesReviewed by:
Peili Wu, Met Office Hadley Centre (MOHC), United KingdomGuicai Ning, Nanjing University of Information Science and Technology, China
Copyright © 2023 Zheng, Li and Liu. This is an open-access article distributed under the terms of the Creative Commons Attribution License (CC BY). The use, distribution or reproduction in other forums is permitted, provided the original author(s) and the copyright owner(s) are credited and that the original publication in this journal is cited, in accordance with accepted academic practice. No use, distribution or reproduction is permitted which does not comply with these terms.
*Correspondence: Tian Li, bGl0aWFuQGpuLnNoYW5kb25nLmNu