 D. Coppola
 D. Cardone
 M. Laiolo
 S. Aveni1,4
 A. Campus
 F. Massimetti
95% of researchers rate our articles as excellent or good
Learn more about the work of our research integrity team to safeguard the quality of each article we publish.
Find out more
ORIGINAL RESEARCH article
Front. Earth Sci. , 06 October 2023
Sec. Volcanology
Volume 11 - 2023 | https://doi.org/10.3389/feart.2023.1240107
This article is part of the Research Topic Reviews in Volcanology: 2023 View all 4 articles
Since 2000, the Moderate Resolution Imaging Spectroradiometer (MODIS) has acquired infrared images of the Earth’s surface daily. These data have made it possible to measure the thermal energy radiated by the world’s most famous volcanoes and also to discover and track eruptions in remote and poorly monitored regions. In this work, we present the database of Volcanic Radiative Power (VRP, in W) time series, recorded by the MIROVA (Middle Infrared Observation of Volcanic Activity) system over 2 decades of MODIS observations (2000–2019) at 111 active volcanoes. The database reveals that globally, the number of thermally active volcanoes each year varies between 60 and 80, almost equally partitioned between volcanoes with a basic (50%) and intermediate (45%) composition, while only 5% is represented by volcanoes erupting acidic lavas. Within the investigated period, the global-scale heat flux was almost stationary, and occasionally punctuated by peaks associated with the largest effusive eruptions (e.g., Bardarbunga and Kilauea). The Volcanic Radiative Energy (VRE, in J) emitted by basic volcanoes (∼1.8 × 10¹⁸ J) in 20 years constitutes 91% of the total, while intermediates and acids contribute only 8% (∼1.8 × 10¹⁷ J) and 1% (∼1.7 × 10¹⁶ J), respectively. A comparison with the volume of lava erupted effusively by the same volcanoes reveals that this difference is attributed to the lower efficiency in radiating thermal energy of increasingly acidic (viscous) lava bodies. Each compositional group is associated with a specific relationship between VRE and erupted volume which characterises most of the effusive volcanoes. On the other hand, some open-vent volcanoes reveal that much more heat is released than that theoretically radiated by the erupted lava. This imbalance (hereby called excess radiation) is attributed to an additional heat source, likely associated with an underlying convective magma column and/or to outgassing through a permeable conduit. We are convinced that the database presented in this work will be useful to support new emerging studies on global-scale volcanism and will contribute to a better understanding of each volcanic system.
Thermal energy is the main form of energy released or transformed during volcanic eruptions. It is typically estimated ex-post, based on the mass, composition, and temperature of the erupted products (e.g., Yokoyama, 1957; Pyle, 1995; Pyle, 2015). Being related to the mass of the erupted materials and, to a lesser extent, to the heat transferred by magmatic gases, its measurement has been often regarded as a proxy of the size of volcanic eruptions (Heffington et al., 1977; Pyle, 2015). Approximately one-third of the thermal energy of an eruption is lost by the cooling of magma above the solidification temperature (i.e., between about 750°C and 1,150°C), while the remaining two-thirds are released from magma in the solid state between ambient temperature and around 750°C. Gas dissolved in the magma possesses about 4% of the total thermal energy stored in a volcanic system (Heffington et al., 1977). Some estimates put the thermal energy of eruptions as 0.5%–2% of the energy released through the worldwide geothermal flux (Elder, 1976; Heffington et al., 1977; Verhoogen, 1980). Yet, these numbers are rather uncertain, being based on an independent evaluation of the global magma output rate (Crisp, 1984; White et al., 2006).
Nonetheless, the thermal power released during eruptions (i.e., heat emitted per unit of time; in Watts) is a crucial parameter since it has proved to be intimately linked to the lava discharge rate during effusive eruptions (Harris and Baloga, 2009), to the height of ash plumes during explosive events (Wilson et al., 1978), or to the rate of gas emissions at persistently degassing volcanoes (Stevenson, 1993).
Direct measurement of the thermal power during an ongoing eruption is challenging. It requires monitoring several volcanic phenomena that i) release very different kinds of erupted products (lava, ash, pyroclastic flows, gas, etc.), ii) occur on highly variable spatial and temporal scales, and iii) are characterised by multiple forms of heat transport (radiation, convection, conduction, advection). For example, basaltic eruptions are associated with widespread lava flows which lose large amounts of heat through radiation and convection in the atmosphere (Dragoni, 1989; Harris and Rowland, 2009). Conversely, explosive eruptions rapidly transfer the heat to the air mass entrained in the buoyant rising ash plumes (Wilson et al., 1978; Wilson, 1980). Volcanic gases also carry heat from the magmatic source to the atmosphere and during their ascent may transfer part of this heat through conduction into the low-conductivity host rocks (Stevenson, 1993; Henley and Hughes, 2016). These factors make it extremely complex to estimate the total thermal power associated with an eruption.
Since the 1960s, remote sensing techniques have shown the potential of being able to detect and measure at least a portion of the thermal power sourced by volcanic activity (e.g., Harris, 2013; Ramsey and Harris, 2013; Ramsey et al., 2021). In particular, it has become increasingly evident that sub-pixel spatial elements with temperatures above the background (called Volcanic Thermal features—VTFs—by Oppenheimer et al., 1993), are easily and safely detectable from space, making it possible to directly quantify their thermal radiation (Francis, 1989; Ramsey and Flynn, 2020).
However, it was only starting from 2000 that the potential of thermal remote sensing, applied to volcanic monitoring, began to be exploited on a global scale. Since its launch into orbit aboard TERRA and AQUA NASA’s satellites in the early 2000s, the MODIS (Moderate Resolution Imaging Spectroradiometer) sensor, has acquired infrared images of our planet four times per day, with a spatial resolution of 1 km (Justice et al., 1998). These multi-day datasets (two night-time and two day-time overpasses) allowed the development of the first, fully automatic systems (e.g., MODVOLC, MIROVA, FIRMS), capable of detecting the presence of high-temperature thermal anomalies on a global scale, including worldwide volcanic activity (Wright et al., 2002; Davies et al., 2009; Coppola et al., 2016a).
MODVOLC (Wright et al., 2002; Wright et al., 2004), was the primary automated hotspot detection system dedicated to volcanoes, allowing for the first time a direct estimation of the heat flux radiated into the atmosphere by multiple eruptions and volcanoes. The earliest estimates were based on the analysis of 45 volcanoes that were active between 2001 and 2002 (Wright and Flynn, 2004). The dataset was later updated to 65 volcanoes, for the period 2000–2006 (Wright and Pilger, 2008), and to 95 volcanoes for the period 2000–2013 (Wright et al., 2015). According to Wright et al., 2015, the baseline level of subaerial volcanic activity radiates approximately 0.38–0.96 GW (1–2.5 × 10¹⁵ J per month, in the original papers), ∼66% of which is produced by lava-flow forming eruptions. Wright et al., 2015 also underlined the great contribution produced by the Nyiragongo (Democratic Republic of Congo—DRC) lava lake alone (radiating 25% of the total in 2013) and the role of large basaltic eruptions (such as Bardarbunga (Iceland) and Tolbachik (Kamchatka)) which can radiate more than 2 × 10¹⁶ J, in few months of activity. Based on the most recent review from MODVOLC data, Kilauea (Hawaii), Nyiragongo (DRC), Nyamulagira (DRC), and Etna (Italy) volcanoes are placed at the top of the ranking as the largest heat emitters in the world.
The Middle Infrared Observations of Volcanic Activity (MIROVA) system, developed in 2014 (Coppola et al., 2016a), was born in the wake of MODVOLC and, although based on the same MODIS data, it differs from the latter in data processing and in the algorithm for detecting hotspots. In particular, the MIROVA algorithm is built to detect thermal anomalies of lower temperatures (or smaller areas) than MODVOLC at the expense of greater computational requirements. For this reason, MIROVA is not a fully global system like MODVOLC, but the volcanic targets have been selected (and are continuously updated) to include the most active volcanoes in the world (Coppola et al., 2020).
Notably, both systems are based on the measurement of electromagnetic radiation in the Middle InfraRed (MIR) and provide an estimate of the Volcanic Radiative Power (VRP in Watts) released by an eruption. The VRP proved to be a robust proxy of the ongoing surface activity in very different volcanic contexts, as it is intimately linked to the rate of lava and/or gas emissions. In particular, the VRP has been correlated with the lava discharge rate of effusive eruptions (Coppola et al., 2016a;b), with phases of rise and fall of lava lakes (Campion and Coppola, 2023), with magma migration at open-vent volcanoes (Laiolo et al., 2019; Naismith et al., 2019), with growth of lava domes and excess degassing at andesitic volcanoes (Coppola et al., 2022a; Valade et al., 2023), and with hydrothermal crises of fumarolic fields (Laiolo et al., 2017; Coppola et al., 2022b).
MIROVA is operational in Near-Real-Time (NRT) on more than 200 volcanoes and supports volcano observatories in evaluating the state of activity and in maintaining situational awareness during eruptive crises (Coppola et al., 2020). Yet, one of MIROVA’s goals is also to build and update a multi-year database of infrared satellite data at the most active volcanoes.
In this work, we present the first version of the MIROVA Database (v.1.0) which includes the time series of VRP recorded at 111 volcanoes between March 2000 and December 2019. The database is structured in three parts and can be freely downloaded from the website www.mirovaweb.it, or from a dedicated repository hosted at https://osf.io/zm62w/ (see Section 3).
In the next sections, after briefly explaining the used methodology and the limits of the database, we present an overview of the results on a global scale. This includes an analysis of the energies radiated in 20 years of volcanic subaerial activity of different compositional groups and their relationship with the erupted lava volumes.
MIROVA is an automatic volcanic hotspot detection system operating in real-time since 2014 (Coppola et al., 2016a). The system exploits thermal imageries acquired by the MODIS sensors aboard NASA’s platforms TERRA and AQUA, launched in March 2000 and May 2002, respectively. Both satellites are placed in a sun-synchronous polar orbit, providing up to four images per day (at the equator) with a spatial resolution of 1 km (at nadir) (Justice et al., 1998). Boasting a dual channel in the MIR portion of the spectrum (centred at 3.959 µm) and featuring low/high gain settings to maximize the range of unsaturated data, MODIS instruments have been widely defined as one of the most successful sensors for volcanological applications (Wright et al., 2002; Harris, 2013; Ramsey and Harris, 2013). MIROVA processes in Near-Real-Time (NRT) the MODIS scenes for a list of target volcanoes (>200), which have been chosen based on their recent/current activity, scientific interest, or following individual requests from volcanic observatories worldwide (see Coppola et al., 2020). For these targets, the time series of the
MODIS Level 1B calibrated radiances data are elaborated following four principal steps, namely: 1) search and download of MODIS granules, 2) cropping and resampling, 3) hot-spot detection, and 4) calculation of VRP. The structure of the algorithm can be summarised as follows: the Middle InfraRed (MIR—3.959 µm) and the Thermal InfraRed (TIR—12.02 µm) data matrices are first extracted from the original MODIS granules, and then resampled to regular 51 × 51 UTM grids centred on the volcano’s summit, as per coordinates provided by the Global Volcanism Program. (2023). This step is crucial to ensure that all pixels represent a ground area of 1 km2, minimizing the effect of geometrical distortions and making the
Once a pixel contaminated by a hotspot has been detected, the MIROVA algorithm firstly measures the excess of MIR radiance compared to the background. Very often, because the VTF is large enough or because of blurring of the satellite images (due to the sensor’s point spread function), several adjacent pixels can be detected by the algorithm. This effect is very important to take into consideration because it means that even a punctiform VTF can produce an excess of radiance that propagates not to one but to several pixels (Harris, 2013). Hence, the total excess radiance sourced by the whole VTF,
where Npix is the number of detected pixels,
With the anomalous pixels identified, and the total excess of radiance calculated, the Volcanic Radiative Power (VRP) is retrieved by applying the MIR method presented by Wooster et al. (2003) as:
where
The MIR method was initially introduced by Wooster et al. (2003) to estimate the Fire Radiative Power from satellite data, using a single band. According to the authors, this method estimates the radiant power of a hot source with an error of ±30%, provided that the hot emitter has an integrated temperature between 600 and 1500 K. When applied to thermal anomalies of volcanic origin, this feature may appear to be a limitation since many VTFs can be colder or may have a large part of their surface below 600 K. For example, a lava flow that has been emplacing for several days or weeks may have large parts of its surface at a temperature well below 600 K (Pinkerton et al., 2002). However, if the flow is still active, a portion of its surface will likely have temperatures above 600 K for which Wooster’s relationship holds. It has been previously demonstrated that the MIR method provides an estimate of the VRP radiated by hot, younger surfaces, no older than 6–24 h (Coppola et al., 2010). In other words, lava surfaces that have cooled down for more than 1 day, emit a small MIR radiance and therefore contribute very little to the VRP estimate. This reasoning can be equally applied to lava domes, in which a large part of the cooled carapace may likely be below 600 K (Hicks et al., 2009; Sahetapy-Engel and Harris, 2009). In these cases, the VRP provides an estimate of the thermal power radiated mostly from the hotter (thermally younger) surfaces, eventually associated with new spines or lobes, hot cracks, or highly permeable zones that permit continuous outgassing (Shevchenko et al., 2021; Coppola et al., 2022a). On fumarolic fields, the VRP has proved to be a robust parameter for estimating the heat flux vented by high-temperature fumaroles alone, while it is fundamentally insensitive to the diffuse heat dispersed from the crater area at a few degrees above the background (zones of diffuse degassing; Coppola et al., 2022b).
It is therefore important to emphasize that the VRP does not represent the total radiant power of a VTF, but only a fraction of it, that is the one associated with the high-temperature components. What the exact limit is, depends on the temperature distribution of the VTF, but the lower bounds of the MODIS-MIROVA system can be used to define the thresholds under which a VTF is not detectable. In the case of MODIS with a resolution of 1 km, accurate values of VRP can be detected above ∼1 MW (Coppola et al., 2016a), which corresponds to a VTF with a radius of ∼1.5 m and an integrated temperature of 1,000°C, or a VTF with a radius of ∼6.9 m and a temperature of 330°C. Thus, these two scenarios can be roughly considered the limiting characteristics that a VTF must have to be detected by the MODIS-MIROVA database.
For low-temperature VTFs, which have large areas but no components at high temperatures (crater lakes or extensive fumarolic fields but at lower temperatures), the MIR method returns underestimated values for the total radiant flux. However, although quantitatively inaccurate, the trend defined by the VRP for these cases is still sensitive to potential variations in the area or temperature of the VTF, being the latter embedded in the value of the pixel-integrated radiance (Eq. (1)).
The Volcanic Radiative Energy VRE (in Joules) is the energy radiated by a VTF, as calculated by using two or more consecutive VRP measurements. Quantification of the VRE produced by each volcano over an entire eruption (or period) can be obtained as the trapezoidal integration of the VRP time series, under the assumption that a linear trend exists between each consecutive VRP measurement (Coppola and Cigolini, 2013). This, however, requires a selection of suitable scenes to exclude those contaminated by clouds and/or volcanic plumes (Coppola et al., 2013; Coppola et al., 2019). Considering the high number of scenes from which the MIROVA database is made, a visual inspection/classification of each image is essentially impractical. Yet, to ensure the best trade-off between the quality of the data provided and the time required to compile the database, two unsupervised methods are here proposed.
Method-1 computes the average weekly VRP and integrates this value over a consecutive time window of 7 days to obtain weekly energy values. This method has the advantage of being easily applicable, yet, it likely provides slightly underestimated energies as it takes into account all the scenes, including those contaminated by clouds or acquired with unfavorable geometrical conditions, the latter proven to affect the accuracy of the retrieved VRP (Coppola et al., 2010).
Method-2, instead, attempts to provide a better representation of the energy radiated from each volcano, by applying a local minima filter to the original VRP time series of each volcano. In this way, local VRP minima are removed from the weekly subset, before performing the weekly energy calculation as per in Method-1. This method tends to reduce the effect of cloud contamination and unfavourable acquisitions, but possibly provides overestimated values, especially during eruptive activity that changes abruptly.
Regardless of the method, the weekly energies are then summed yearly to obtain the annual VRE trends (in J y−1), and cumulated on a 20-year scale, to obtain the cumulative total VRE (see Section 3.2).
The current version of the MIROVA database (v.1) consists exclusively of night-time data, amounting to more than 150,000 hot-spot contaminated MODIS images, for the set 111 analysed volcanoes. As specified in Coppola et al., 2020, the VRP data provided by MIROVA are provided “as-are”, i.e., without atmospheric corrections and cloud fraction estimates accompanying the measurement. This choice is due to the difficulties of implementing these corrections in NRT without compromising the latency time with which the data is distributed on the website. Work in progress is underway to implement these improvements which may eventually be included in future versions of the database. On the other hand, the entire dataset has been supervised to remove obvious “non-volcanic” thermal features. This step was done manually by checking the time series and removing data points related to fires or false alerts, based on visual inspection of the images or based on fact-checking within volcanic activity reports, or news available on the web. However, some errors (alerts of non-volcanic origin) can be still present in the database but without compromising the statistical analysis of the data, or the eruptive trends.
The 111 volcanoes constituting the database were divided into four compositional groups based on the silica content of the erupted lavas (Figure 1). Where possible, the chemical compositions (listed in “Global_Annual_VRE_v1.xls”—see next section) refer to chemical analyses of recent volcanic products as published by specific works. In other cases, reference composition was obtained using the GEOROCK database (https://georoc.eu/ and references therein), by taking into account the more recent analysis. Based on this classification, between 2000 and 2019 we distinguished: 62 active volcanoes (56%) with a basic composition (≤55 wt% SiO2); 42 active volcanoes (38%) with intermediate composition (55 < wt% SiO2 ≤ 65); 5 active volcanoes (4%) with acid composition (SiO2 > 65 wt%) and only 1 volcano having other composition (the carbonatitic composition of Ol Doinyo Lengai- Tanzania).
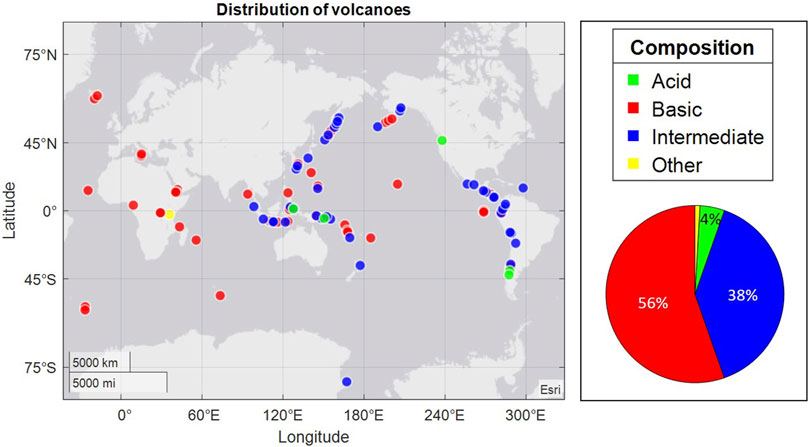
FIGURE 1. Volcanoes included in the MIROVA Database v. 1.0 subdivided by composition groups (Acid: >65 wt% SiO2; Basic: ≤55 wt% SiO2; Intermediate: 55 to 65 wt% SiO2; Other: Carbonatite). The pie chart illustrates the proportion of each group within the dataset. See the file "Global_Annual_VRE_v1.xls for details (https://osf.io/zm62w/)".
The database is stored and downloadable from the dedicated OSF data repository (https://osf.io/zm62w/) as well as from the MIROVA website (https://www.mirovaweb.it/). It is composed of three datasets characterised by different time resolutions:
• Global_Annual_VRE_v1.xls. Global annual version of the database. The file contains 111 rows (corresponding to volcanoes) and 20 columns providing the annual Volcanic Radiative Energy (VRE, in J y−1) recorded from 2000 to 2019 and calculated using Method-2. In the absence of thermal anomalies over the course of an entire year the VRE value is set to 0. The table includes the compositional group and the SiO2 content (wt%) attributed to each volcano according to the indicated bibliographic reference.
• Global_Daily_VRP_v1.xls: Global daily version of the database. The file contains 111 rows (corresponding to volcanoes) and 7,245 columns giving the maximum VRP (in W) recorded daily at each volcano from 1 March 2000, to 31 December 2019. We refer to this value as VRPday. In the absence of thermal anomalies over an entire day, the VRP is set to NaN (Not a Number).
• VolcanoName_MIROVA_Database_v1. csv: Single volcano version of the database containing the list of all night-time thermal anomalies detected by MIROVA from 1 March 2000, to 31 December 2019. Each thermal detection is accompanied by a list of associated parameters as reported in Table 1.
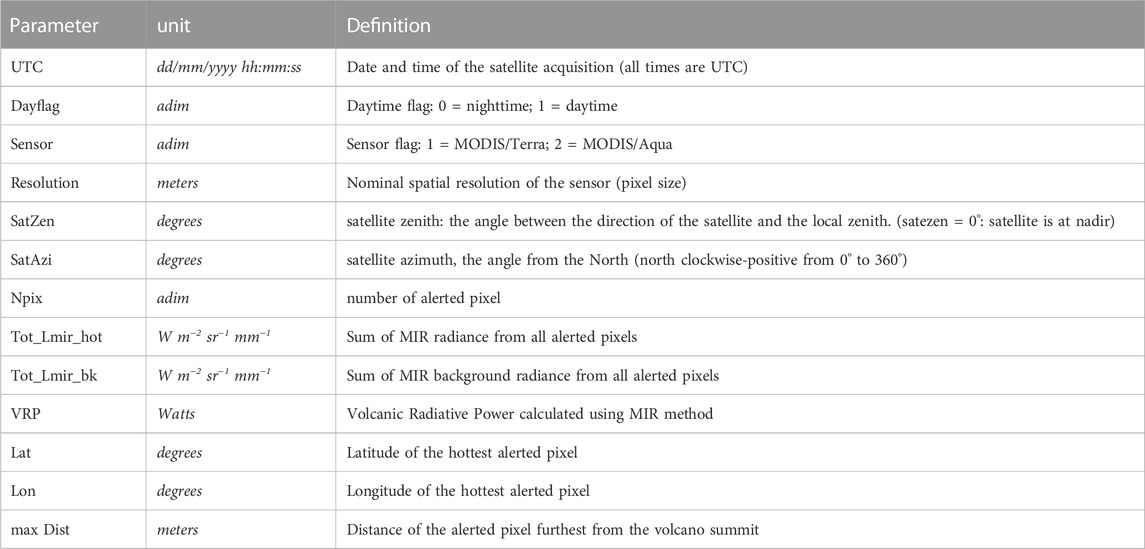
TABLE 1. List of parameters distributed for each volcano. MIROVA Database v1.
In addition, for each volcano, we presented a synthesis of the database in the form of a graphical panel (named VolcanoName_MODIS_VRE_2000_2019.png) constituted by four subplots (Figure 2). The first plot (upper left) represents the annual VRE time-series (calculated with the two methods described in section 2.4) on which it is possible to appreciate the long-term trend. The second plot (upper right) shows the cumulative VRE including the total value of radiated energy in the 20 years analysed. The third plot (lower left) is instead the time series of the VRP on a logarithmic scale.
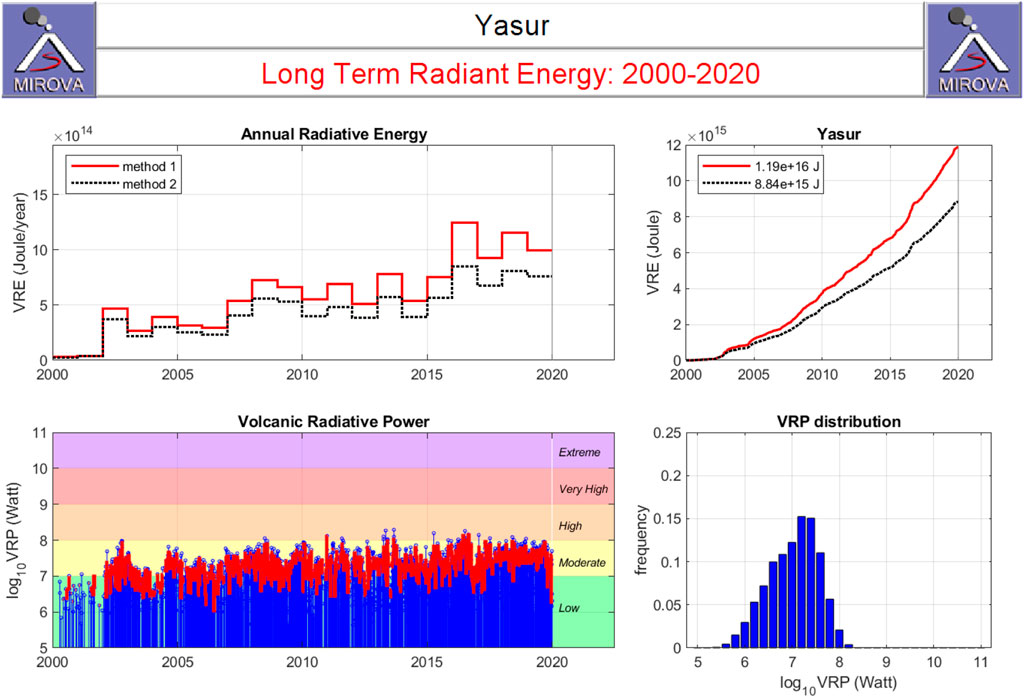
FIGURE 2. Example of the Yasur volcano (Vanuatu) graphical abstract. Upper left -Time series of the annual Volcanic Radiative Energy (VRE), calculated with the two methods described in the text; Upper right - Cumulative curve of the VRE; Lower Left - Volcanic Radiative Power (VRP) time series plotted on a logarithmic scale. The coloured bands are created at the thermal levels defined by Coppola et al., 2016a; Lower Right - Frequency histogram of VRP (log-transformed) values recorded in the period 2000–2019. This plot illustrates the statistical distribution of thermal data to graphically display the maximum, minimum and modal VRP values for each volcano.
On the background of the time series, the thermal levels of VRP are reported as defined by Coppola et al., 2016a, i.e.: Low, Medium, High, Very High, and Extreme. Finally, the last plot (lower right) shows the frequency histogram of the log-transformed VRP data. These graphical panels can be viewed for each volcano on the dedicated page of www.mirovaweb.it or from the data repository (https://osf.io/zm62w/).
The global VRP value was obtained by summing the VRPday of each active volcano on that given day. The result is shown in Figure 3, both in logarithmic and linear scale. Overall, the global VRP value fluctuates between 107 and 1011 W, with an average value of 1.9 × 10⁹ W (Figure 3A).
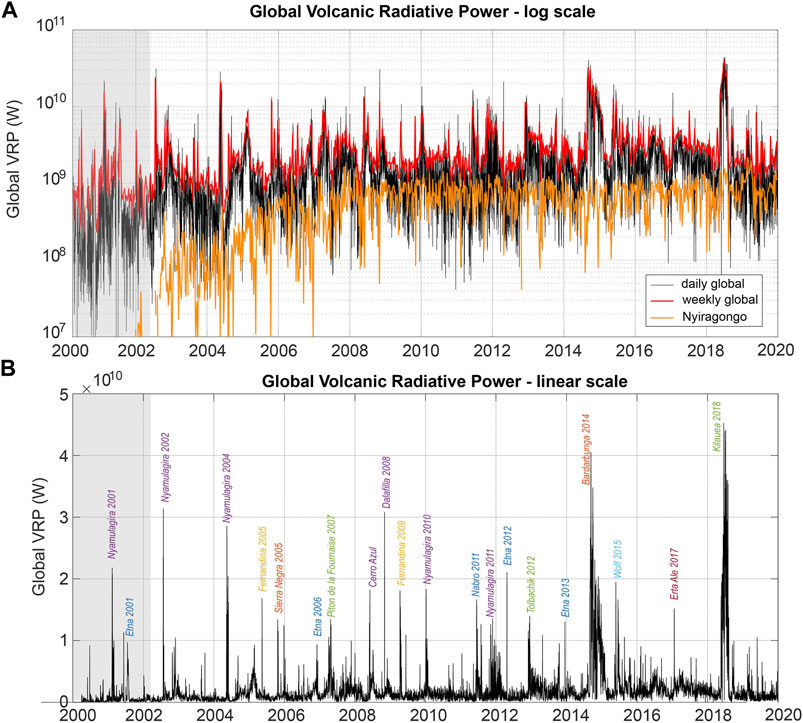
FIGURE 3. Global VRP from 111 subaerial volcanoes between 2000 and 2020. (A) Logarithmic scale; The growth of the Nyiragongo (DRC) lava lake (orange line in a) is reflected in an apparent increase in global heat flux between 2002 and 2010. As of 2010, Nyiragongo alone constitutes about 50% of the global VRP. (B) linear scale. The main basaltic effusive eruptions at the origin of the VRP peaks are indicated. The grey fields indicate the period with only one MODIS sensor.
The growth of global VRP observed between 2000 and the first half of 2002 is an artefact due to the launch of the second MODIS sensor (on board Aqua) in May 2002, which doubled the number of acquisitions. However, between 2003 and 2010, an increasing trend is still recognizable on global VRP but, as noted by Wright. (2016), this is caused by the Nyiragongo volcano (Democratic Republic of Congo—DRC) alone (orange line in Figure 3A), and the gradual rising of its lava lake (Burgi et al., 2020). Notably, the VRP released by Nyiragongo between 2010 and 2020 was more stable and constituted almost 50% of the global VRP of the same period.
From Figure 3 it becomes evident that the general trend of global VRP is punctuated by several peaks with values rising above 1010 W. These peaks correspond to the most powerful effusive eruptions of basaltic volcanoes which emplaced large lava flows in relatively short periods. The most important of these eruptions are labelled in Figure 3B where it is possible to note, on a linear scale, the major impact that the two largest lava-flow-forming eruptions of the last decades had on the global VRP (Bardarbunga (Iceland) in 2014–2015 and Kilauea (Hawaii) in 2018; Bonny et al., 2018; Patrick et al., 2020).
In the period sampled by both MODIS sensors (Terra and Aqua were operative between 2002–2019) the number of volcanoes that every year showed some kind of thermal activity fluctuated between 60 and 80, with an average of 67.3 ± 6.1 (±1σ; Figure 4A). These numbers practically halve when weekly intervals are considered, bringing the number of active (hot) volcanoes each week ranging between 25 and 40, with an average of 32.5 ± 4.6 (±1σ). Of these 16.2 ± 2.7 (50%) are volcanoes with an intermediate composition, 14.4 ± 2.9 (45%) are volcanoes with a basic composition, and only 1.5 ± 0.7 (5%) are volcanoes with an acid composition (Figure 4A).
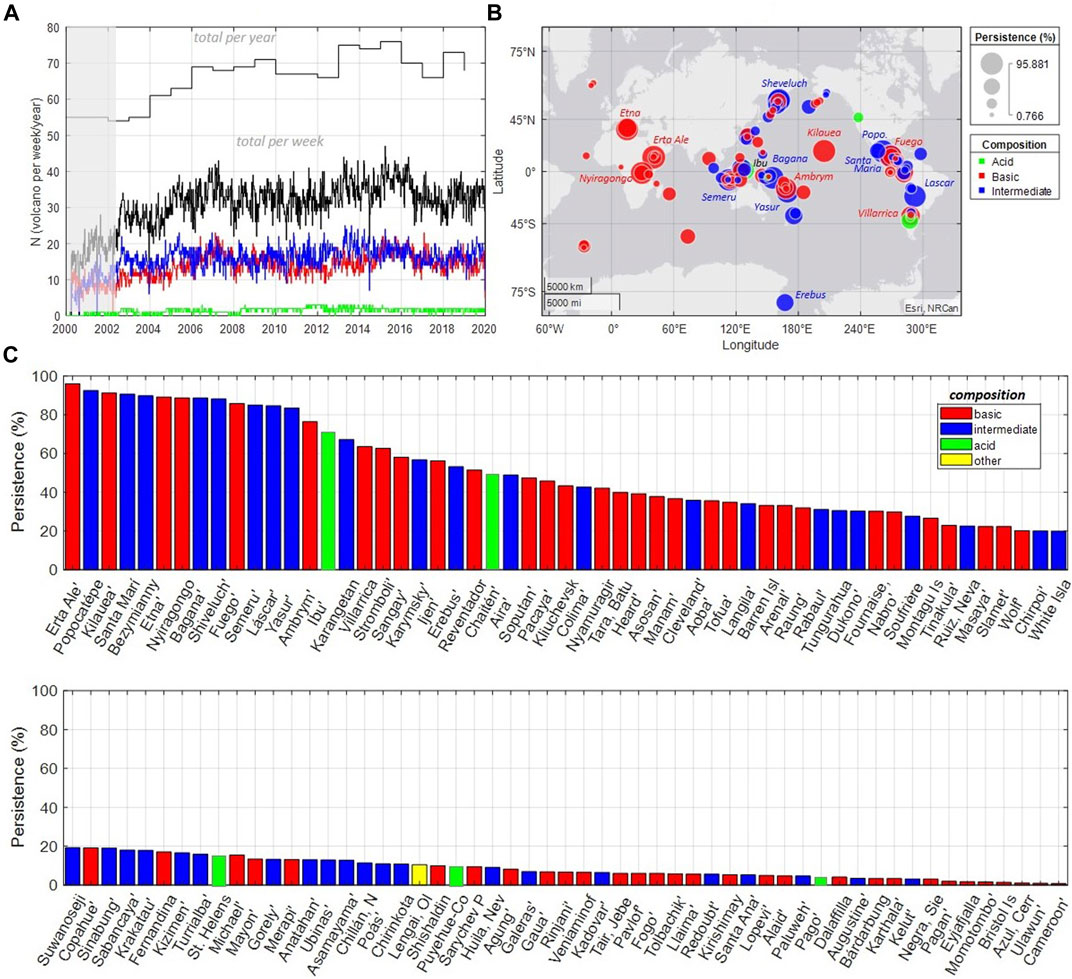
FIGURE 4. (A) Time series of the number of active (hot) volcanoes broken down by compositional groups (see inset in c). The two black lines refer to the number calculated on a weekly or annual basis; (B) Global bubble map showing the persistence of thermal activity at each volcano. Bubble’s colour refer to distinct compositional groups; bubble’ size refer to the persistence (%) of thermal activity; (C) Ranking of volcanoes sorted by the persistence of activity (calculated as a percentage of the number of weeks with at least one thermal alert, divided by the total number of weeks).
The persistence of thermal activity at each volcano (Figures 4B,C) has been calculated as the percentage of active weeks (weeks with at least one thermal alert) out of the total duration of the analysed period. Among the 15 most persistent volcanoes (with persistence >70%; Global_Annual_VRE_v1. xls) we recognized: i) 6 cases (40%), with basic composition and including lava lakes (Erta Ale (Ethiopia), Nyiragongo (DRC), Ambrym (Vanuatu)), open-vent and lava-flow-forming volcanoes (Kilauea (Hawaii), Etna (Italy), Fuego (Guatemala)); ii) 8 cases (53%) with intermediate composition, including lava domes (Semeru (Indonesia), Popocatépetl (Mexico), Shiveluch and Bezymianny (Kamchatka)), viscous lava flows (Bagana (Papua New Guinea), Santa Maria (Guatemala)), open-vent (Yasur (Vanuatu)) and degassing plug (Lascar (Chile)); and iii) 1 case (7%) with acidic composition related to the rhyolitic dome-coulee of Ibu volcano (Indonesia).
On the other hand, poorly persistent volcanoes (17 cases with persistence <5%; Figure 4C), whose activity was short and sporadic during the 20 years analysed, seem to be more represented by volcanoes with basic composition (13 cases - 76%, including Lopevi (Vanuatu), Dalafilla (Ethiopia), Bardarbunga (Iceland), among others), followed by intermediate (3 cases, 18%; Paluweh (Indonesia), Augustine (Alaska), and Kelut (Indonesia)) and acids (1 case, 6%; Pago (Papua New Guinea)) compositions. These volcanoes are characterised by having had few and relatively short eruptive events interspersed with long periods of pause, typical of closed-vent volcanoes.
For each compositional group (excluding the carbonatitic one), we summed the VRPday (Global_Daily_VRP_v1.xls) to obtain three distinct time series which added together, give the global VRP (Figure 5). This grouping outlines that the global VRP is dominated by basic volcanoes which radiate overall at a time average rate of about ∼1.69 × 10⁹ W (see also next section). As previously described, the time series of the basic volcanoes (red line in Figure 5A) is biased by Nyiragongo activity, and is punctuated by evident peaks associated with major lava flow-forming basaltic eruptions (cf. Figure 3B) which reach maximum VRP values higher than 1010 W. Taking into consideration the maximum VRP (VRPmax) detected at each volcano (Figure 5C), we note that first 12 positions in the rank are all occupied by basaltic volcanoes that have produced the most intense effusive activity in recent years (Global Volcanism Program., 2023), namely,: Kilauea (Hawaii), Bardarbunga (Iceland), Nyamulagira (DRC), Dalafilla (Ethiopia), Etna (Italy), Wolf (Equador), Sierra Negra (Equador), Cerro Azul (Equador), Nabro (Eritrea), Erta Ale (Ethiopia), Tolbachik (Kamchatka) and Piton de la Fournaise (Réunion Island). It should also be noted that of the first 50 volcanoes sorted by VRPmax, 37 have a basic composition (∼74% of the total; Figure 5C).
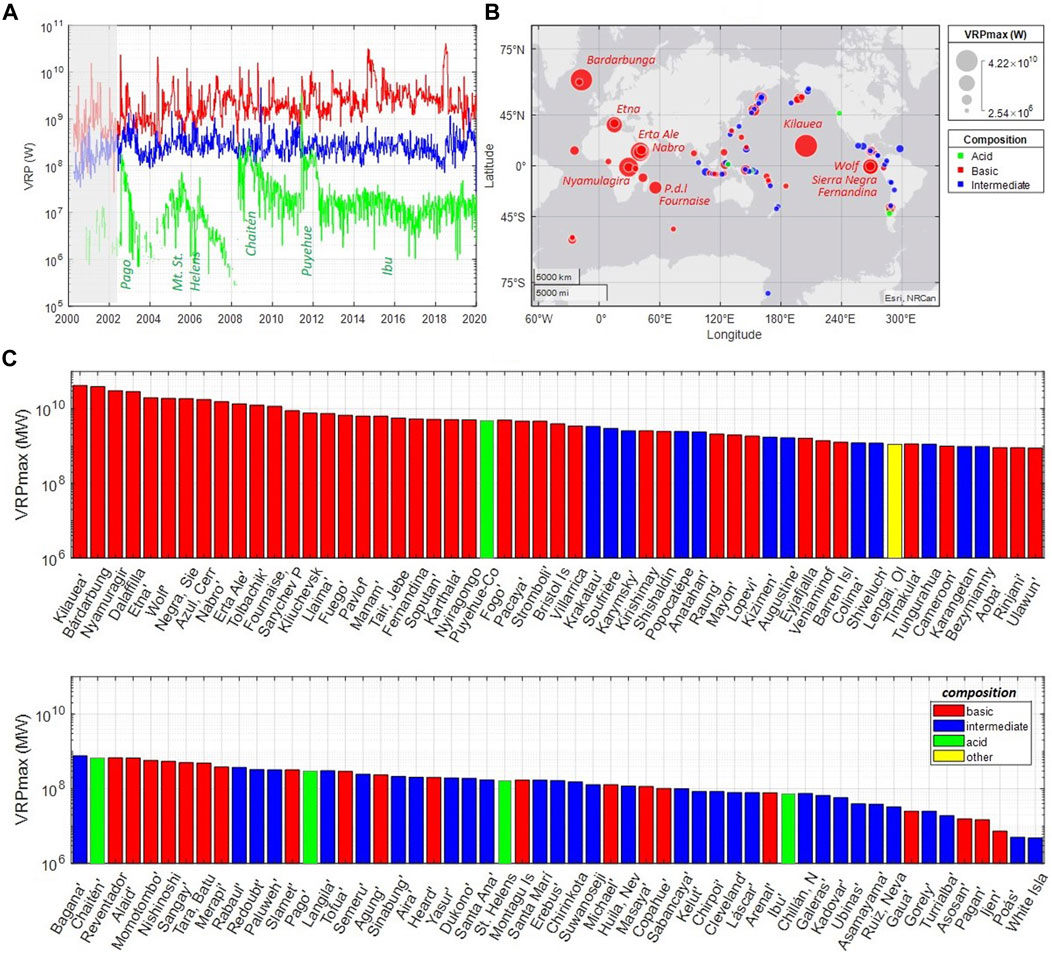
FIGURE 5. (A) Time series of total VRP (weekly mean) irradiated by each compositional group; Labels refer to the only 5 volcanoes of acidic composition and related eruptions; (B) Bubble chart showing the spatial distribution of VRPmax among the target volcanoes; the size of the bubbles refers to the VRP max recorded at each volcano; (C) Ranking of volcanoes sorted by VRPmax value detected over the 20 years.
Volcanoes of intermediate compositions (blue line in Figure 5A) radiate globally with a time-average value of ∼0.17 × 10⁹ W, which is about 10% of the basic volcanoes. Furthermore, unlike the latter, the total VRP radiated by this group is much more constant and does not show several sudden variations as in the case of basalts. The VRP peaks reached by these volcanoes exceed 109 W only in a few volcanoes, namely, Krakatau (Indonesia), Soufriére Hills (Caribbean), Karymsky (Kamchatka), Popocatèpetl (Mexico), Anathan (United States), Kizimen (Kamchatka), Augustine (Alaska), Colima (Mexico), Shiveluch (Kamchatka), and Tungurahua (Equador) (Figure 5B). In all these cases the volcanic activity associated with the highest VRP was related to the growth/destruction of lava domes or by the emplacement of viscous flows accompanied by violent explosive activity (Global Volcanism Program, 2023). Finally, the group of acidic volcanoes (green line in Figure 5A) radiates at a time-average rate of only ∼0.03 × 10⁹ W, or just over 2% of the basic group alone. Only 5 volcanoes belong to this group (Puyehue-Cordón Caulle (Chile), Chaitén (Chile), Pago (Papua New Guinea), Mt. St. Helens (United States), and Ibu (Indonesia)) whose eruptions lasted several months to years (Global Volcanism Program., 2023) and produced the pattern visible in Figure 5B. The thermal activity of these 5 silicic volcanoes has been always sourced by the emplacement of viscous flows or lava domes. In the most powerful cases (Chaitén volcano, and Puyehue-Cordón Caulle) the lava extrusion was accompanied by intense explosive activity (Major and Lara, 2013; Tuffen et al., 2013). On the contrary, for Mt. St. Helens, Ibu, and Pago volcanoes the lava extrusion occurred in the absence of major explosive activity (Sherrod et al., 2008; Rothery et al., 2005; Saing and Bani, 2014). It is interesting to note that at the bottom of the rank (lowest VRPmax) are all volcanoes that have been characterised by high-temperature fumarolic fields, such as Gorely (Kamchatka) (Aiuppa et al., 2012), Turrialba (Costa Rica) (Rouwet et al., 2021), Asosan (Japan) (Cigolini et al., 2018), Pagan (Mariana Islands) (Global Volcanism Program, 2023), Ijen (Indonesia) (Caudron et al., 2015), Poás (Costa Rica) (Fisher et al., 2015), White Island (New Zeland) (Caudron et al., 2021).
The thermal energy radiated in 20 years by all the 111 volcanoes amounts (Figure 6A) to ∼2.0 × 10¹⁸ J, which corresponds to a time-averaged emission equal to ∼1.9 × 10⁹ W. Of this ∼91% (∼1.8 × 10¹⁸ J) is produced by volcanoes with basic composition, ∼8% (∼1.8 × 10¹⁷ J) by volcanoes with an intermediate composition and only ∼1% (∼1.7 × 10¹⁶ J) from acid volcanoes.
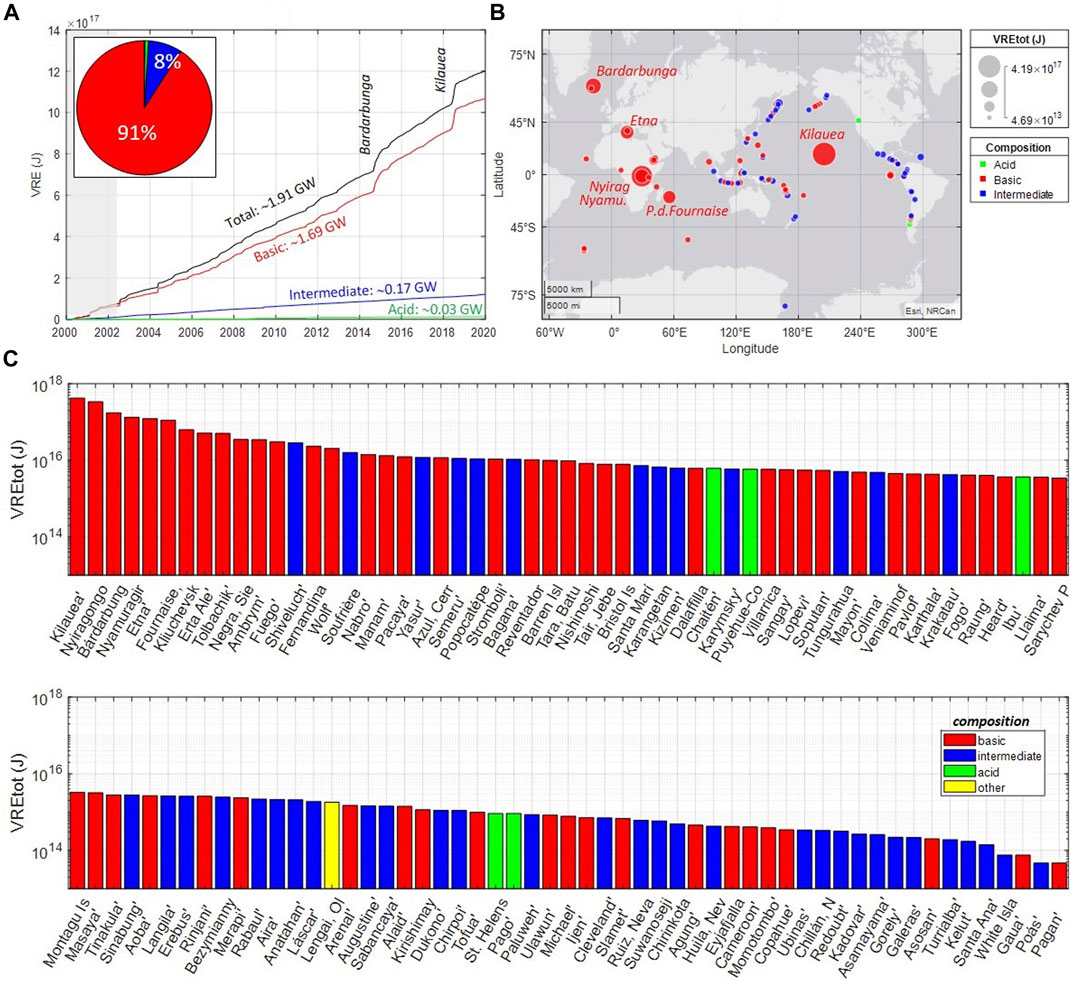
FIGURE 6. (A) Time series of cumulative VRE irradiated by each compositional group; the pie chart (inset) shows the large proportion of energy radiated by volcanoes with basic composition (91%); (B) Bubble chart showing the spatial distribution of VREtot among the target volcanoes; the size of the bubbles refers to the value of VREtot measured at each volcano; (C) Ranking of volcanoes sorted by total VRE released in 20 years of activity.
Notably, ∼66% of the total radiated energy globally was released by only 6 basaltic volcanoes hosting lava lakes and/or producing voluminous effusive activity through one or multiple eruptions (Global Volcanism Program, 2023; Figures 6B,C). These are (Figures 6B,C): Kilauea (∼4.2 × 10¹⁷ J), Nyiragongo (∼3.4 × 10¹⁷ J), Bardarbunga (∼1.7 × 10¹⁷ J), Nyamuragira (∼1.3 × 10¹⁷ J), Etna (∼1.2 × 10¹⁷ J) and Piton de la Fournaise (∼1.1 × 10¹⁷ J).
Amongst the volcanoes with an intermediate composition, Shiveluch (∼2.9 × 10¹⁶ J) and Soufriére Hills (∼1.6 × 10¹⁶ J), both characterised by dome-forming eruptions (Wadge et al., 2014; Shevchenko et al., 2015), were those producing the most energetic thermal activity (Figure 6C). Chaitén (∼6.2 × 10¹⁵ J) and Puyehue-Cordón Caulle (∼5.8 × 10¹⁵ J) were the acid volcanoes that emitted the most energy and, and were associated to viscous lava domes and flows coupled with explosive activity (Major and Lara, 2013; Tuffen et al., 2013). Also in this case, at the end of the rank (Figure 6C) are the less energetic volcanoes that have recently shown high-temperature fumarolic activity, often at the edge of crater lakes (Santa Ana (El Salvador), White Island (New Zeland), Gaua (Vanuatu), Poas (Costa Rica), Pagan (Mariana Islands))
The analysis of 20-year-long satellite thermal data reveals that the global sub-aerial volcanic activity is characterised by a steady-state thermal emission (∼1.91 GW; cf. Figure 6A), dominated by basic composition volcanoes, and episodically perturbed by large effusive basaltic eruptions (e.g., Bardarbunga, 2014 and Kilauea, 2018). There is an order-of-magnitude difference in the long-term global VRP measured across the three compositional groups (∼1.69 GW, ∼0.17 GW, and ∼0.03 GW for basic, intermediate, and acid volcanoes, respectively) which however, is not related to the number of active volcanoes (cf. Figure 4A). The difference could be ascribed to the tendency of basaltic volcanism to be volumetrically dominant over the other groups (White et al., 2006) but also to the different efficiency that the three compositional groups have in radiating thermal energy through high-temperature VTFs (Coppola et al., 2013).
It has been suggested that the rheology of erupted lavas, being linked to the temperature, area, and thickness of active lava bodies, plays a fundamental role in controlling the VRP (Coppola et al., 2013). According to the authors, during effusive eruptions, the radiant energy (VRE) and erupted lava volume (Vol) are proportionally related by:
being crad (in J m−3) an empirical parameter reflecting the appropriate spreading and cooling processes of the erupted lavas. Based on the analysis of 44 eruptions Coppola and co-authors (2013) estimated that basic lavas have the highest observed crad (1–4 × 10⁸ J m−3), while intermediate and acidic lavas show gradually lower coefficients (1.5–9 × 10⁷ J m−3 and 2 to 10 × 106 J m−3 for intermediate and acidic composition, respectively). The different crad values imply that for the same erupted volume, the VRE will gradually become lower as one passes from basic to intermediate and acidic compositions. Therefore, it is plausible that the difference in the global thermal flux of the individual compositional groups does not reflect a real difference in erupted volumes, but is due to the different crad coefficients of the associated lavas.
We assess the robustness/validity of these coefficients on a far greater number of cases and 20 years of data, by comparing the VRE radiated between 2000 and 2019 with the volume of lava erupted in the same period and recently published by Galetto et al., 2023 (Figure 7). In doing so, for each volcano we have considered only the mass erupted uniquely in the form of lava flows or lava domes, thus excluding the mass associated with pyroclastic deposits and ash (two eruptive products that do not radiate a significant amount of heat) or from the unclassified origin (see Galetto et al., 2023). The mass of lava that erupted effusively was then converted into an erupted volume (Vol) using an average density equal to ρ = 2,600 kg/m3 (Galetto et al., 2023). This selection resulted in a subset of 74 volcanoes for which estimates of lava erupted over the 2 decades are available together with MIROVA-derived VRE.
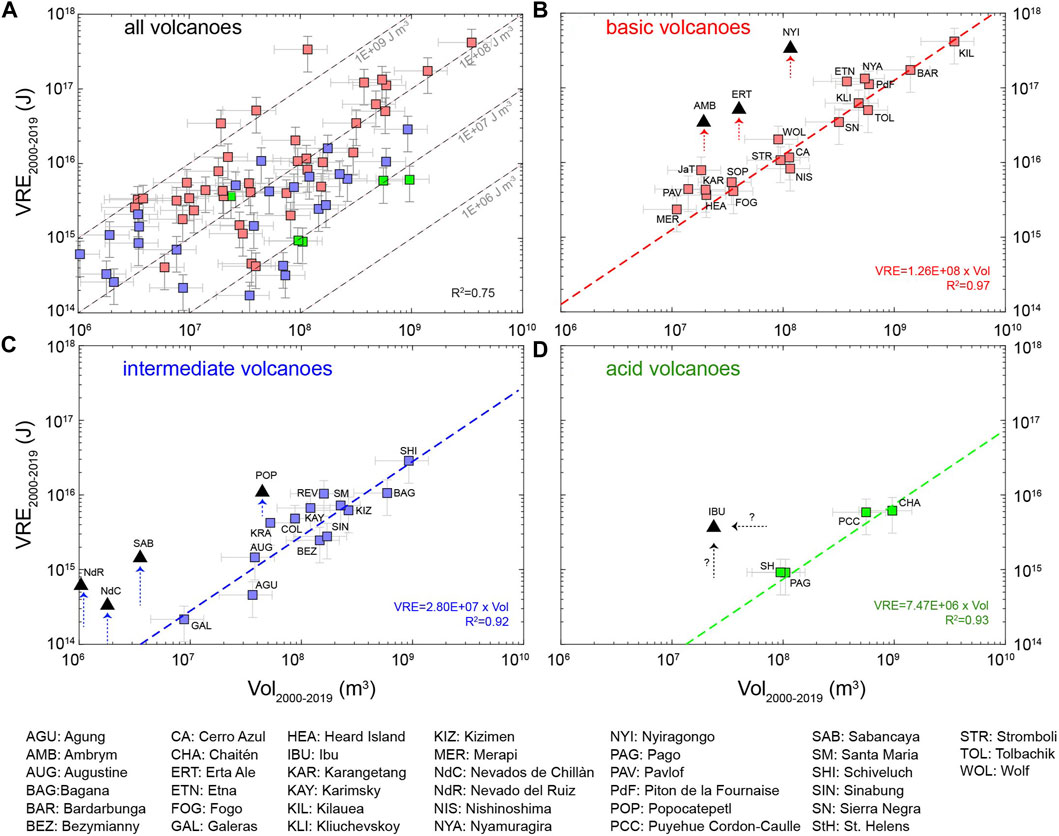
FIGURE 7. VRE vs. Vol relationships for all volcanoes together (A), and for selected volcanoes of each compositional group: (B) basic, (C) intermediate (D) acid. For basaltic lava-flow-forming volcanoes (red squares in b) the VRE is directly proportional to the volume erupted according to a conversion coefficient (crad =1.2 x 10⁸ J m−3) typical of basic composition. Conversely, lava lakes such as Nyiragongo, Erta Ale, and Ambrym (black triangles), deviate from this relationship, showing an excess of VRE (upward red arrows) compared to the erupted volume. A linear relationship between VRE and Vol is also observed at several volcanoes of intermediate composition (crad = 2.8 x 10⁷ J m−3) although some open-vent andesitic domes (Nevado del Ruiz (Colombia), Nevados de Chillàn (Chile), Sabancaya (Peru), Popocatepetl (Mexico)) clearly show an excess of VRE compared to the erupted volume (upward blue arrows). Acid volcanoes are characterised by the lowest VRE/Vol ratio (crad =7.5 × 10⁶ J m−3), except for Ibu, whose deviation from the linear trend could be related to an excess of VRE, or an underestimation of the erupted lava volume. VRE data are from file “Global_Annual_VRE_v1. xls” (see data repository). Volumes data are from Galetto et al., 2023 (see text for explanation). The error bars in (A) are indicative of uncertainty in the estimates of VRE and Vol equal to +- 50%.
In Figure 7A the data of 74 volcanoes, classified by compositional groups, are plotted together showing an overall moderate correlation between VRE and Vol (R2 = 0.75). The points are spread over several orders of magnitude with VRE ranging from 1014 to >1017 J and erupted lava volumes ranging from 106 to > 109 m3. The three compositional groups are distinguishable, indicating the general tendency of basaltic volcanoes to radiate more thermal energy, although the point clouds are partially overlapping. This is not surprising since, in addition to the lava composition, the relationship between VRE and erupted lava volume can be strongly influenced by other factors such as the type of activity, and errors/omissions of both VRE and the volume databases over a 20-year-long time series. The type of activity is decisive in determining the VRE/Vol ratio since Eq. (3) only holds for effusive eruptions. Heat sources, not associated with the lava effusion (e.g., fumaroles, degassing vents, convective lava lakes) can destroy this correlation since the VRE is not related to any erupted lava volume (which can be zero). Also, the emplacement of crypto lava domes may alter the correlation since the volumetric growth of the dome does not produce sufficient heat to be detected from space. It should be kept in mind that the data refer to cumulative values over a 20-year time frame during which the activity of each volcano has changed, eventually passing from a degassing state to an effusive one (and vice versa), several times. This variability undoubtedly introduces complexity in the relationship between VRE and erupted volume, especially when long time windows are considered. Moreover, some short eruptions that were reported in the Galetto et al., 2023 database, may have been undetected by MODIS as they occurred in a period of cloud cover. On the contrary, some eruptions could have been detected by MODIS, but not reported, or misclassified in the Galetto et al., 2023 database. All of these factors affect the VRE/Vol ratio of each volcano producing the point dispersion visible in Figure 7A.
The correlation however strongly improves when selected volcanoes of each compositional group are considered separately (Figures 7B–D). For example, for a subgroup of 19 basaltic cases (red squares in Figure 7B), which include lava-flow-forming volcanoes encompassing 3 orders of magnitude lava volumes (such as Kilauea, Bardarbunga, Etna, Piton de la Fournaise, Kliuchevskoi (Kamchatka), Sierra Negra, Wolf, Fogo (Cape Verde), Pavlov (Alaska), among others) the relationship works well with a best-fit coefficient crad equal to 1.26 × 10⁸ J m−3 (R2 = 0.97). This value falls perfectly within the range of values found by Coppola et al., 2013, suggesting that the VRP of these volcanoes (virtually all the volcanoes that caused major VRP peaks on a global scale; cf. Figure 3B) is effectively controlled by their lava discharge rate. On the other hand, basic volcanoes that were characterised by lava lake activity over most of the two analysed decades (such as Nyiragongo, Erta Ale, Ambrym (Vanuatu); black triangles in Figure 7B) show an excess of thermal energy (VRE) compared to the volume that has been erupted (Vol), which is why their points deviate above the straight line of the lava-flow-forming eruption (note that Nyiragongo, Erta Ale and Ambrym produced lateral lava flows that drained their respective lava lakes). This “excess” radiation (upward red arrows in Figure 7B) is likely attributed to a large amount of heat radiated by the convective lava lake at the expense of a modest erupted volume (Harris et al., 1999; Palma et al., 2011; Burgi et al., 2014; Campion and Coppola, 2023). It is therefore clear that the exposure of a convective magma column, as occurs in lava lakes (Kazahaya et al., 1994; Stevenson and Blake, 1998) provides the additional heat source that causes an increase in VRE/Vol ratio of these representative open-vent volcanoes (Vergniolle and Mètrich, 2022).
On the other hand, as previously stated, Figure 7 provides a “snapshot” of a twenty-year-long eruptive history of each volcano, which may have been complex and characterised by switching between different types of eruptive regime (for example, both effusive and open-vent activity). The case of Stromboli is emblematic in this sense as its VRE/Vol ratio falls on the linear relationship of lava-flow-forming basaltic volcanoes (thus showing no signs of excess radiation; Figure 7B), although this volcano is considered an archetype of open-vent activity. From a thermal point of view, this datum is indicative of the fact that between 2000 and 2019 Stromboli’s VRE was largely produced by the occurrence of 4 major lava flows (Laiolo et al., 2022), while only a small fraction of thermal energy was sourced by the characteristic open-vent strombolian activity. Similarly, Kilauea plots on the line of lava-flow-forming volcanoes (Figure 7B), although a lava lake in Halemaʻuma’u crater has been fed for over 10 years (Patrick et al., 2021). In this case, most of the heat released by Kilauea was produced by the voluminous and continuous effusive activity of the Pu’u ‘Ō’ō (Poland et al., 2014) to which is added more recently the lateral eruption along the Lower East Rift Zone (Patrick et al., 2020).
Similar considerations emerge for volcanoes with an intermediate composition (Figure 7C). In fact, also in this compositional group we recognize a subgroup of volcanoes whose relationship between VRE and Vol is linear and represented by the best-fit coefficient crad =2.6 × 10⁷ J m−3 (R2 = 0.97), which is appropriate for the effusion of intermediate lavas, more viscous than the basaltic ones (cf. Coppola et al., 2013). Volcanoes such as Shiveluch, Bagana, Kizimen, Colima, Bezymianny, Augustin, and Galeras belong to this subgroup (among others; Figure 7C) and are thus characterised by a VRE that is proportional to the volume of erupted lava. Such a linear relationship suggests that at these volcanoes the heat flux recorded in 20 years was essentially provided by the emplacement of the respective andesitic lava bodies, without any substantial contribution from other heat sources. This cannot be said for other open-vent, lava-dome-forming volcanoes such as Popocatépetl, Sabancaya, Nevados del Ruiz, and Nevados del Chillán, which are positioned above the compositional-dependent relationship between VRE and Vol (black triangles in Figure 7C). This suggests an excess of VRE compared to the volume of lava extruded by these andesitic volcanoes. From an analysis of the volumes erupted explosively from these volcanoes (Galetto et al., 2023) we can exclude that this imbalance (excess of heat) is sourced by the ash or pyroclastic density current deposits (whose volume is not considered here). On the other hand, recent studies suggested that these lava domes are characterised by a large excess degassing (Shinohara, 2008) that may enhance the transport of heat at the surface of these volcanic bodies (Coppola et al., 2022a; Valade et al., 2023). Shallow magma convection and fluxing of deep-derived exsolved volatiles through the conduit may effectively provide additional heat at the surface of the dome (Shinohara, 2008; Edmonds et al., 2022), a process which is likely at the origin of the excess radiation recorded at these volcanoes (upward arrows in Figure 7C). Therefore, it seems that also for some open-vent andesitic volcanoes, the VRE measured at the surface is not simply sourced by the emplacement of a viscous lava dome, but can be additionally supplied by an underlying convective magma column and/or by a gas flow through a permeable conduit (Shinohara, 2008; Edmonds et al., 2022). The particular stationary long-term VRP trend shown by intermediate composition volcanoes (Figure 5A) could result from this phenomenon by which the effective amount of VRE associated with open-vent andesitic volcanoes is somehow “buffered” by a persistent heat emission associated with significant outgassing.
Finally, four of the five volcanoes with acidic composition (Puyehue-Cordón Caulle, Chaitén, Pago, and Mt. St. Helens), show a good correlation between VRE and Vol (Figure 7D), with a coefficient equal to crad =7.2 × 10⁶ J m−3 (R2 = 0.93) in agreement with the previous works on silicic flows/domes (Coppola et al., 2013). The good correlation is quite surprising since their eruptions have been characterised by very different emplacement styles (Major and Lara, 2013; Tuffen et al., 2013). Nevertheless, our results suggest that the energy radiated by these events is somehow proportional to the volume of lava erupted and there is no evidence of excess radiation for these eruptions. On the contrary, the Ibu volcano shows a clear deviation from the linear trend (Figure 7D) that could result in both a phenomenon of excess radiation (as in the case of the open-vent andesitic volcanoes described above) but also from an underestimation of the erupted volume. In fact, is important to stress that some deviations from the linear trend of each group may also be due to errors in the estimation of VRE and/or Vol. For example, unreported eruptions throughout the analysed period, or volume underestimation in the Galetto et al. (2023) database, produce an apparent high VRE/Vol ratio which can be wrongly interpreted as excess radiation. On the contrary, overestimations of the volume, or underestimations of the VRE (for example, due to the non-detection of paroxysmal phases of an eruption) can cause points that are below the curves shown in Figures 7B–D. Further studies to precisely determine the volumes of erupted lava and the gas flux of Ibu volcano will help shed light on this enigmatic case.
The cases presented above are therefore to be taken as general illustrations of the global relationship between VRE and Vol, but a more correct evaluation of crad should be made on a case-by-case basis, trying to minimize any errors in the estimation of thermal energies and the erupted volumes (Coppola et al., 2013; Coppola et al., 2020).
Together with the NRT processing, the availability of historical MODIS data through NASA’s LAADS DAAC archive, enabled the reconstruction of a 20-year thermal database for 111 volcanoes currently monitored by MIROVA (Coppola et al., 2020). The global analysis reveals that the heat flux over 20 years of data is essentially stationary (with a long-term rate of about ∼1.9 GW) and sourced by the annual contribution of 60–80 volcanoes, 45% of which are of basic composition, 50% are of intermediate composition, and only 5% are of acid composition. However, global emission is dominated by volcanoes with a basic composition (91%) while only 8% is produced by volcanoes with an intermediate composition. The remaining 1% was produced by just 5 acidic volcanoes that erupted from 2000 to 2019. These large differences are likely due to the different efficiency of basalts, andesites, and rhyolites to radiate thermal energy, as previously suggested by Coppola et al. (2013). A preliminary analysis of the relationships between radiant energy (VRE) and erupted lava volume (Vol; from Galetto et al., 2023) revealed that for many effusive volcanoes of each compositional group, there is an excellent correlation (R2 > 0.92; cf. Figure 7) valid over several orders of magnitude. However, this relationship is not valid for some open-vent volcanoes that show a clear excess of heat compared to that radiated by the erupted magma. Volcanoes that have shown persistent lava lake activity, or lava domes, which are characterised by large excess degassing, belong to this group, for which the additional heat source is likely associated with a convective magma column or gas flow through a permeable conduit.
Further deeper analyses can be conducted on a case-by-case basis from the comparison with geophysical and geochemical data recorded on every single volcano (e.g., seismicity, outgassing, deformation), or globally thanks to the integration of our database with other emerging global databases, such as the WOVOdat global volcano unrest database (Costa et al., 2019), the subaerial erupted masses database (Galetto et al., 2023) or the Sulfur Dioxide (SO2) Catalogue (Fioletov et al., 2023).
By allowing a direct comparison between the current thermal emission of a volcano with its baseline, this 20-year-long database is also a valuable tool for volcano hazard evaluations and to establish whether the volcanic system is deviating from its long-term ordinary activity.
In the coming years, we plan to implement this first version of the database (v.1) by gradually updating the VRP time series at each volcano, but also by adding new sensors (e.g., VIIRS), and new targets (e.g., low-temperature fumarolic fields).
Publicly available datasets were analyzed in this study. This data can be found here: https://osf.io/zm62w/.
DCo conceived and wrote the work. DCa, ML, and DCo built and analysed the database; DCo, ML, SA, AC, and FM have contributed to the development and maintenance of the MIROVA system. All authors contributed to the article and approved the submitted version.
This research has benefited from funding provided by the Italian Presidenza del Consiglio dei Ministri, Dipartimento della Protezione Civile (DPC) as part of the DEVnet Program (2014–2016) that includes a collaborative project between the Earth Sciences departments of the University of Florence and the University of Turin. This research was partially supported by the Italian Ministry for Universities and Research (MIUR).
We thank the 4 reviewers who critically revised the manuscript and allowed us to improve the presentation of the work through their constructive criticism. We acknowledge the LANCE-MODIS system (https://lance-modis.eosdis.nasa.gov/) for providing Level 1B MODIS data in near-real time. We thank many collaborators and students of the University of Turin who have contributed to the development and maintenance of the MIROVA system.
The authors declare that the research was conducted in the absence of any commercial or financial relationships that could be construed as a potential conflict of interest.
The Reviewer CH-B declared that, in the past, they were the Co-Supervisor for Author SA's Master by Research, as well as the previous course director for the undergraduate degree of Author SA.
The handling editor NV declared a past co-authorship with the author DC.
All claims expressed in this article are solely those of the authors and do not necessarily represent those of their affiliated organizations, or those of the publisher, the editors and the reviewers. Any product that may be evaluated in this article, or claim that may be made by its manufacturer, is not guaranteed or endorsed by the publisher.
Aiuppa, A., Giudice, G., Liuzzo, M., Tamburello, G., Allard, P., Calabrese, S., et al. (2012). First volatile inventory for Gorely volcano, Kamchatka. Geophys. Res. Lett. 39, L06307. doi:10.1029/2012GL051177
Bonny, E., Thordarson, T., Wright, R., Höskuldsson, A., and Jónsdóttir, I. (2018). The volume of lava erupted during the 2014 to 2015 eruption at holuhraun, Iceland: A comparison between satellite- and ground-based measurements. J. Geophys. Res. Solid Earth 123 (7), 5412–5426. doi:10.1029/2017JB015008
Burgi, P. Y., Boudoire, G., Rufino, F., Karume, K., and Tedesco, D. (2020). Recent activity of Nyiragongo (democratic republic of Congo): new insights from field observations and numerical modeling. Geophys. Res. Lett. 47 (17), e2020GL088484. doi:10.1029/2020GL088484
Burgi, P-Y., Darrah, T. H., Tedesco, D., and Eymold, W. K. (2014). Dynamics of the mount Nyiragongo lava lake. J. Geophys Res. Solid Earth 119, 4106–4122. doi:10.1002/2013JB010895
Campion, R., and Coppola, D. (2023). Classification of lava lakes based on their heat and SO2 emission: implications for their formation and feeding processes. Front. Earth Sci. 11, 1040199. doi:10.3389/feart.2023.1040199
Caudron, C., Girona, T., Jolly, A., Christenson, B., Kane Savage, M., Carniel, R., et al. (2021). A quest for unrest in multiparameter observations at Whakaari/White Island volcano, New Zealand 2007–2018. Earth Planets Space 73, 195. doi:10.1186/s40623-021-01506-0
Caudron, C., Syahbana, D. K., Lecocq, T., Van Hinsberg, V., McCausland, W., Triantafyllou, A., et al. (2015). Kawah ijen volcanic activity: A review. Bull. Volcanol. 77, 16. doi:10.1007/s00445-014-0885-8
Cigolini, C., Coppola, D., Yokoo, A., and Laiolo, M. (2018). The thermal signature of Aso Volcano during unrest episodes detected from space and ground-based measurements. Earth Planets Space 70, 67. doi:10.1186/s40623-018-0831-7
Coppola, D., Barsotti, S., Cigolini, C., Laiolo, M., Pfeffer, M., and Ripepe, M. (2019). Monitoring the time-averaged discharge rates, volumes and emplacement style of large lava flows by using MIROVA system: the case of the 2014–2015 eruption at holuhraun (Iceland). Ann. Geophys. 61, 52. doi:10.4401/ag-7749
Coppola, D., and Cigolini, C. (2013). Thermal regimes and effusive trends at Nyamuragira volcano (DRC) from MODIS infrared data. Bull. Volcanol. 75, 744. doi:10.1007/s00445-013-0744-z
Coppola, D., James, M. R., Staudacher, T., and Cigolini, C. (2010). A comparison of field- and satellite-derived thermal flux at Piton de la Fournaise: implications for the calculation of lava discharge rate. Bull. Volcanol. 72 (3), 341–356. doi:10.1007/s00445-009-0320-8
Coppola, D., Laiolo, M., Campus, A., and Massimetti, F. (2022b). Thermal unrest of a fumarolic field tracked using VIIRS imaging bands: the case of La fossa crater (vulcano Island, Italy). Front. Earth Sci. 10, 964372. doi:10.3389/feart.2022.964372
Coppola, D., Laiolo, M., Cigolini, C., Donne, D. D., and Ripepe, M. (2016a). “Enhanced volcanic hot-spot detection using MODIS IR data: results from the MIROVA system,” in Detecting, modelling and responding to effusive eruptions. Editors A. J. L. Harris, T. De Groeve, F. Garel, and S. A. Carn (London: Geological Society), 181–205. doi:10.1144/sp426.5
Coppola, D., Laiolo, M., Cigolini, C., Massimetti, F., Delle Donne, D., Ripepe, M., et al. (2020). Thermal remote sensing for global volcano monitoring: experiences from the MIROVA system. Front. Earth Sci. 7, 362. doi:10.3389/feart.2019.00362
Coppola, D., Laiolo, M., Lara, L. E., Cigolini, C., and Orozco, G. (2016b). The 2008 “silent” eruption of Nevados de Chillán (Chile) detected from space: effusive rates and trends from the MIROVA system. J. Volcanol. Geotherm. Res. 327, 322–329. doi:10.1016/j.jvolgeores.2016.08.016
Coppola, D., Laiolo, M., Piscopo, D., and Cigolini, C. (2013). Rheological control on the radiant density of active lava flows and domes. J. Volcanol. Geotherm. Res. 249, 39–48. doi:10.1016/j.jvolgeores.2012.09.005
Coppola, D., Valade, S., MasiasLaiolo, P. M., Massimetti, F., and Campus, A. (2022a). Shallow magma convection evidenced by excess degassing and thermal radiation during the dome-forming Sabancaya eruption (2012–2020). Bull. Volcanol. 84, 16. doi:10.1007/s00445-022-01523-1
Costa, F., Widiwijayanti, C., Win, N. T. Z., Fajiculay, E., Espinosa-Ortega, T., and Newhall, C. G. (2019). WOVOdat – The global volcano unrest database aimed at improving eruption forecasts. Disaster Prev. Manag. 28 (6), 738–751. doi:10.1108/DPM-09-2019-0301
Crisp, J. A. (1984). Rates of magma emplacement and volcanic output. J. Volcanol. Geotherm. Res. 20 (3–4), 177–211. doi:10.1016/0377-0273(84)90039-8
Davies, D. K., Ilavajhala, S., Wong, M. M., and Justice, C. O. (2009). Fire information for resource management system: archiving and distributing modis active fire data. IEEE Trans. Geosci. Remote Sens. 47, 72–79. doi:10.1109/tgrs.2008.2002076
Dragoni, M. (1989). A dynamical model of lava flows cooling by radiation. Bull. Volcanol. 51, 88–95. doi:10.1007/BF01081978
Edmonds, M., Liu, E., and Cashman, K. (2022). Open-vent volcanoes fuelled by depth-integrated magma degassing. Bull. Volcanol. 84, 28. doi:10.1007/s00445-021-01522-8
Fioletov, V., McLinden, C. A., Griffin, D., Abboud, I., Krotkov, N., Leonard, P. J. T., et al. (2023). Version 2 of the global catalogue of large anthropogenic and volcanic SO2 sources and emissions derived from satellite measurements. Earth Syst. Sci. Data 15 (1), 75–93. doi:10.5194/essd-15-75-2023
Fischer, T., Ramírez, C., Mora-Amador, R., Hilton, D., Barnes, J., Sharp, Z., et al. (2015). Temporal variations in fumarole gas chemistry at Poás volcano, Costa Rica. J. Volcanol. Geotherm. Res. 294, 56–70. doi:10.1016/j.jvolgeores.2015.02.002
Francis, P. W. (1989). Remote sensing of volcanoes. Adv. Space Res. 9 (1), 89–92. doi:10.1016/0273-1177(89)90471-7
Galetto, F., Pritchard, M. E., Hornby, A. J., Gazel, E., and Mahowald, N. M. (2023). Spatial and temporal quantification of subaerial volcanism from 1980 to 2019: solid products, masses, and average eruptive rates. Rev. Geophys. 61, e2022RG000783. doi:10.1029/2022RG000783
Global Volcanism Program (2023). Volcanoes of the world (v. 5.0.3; 1 mar 2023). Distributed by smithsonian institution. Washington, DC: Smithsonian Institution. doi:10.5479/si.GVP.VOTW5-2022.5.0
Harris, A. J. L., and Baloga, S. M. (2009). Lava discharge rates from satellite-measured heat flux. Geophys. Res. Lett. 36 (19), L19302. doi:10.1029/2009gl039717
Harris, A. J. L., Flynn, L. P., Rothery, D. A., Oppenheimer, C., and Sherman, S. B. (1999). Mass flux measurements at active lava lakes: implications for magma recycling. J. Geophys. Res. 104, 7117–7136. doi:10.1029/98JB02731
Harris, A. J. L., and Rowland, S. K. (2009). “Effusion rate controls on lava flow length and the role of heat loss: A review,” in Studies in Volcanology: The legacy of george walker. Editors T. Thordarson, S. Self, G. Larsen, S. K. Rowland, and A. Hoskuldsson (London: Special Publications of IAVCEI. Geological Society), 33–51. doi:10.1144/IAVCEl002.3
Harris, A. J. L. (2013). Thermal remote sensing of active volcanoes. Cambridge: Cambridge University Press. doi:10.1017/cbo9781139029346
Heffington, W. M., Kline, J. M., and Rottman, J. W. (1977). Volcanoes as a source of geothermal energy. Energy 2 (4), 457–459. doi:10.1016/0360-5442(77)90008-1
Henley, R. W., and Hughes, G. O. (2016). SO 2 flux and the thermal power of volcanic eruptions. J. Volcanol. Geotherm. Res. 324, 190–199. doi:10.1016/j.jvolgeores.2016.04.024
Hicks, P. D., Matthews, A. J., and Cooker, M. J. (2009). Thermal structure of a gas-permeable lava dome and timescale separation in its response to perturbation. J. Geophys. Res. Solid Earth 114 (B7), B07201. doi:10.1029/2008JB006198
Justice, C. O., Vermote, E., Townshend, J. R. G., Defries, R., Roy, D. P., Hall, D. K., et al. (1998). The moderate resolution imaging spectroradiometer (MODIS): land remote sensing for global change research. IEEE Trans. Geosc. Rem. Sens. 36 (4), 1228–1249. doi:10.1109/36.701075
Kazahaya, G., Shinohara, H., and Saito, G. (1994). Excessive degassing of izu-oshima volcano: magma convection in a conduit. Bull. Volcanol. 56, 207–216. doi:10.1007/BF00279605
Laiolo, M., Coppola, D., Barahona, F., Benítez, J. E., Cigolini, C., Escobar, D., et al. (2017). Evidences of volcanic unrest on high-temperature fumaroles by satellite thermal monitoring: the case of Santa Ana volcano, El Salvador. J. Volcanol. Geotherm. Res. 340, 170–179. doi:10.1016/j.jvolgeores.2017.04.013
Laiolo, M., Delle Donne, D., Coppola, D., Bitetto, M., Cigolini, C., Della Schiava, M., et al. (2022). Shallow magma dynamics at open-vent volcanoes tracked by coupled thermal and SO2 observations. Earth Planet. Sci. Lett. 594, 117726. doi:10.1016/j.epsl.2022.117726
Laiolo, M., Ripepe, M., Cigolini, C., Coppola, D., Della Schiava, M., Genco, R., et al. (2019). Space- and ground-based geophysical data tracking of magma migration in shallow feeding system of mount Etna volcano. Remote Sens. 11 (10), 1182. doi:10.3390/rs11101182
Major, J. J., and Lara, L. E. (2013). Overview of Chaitén volcano, Chile, and its 2008-2009 eruption. Andean Geol. 40 (2), 196–215. doi:10.5027/andgeoV40n2-a01
Naismith, A. K., Matthew Watson, I., Escobar-Wolf, R., Chigna, G., Thomas, H., Coppola, D., et al. (2019). Eruption frequency patterns through time for the current (1999–2018) activity cycle at volcán de Fuego derived from remote sensing data: evidence for an accelerating cycle of explosive paroxysms and potential implications of eruptive activity. J. Volcanol. Geotherm. Res. 371, 206–219. doi:10.1016/j.jvolgeores.2019.01.001
Oppenheimer, C., Francis, P. W., Rothery, D. A., Carlton, R. W., and Glaze, L. S. (1993). Infrared Image Analysis of volcanic thermal features: Láscar volcano, Chile, 1984-1992. J. Geophys. Res. Solid Earth 98 (B3), 4269–4286. doi:10.1029/92jb02134
Palma, J. L., Blake, S., and Calder, E. S. (2011). Constraints on the rates of degassing and convection in basaltic open-vent volcanoes. Geochem. Geophys. Geosyst. 12, Q11006. doi:10.1029/2011GC003715
Patrick, M., Orr, T., Swanson, D., Houghton, B., Wooten, K., Desmither, L., et al. (2021). “Kīlauea’s 2008–2018 summit lava lake—chronology and eruption insights,” in The 2008–2018 summit lava lake at Kīlauea Volcano, Hawai’i. Editors M. Patrick, T. Orr, D. Swanson, and B. Houghton (U.S. Geological Survey). doi:10.3133/pp1867A
Patrick, M. R., Houghton, B. F., Anderson, K. R., Poland, M. P., Montgomery-Brown, E., Johanson, I., et al. (2020). The cascading origin of the 2018 Kīlauea eruption and implications for future forecasting. Nat. Commun. 11, 5646. doi:10.1038/s41467-020-19190-1
Pinkerton, H., James, M., and Jones, A. (2002). Surface temperature measurements of active lava flows on Kilauea volcano, Hawai′i. Hawai′i. J. Volcanol. Geotherm. Res. 113 (1-2), 159–176. doi:10.1016/S0377-0273(01)00257-8
Poland, M. P., Miklius, A., and Montgomery-Brown, E. K. (2014). “Magma supply, storage, and transport at shield-stage Hawaiian volcanoes,” in Characteristics of Hawaiian volcanoes. Editors M. P. Poland, T. J. Takahashi, and C. M. Landowski (U.S. Geological Survey), 179–234. doi:10.3133/pp18015
Pyle, D. M. (1995). Mass and energy budgets of explosive volcanic eruptions. Geophys. Res. Lett. 22, 563–566. doi:10.1029/95GL00052
Pyle, D. M. (2015). “Sizes of volcanic eruptions,” in Encyclopedia of volcanoes. Editors H. Sigurdsson, B. F. Houghton, S. R. McNutt, H. Rymer, and J. Stix (NewYork, NY: Academic Press), 257–264. doi:10.1016/B978-0-12-385938-9.00013-4
Ramsey, M. S., and Flynn, I. (2020). The spatial and spectral resolution of aster infrared image data: A paradigm shift in volcanological remote sensing. Remote Sens. 12 (4), 738. doi:10.3390/rs12040738
Ramsey, M. S., and Harris, A. J. L. (2013). Volcanology 2020: how will thermal remote sensing of volcanic surface activity evolve over the next decade? J. Volcanol. Geotherm. Res. 249, 217–233. doi:10.1016/j.jvolgeores.2012.05.011
Ramsey, M. S., Harris, A. J. L., and Watson, I. M. (2021). Volcanology 2030: will an orbital volcano observatory finally become a reality? Bull. Volcanol. 84 (1), 6. doi:10.1007/s00445-021-01501-z
Rothery, D., Coppola, D., and Saunders, C. (2005). Analysis of volcanic activity patterns using MODIS thermal alerts. Bull. Volcanol. 67, 539–556. doi:10.1007/s00445-004-0393-3
Rouwet, D., Mora-Amador, R., Ramírez, C., González, G., Baldoni, E., Pecoraino, G., et al. (2021). Response of a hydrothermal system to escalating phreatic unrest: the case of Turrialba and irazú in Costa Rica (2007–2012). Earth Planets Space 73, 142. doi:10.1186/s40623-021-01471-8
Sahetapy-Engel, S. T., and Harris, A. J. L. (2009). Thermal structure and heat loss at the summit crater of an active lava dome. Bull. Volcanol. 71, 15–28. doi:10.1007/s00445-008-0204-3
Saing, U. B., and Bani, P. (2014). Ibu volcano, a center of spectacular dacite dome growth and long-term continuous eruptive discharges. Journal of Volcanology and Geothermal Research 282, 36–42. doi:10.1016/j.jvolgeores.2014.06.011
Sherrod, D. R., Scott, W. E., and Stauffer, P. H. (2008). A volcano rekindled; the renewed eruption of Mount St. Helens, 2004-2006. U.S. Geological Survey. doi:10.3133/pp1750
Shevchenko, A., Dvigalo, V., and Svirid, I. (2015). Airborne photogrammetry and geomorphological analysis of the 2001–2012 exogenous dome growth at Molodoy Shiveluch Volcano, Kamchatka. J. Volcanol. Geotherm. Res. 304, 94–107. doi:10.1016/j.jvolgeores.2015.08.013
Shevchenko, A. V., Dvigalo, V. N., Zorn, E. U., Vassileva, M. S., Massimetti, F., Walter, T. R., et al. (2021). Constructive and destructive processes during the 2018–2019 eruption episode at Shiveluch volcano, kamchatka, studied from satellite and aerial data. Front. Earth Sci. 9. doi:10.3389/feart.2021.680051
Shinohara, H. (2008). Excess degassing from volcanoes and its role on eruptive and intrusive activity. Rev. Geophys. 46 (4), 244. doi:10.1029/2007RG000244
Stevenson, S. (1993). Physical models of fumarolic flow. J. Volcanol. Geotherm. Res. 57 (3–4), 139–156. doi:10.1016/0377-0273(93)90009-G
Stevenson, D., and Blake, S. (1998). Modelling the dynamics and thermodynamics of volcanic degassing. Bull. Volcanol. 60, 307–317. doi:10.1007/s004450050234
Tuffen, H., James, M., Castro, J., and Schipper, I. (2013). Exceptional mobility of an advancing rhyolitic obsidian flow at Cordón Caulle volcano in Chile. Nat. Commun. 4, 2709. doi:10.1038/ncomms3709
Valade, S., Coppola, D., Campion, R., Ley, A., Boulesteix, T., Taquet, N., et al. (2023). Lava dome cycles reveal rise and fall of magma column at Popocatépetl volcano. Nat. Commun. 14, 3254. doi:10.1038/s41467-023-38386-9
Vergniolle, S., and Métrich, N. (2022). An interpretative view of open-vent volcanoes. Bull. Volcanol. 84, 83. doi:10.1007/s00445-022-01581-5
Verhoogen, J. (1980). Energetics of the Earth national research council. Washington, DC: The National Academies Press. doi:10.17226/9579
Wadge, G., Voight, B., Sparks, R. S. J., Cole, P. D., Loughlin, S. C., and Robertson, R. E. A. (2014). “An overview of the eruption of soufriere Hills volcano, Montserrat from 2000 to 2010,” in The eruption of soufriere Hills volcano, Montserrat from 2000 to 2010. Editors G. Wadge, and R. E. A. Robertson (London: Geological Society of London), 1–40.
White, S. M., Crisp, J. A., and Spera, F. J. (2006). Long-term volumetric eruption rates and magma budgets. Geochem. Geophys. Geosyst. 7 (3), Q03010. doi:10.1029/2005GC001002
Wilson, L. (1980). Relationships between pressure, volatile content and ejecta velocity in three types of volcanic explosion. J. Volcanol. Geotherm. Res. 8, 297–313. doi:10.1016/0377-0273(80)90110-9
Wilson, L., Sparks, R. S. J., Huang, T. C., and Watkins, N. D. (1978). The control of volcanic column heights by eruption energetics and dynamics. J. Geophys. Res. Solid Earth 83, 1829–1836. doi:10.1029/JB083iB04p01829
Wooster, M. J., Zhukov, B., and Oertel, D. (2003). Fire radiative energy for quantitative study of biomass burning: derivation from the BIRD experimental satellite and comparison to MODIS fire products. Remote Sens. Environ. 86, 83–107. doi:10.1016/S0034-4257(03)00070-1
Wright, R., Blackett, M., and Hill-Butler, C. (2015). Some observations regarding the thermal flux from Earth’s erupting volcanoes for the period of 2000 to 2014. Geophys Res. Lett. 42, 282–289. doi:10.1002/2014GL061997
Wright, R., Flynn, L. P., Garbeil, H., Harris, A. J. L., and Pilger, E. (2002). Automated volcanic eruption detection using MODIS. Remote Sens. Environ. 82, 135–155. doi:10.1016/S0034-4257(02)00030-5
Wright, R., Flynn, L. P., Garbeil, H., Harris, A. J. L., and Pilger, E. (2004). Modvolc: near-real-time thermal monitoring of global volcanism. J. Volcanol. Geotherm. Res. 135, 29–49. doi:10.1016/j.jvolgeores.2003.12.008
Wright, R., and Flynn, L. P. (2004). Space-based estimate of the volcanic heat flux into the atmosphere during 2001 and 2002. Geology 32, 189–192. doi:10.1130/G20239.1
Wright, R. (2016). “Modvolc: 14 years of autonomous observations of effusive volcanism from space,” in Detecting, modelling and responding to effusive eruptions. Editors A. J. L. Harris, T. De Groeve, F. Garel, and S. A. Carn (London: Geological Society, London, Sp. Pub.), 23–54. doi:10.1144/SP426.12
Wright, R., and Pilger, E. (2008). Radiant flux from Earth's subaerially erupting volcanoes. Int. J. Remote Sens. 29, 6443–6466. doi:10.1080/01431160802168210
Keywords: volcanic radiative power (VRP), MIROVA, global volcano activity, MODIS, database
Citation: Coppola D, Cardone D, Laiolo M, Aveni S, Campus A and Massimetti F (2023) Global radiant flux from active volcanoes: the 2000–2019 MIROVA database. Front. Earth Sci. 11:1240107. doi: 10.3389/feart.2023.1240107
Received: 14 June 2023; Accepted: 19 September 2023;
Published: 06 October 2023.
Edited by:
Nick Varley, University of Colima, MexicoReviewed by:
Muhammad Aufaristama, University of Twente, NetherlandsCopyright © 2023 Coppola, Cardone, Laiolo, Aveni, Campus and Massimetti. This is an open-access article distributed under the terms of the Creative Commons Attribution License (CC BY). The use, distribution or reproduction in other forums is permitted, provided the original author(s) and the copyright owner(s) are credited and that the original publication in this journal is cited, in accordance with accepted academic practice. No use, distribution or reproduction is permitted which does not comply with these terms.
*Correspondence: D. Coppola, ZGllZ28uY29wcG9sYUB1bml0by5pdA==
Disclaimer: All claims expressed in this article are solely those of the authors and do not necessarily represent those of their affiliated organizations, or those of the publisher, the editors and the reviewers. Any product that may be evaluated in this article or claim that may be made by its manufacturer is not guaranteed or endorsed by the publisher.
Research integrity at Frontiers
Learn more about the work of our research integrity team to safeguard the quality of each article we publish.