 Steven P. Lund
- Department Earth Sciences, University of Southern California, Los Angeles, CA, United States
This study characterizes the paleomagnetic secular variation (PSV) in five Holocene records from Eastern North America. We have determined equi-spaced (100-year) declination and inclination time series for the five sites and compared their directional variability. We note ten correlatable features in both inclination and declination, which indicate that these five PSV records all lie within the same PSV region. We focus on clockwise or counter-clockwise looping of paleomagnetic directions (termed circularity) in these PSV records. We have used two techniques to estimate the circularity. We have first calculated the rate and direction of motion in 200-year intervals for each record. We have also looked for discernable looping (full loops down to 1/2 loops) in individual records. We estimate the loop sizes, durations, and circularity direction. We note the same pattern of circularity in both methods. There are seven intervals of alternating circularity in all five sites. They normally agree in timing and direction of circularity. Both methods suggest an alternating, teeter-totter like, behavior to PSV circularity. This teeter-totter behavior is unbalanced with more time spent in counter-clockwise motion than in clockwise motion. The loops have a distribution of sizes and durations with smaller loops being shorter in duration (400–800 years) and bigger loops having longer durations (600–1,200 years). The teeter-totter alternation of clockwise versus counter-clockwise circularity is distinctive and may be a normal aspect of PSV. The alternation is not consistent with several traditional ideas about fluid flow (drift, whirling motion, simple convection) in the outer core. Recent studies have identified torsional oscillations as a source for both historical short-term (decadal) and millennial-scale (103) secular variation. Such a pattern of fluid flow might create the alternating teeter-totter-like behavior of circularity that we see. All five PSV records also display five short (<400 years) intervals of higher-amplitude acceleration and faster PSV rates. These features are analogous to geomagnetic jerks in that they are short intervals of anomalous acceleration. Previous studies showed evidence in PSV for similar anomalous acceleration intervals (∼102 yrs). We think our anomalous intervals are comparable to them.
Introduction
Our understanding of the geomagnetic field and its variability (secular variation) comes from measurements of the field, both instrumental and paleomagnetic, and various types of models. (See Merrill et al. (1998) for review.). One key to unraveling the core dynamo mechanism(s) that generates the field is the pattern of directional field variability (poloidal field) at the Earth’s surface. Poloidal field lines are generated in the outer core by magnetic flux regeneration associated with turbulent fluid movement of (primarily) outer core liquid iron. Surface field secular variation must, in some manner, reflect that turbulent outer-core flow.
One distinctive feature of secular variation that has been noted both in historical secular variation (HSV) and paleomagnetic secular variation (PSV) is a pattern of looping (either clockwise or counter-clockwise) in plots of field inclination plotted against declination (e.g., Bauer, 1895). This pattern is often referred to as circularity. Many studies have identified the existence of looping in HSV and PSV (Thompson and Barraclough, 1982; Lund and Banerjee, 1985; Smith and Creer, 1986). But very few studies have tried to understand the sequential pattern of looping at any one location on the Earth’s surface.
Lund (2020) recently used two different methods to characterize the pattern of looping in Holocene PSV records from East Asia. That study noted a distinctive teeter-totter like alternation in clockwise versus counter-clockwise looping for at least the last 3,000 years. This study uses the same methods to study looping in published Holocene PSV records from Eastern North America. The question is whether the two distinct regions have a similar pattern of looping and, if so, why? The overall character of circularity noted in secular variation studies has been previously summarized by Lund (2020).
Regional pattern of PSV circularity
There are five sites in Eastern North America that have high-resolution, well-dated PSV records for the last 3,000–8,000 years (Figure 1; Table 1; Supplementary Appendix 1). The studies come from three lake sediment studies (Sandy Lake PA (SAN), Lake Lebeouf PA (LEB), and Seneca Lake NY (SEN)), and two deep-sea sediment studies (Core 2,220 and the East Canada Stack (ECS)). All of these sites have records of both inclination and declination variability. All of them are well dated (Table 1). Several of these records have been previously analyzed by Lund (1996) and Lund et al. (2021).
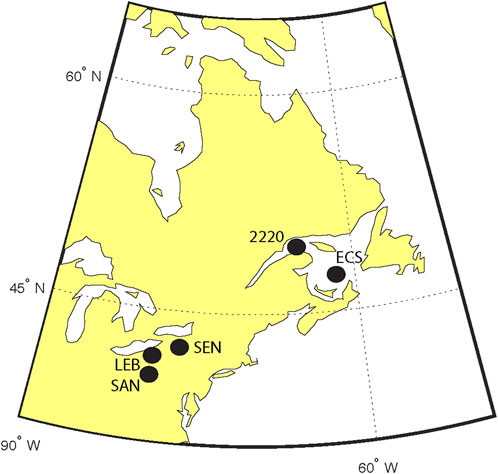
FIGURE 1. Map of Eastern North America showing the sites of five paleomagnetic studies discussed in the text.
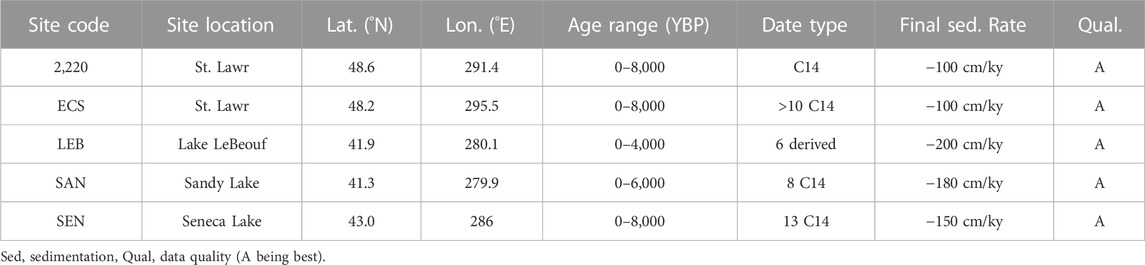
TABLE 1. Summary of eastern North American paleomagnetic secular variation records used in this study.
Sandy Lake PA (SAN) was studied by King (1983). The lake has a 6000-yr PSV record that was dated by 8 radiocarbon dates. Lake LeBeouf PA (LEB) and Seneca Lake NY (SEN) were studied by King (1983) and King et al. (1983). LEB has a 4000-yr PSV record dated by 6 radiocarbon dates. SEN has an 8000-year PSV record that is dated by 4 radiocarbon dates. All three of these PSV records were compared with other North American PSV records by Lund (1996). Lund (1996) also provided a correction to the radiocarbon dating so the records used here are in absolute years AD/BC. Core 2,220 from the St. Lawrence Estuary was studied by St. Onge et al. (2003). The core was dated by 6 calibrated radiocarbon dates. A stack for eastern Canada Holocene PSV records (ECS) was developed by Barletta et al. (2010). The stack includes core 2,220 and five other PSV records from the same St. Lawrence Estuary region. Barletta et al. (2010) developed a calibrated age model for all these records based on 30 radiocarbon dates.
Sample errors for the sediment records were determined by calculating the mean and standard deviation (SD, 1 sigma) for 3 successive sample measurements. It was presumed that true field variation in such a small interval was negligible and that the SD would be a good estimate of sample error.
Figures 2, 3 show the five best inclination and declination records for the last 3,000 years (small closed circles). The summary historical measurements (open squares) for the last ∼400 years, termed gufm1 (Jackson et al., 2000), are also shown. We have also developed equi-spaced time series with 100-yr increments for these PSV studies (larger solid circles connected in Figures 2, 3) using linear jnterpolation between any two sequential inclination or declination data. There are 10 reproducible scalar features in the inclination and declination records (a-j in Figures 2, 3). The equi-spaced time series are summarized in Table 1 and listed in Supplementary Appendix S1. The typical directional difference between the actual PSV data and their PSV models is less than ±1°.
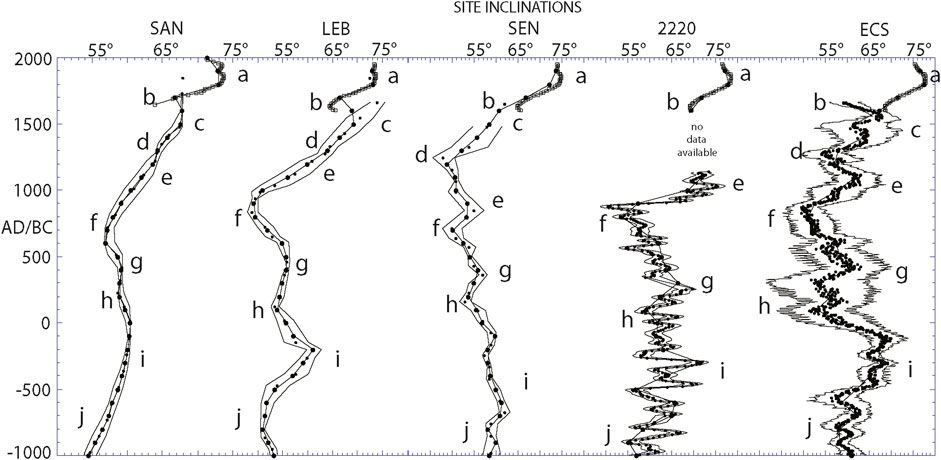
FIGURE 2. A summary of the best quality PSV inclination records for Eastern North America over the last 3,000 years. Small solid circles are PSV data from published records; lines to either side indicate ± 1-sigma standard deviation. Large connected solid circles are equi-spaced model inclination time series for each record (100 years spacing). Open squares indicate estimates of historical field for each locality determined by Jackson et al. (2000). The typical difference between model and original data is less than ±1°.
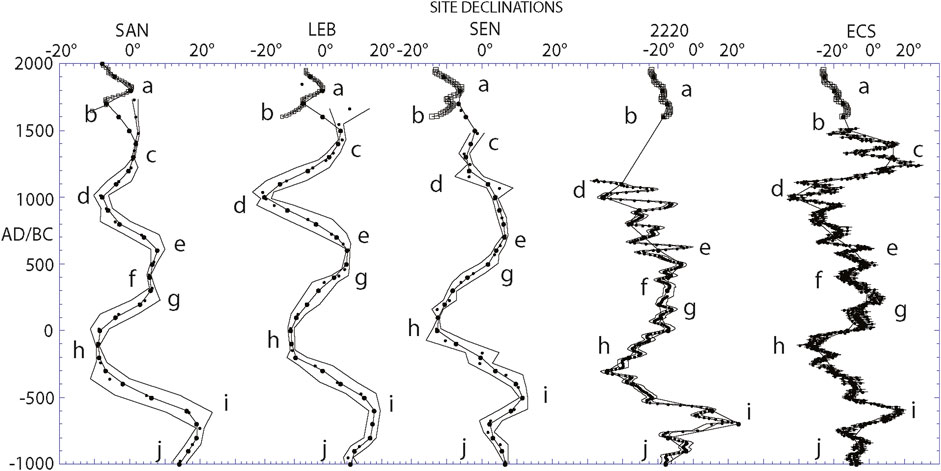
FIGURE 3. A summary of the best quality PSV declination records for Eastern North America over the last 3,000 years. Small closed circles are PSV data from published records; lines to either side indicate ± 1-sigma standard deviation. Larger connected solid circles are equi-spaced model declination time series for each record (100 years spacing). Open squares indicate estimates of historical field for each locality determined by Jackson et al. (2000). The typical difference between model and original data is less than ±1°.
Circularity estimates
The pattern of circularity has been estimated in two ways. We first calculated the amplitude and direction of circularity in the smallest available time interval—200 years. Figure 4A, B show two examples of 200-yr circularity intervals. Three successive data points are needed to define arcuate motion. There is no circularity if the three directions fall on a straight line. But, if the three directions form a triangle (Figures 4A, B) then we can estimate both the circularity direction and the “amplitude” of the circularity (the triangular area associated with the three points). All calculations were done in 100-yr steps with the central year (of three data points) defining the calculation year. This circularity estimate was carried out using a 36-step excel spreadsheet calculation. (The methodology is available on request.) (One reviewer, Dr. Javier Pavon-Carrasco, ZmpwYXZvbkB1Y20uZXM=, has used a more elegant methodology to arrive at the same circularity estimate presented here. He is willing to provide the methodology on request.)
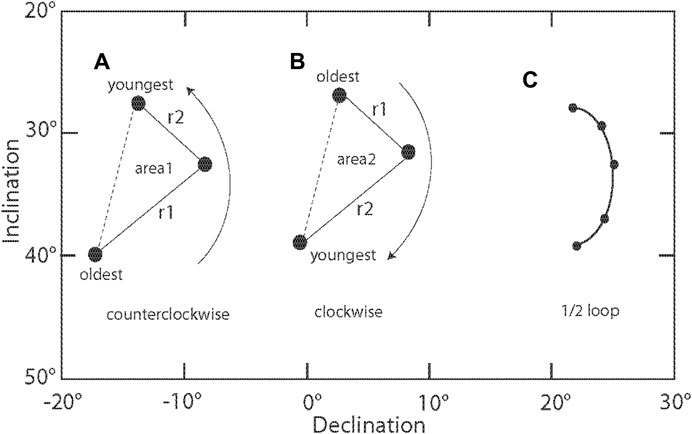
FIGURE 4. Graphical representation of the methodology used to calculate circularity amplitudess (A, B) and looping patterns (C). Areas of looping in (A, B) are measured in arc degrees squared (area).
The results of the three-point (200 years) circularity calculation for all five sites over the last 3,000 years are shown in Figure 5 (open circles). The value magnitudes indicate the area of the three-point triangles (in arc degrees squared) with positive values indicating clockwise motion and negative values indicating counter-clockwise motion. There are occasionally amplitudes that are almost zero, indicating simple linear, not arcuate, motion for each 200-yr increment. But, more than 90% of the values do indicate some sense of circularity. A 3-pt running average of the 200-yr circularity magnitudes was used to produce a more long-term (400 years) sense of circularity for all five sites over the last 3,000 years (Figure 5, closed circles). This gives a more smoothed/integrative sense of circularity. All five sites seem to show the same general pattern of circularity with 300–900 years of one sense of circularity alternating with the other sense of circularity. We have labeled seven alternating intervals of circularity (A-G).
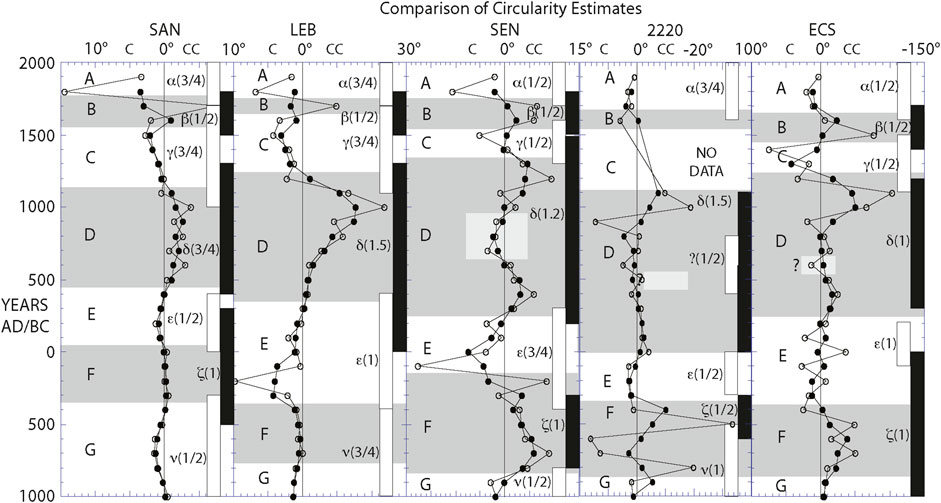
FIGURE 5. The results of two methods for calculating circularity for each model time series. Circularity amplitudes are plotted for 3-point, 200 year, intervals (open circles). Solid circles are 3-pt running average (400 year interval) of open circle circularity. Circularity at each site in units of degrees squared (area) At left in each column is an alphanumeric zonation of intervals dominated by counter-clockwise (grey intervals) and clockwise (white intervals) circularity. At right, are columns labeled with Greek lettering that indicate intervals of distinctive looping (black columns have counter-clockwise looping and white columns have clockwise looping).
There is good agreement among the circularity estimates of the five time series, but the interval from 400 to 900 AD is marked by low amplitude circularity and SEN, 2,220, and ECS have some evidence of small amplitude clockwise circularity while the other two time series have small amplitude counter-clockwise circularity. This is probably an artifact of the data. Overall, all five records show the same 7 alternating counter-clockwise/clockwise pattern of circularity.
We can also estimate circularity by looking for notable looping intervals in the time series. We looked for complete loops (usually five or more points (>400 years of circularity), but accepted partial loops that appeared to be at least ½ loop (Figure 4C). We identified 7 complete or partial loops in all five time series. That is the same number of looping intervals noted above by the time series analysis. Table 2 summarizes the loops in each time series. Figure 5 shows the identified looping intervals at the right of each site (white intervals are clockwise loops, black intervals are counter-clockwise loops). There are always transitions between clockwise and counter-clockwise looping that allow 100–300 years overlaps in circularity sense. We labeled the notable loops α-ν (numbers in parentheses indicate a whole loop or partial loop) and we see evidence for each of these loops in all five time series. The loops are always present and most of the correlatable loops are the same sense of circularity. Some loops are a bit longer or shorter in duration than others from the same time interval and there is some variation in overall size of comparable loops.
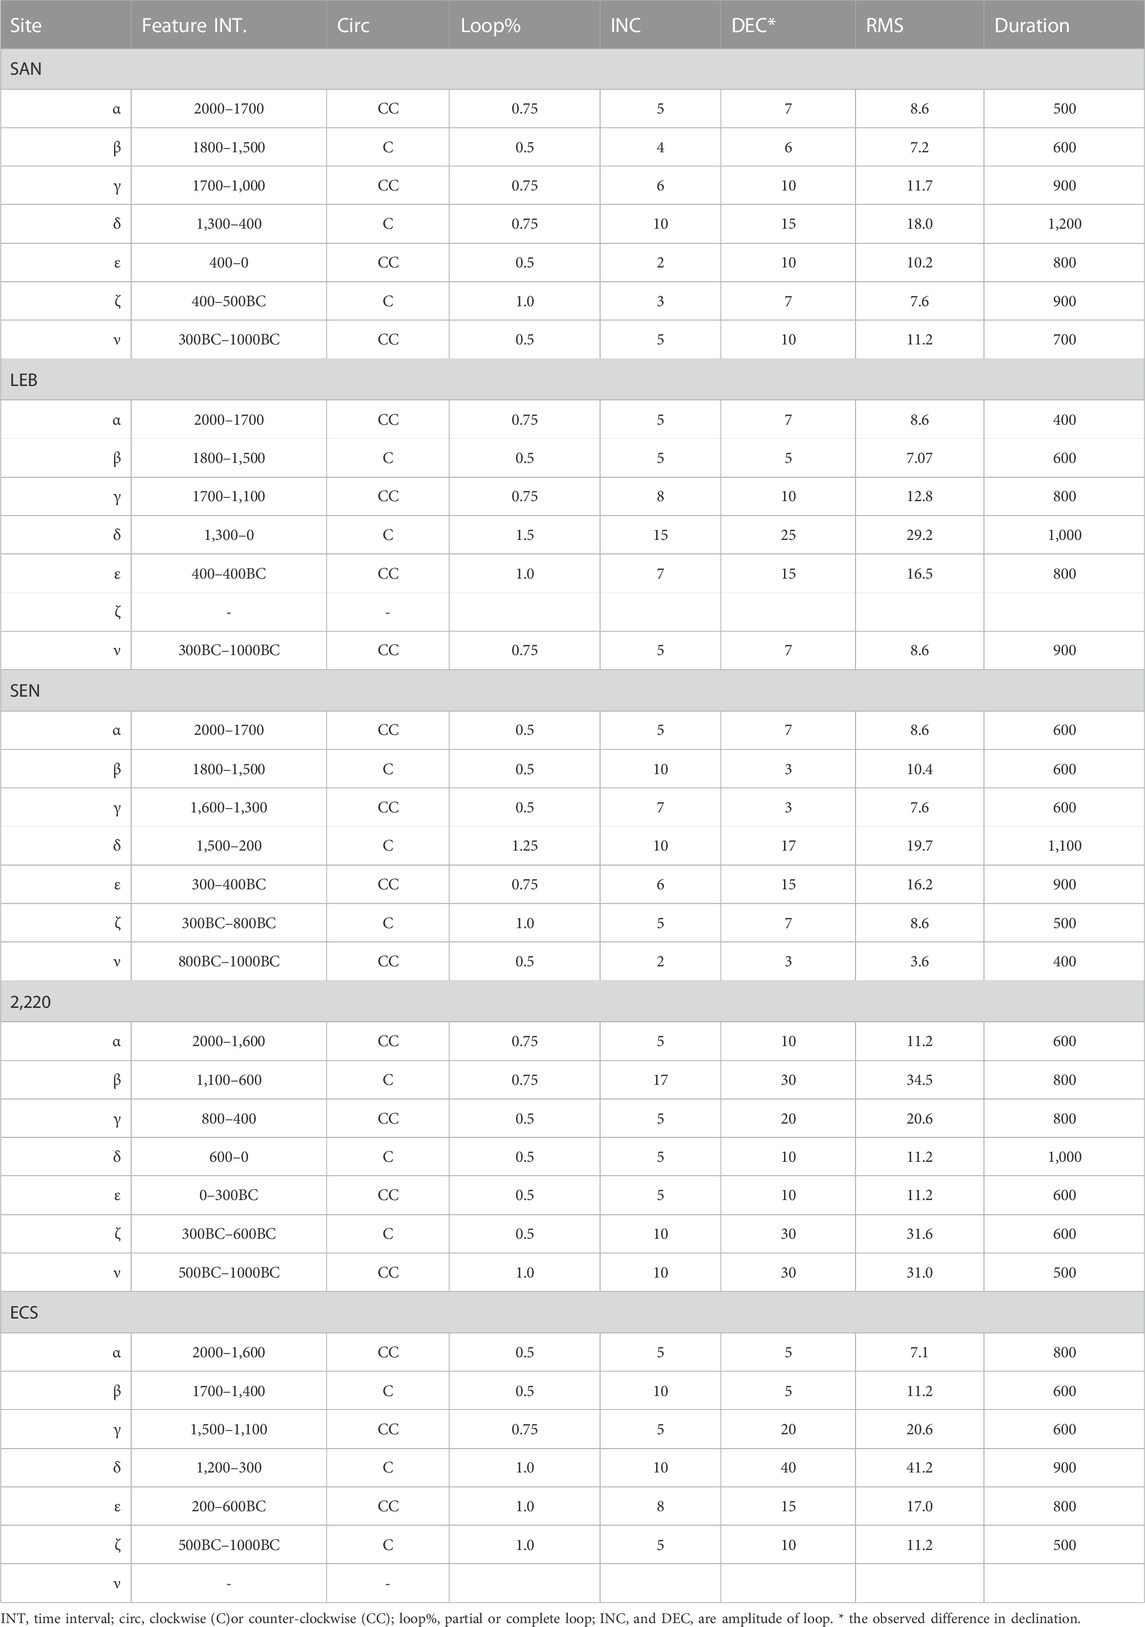
TABLE 2. summary of circularity timing and direction for the last 3,000 years.
Figure 6 plots the pattern of circularity in four intervals. Figure 6A, B6 plot the circularity at LEB and ECS for the last 1,500 years. They clearly show the alternating C/CC oscillations in circularity that are summarized in Figure 5. Figures 6C, D plot the circularity at LEB and SEN for 500 AD–1000 BC. Here, too, one can see a clear alternation of circularity as summarized in Figure 5.
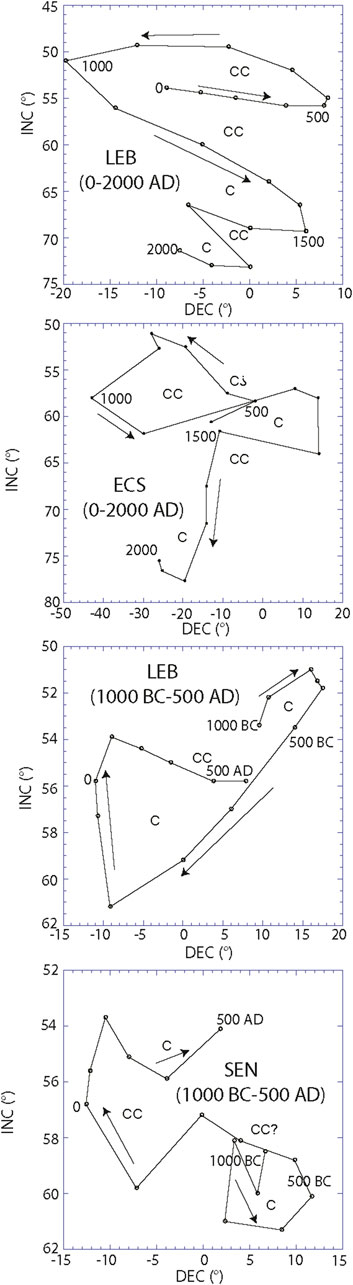
FIGURE 6. Bauer plots of inclination versus declination movement versus time within each time series. Clockwise (C) or counter-clockwise (CC) loops are shown for clarity.
We can estimate loop size by determining the inclination and declination span for each loop (Table 2). Loop size is affected by site latitude. We have normalized the declination spans by COS(site latitude). We have calculated an overall “amplitude” for each loop as the RMS of the inclination and normalized declination spans. The loop “amplitudes” and durations (for a complete loop) are plotted in Figure 7A. There is a fairly linear trend with smaller loops having shorter durations and larger loops having longer durations. There is also a bias for larger amplitude/longer duration loops being counter-clockwise.
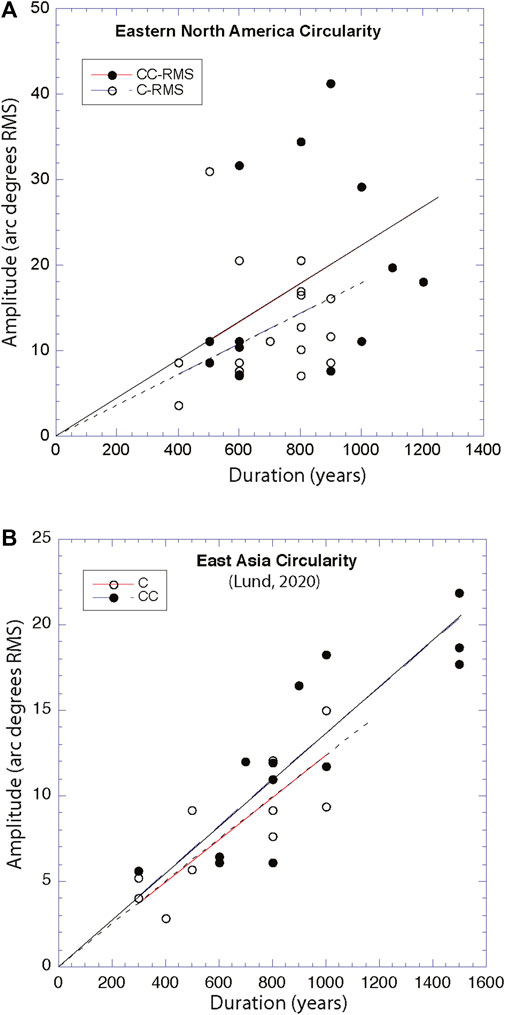
FIGURE 7. Plot of individual discernable loops by duration versus overall amplitude. (A) is data from Eastern North America. (B) is data from East Asia. Amplitudes are calculated in Table 2. The straight-line fit through the data give a sense of shorter (longer) duration loops being smaller (larger) in amplitude. RMS is root mean square. See Table 2.
This pattern is almost identical to that noted for Holocene East Asia (Lund, 2020) shown in Figure 7B). Here, too, the looping pattern has shorter-duration (longer-duration) loops being smaller (larger) in amplitude and the largest/longest loops being counter-clockwise. (Note that there is an error in circularity sign in Lund (2020). This is corrected in Figure 7.) Thus, there is here, too, a bias to counter-clockwise circularity over clockwise circularity. Also, in both regions, the circularity pattern is an alternation of clockwise versus counter-clockwise looping with neither lasting much more than one full loop. This teeter-totter effect is very distinctive and also seems to be present in recent longer-duration Pleistocene PSV records now under analysis (Lund, in review). These are the only two Holocene regions to undergo this type of circularity analysis. Yet, it seems that this distinctive pattern may be normal for overall PSV. Further studies are under way to test these observations further.
Three of the PSV time series (SEN, 2,220, ECS)) are 8,000 years in age. These time series are plotted in Figure 8. The circularity estimates of these three PSV records are plotted in Figure 9. The horizontal tie lines indicate circularity intervals that the sites have in common. Intervals A-G are also shown in Figure 5. Circularity is more subdued before 1000 BC. This may be due to reduced data resolution, but the same pattern is noted in the East Asia data (Lund, 2020).
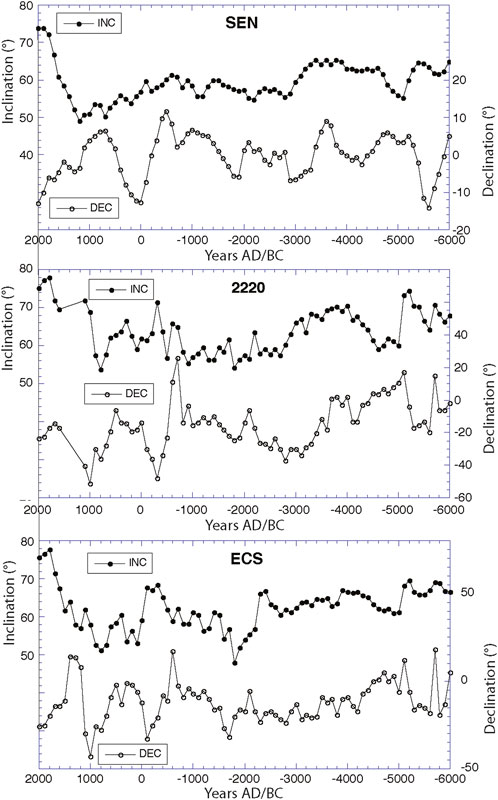
FIGURE 8. Inclination and declination models of the three longest PSV records from the Eastern North America region.
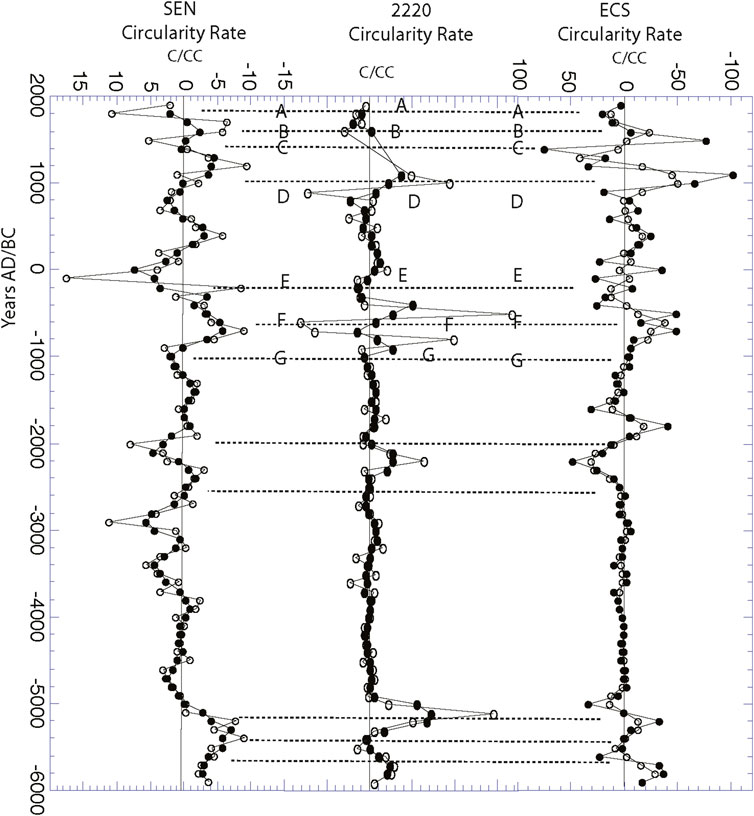
FIGURE 9. Circularity calculation for the three longest PSV records. True circularity amplitude (arc degree squared) s are plotted for 3-point (open circles) and 5-point (solid circles) circularity at each site. The alphanumeric letters correspond to the same zones plotted in Figure 5.
One last observation is that most or all five sites have the same short-duration, but largest-amplitude, circularity intervals. The circularity estiamtes are shown in Figure 10 (open circles) and Figure 5. We have also calculated the incremental secular variation rates for the intervals 0–100 years and 100–200 years (labeled r1 and r2 in Figure 4A, B4) for each circularity interval and averaged them. The 100-year secular variation averaged over a 200-year intervals are also plotted in Figure 10 (solid circles). It is clear that the narrow intervals of highest-amplitude circularity are also the intervals of highest-rate average absolute secular variation. Arrows in Figure 10 show 5 intervals of highest circularity and secular variation rate that seem to be common to most of the records. The high rate intervals tend to occur at the boundaries between clockwise and counter-clockwise circularity and at times of changing intensity (rather than at times of intensity peaks or troughs) (Figure 11). This is clearest at the onset and termination of clockwise intervals B and F in Figure 10. Similar short intervals of high circularity and secular variation rate are noted in East Asia. But they do not generally occur at the same times as in Eastern North America.
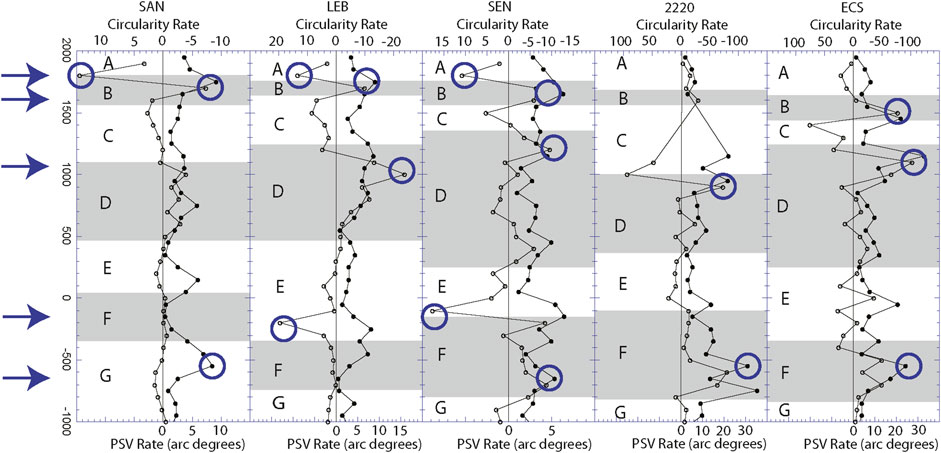
FIGURE 10. Comparison of true circularity amplitude (arc degree squared, 3-pt average, open circles) with absolute interval secular variation rate (arc degrees over same interval as circularity) irrespective of directional circularity.
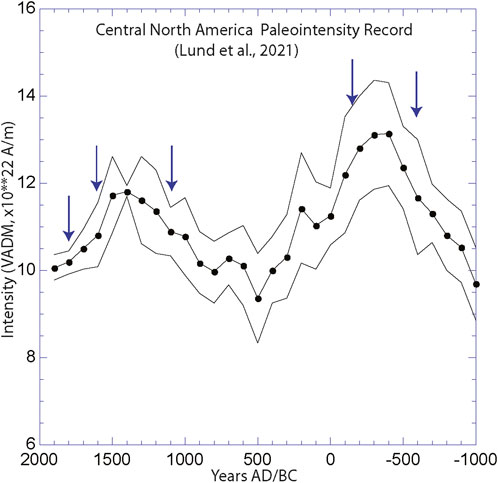
FIGURE 11. Paleointensity record for central North America (Lund et al., 2021). Arrows indicate intervals of fast circularity or PSV rate.
Discussion
Secular variation has been associated with several different fluid motions in the Outer Core. Any “linear” trend in outer-core motion (eastward, westward, poleward) should produce one persistent type of looping. “Whirlpool” motion with magnetic directions “spinning” clockwise or counter-clockwise will also show one pattern of looping. However, our data suggest a “teeter-totter” pattern with alternating clockwise and counter-clockwise motion. We never see two consecutive full clockwise or counter-clockwise loops in either the Holocene Eastern North America PSV or the East Asia PSV (Lund, 2020).
It seems likely that a significant component of the Outer Core fluid flow (and resulting secular variation) oscillates back and forth between clockwise and counter-clockwise states. Figure 5 suggests maybe 3 or 4 such oscillations within the last 3,000 years in Eastern North America. This is seen in both estimates of circularity—circularity amplitudess and larger–scale looping. This is also seen in Holocene East Asia (Lund, 2020). Previous PSV studies have sometimes estimated coherent intervals of circularity that last 6–10 thousand years (e.g., Lund and Banerjee, 1985). It may be that a more careful (regional) analysis, such as carried out here, might see evidence of more complexity in circularity than previously noted.
The amplitude versus duration of circularity in our study is distinctive. There are shorter intervals of circularity, perhaps as little as 300–400 years in duration with relatively low circularity amplitudes (or looping amplitudes). There is also evidence of at least one interval of circularity that lasts perhaps 1,000–1,200 years and has large amplitude looping (Figure 7A). Even larger counter-clockwise loops (∼1,500 years) are seen in Holocene PSV from East Asia (Lund, 2020) (Figure 7B).
The duration of individual cycles also seems to be unbalanced. More than 2/3 of the last 3,000 years in both Eastern North America and East Asia have been periods of counter-clockwise circularity. Individual periods of clockwise circularity always last less than 1,000 years and average ∼700 years (Figure 7). Counter-clockwise loops tend to average ∼1,000 years. It is not clear that there is such a bias between 3,000 and 8,000 years BP (Figure 9) but the data are less numerous or as high in quality as data for the last 3,000 years (Figure 5).
Studies of anomalous historical secular variation intervals, which are termed geomagnetic jerks (Courtillot and LeMouel, 1976; Courtillot and LeMouel, 1984), have been associated with azimuthal (torsional) oscillations of outer core fluids on yearly intervals (Bloxham et al., 2002). Dumberry and Bloxham (2006) have also suggested that azimuthal oscillating flows might be a major cause of PSV on a millennial scale. If such zonal oscillations are combined regionally with more complex fluid flow that can lead to magnetic flux regeneration, then this might be the source of our circularity observations. Dumberry and Bloxham (2006) also suggested the azimuthal torsional oscillation might occur against a background of more steady fluid flow. This might account for the unbalanced time spent in clockwise versus counter-clockwise circularity. Torsional oscillation in the direction of steady flow might lead to longer time intervals of one sense of circularity (counter-clockwise), while oscillations opposite the direction of steady flow might lead to shorter time intervals of the opposite sense of circularity (clockwise).
Another PSV feature that all records share is that circularity amplitudes significantly increase for short time periods (<400 years) at the transitions from one sense of looping to the other (Figures 5, 10). Secular variation rates are also highest at these times (Figure 10). These short intervals of high circularity amplitudes (Figures 5, 10) are quite distinctive with amplitudes up to 5 times that of normal circularity intervals. Similar short interval increased rates of PSV have been noted in Holocene East Asia PSV.
These short intervals of accelerated secular variation are broadly analogous to historic magnetic field jerks (Courtillot and LeMouel, 1976; Courtillot and LeMouel, 1984). These intervals of anomalously fast secular varation last only 1–2 years in the context of historical field variability. Gallet et al. (2003) identified similar abrupt (102 years) cusps or hairpins in Holocene European PSV data that they associated with high paleointensity intervals. Gallet et al. (2003) called these events archeomagnetic jerks and argued that they were intermediate between geomagnetic jerks (100 years) and magnetic field excursions (103 years). It is probably better to refer to these as paleomagnetic jerks since they can be recorded in sediment PSV records as well as archeological time series. It seems reasonable that our short-duration intervals of accelerated secular variation are also examples of paleomagnetic jerks or impulses. Altogether, these various “short” intervals of anomalous secular variation rate may reflect an intrinsic, chaotic element in the overall dynamo process.
Figure 11 shows the late Holocene central North American paleointensity record (Lund et al., 2021). This composite record included paleointensity estimates from the LEB, SEN, 2,220, and ECS PSV records. Arrows indicate the highest amplitude circularity an overall PSV in our records (Figure 10). All of our accelerated intervals seem to be associated with relatively fast-changing intensity, either increasing or decreasing. There does not seem to be any indication of fast PSV at intensity highs or lows as was noted for East Asia (Lund, 2020). More regional studies are needed to carefully assess these relationships.
Conclusion
This study characterizes the PSV in five Holocene records from Eastern North America. We have determined equi-spaced (100-year increment) declination and inclination time series for the five sites and compared their overall directional variability. We note ten correlatable features in both inclination and declination. These comparisons indicate that these five PSV records all estimate the same regional PSV pattern for Eastern North America.
We focus on the clockwise or counter-clockwise looping of paleomagnetic directions (termed circularity) in these PSV records. We have used two techniques to estimate the directional circularity of each PSV record. We have first calculated the amplitude and direction of motion (clockwise or counter-clockwise) in 200-year increments for each record over the last 3,000–8,000 years. We have also looked for discernable looping (full loops down to 1/2 loops) in individual records. We estimate the loop sizes, durations, and circularity direction.
We see the same pattern of circularity in both methods. There are seven intervals of alternating circularity (clockwise versus counter-clockwise) in all five sites. They generally agree in timing and direction of circularity. We also see evidence for seven discernable directional loops alternating between clockwise and counter-clockwise in all five records. Both methods suggest an oscillating, teeter-totter like, behavior to PSV circularity. This should relate to the pattern of fluid flow/magnetic flux regeneration in the outer core. This teeter-totter behavior is unbalanced with more time spent in counter-clockwise motion than in clockwise motion. The loops tend to have a distribution of sizes and durations with smaller loops being shorter in duration (400–800 years) and bigger loops having longer durations (600–1,200 years).
The teeter-totter alternation of clockwise versus counter-clockwise circularity is distinctive and may be a normal aspect of PSV. The alternation is not consistent with several traditional ideas about fluid flow (drift, whirling motion, simple convection). Recent studies have identified torsional oscillations as a source for both historical short-term (100) and millennial-scale (103) secular variation (Bloxham et al., 2002; Dumberry and Bloxham, 2006). Such a pattern of fluid flow might create the alternating teeter-totter-like behavior of circularity.
One additional feature of the circularity bears special note. All five PSV records display short (200–400 years) intervals of significant acceleration in circularity amplitude combined with change in circularity direction. Faster acceleration means faster and larger amplitude changes in circularity or PSV rate as a function of time. We see evidence for five of these short intervals. These features are also intervals of the fastest regular secular variation rates in all the records. These features are analogous to geomagnetic jerks (Courtillot and LeMouel, 1976; Courtillot and LeMouel, 1984) in that they are short intervals of anomalous acceleration. But geomagnetic jerks occur historically every 20–40 years and last only 1–2 years. Gallet et al. (2003) showed evidence in PSV for similar anomalous acceleration intervals (∼102 yrs), which they termed archeomagnetic jerks. We think our anomalous intervals are comparable to those of Gallet et al. (2003). We think these features are a normal component of directional PSV.
Data availability statement
The datasets presented in this study can be found in online repositories. The names of the repository/repositories and accession number(s) can be found in the article/Supplementary Material.
Author contributions
SL carried out the analysis and wrote the manuscript.
Conflict of interest
The author declares that the research was conducted in the absence of any commercial or financial relationships that could be construed as a potential conflict of interest.
Publisher’s note
All claims expressed in this article are solely those of the authors and do not necessarily represent those of their affiliated organizations, or those of the publisher, the editors and the reviewers. Any product that may be evaluated in this article, or claim that may be made by its manufacturer, is not guaranteed or endorsed by the publisher.
Supplementary material
The Supplementary Material for this article can be found online at: https://www.frontiersin.org/articles/10.3389/feart.2023.1239708/full#supplementary-material
References
Barletta, F., St.Onge, G., Stoner, J., Lajeunesse, P., and Locat, J. (2010). A high-resolution Holocene paleomagnetic secular variation and relative paleointensity stack from eastern Canada. Earth Planet. Sci. Lett. 298, 162–174. doi:10.1016/j.epsl.2010.07.038
Bauer, L. (1895). Distribution and secular variation of terrestrial magnetism; No. III. Amer. J. Sci. 50, 314–325. doi:10.2475/ajs.s3-50.298.314
Bloxham, J., Zatman, S., and Dumberry, M. (2002). The origin of geomagnetic jerks. Nature 420 (6911), 65–68. doi:10.1038/nature01134
Courtillot, V., and Le Mouel, J. (1976). On the long-period variations of the Earth’s magnetic field from 2 months to 20 years. J. Geophys. Res. 81, 2941–2950. doi:10.1029/jb081i017p02941
Courtillot, V., and Le Mouel, J. (1984). Geomagnetic secular variation impulses. Nature 311, 709–716. doi:10.1038/311709a0
Dumberry, M., and Bloxham, J. (2006). Azimuthal flows in the Earth's core and changes in length of day at millennial timescales. Geophys. J. Int. 165, 32–46. doi:10.1111/j.1365-246x.2006.02903.x
Gallet, Y., Genevy, A., and Courtillot, V. (2003). On the possible occurrence of ‘archaeomagnetic jerks’ in the geomagnetic field over the past three millennia. Earth Planet Sci. Lett. 214, 237–242. doi:10.1016/s0012-821x(03)00362-5
Jackson, A., Jonkers, A., and Walker, M. (2000). Four centuries of geomagnetic secular variation from historical records. Phil. Trans. Roy. Soc. A 358, 957–990. doi:10.1098/rsta.2000.0569
King, J. (1983). Geomagnetic secular variation curves for the northeastern North America for the last 9000 years. Uni. Minnesota: unpublished Ph.D. dissertatiom.
King, J., Banerjee, S., Marvin, J., and Lund, S. (1983). Use of small-amplitude paleomagnetic fluctuations for correlations and dating of continental climatic changes. Paleogeog., Paleoclim., Paleoecol. 42, 167–283.
Lund, S. (1996). A comparison of Holocene paleomagnetic secular variation records from North America. J. Geophys. Res. 101, 8007–8024. doi:10.1029/95jb00039
Lund, S. (2020). Regional character of geomagnetic field directional circularity: Holocene East Asia. Phys. Earth. Planet. Int. 308, 106572. doi:10.1016/j.pepi.2020.106572
Lund, S., and Banerjee, S. K. (1985). Late Quaternary paleomagnetic field secular variation from two Minnesota Lakes. J. Geophys. Res. 90, 803–825. doi:10.1029/jb090ib01p00803
Lund, S., Richardson, M., Verosub, K., King, J., Champion, D., and Onge, G.St. (2021). Comparison and renormalization of Holocene paleointensity records from central NorthNorth America (17°N–51°N, 205°e–295°E). Earth Space Sci 8, e2021EAOO1900. doi:10.1029/2021ea001900
Merrill, R., McElhinny, M., and McFadden, P. (1998). The magnetic field of the Earth. Academic Press, 533.
Smith, G., and Creer, K. M., 1986, Analysis of geomagnetic secular variations 10 000 to 30 000 years bp, Lac du Bouchet, France. Earth Planet. Inter., 44, 1–14. doi:10.1016/0031-9201(86)90109-3
St. Onge, G., Stoner, J., and Hillaire-Marcel, C. (2003). Holocene paleomagnetic records from the St. Lawrence Estuary, eastern Canada, centennial to millennial scale geomagnetic modulation of cosmogenic isotopes. Earth Planet. Sci. Lett. 209, 113–130. doi:10.1016/s0012-821x(03)00079-7
Keywords: secular variation, circularity, Holocene, North America, geomagnetic jerks
Citation: Lund SP (2023) Regional character of geomagnetic field directional circularity: Holocene Eastern North America. Front. Earth Sci. 11:1239708. doi: 10.3389/feart.2023.1239708
Received: 13 June 2023; Accepted: 28 September 2023;
Published: 20 November 2023.
Edited by:
Bernard A. Housen, Western Washington University, United StatesReviewed by:
Marcia Ernesto, University of São Paulo, BrazilGillian Turner, Victoria University of Wellington, New Zealand
Copyright © 2023 Lund. This is an open-access article distributed under the terms of the Creative Commons Attribution License (CC BY). The use, distribution or reproduction in other forums is permitted, provided the original author(s) and the copyright owner(s) are credited and that the original publication in this journal is cited, in accordance with accepted academic practice. No use, distribution or reproduction is permitted which does not comply with these terms.
*Correspondence: Steven P. Lund, c2x1bmRAdXNjLmVkdQ==