
94% of researchers rate our articles as excellent or good
Learn more about the work of our research integrity team to safeguard the quality of each article we publish.
Find out more
ORIGINAL RESEARCH article
Front. Earth Sci., 23 October 2023
Sec. Economic Geology
Volume 11 - 2023 | https://doi.org/10.3389/feart.2023.1238759
This article is part of the Research TopicAdvanced Techniques and Applications for Characterizing the Hydrocarbon Potential in Carbonate ReservoirsView all 5 articles
 Shaoying Chang1
 Mengxiu Wang1,2*
The challenge of identifying connectivity within karstic fracture-cavity reservoirs significantly impedes the efficient development of oil and gas resources, primarily due to our limited understanding of the developmental stages and distribution of these unique reservoirs. In this study, we employ a layered interpretation method to predict the distribution of various developmental stages within karstic reservoirs. In our approach, we first leverage our knowledge that karstic formations are primarily shaped by the water table. We reconstruct paleomorphological data and select representative wells in a chronological order from old to new. This process enables us to determine the karst base level and divide the karstic layers in individual wells. Subsequently, we identify small-scale karstic reservoirs and proceed to select isochronous sedimentary interfaces. We then flatten seismic events and map the karstic layers from wells to their corresponding seismic sections, a technique known as well-to-seismic calibration. Lastly, we provide accurate interpretations of the karstic layers, extracting root-mean-square amplitudes to predict the distribution of each reservoir. To validate the accuracy and efficiency of our method, we applied it to fracture-cavity reservoirs in the Lungu oilfield (LGX) of the Tarim Basin. Our results demonstrate the successful identification of 22 fracture-cavity reservoirs through an analysis of the distribution and connectivity of karstic reservoirs. This outcome serves as evidence that our method can significantly enhance reservoir production in terms of both efficiency and accuracy.
Currently, the primary driver of oil production in the Tarim Oilfield is the fracture–cavity karstic reservoirs located within the Ordovician strata, contributing to 30% of the field’s total oil output. These reservoirs have emerged as a pivotal element in augmenting overall production. Nevertheless, due to the considerable depth of the Ordovician strata in this region, reaching depths of up to 6,000 m, conventional exploration methods have encountered significant challenges when dealing with such ultra-deep formations. The prevailing exploration approach involves identifying and confirming distinctive bead-like strong reflections on seismic profiles, which are indicative of fault activity or dissolution processes leading to the formation of small space reservoirs, namely, the karstic carbonate rocks. Subsequently, these reflections are used to pinpoint the optimal well locations. While this methodology has yielded substantial success, it is essential to acknowledge the existence of inefficient wells given the substantial cost associated with each well, reaching as high as 20 million US dollars. Therefore, elucidating the formation mechanism of this specific reservoir type and enhancing the success rate of its development constitute pivotal steps toward cost reduction (Du et al., 2011; Liu and Wang, 2017; Ma et al., 2022).
Karstic reservoirs play a crucial role in the exploration of carbonate reservoirs and so far a series of seismic methods and techniques for recognizing carbonate reservoirs have been proposed and implemented, including well-to-seismic fine calibration for reservoirs, karstic paleomorphology analysis, seismic multiple-attribute analysis (Butler et al., 2001; Ismail et al., 2022), post-stack impedance inversion and pre-stack elastic parameters inversion (Mohamed et al., 2016; Wu et al., 2017), seismic forward modeling by wave equation, fracture prediction based on seismic anisotropy analysis, three-dimensional visual carving technology of reservoirs, comprehensive multi information-fusion evaluation for reservoirs, time-frequency attenuation (Dvorkin and Mavko, 2006; Al-Heety and Thabit, 2022), amplitude variation versus offset (AVO) analysis (Ismail et al., 2020b; Gammaldi et al., 2023), and other hydrocarbon detection technologies (Weng, 1987; Wang et al., 2009; Wang et al., 2013; Yuan et al., 2013; Ismail et al., 2020a; Ismail et al., 2021). In the early stage of production, these techniques are generally used to predict large-scale carbonate karstic reservoirs and good results have been achieved due to the clear and understandable meanings of the geophysical parameters defined in those methods. However, in the middle and late stage of production, since almost all the large-scale karstic reservoirs have been recognized and located, the main exploration targets turn to small-scale reservoirs. Due to the weak response of the seismic characteristics for small-scale reservoirs, the techniques mentioned above do not behave as well as they do for large-scale reservoirs. Simply relying on geophysical techniques cannot define the threshold values of small-scale reservoirs, which restricts the application of advanced seismic methods for recognizing these target areas. In fact, in the buried hill karst area, the cave systems have experienced several stages of sea-level rise and fall. The cave systems are mainly determined by the water tables, and each stage controls a development stage of the corresponding cave (Zhu, 1988; Chen et al., 2011; Cheng et al., 2011; Zhang et al., 2013; He et al., 2016). Without considering the impact of the water table, the mentioned methods are not good at detecting, evaluating, and optimizing small-scale reservoirs and cannot help analyzing the connectivity of caves and delineating the ranges of reservoirs for single wells. Therefore, the risk of connecting new wells to old wells is increasing, and there is an urgent need for a reservoir-prediction method that can show the connection relationship between reservoirs.
With the development of fractured reservoirs in the industry, simply predicting the distribution of such reservoirs no longer meets the requirements of production, and the industry hopes to clarify the connectivity, distribution relationship, and formation mechanism between reservoirs and faults. Lu. (2009) and Xiao et al. (2021) quantitatively investigated the occurrence characteristics of formation water in fracture–cavity reservoirs by CT scan, gas-drive-water experiment, and the gray image analysis method, and then figured out the distribution of fracture–cavity reservoirs. Considering the natural fracture strike angle, the confining stress, internal fluid pressure of cavities, and fluid injection pressure are investigated by the TOUGH-AiFrac simulator, which helps predict oil-filled cavities and shows the connectivity between wellbores and reservoirs (Liu et al., 2020 ; Qiao et al., 2022). Under the construction of the knowledge base of carbonate reservoirs using the natural language processing (NLP) technology, the link between the fracture–cavity reservoirs and geological models can be established, the information of field investigation can be integrated into numerical models (El Dally et al., 2023), and then the distribution oil-filled cavities can be carried out with the understanding of geological knowledge (Zhiliang et al., 2021).
According to the needs of production, figuring out the formation mechanism between reservoirs and the carbonate stages, in this work, we adopt a method that can identify the stages of karst cavity reservoirs and complete the division of cave layers, which innovates in adopting the identification technique for development stages, proposing the seismic layered interpretation method for realizing the fine prediction and connectivity analysis of karst cave reservoirs according to the principles for the development of cave layers, and meets the needs for eventually production. The dense carbonate strata in karst areas have normally experienced several up-and-down cycles of sea levels, forming many stable water tables, and karstic reservoirs developed along these surfaces in the relatively stable period of sea levels during the process of the intermittent rise of sea levels (Figure 1). In other words, karstic reservoirs are mainly determined by water tables and each surface corresponds to one stage of the development of karsts, namely, the karstification. In the karst areas, when the erosion of rivers reaches the depth below water tables, the surface rivers become the main channel for the flows of karstic water and determine their state of flowing, which forms a circulation system of the karst water. Therefore, water tables are actually the karst datum levels.
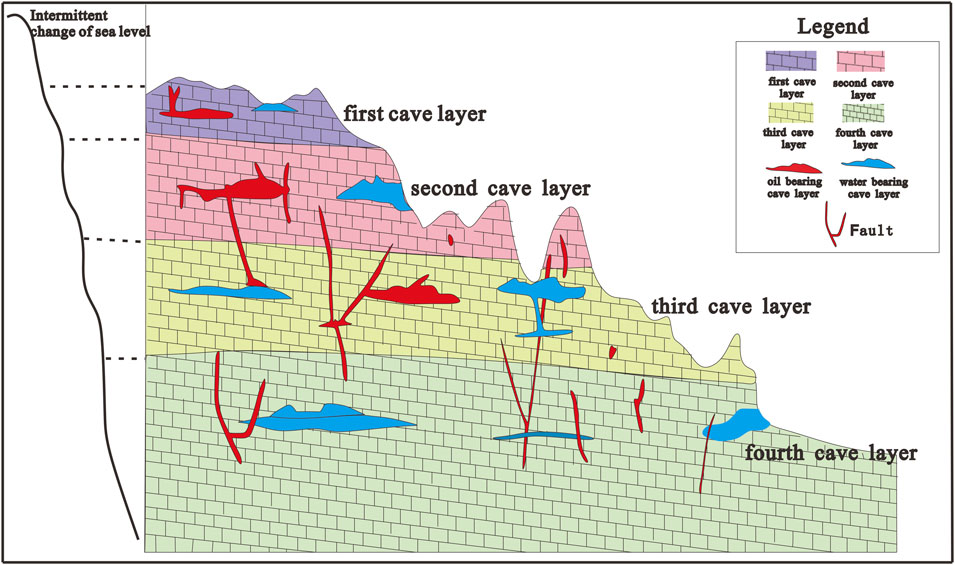
FIGURE 1. LGX oilfield location.
At the end of the Early Carboniferous, with the expansion of Tarim Basin, the carbonate landmass and inner paleo-karst caves were buried gradually. After the Carboniferous, with the continuous subsidence of the basin, these caves have been preserved to this day. Although the large-scale caves developed near the same stable water tables at the same period, they are not connected necessarily and can be horizontally compared based on the rule that the caves distributed on the same water tables are the caves of the same development stages (Fang et al., 2013; Luo et al., 2016).
The overlying stratum of Ordovician carbonatite in Lungu oilfield (Figure 2), Tarim Basin, are Carboniferous clasolite and their interfaces show strong seismic reflection, which may cover the weak reflection from karstic reservoirs developed near unconformities. Therefore, it is necessary to undertake research on these type of reservoirs and their corresponding characteristics in order to reduce this shielding effect and better describe the development stages of karstic reservoirs.
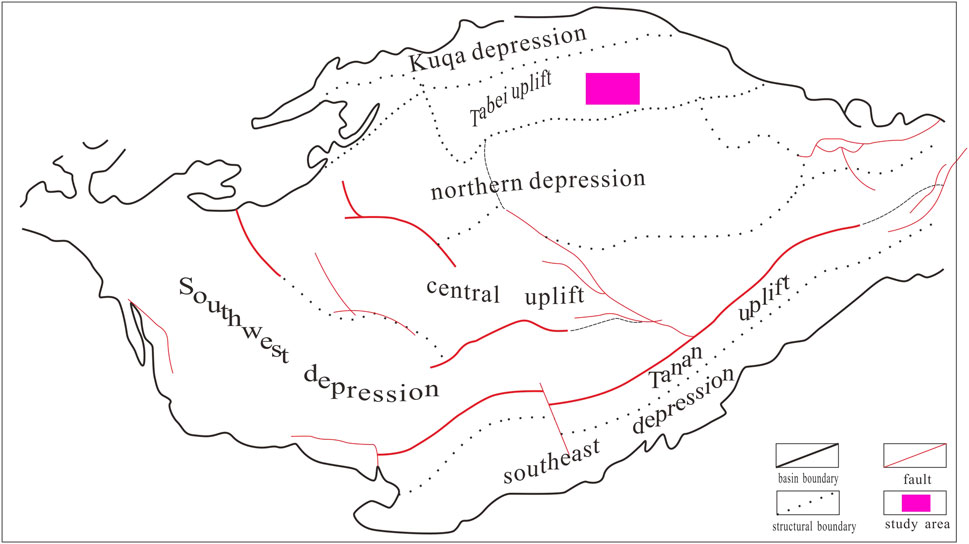
FIGURE 2. The pattern of the development of karstic layers by sea level changes.
Normally, one seismic reflection event on sections does not just represent an interface, but is generated by the superposition of the refection waves from a group of close interfaces. In other words, a seismic event does not strictly correspond to a stratigraphic interface. In a group of close interfaces, there is often a main interface whose impedance contrast compared with other interfaces is largest and thus generates the strongest reflection wave (Zhang et al., 2012). Thus, the waveform and energy of the reflection wave are mainly determined by the interface with the largest impedance contrast. If thin layers surrounding the main interface show small impedance contrast with wall rocks and generate weak reflection waves compared with that of the main interface, the weak reflection can be covered as a result of the superposition of reflection waves. Under these circumstances, seismic attributes computed from sections mainly stress the straits of the main interface while omitting the information from other formations, which makes it difficult to identify the thin layers.
In order to address the above problem, we applied the multi-wavelet decomposition technique for processing seismic sections. This method can highlight the weak seismic characteristics and reduce the shielding effect by decomposing a seismic trace, in the time domain, into several wavelets with different frequencies and removing the information of the dominant frequency. The main steps are as follows: first, for post-stack data, the seismic wave of a target time interval in the seismic traces is decomposed into multiple Ricker wavelets with different dominant frequencies and energy; second, based on these wavelets, distributing coefficients to wavelets respectively and stacking them together can produce a new seismic signal, and adjusting the values of coefficients can help obtain the signal with the minimum difference compared with the original signal. In the end, removing the information of the dominant-frequency wavelets from the original signal and residual information can be used to represent the reflectivity of our target area, namely, thin layers.
The seismic signal for a given time interval can be defined as follows:
where
where
where
where
We use the case of the Lungu oilfield, Tarim Basin, to demonstrate the effect of our method. For this study area, karstic reservoirs are developed along the unconformity at the top of limestone stratum in the Ordovician Lianglitage formation, whose overlying stratum is mudstone and called the Sangtamu formation and underlying stratum is limestone and called the Yingshan formation. In order to verify the effectiveness of multi-wavelet decomposition, the models are designed according to the stratigraphic characteristics of the study area (Figure 3), and the corresponding parameters are shown in Table 1.
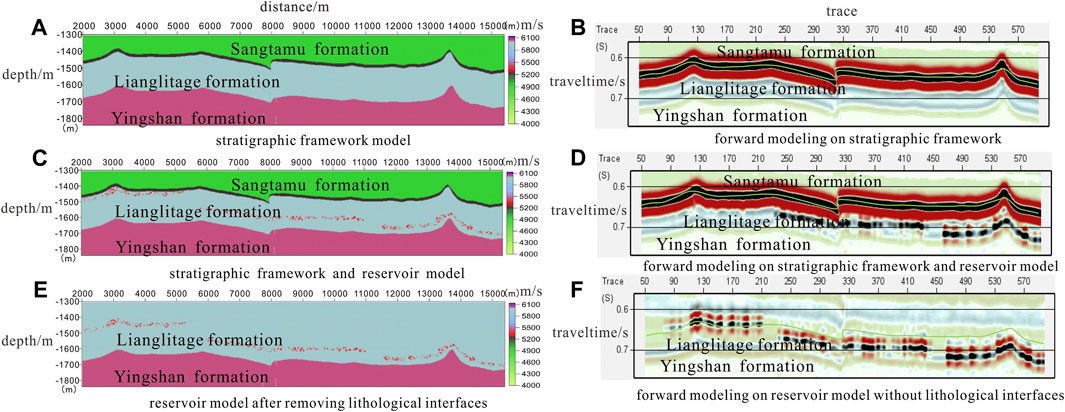
FIGURE 3. Three types of medium regarding weak-response reservoirs and their corresponding forward modeling. (A) stratigraphic framework model, (B) forward modeling on the stratigraphic framework model, (C) stratigraphic framework and reservoir model, (D) forward modeling on the stratigraphic framework and reservoir model, (E) reservoir model after removing lithological interfaces and (F) forward modeling on the reservoir model after removing lithological interfaces.
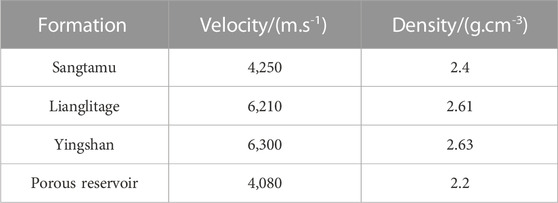
TABLE 1. The parameters of the model for Lungu, Tarim Basin.
There are three types of models listed here to describe real subsurface media. Model 1 (Figure 3A) shows the stratigraphic sequence of the medium, including the Sangtamu, Lianglitage, and Yingshan formations. The reservoir of Lianglitage is characterized by strong reflection due to the existence of the karstic upper formation (Figure 3B). Model 2 (Figure 3C) is a stratigraphic framework of the karstic reservoir model, and its seismic response (Figure 3D) presents the feature that the seismic reflection of the reservoirs close to the karstic interface are weak while those far away from the karstic interface are strong. Model 3 (Figure 3E) removes the karstic interface and only retains the porous reservoir and the underlying Yingshan formation. The reflection features are that both the reservoirs close to and far from the karst interface show the characteristics of ‘one peak and two valleys’ clearly (Figure 3F).
By applying the multi-wavelet decomposition (Alyasseri et al., 2019) to the seismic data derived from the forward modeling on the media mentioned above, the first, second, third, and fourth components as well as the following components can be obtained (Figures 4A–F). Figures 4A,B show that the characteristics of the first component are consistent with seismic responses of stratigraphic sequences for the corresponding model, and Figures 4G,H demonstrate that the superposition of the residual components (expect the first component) is similar to the seismic sections removing the response of the framework of sequences. Therefore, from above cases, it can be recognized that the waveforms of strong reflections are relatively consistent for the whole media, while the reflections of reservoirs and other strata are often stacked with strong reflections and covered due to their weak response and small distribution (Figure 5). In can be concluded that the section for the first component will coincide with the strong reflection from the framework. After removing the first component, the reservoir information covered by the strong reflection can be presented clearly (Li et al., 2015; Luo et al., 2016).
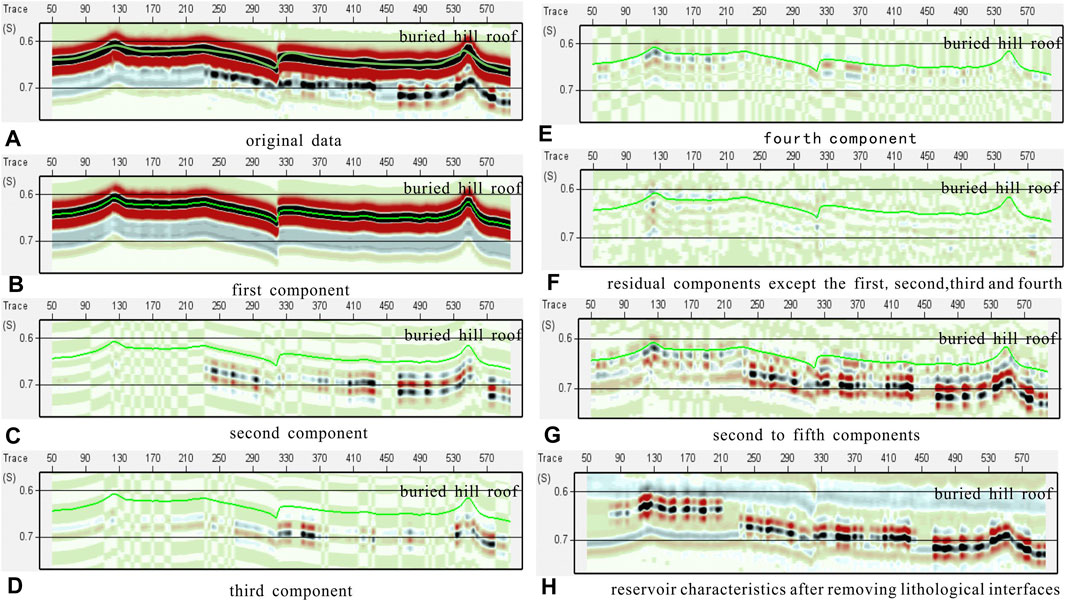
FIGURE 4. The components obtained from the LGX model using the wavelet decomposition method. (A) original data, (B) first component, (C) second component, (D) third component, (E) fourth component, (F) residual component except the first, second, third and fourth components, (G) second to fifth components and (H) reservoir characteristics after removing lithological interfaces.
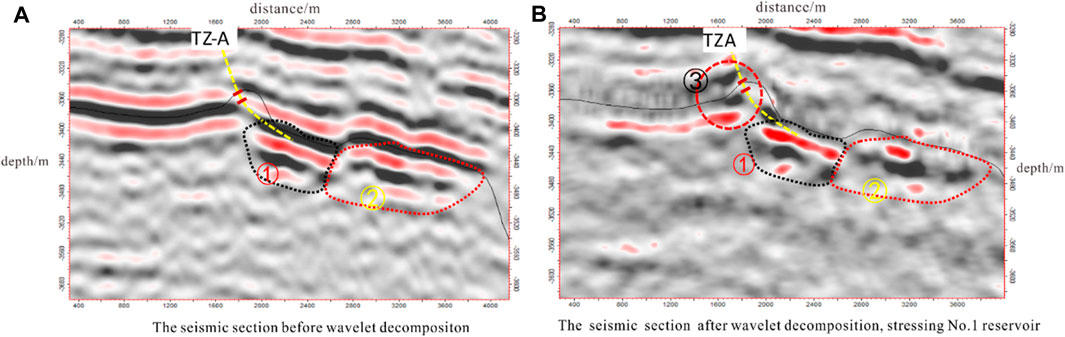
FIGURE 5. The comparison of sections of (A) pre- and (B) post-processing by wavelet decomposition for the buried hills karstic reservoirs in the TZ62 well, Tarim Basin.
A typical karstic carbonate area has developed in the Ordovician formations in the LGX area. Karstic paleogeomorphology directly determines the degree, mode, and features of karstification. Therefore, it is necessary to complete the restoration of the landform and karstic formations. The restoration of ancient water tables is a significant aspect of paleogeomorphology reconstruction and analysis. It holds significance in the search for high-quality reservoirs of marine carbonate rocks, as well as in identifying cyclic patterns. This is because marine carbonate rocks typically form on continental shelves and are influenced by sea-level fluctuations. Despite the fact that basin subsidence is controlled by sediment load, thermodynamics, and sea-level changes, the water table plays a pivotal role in locating carbonate rocks formed during relatively stable periods (Charmoille et al., 2009; Petitta et al., 2018). On the basis of the geology theory of karst and seismic information, different stages of karstic reservoirs can be divided and the corresponding distribution can be determined. The way to identify the stages of karstic reservoirs mainly includes the following two methods, namely, logging identification based on karstic paleogeomorphology restoration and layered seismic interpretation for karstic reservoirs.
In the process of interpretation for reservoirs in karstic carbonate areas, using geological theory regarding karsts to restore ancient landforms or paleogeomorphology can better guide the analysis of cave connectivity (Gu, 1999; Lu, 2009; Qing et al., 2014). For choosing methods to restore paleogeomorphology, it is necessary to consider whether there are regional stable sedimentary markers or key beds in the study area and their difficulty in comparison and tracking. A set of limestone strata developed in the Carboniferous System of this area, which can be regarded as a key bed since its reflection response is characterized by ‘two strong events of crest’. Therefore, this key bed is called “bi-crest limestone".
In order to reduce the difficulty of comparison and tracking, the ancient landform or paleomorphology is restored by the impression method, that is, by subtracting the “bimodal limestone” surface from the top surface of the Ordovician, a more accurate ancient landform map can be obtained. Figure 6 shows that the paleomorphology for the LGX area can be divided into three types, namely, karst highland, karst slope, and karst depression. Based on the restoration of the ancient landforms, key beds can are mainly identified from three following aspects: 1) logging marks, including venting, a large number of lost circulation, kick, blowout, decline during drilling, and a large number of calcite cuttings, in which venting is the direct sign of drilling into caves; 2) core marks, including terrigenous clastic sediments and their oblique bedding, horizontal bedding, and other underground river sedimentary structures, karst breccia, megacrystalline calcite crystallized under oxidation conditions, stalactite fragments, and extension and filling deposits of coastal sand bodies, etc.; and 3) seismic logging marks. The electrical logging curve of the karstic layer is characterized by ‘two highs and two lows’, namely, low resistance, low density, high acoustic time difference, and high natural gamma.
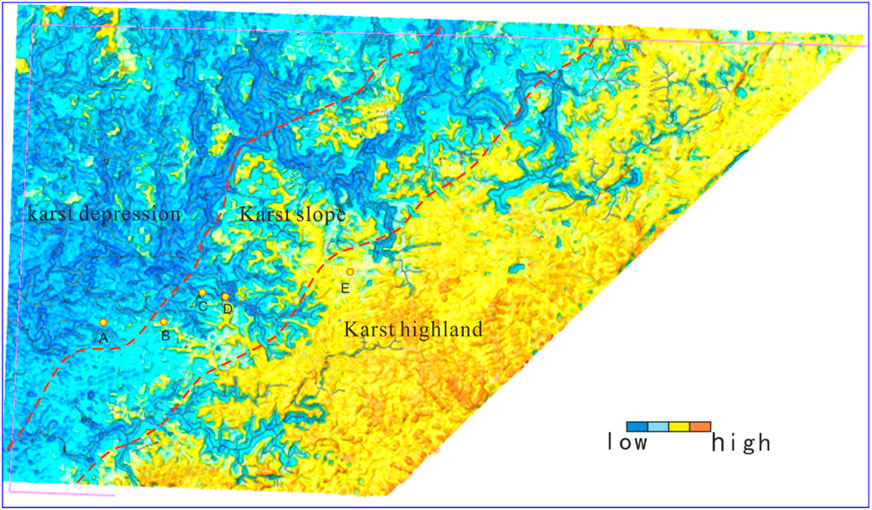
FIGURE 6. The Ordovician karst geomorphological map in LGX.
From the characteristic identification of karstic reservoirs of 46 wells in the study area, it can be obviously seen that the vertical distribution of reservoirs has four crests (Figure 7), representing the peak stages for the development of four karst reservoirs. These four crests are actually the positions where four stages of underflow planes developed. Several key well locations (wells A, B, C, D, and E in Figure 3) were selected according to the locations of paleogeomorphology from top to bottom to compare the well ties for the stages of karstic reservoirs. The steps for well-seismic calibration are as follows:
1) Load data for the required wells in the work area, including well coordinates, logging curves, and stratigraphic data.
2) Utilize the sensitivity of resistivity logging to fluids, namely, the oil and gas in reservoir rocks, using the characteristic of low resistivity values as the primary basis for distinguishing small-scale karst geological bodies from the surrounding rocks.
3) Connect the tops and bottoms of the delineated geological bodies in the cross-well profile to form isochronous interfaces.
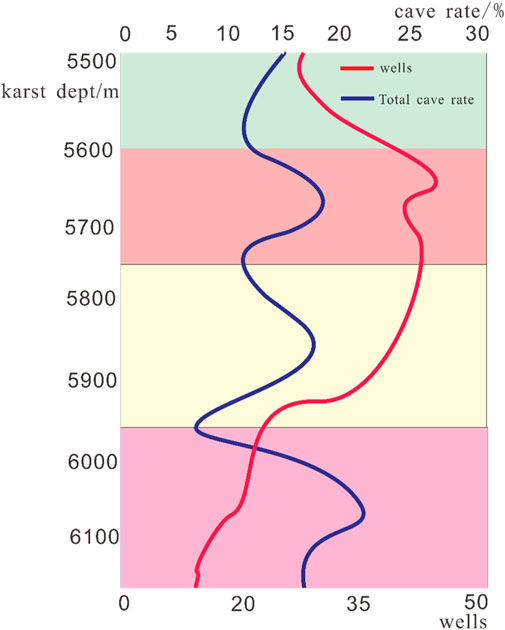
FIGURE 7. The vertical distribution of the karstic caves.
Then, the cave layers on the well ties can be delineated, the isochronous interfaces for the markers of “bimodal limestone” are flattened, the karstic reservoirs are compared and analyzed horizontally, and the multiple sets of reservoirs on a single well are delineated one by one from top to bottom (Figure 8). The well ties are characterized by an obvious layered distribution. On the vertical section of near East–West, the cave layers are roughly distributed on four different formations with gradually decreasing paleo-elevation from east to west. According to the above layered distribution characteristics of cave layers, four paleo-stable water tables can be fitted, so it is inferred that at least four stages of karst cave layers and corresponding four karst cycles are developed in the LGX area. On the drilling sections, most cave-drilling wells found two or three cave layers, and a few drilling wells encountered four cave layers, such as well E.
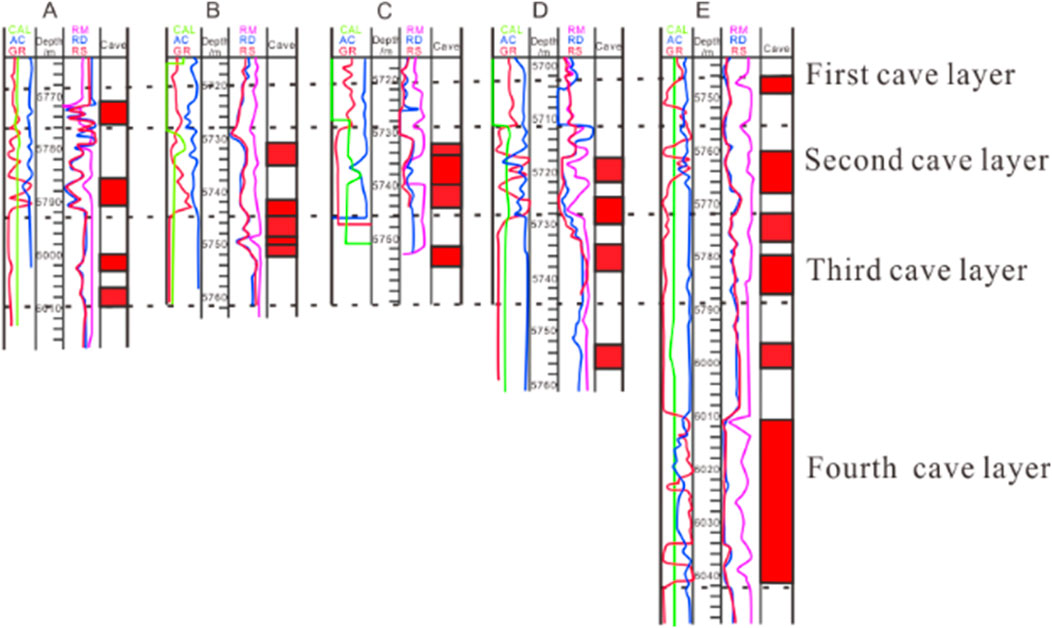
FIGURE 8. The well tie for dividing the cave layers of the Ordovician Yingshan formation in LGX.
On the basis of flattening the well ties with the restraint of paleogeomorphology, seismic data can be calibrated, the isochronous interfaces of Carboniferous “bimodal limestone” can be determined and, based on the interfaces, the seismic events can be flattened. Then, the cave layers identified on logging can be adjusted to seismic sections to form a seismic-scale cave layer and be interpreted.
The steps of the layered interpretation method are as follows: first, the relationship between the locations where caves developed and the corresponding cave beads in the study area is calibrated in detail, and the seismic attributes are optimized according to the statistical law. The preferred seismic attribute used here is the root mean square (RMS) amplitude. However, other attributes such as instantaneous amplitude or sweetness attributes can also yield good results. The RMS amplitude is the square root of the average of the squared amplitudes of each sample point within a time window. Because amplitudes are squared before averaging, this attribute is highly sensitive to changes in amplitude. When there are bedding features within rock layers, such as in marine carbonate reservoirs, it often leads to variations in reflection amplitudes, and RMS amplitudes within the time window typically exhibit strong features (Stephen and Kazemi, 2014). The seismic attribute can be expressed as:
where
Secondly, all caves in the study area can be three-dimensionally modeled and, considering the actual situations of the study area, the threshold value of RMS attribute can be reasonably adjusted. For this field, the RMS attribute value 2870 has been regarded as the boundary of reservoirs. The area with lower RMS values can be treated as surrounding rocks while higher RMS value areas can denote karstic reservoirs. These values are obtained from the well-tie step; part of wells can be selected and the drilling information such as the positions of vents and lost circulation corresponds to a specific value of the seismic attribute RMS for each well. The average of the recording values of all the wells is the threshold value for distinguishing reservoirs and surrounding rocks. In the last step, the top surfaces of the modeled caves are tracked automatically due to the clear boundary derived from the second step; those with unsatisfactory tracking effects can be modified manually.
We divide the caves according to the karst datum level, that is, selecting a time window both above and below the reference surfaces for discharging, and thus, the caves within the time windows are seen as those developed under the control of the datum level (Figure 9). The length of the time window is determined according to the calibration of single wells and the resolution of seismic data, which generally does not exceed 15–40 m. For the actual process, the determination of the cave locations according to the datum level can be carried out on commercial software, and the algorithm is as follows:
where the abs denotes the absolute-value operator and C is the absolute value of (a-b); if C > s, C is null; if C ≤ s, C is equal to a. For the geological meaning, A is the top layer of the cave, B is the corresponding discharge datum, C is the cave layer under the control of corresponding drainage datum, and S is the window length, generally no more than 40 m.
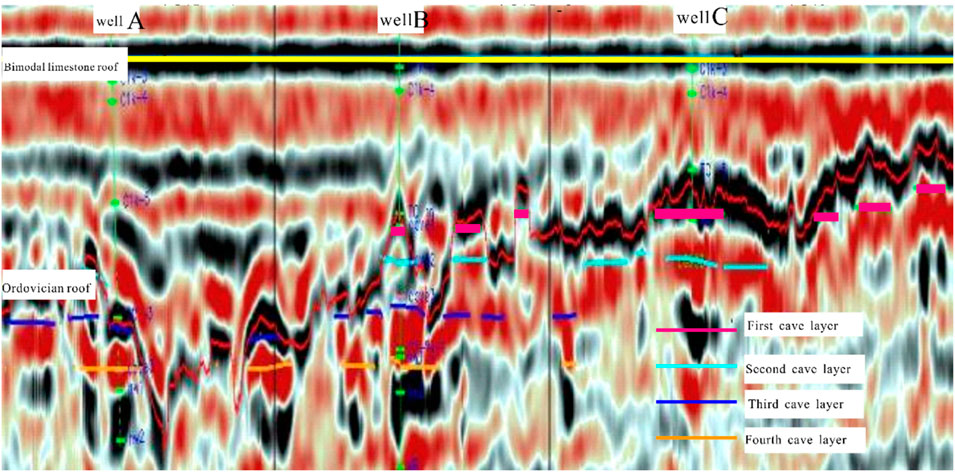
FIGURE 9. The interpretation of seismic sections for cave layers of the Ordovician Yingshan formation in LGX.
Through the application of the above techniques in the Ordovician of the LGX area, Tarim Basin, a total of 485 karstic caves were delineated and interpreted. The first cave layer (Figure 10A) is mainly distributed in the paleomorphology karstic highland. Because it is located in the upstream of the water system, the hydrodynamic force is weak and the caves are relatively isolated, mostly sporadic, and the reservoirs are relatively undeveloped. The second cave layer (Figure 10B) is mainly distributed in the paleomorphology karst slope area with good connectivity where high-efficiency wells are mainly distributed. The third cave layer (Figure 10C) and the fourth cave layer (Figure 10D) are mainly distributed in paleomorphology karst depressions where caves are developed but there are few high-efficiency wells due to the low structural position (He et al., 2007; Chen et al., 2011; Dai et al., 2011; Shang et al., 2011).
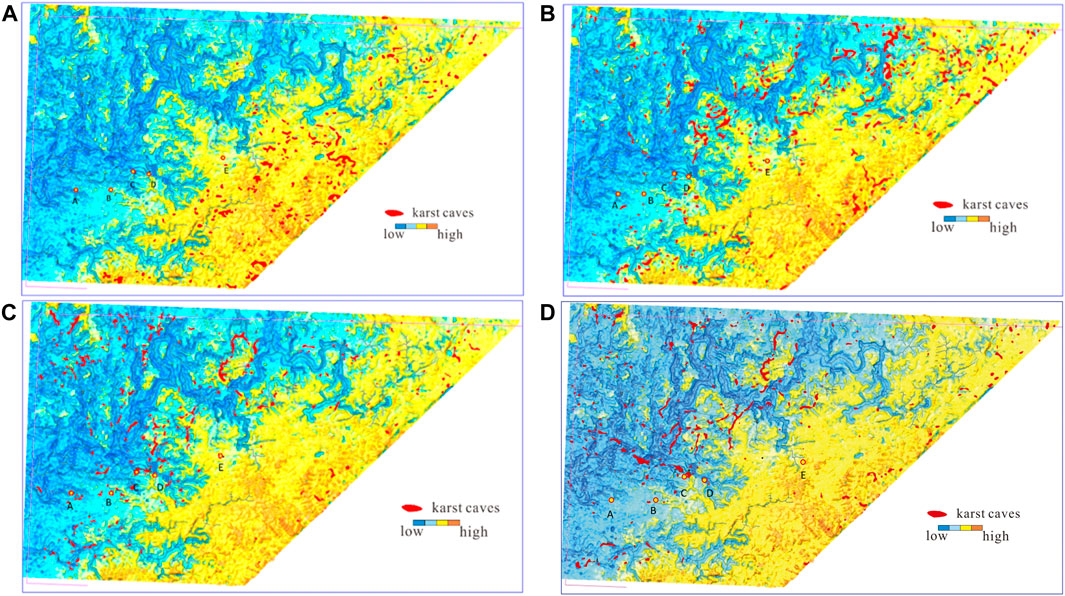
FIGURE 10. The paleomorphology for different karstic cave layers: (A) first layer, (B) second layer, (C) third layer and (D) fourth layer.
Through the analysis and comparison of cave layers, it can be seen that the wells distributed in the same cave layer are more likely to be connected. For example, wells LGXA-1 and LGXB-2 in the second cave layer have been proven to have connectivity in production. According to the connection characteristics of the same cave layer, the fracture cave system can be interpreted and divided (Yan et al., 2002; Li et al., 2015; He, et al., 2016; Li et al., 2016; Long et al., 2016; Luo et al., 2016). Combined with the distribution of the characteristics of residual hills, 22 fracture-cavity systems have been proposed and delineated for the Ordovician system of the LGX area. With the depiction of karstic reservoir rocks, the target wells in the next development can be selected in the area with high-connectivity value from time and depth slices instead of directly aiming for the strong bead-like reflections in seismic sections, which has resulted in some low-production wells. The total area of the evaluation is 41.32 km2 and the expected resource is 1,032 × 104t.
Considering the characteristics of geomorphology and the rules of forming reservoirs, the seismic data is flattened and caves for single wells can be delineated and divided. On the basis of paleogeomorphology restoration, the caves are divided according to the karst datum level on the seismic sections, so as to accurately find the distribution law of high-efficiency wells and improve the success of well location deployment. This contributes to the evaluation of inter-well connectivity, and is suitable for the middle and later development of carbonate oil fields with complex landforms and multiple tectonic movements. The staged interpretation technology of karstic reservoirs of weathered crustshows the combination of geological and seismic information.
Compared with previous works regarding the identification of the carbonate reservoirs, such as building numerical models to integrate geological information and then inverting the cavities, and directly delineating the karstic cavities using seismic attributes like instantaneous amplitude computed from Hilbert transformation under the knowledge of the reflection contrast between the bead-like reservoirs and surrounding rocks, our work innovatively takes the water table into account in depicting the bead-like carbonate reservoirs. Considering the impact of water tables, which play the decisive role in the formation of karstic reservoirs, the constraint conditions are formed and integrated into the subsequent inversion of oil-filled reservoirs by clearly delineating the development stages of them. In other words, the variations of water tables identified in our work can be regarded as the boundary conditions, an essential part in inversion, based on the understanding that karstic reservoirs mainly developed along these water table surfaces. With the identification of the development stages of karstic reservoirs, the restrictions are applied to the inversion process and then more precise results can be carried out. Regarding the drawbacks of our method, the procedure of the identification of water tables and development stages ranks first. This processing part requires a large amount of well logging data, which are not easily accessible in the early explorations, which means our scheme is more likely to be effective in the production stage of an oil field. Furthermore, a rich work experience in seismic interpretation and knowledge of geology are essential. Despite the disadvantages, our scheme has a successful industrial application, provides a powerful reference for the fine identification and evaluation of such reservoirs in the future, and has good practical value.
The raw data supporting the conclusion of this article will be made available by the authors, without undue reservation.
SC proposed the method of analysing the stages of karstic carbonate reservoirs and MW implmented the method, completed the case study and fullfill the papers. All authors contributed to the article and approved the submitted version.
The authors declare that the research was conducted in the absence of any commercial or financial relationships that could be construed as a potential conflict of interest.
All claims expressed in this article are solely those of the authors and do not necessarily represent those of their affiliated organizations, or those of the publisher, the editors and the reviewers. Any product that may be evaluated in this article, or claim that may be made by its manufacturer, is not guaranteed or endorsed by the publisher.
Al-Heety, A. J., and Thabit, H. A. (2022). Random and coherent noise attenuation for 2D land seismic reflection line acquired in Iraq. NRIAG J. Astronomy Geophys. 11 (1), 337–354. doi:10.1080/20909977.2022.2118982
Alyasseri, Z. A., Khadeer, A. T., Al-Betar, M. A., Abasi, A., Makhadmeh, S., and Ali, N. S. (2019). The effects of EEG feature extraction using multi-wavelet decomposition for mental tasks classification. InProceedings Int. Conf. Inf. Commun. Technol., 139–146. doi:10.1145/3321289.3321327
Butler, J., Morrice, D. J., and Mullarkey, P. W. (2001). A multiple attribute utility theory approach to ranking and selection. Manag. Sci. 47 (6), 800–816. doi:10.1287/mnsc.47.6.800.9812
Charmoille, A., Binet, S., Bertrand, C., Guglielmi, Y., and Mudry, J. (2009). Hydraulic interactions between fractures and bedding planes in a carbonate aquifer studied by means of experimentally induced water-table fluctuations (Coaraze experimental site, southeastern France). Hydrogeology J. 17 (7), 1607–1616. doi:10.1007/s10040-009-0470-y
Chen, L., Pan, W., Liang, B., Luo, R., Zhang, Q., and Gao, X. (2011). The distribution characteristics of the epikarst reservoir in Lunnan Ordovician buried hill. Carsologica Sinca 30 (3), 327–333. doi:10.3969/j.issn.1001-4810.2011.03.015
Cheng, J., Guo, Bo, Zheng, J., Liu, Z., and Fan, G. (2011). Application of multi-wavelet decomposition to reservoir prediction in the north of South-Bel Depression. OGP 46 (1), 76–79. doi:10.1093/plankt/fbg109
Dai, S., Chen, Z., Yu, J., Xie, J., Mao, F., Tianchang, W., et al. (2011). Application of multi-wavelet decomposition and reconstruction technique in reservoir characterization in TKT-NGS Oilfield, Algeria. OGP 46 (1), 103–109. doi:10.1007/s12583-011-0163-z
Du, J., Xinyuan, Z. H., Qiming, L. I., Guanghui, W., Wenqing, P., and Tao, Y. (2011). Characteristics and controlling factors of the large carbonate petroleum province in the Tarim Basin, NW China. Petroleum Explor. Dev. 38 (6), 652–661. doi:10.1016/s1876-3804(12)60002-0
Dvorkin, J. P., and Mavko, G. (2006). Modeling attenuation in reservoir and nonreservoir rock. Lead. Edge 25 (2), 194–197. doi:10.1190/1.2172312
El Dally, N. H., Metwalli, F. I., and Ismail, A. (2023). Seismic modelling of the upper cretaceous, khalda oil field, shushan basin, western desert, Egypt. Model. Earth Syst. Environ. 9, 4117–4134. doi:10.1007/s40808-022-01497-1
Fang, J., Wu, X., and Wang, J. (2013). Accumulation conditions and reservoiring factors of deep buried hills of Lower Paleozoic in Huanghua Depression. China Pet. Explor. 18 (4), 11–18. doi:10.3969/j.issn.1672-7703.2013.04.002
Gammaldi, S., Ismail, A., and Zollo, A. (2022). Fluid accumulation zone by seismic attributes and amplitude versus offset analysis at Solfatara Volcano, Campi Flegrei, Italy. Front. Earth Sci. 10, 866534. doi:10.3389/feart.2022.866534
Gu, J. (1999). Characteristics and evolutional model of karst reservoirs of Lower ordovician carbonate rocks in Lunnan area of Tarim Basin. J. Palaeo Geogr. 1 (1), 54–60. doi:10.3969/j.issn.1671-1505.1999.01.006
He, J., Han, J., and Pan, W. (2007). Hydro carbon accumulation mechanism in the giant buried hill of Ordovician in Lun nan paleo high of Tarim Basin. Acta Pet. Sin. 28 (2), 44–48. doi:10.1016/S1872-5813(07)60034-6
He, Z., Jin, X., Yujin, Wo, Li, H., Bai, Z., and Jiao, C. (2016). Hydrocarbon accumulation characteristics and exploration domains of ultra-deep marine carbonates in China. China Pet. Explor. 21 (1), 3–14. doi:10.3969/j.issn.1672-7703.2016.01.001
Ismail, A., Ewida, H. F., Al-Ibiary, M. G., Nazeri, S., Salama, N. S., Gammaldi, S., et al. (2021). The detection of deep seafloor pockmarks, gas chimneys, and associated features with seafloor seeps using seismic attributes in the West offshore Nile Delta, Egypt. Explor. Geophys. 52 (4), 388–408. doi:10.1080/08123985.2020.1827229
Ismail, A., Ewida, H. F., Al-Ibiary, M. G., and Zollo, A. (2020a). Application of AVO attributes for gas channels identification, West offshore Nile Delta, Egypt. Petroleum Res. 5 (2), 112–123. doi:10.1016/j.ptlrs.2020.01.003
Ismail, A., Ewida, H. F., Nazeri, S., Al-Ibiary, M. G., and Zollo, A. (2022). Gas channels and chimneys prediction using artificial neural networks and multi-seismic attributes, offshore West Nile Delta, Egypt. J. Petroleum Sci. Eng. 208, 109349. doi:10.1016/j.petrol.2021.109349
Ismail, A., Gammaldi, S., Chiuso, T., and Zollo, A. (2020b). Seismic imaging of the Solfatara crater (Campi Flegrei caldera, southern Italy): new evidence of the fluids migration pathways in the shallow structures. J. Volcanol. Geotherm. Res. 404, 107005. doi:10.1016/j.jvolgeores.2020.107005
Li, G., Yuan, J., Luo, H., Yang, P., and Yang, Li (2015). Quantitative description technology for fracture-cavity carbonate reservoirs in Halahatang area. Tarim. Basin. China Pet. Explor. 20 (4), 24–29. doi:10.3969/j.issn.1672-7703.2015.04.002
Li, Yi, Liu, Z., and Zou, C. (2016). Joint control over reservoirs by faults and uplifts: formation of large-scale gas reservoirs in marginal reefs of carbonate tableland. China Pet. Explor. 21 (1), 44–52. doi:10.3969/j.issn.1672-7703.2016.01.005
Liu, Y., and Wang, Y. (2017). Seismic characterization of a carbonate reservoir in Tarim Basin. Geophysics 82 (5), B177–B188. doi:10.1190/geo2016-0517.1
Liu, Z., Tang, X., Tao, S., Zhang, G., and Chen, M. (2020). Mechanism of connecting natural caves and wells through hydraulic fracturing in fracture-cavity reservoirs. Rock Mech. Rock Eng. 53, 5511–5530. doi:10.1007/s00603-020-02225-w
Long, Y., Zhang, Y., and Dong, S. (2016). Key issues in application of seismic technology in petroleum exploration, appraisal and development stages. China Pet. Explor. 21 (6), 9–17. doi:10.3969/j.issn.1672-7703.2016.06.002
Lu, H., Zhang, D., and Yang, Y. (2009). Stages of paleokarstic hypergenesis in ordovician reservoir,tahe oilfield. J. Geol. Sci. Technol. Inf. 28 (6), 71–75. doi:10.3969/j.issn.1000-7849.2009.06.011
Luo, X., Zhang, L., Lei, Y., Hu, C., Shi, H., and Cao, B. (2016). Structural heterogeneity of reservoirs and its implication on hydrocarbon accumulation in deep zones. China Pet. Explor. 21 (1), 28–36. doi:10.3969/j.issn.1672-7703.2016.01.003
Ma, Y., Xunyu, C. A., Lu, Y. U., Zongjie, L. I., Huili, L. I., Shang, D. E., et al. (2022). Practice and theoretical and technical progress in exploration and development of Shunbei ultra-deep carbonate oil and gas field, Tarim Basin, NW China. Petroleum Explor. Dev. 49 (1), 1–20. doi:10.1016/s1876-3804(22)60001-6
Mohamed, I. A., El-Mowafy, H. Z., and Fathy, M. (2015). Prediction of elastic properties using seismic prestack inversion and neural network analysis. Interpretation 3 (2), T57–T68. doi:10.1190/int-2014-0139.1
Petitta, M., Mastrorillo, L., Preziosi, E., Banzato, F., Barberio, M. D., Billi, A., et al. (2018). Water-table and discharge changes associated with the 2016–2017 seismic sequence in central Italy: hydrogeological data and a conceptual model for fractured carbonate aquifers. Hydrogeology J. 26, 1009–1026. doi:10.1007/s10040-017-1717-7
Qiao, J., Tang, X., Hu, M., Rutqvist, J., and Liu, Z. (2022). The hydraulic fracturing with multiple influencing factors in carbonate fracture-cavity reservoirs. Comput. Geotechnics 147, 104773. doi:10.1016/j.compgeo.2022.104773
Qing, M., Chang, S., Pei, G., Shuling, Z., Liu, J., and Yuan, Y. (2014). Method for identification of LGX ordovician carbonate karst cave packing feature in Tarim. China Pet. Explor. 19 (1), 31–34. doi:10.3969/j.issn.1672-7703.2014.01.004
Shang, J., Li, G., Lv, Y., Zhang, D., Gu, Y., Chen, L., et al. (2011). Features and genetic analysis of vuggy reservoir in tahe subsalt area. China Pet. Explor. 16 (2), 18–23. doi:10.3969/j.issn.1672-7703.2011.02.004
Stephen, K. D., and Kazemi, A. (2014). Improved normalization of time-lapse seismic data using normalized root mean square repeatability data to improve automatic production and seismic history matching in the Nelson field. Geophys. Prospect. 62 (5), 1009–1027. doi:10.1111/1365-2478.12109
Sun, X., Li, X., Zhang, X., Xu, G., Yu, Y., and Zhang, M. (August 2022). Middle to small-scale fracture detection in fault-controlled Karstic reservoirs. In Proceedings of the second international meeting for applied geoscience and energy (pp. 1237–1241). Houston, Texas, USA
Wang, H., Zhang, H., Sun, D., Gong, H., Wang, Z., and Chuang, Li (2009). Application of integrated seismic geology prediction techniques to weathering crust karst reservoir. Nat. Gas. Geosci. 20 (1), 131–137. doi:10.11764/j.issn.1672-1926.2009.01.131
Wang, Lu, Yang, S., Peng, X., Deng, H., Liao, Y., Liu, Y., et al. (2018). Visual investigation of the occurrence characteristics of multi-type formation water in a fracture–cavity carbonate gas reservoir. Energies 11 (3), 661. doi:10.3390/en11030661
Wang, Ya, Qin, F., Wang, M., Feng, X., Xie, J., Liu, H., et al. (2013). Multiplicity analysis on seismic reflection of strong amplitude and high continuity in huabei oilfield and countermeasures. China pet. Explor. 18 (3), 34–39. doi:10.3969/j.issn.1672-7703.2013.03.005
Weng, J. (1987). Karst and carbonate rocks in Guilin. Chongqing, China: Chongqing Publishing House, 1–180.
Wu, Q., Wang, L., and Zhu, Z. (2017). Research of pre-stack AVO elastic parameter inversion problem based on hybrid genetic algorithm. Clust. Comput. 20, 3173–3183. doi:10.1007/s10586-017-1033-y
Xiao, Y., Yin, F., Zhang, L., Jiang, T., and Luo, S. (2022). Study on the coupling calculation model of dump flooding in Hala-hatang fracture-cavity reservoir. Int. J. Nonlinear Sci. Numer. Simul. 23 (6), 813–822. doi:10.1515/ijnsns-2020-0022
Yan, X., Han, Z., and Li, Y. (2002). Reservoir characteristics and formation mechanism s of the ordovician carbonate pools in the Tahe oil field. Geol. Rev. 48 (6), 626–629. doi:10.1080/12265080208422884
Yuan, S., Tang, C., Ge, D., Cui, H., Li, X., and Lu, Z. (2013). Study of seismic exploration technology for deep buried hills and their inner curtains of Jizhong Depression. China Pet. Explor. 18 (1), 39–43. doi:10.3969/j.issn.1672-7703.2013.01.006
Zhang, L., Fan, Q., Zhu, Y., Zhu, G., Li, G., and Yin, F. (2013). Geological and accumulations characteristics of ordovician oil reservoir in Ha 6 block of Tabei. China Pet. Explor. 18 (2), 7–12. doi:10.3969/j.issn.1672-7703.2013.02.002
Zhang, X., Ming, Li, Chen, Z., Jiang, H., Tang, J., and Liu, Bo (2012). Characteristics and karstification of the ordovician carbonate reservoir, halahatang area, northern Tarim Basin. Acta Petrol. Sin. 28 (3), 815–826. doi:10.1007/s11783-011-0280-z
Zhiliang, H. E., Jianfang, S. U., Gu, P., Hehua, W. E., Xinrui, L. Y., and Kelong, H. A. (2021). Construction of carbonate reservoir knowledge base and its application in fracture-cavity reservoir geological modeling. Petroleum Explor. Dev. 48 (4), 824–834. doi:10.1016/s1876-3804(21)60069-1
Zhu, G., Yang, H., Zhu, Y., Gu, L., Lu, Y., and Jin, Su (2011). Study on petroleum geological characteristics and accumulation of carbonate reservoirs in Halahatang area, Tarim Basin. Acta Petrol. Sin. 27 (3), 827–844. doi:10.1007/s12182-011-0118-0
Keywords: ancient karst, water table, karstic stages, weak reflection, seismic Interpretation
Citation: Chang S and Wang M (2023) The identification of the development stages of the karstic fracture–cavity carbonate reservoirs: a case study on the lungu oilfield, Tarim basin. Front. Earth Sci. 11:1238759. doi: 10.3389/feart.2023.1238759
Received: 12 June 2023; Accepted: 25 September 2023;
Published: 23 October 2023.
Edited by:
Amer A. Shehata, Texas A&M University Corpus Christi, United StatesReviewed by:
Amir Ismail, Helwan University, EgyptCopyright © 2023 Chang and Wang. This is an open-access article distributed under the terms of the Creative Commons Attribution License (CC BY). The use, distribution or reproduction in other forums is permitted, provided the original author(s) and the copyright owner(s) are credited and that the original publication in this journal is cited, in accordance with accepted academic practice. No use, distribution or reproduction is permitted which does not comply with these terms.
*Correspondence: Mengxiu Wang, d2FuZ21lbmd4aXUwODE2QG91dGxvb2suY29t
Disclaimer: All claims expressed in this article are solely those of the authors and do not necessarily represent those of their affiliated organizations, or those of the publisher, the editors and the reviewers. Any product that may be evaluated in this article or claim that may be made by its manufacturer is not guaranteed or endorsed by the publisher.
Research integrity at Frontiers
Learn more about the work of our research integrity team to safeguard the quality of each article we publish.